Article

Lead-Free BNT–BT0.08/CoFe2O4 Core–Shell Nanostructures with Potential Multifunctional Applications

1
National Institute of Materials Physics, Atomistilor 405A, 077125 Magurele, Romania
2
Instituto de Ciencia de Materiales de Madrid, CSIC, Cantoblanco, 28049 Madrid, Spain
3
Department of Science and Engineering of Oxide Materials and Nanomaterials, Faculty of Applied Chemistry and Materials Science, University Politehnica of Bucharest, 060042 Bucharest, Romania
4
Research Laboratory of Environmental Science and Technologies, Carthage University, BP.1003, Hammam-Lif, Ben Arous 2050, Tunisia
5
Faculty of Mathematical, Physical and Natural Sciences of Tunis, University of Tunis Elmanar, Belvedere, Tunis 1002, Tunisia
6
National Research Council of Italy–Institute of Science and Technology for Ceramics (CNR–ISTEC), Via Granarolo 64, I–48018 Faenza, Italy
*
Author to whom correspondence should be addressed.
Nanomaterials 2020, 10(4), 672; https://doi.org/10.3390/nano10040672
Submission received: 19 February 2020 / Revised: 24 March 2020 / Accepted: 26 March 2020 / Published: 3 April 2020

Abstract

:
Herein we report on novel multiferroic core–shell nanostructures of cobalt ferrite (CoFe2O4)–bismuth, sodium titanate doped with barium titanate (BNT–BT0.08), prepared by a two–step wet chemical procedure, using the sol–gel technique. The fraction of CoFe2O4 was varied from 1:0.5 to 1:1.5 = BNT–BT0.08/CoFe2O4 (molar ratio). X–ray diffraction confirmed the presence of both the spinel CoFe2O4 and the perovskite Bi0.5Na0.5TiO3 phases. Scanning electron microscopy analysis indicated that the diameter of the core–shell nanoparticles was between 15 and 40 nm. Transmission electron microscopy data showed two–phase composite nanostructures consisting of a BNT–BT0.08 core surrounded by a CoFe2O4 shell with an average thickness of 4–7 nm. Cole-Cole plots reveal the presence of grains and grain boundary effects in the BNT–BT0.08/CoFe2O4 composite. Moreover, the values of the dc conductivity were found to increase with the amount of CoFe2O4 semiconductive phase. Both X-ray photoelectron spectroscopy (XPS) and Mössbauer measurements have shown no change in the valence of the Fe3+, Co2+, Bi3+ and Ti4+ cations. This study provides a detailed insight into the magnetoelectric coupling of the multiferroic BNT–BT0.08/CoFe2O4 core–shell composite potentially suitable for magnetoelectric applications.

Graphical Abstract

1. Introduction

Multifunctional materials combine materials with different physical properties inti one single structure in order to improve their final functionality [1,2,3]. In particular, multifunctional materials combining both electric and magnetic properties produce a single device component that performs more than one task. These materials show a magnetoelectric effect, namely, the induction of polarization by means of a magnetic field and the induction of magnetization by means of an electric field. In the magnetostrictive–piezoelectric composites, a magnetostrictive phase is mechanically coupled to a piezoelectric phase by an elastic interaction between the two phases. The magnetoelectric (ME) materials can be used for magnetic sensors, microelectromechanical systems (MEMS), and energy harvesters [4,5,6]. Core-shell grain structure is one of the possible ways to combine two properties into one nanostructure and thus achieve advanced performance and multifunctionality due to the availability of a large interfacial area for possible coupling between ferromagnetic and ferroelectric properties [7,8]. Oliveira, P.N. et al. [8], showed that CoFe2O4:BaTiO3 core-shell composite nanoparticles are suitable for biological and biomedical applications. In this paper, we report on the multiferroic core-shell nanostructures of (Bi0.5Na0.5)0.92Ba0.08TiO3 abbreviated as BNT–BT0.08 and CoFe2O4 for multi-functional devices. BNT–BT0.08 and CoFe2O4 species can form composites that should combine their piezoelectric and magnetic properties and lead to performance surpassing their individual components. These nanocomposites, with a lead-free piezoelectric BNT–BT0.08–core and ferrite CoFe2O4–shell, have not been well studied to date [9]. We focused on CoFe2O4/BNT–BT0.08 composites with core–shell architectures and various molar ratios since there is only one previously published report on 0.65BaTiO3–0.35Bi0.5Na0.5TiO3/CoFe2O4 composites with 0–3 connectivity [10]. There are also few reports on hybrid piezoelectric/ferromagnetic structures, such as: CoFe2O4/BaTiO3 [8,11,12,13,14,15,16], Pb(Zr0.52Ti0.48)O3/NiFe2O4 [12] and NiFe2O4/BaTiO3 [17] core–shell composites in which the authors studied the influence of the variation of the ferrite fraction on the magnetic properties of the multiferroic core–shell–type nanostructures.
The aim of this work is to prepare and investigate the influence of CoFe2O4 concentration on the dielectric, piezoelectric, magnetic and magnetoelectric properties of the nanoparticles in a core-shell piezoelectric–magnetic multiferroic structure, with the molar ratio BNT–BT0.08/CoFe2O4= 1:0.5, 1:1 and 1:1.5.

2. Experimental Section

2.1. Materials and Methods

In order to fabricate BNT–BT0.08/CoFe2O4 core–shell materials, in the first step, (Bi0.5Na0.5)0.92Ba0.08TiO3, abbreviated as BNT–BT0.08, powder was prepared by a simple sol-gel method. Bismuth (III) acetate ((CH3COO)3Bi, 99.99%), sodium acetate (CH3COONa, 99.995%), barium acetate ((CH3COO)2Ba, 99%), titanium (IV) isopropoxide (Ti[OCH(CH3)2]4) in isopropanol, acetic acid, acetylacetone and formamide were used as starting materials. All reagents were provided by Sigma–Aldrich, St. Louis, MO, USA. The acetate salts were separately dissolved in acetic acid, at 100 °C (sodium and barium acetates) and 200 °C (bismuth acetate). BaTiO3 precursor sol was prepared by adding the acetic solution of Ba2+ to the titanium (IV) isopropoxide in isopropanol; the as–obtained sol was stabilized with acetylacetone. The solution of Bi3+ was added to the acetic Na+ solution and a clear mixture was obtained. The amount of titanium (IV) isopropoxide in isopropanol required to obtain Bi0.5Na0.5TiO3, was mixed with acetylacetone and then added to the solution of Bi3+ and Na+. This solution was added to the BaTiO3 precursor sol and the BNT–BT0.08 precursor sol was obtained. This last sol was homogenized by magnetic stirring at 75 °C for 3h and transformed into gel at 90 °C. The dried gel was calcined at 700 °C for 3 h and the BNT–BT0.08 powder was obtained. The CoFe2O4 sol precursor was prepared by a sol–gel–combustion route, from cobalt(II) acetate tetrahydrate (Co(CH3CO2)2·4H2O, 99.995%, Sigma–Aldrich), iron(III) nitrate nonahydrate (Fe(NO3)3·9H2O, 99.99%, Sigma–Aldrich), citric acid (C6H8O7, 99%), ethanol, acetic acid and distilled water. Ethanol, acetic acid and distilled water were used as solvents. Citric acid was used as the chelating agent and fuel. Practically, iron(III) nitrate acts as an oxidizing agent and citric acid acts as a reducing agent with an exothermic reaction. The maximum heat was released when the oxidizer to organic fuel molar ratio (in this case citrate/nitrate ratio, CA/NO3–) became equal to unity [18]. When excessive HNO3 was added, the combustion became more violent due to the displacement of the chemical balance in the sense of the oxidant (NO3–) which is in excess [19]. The auto–combustion of citrate–nitrate gel method has been patented by Chakrabarti et al. [20], in order to synthesize multicomponent oxides. This method was based on gelling of a nitrate solution of the desired metals together with some organic fuel (glycine, citric acid, sucrose, urea, or other water soluble carbohydrates) followed by combustion due to the exothermal redox reaction between nitrate ions and the fuel. This process has the advantage of rapidly producing fine and homogeneous powder. To prepare CoFe2O4 precursor sol, we used the following strategy: the iron nitrate and citric acid were dissolved in ethanol separately, at room temperature. The cobalt acetate was dissolved in ethanol, acetic acid and water. A solution of iron nitrate was added to cobalt acetate solution, and then the citric acid solution was added to the mixture solutions of Fe and Co, to form the cobalt ferrite precursor sol. The citrate/nitrate molar ratio, CA/NO3- was 1:1. The as-obtained sol was used to prepare BNT–BT0.08/CoFe2O4 core–shell composites with various molar ratios BNT–BT0.08/CoFe2O4 = 1:0.5 (sample S1; 35.71 wt% CoFe2O4 and 64.49% BNT–BT0.08), 1:1 (sample S2; 52.41 wt% CoFe2O4 and 47.59% BNT–BT0.08), and 1:1.5 (sample S3; 68.77 wt% CoFe2O4 and 31.23% BNT–BT0.08). For this purpose, the BNT–BT0.08 powder was added to the precursor sol of the CoFe2O4 and kept in suspension by continuous stirring at 80 °C until the BNT–BT0.08/CoFe2O4 core–shell powders were formed. The as–obtained powders were calcined at 700 °C for 1 h in air. The pellets of BNT–BT0.08/CoFe2O4 obtained by uniaxial pressing were sintered at 1100 °C for 15 min in air.

2.2. Characterization of the Core–Shell Materials

The crystallographic structure and composition of the core–shell composites were examined using a PANalytical Empyrean diffractometer (PANalytical, Almelo, The Netherlands ). CuKα radiation (wavelength 1.5418 Å), two bounce Ge 220 monochromator (PANalytical, Almelo, The Netherlands) and Bragg–Brentano diffraction geometry were employed. XRD data were acquired at 25 °C with a step–scan interval of 0.02° and a step time of 10 s, in the range of 20–80°. The phase content was estimated by Rietveld refinement, using HighScore Plus 3.0e software (PANalytical, Almelo, The Netherlands). The background was corrected with the pseudo-Voigt function. The values of the R factors: Rprofile, Rexpected, weighted R profile and χ2, as the crystallographic parameters and average crystallite size are calculated. The microstructure of the core–shell heterostructures was assessed using a scanning electron microscope (Inspect F50, FEI, Hillsboro, OR, USA) with a field emission gun and a transmission electron microscope (TecnaiTM G2 F30 S-TWIN, FEI, Hillsboro, OR, USA) possessing a line–resolution of 1 Å, in high-resolution transmission electron microscopy (HRTEM) mode. The crystalline structure of the samples was investigated by selected area electron diffraction (SAED). X-ray photoelectron spectroscopy (XPS) measurements were performed using a Kratos Ultra DLD Setup spectrometer (Kratos Analytical Ltd., Manchester, UK). A monochromatized Al Kα1 (1486.74 eV) radiation X-ray source was used, operating at 15 kV, an emission current of 15 mA at a pressure in the analysis chamber of 1.2 × 10⁻⁹ mbar. The dielectric properties of the samples were studied at room temperature in 10–2–107 Hz range of frequency, in the metal–dielectric–metal (MFM) configuration, where the electrodes consist of silver paste, using a 4194A Impedance/Gain–Phase Analyzer. A nominal voltage equal to 0.5 mV was applied. The Mössbauer experiments were performed using a constant acceleration spectrometer (triangular wave form) and a 57Co (Rh matrix) source. The spectra were acquired at room temperature, in transmission geometry. The NORMOS computer program [21] was used for least-squares fitting of the Mössbauer spectra. The isomer shifts are reported relative to a-Fe α-Fe at room temperature. The magnetic hysteresis loops of the composites were measured at room temperature by a vibrating sample magnetometer (Lake Shore 7404–s VSM, Westerville, OH, USA). Finally, both transverse 3-1 and longitudinal 3-3 magnetoelectric responses were characterized with a homebuilt system using a combination of two Helmholtz coils. The system was designed to independently provide a static magnetic field up to 1 kOe to magnetize the material, and an alternate magnetic field of 10 Oe at 1 kHz that functions as the stimulus, while the magnetoelectric voltage response was monitored with a lock-in amplifier. Previously, the composites were poled at room temperature by applying increasingDCelectric fields while keeping leakage currents below the threshold.

3. Results and Discussion

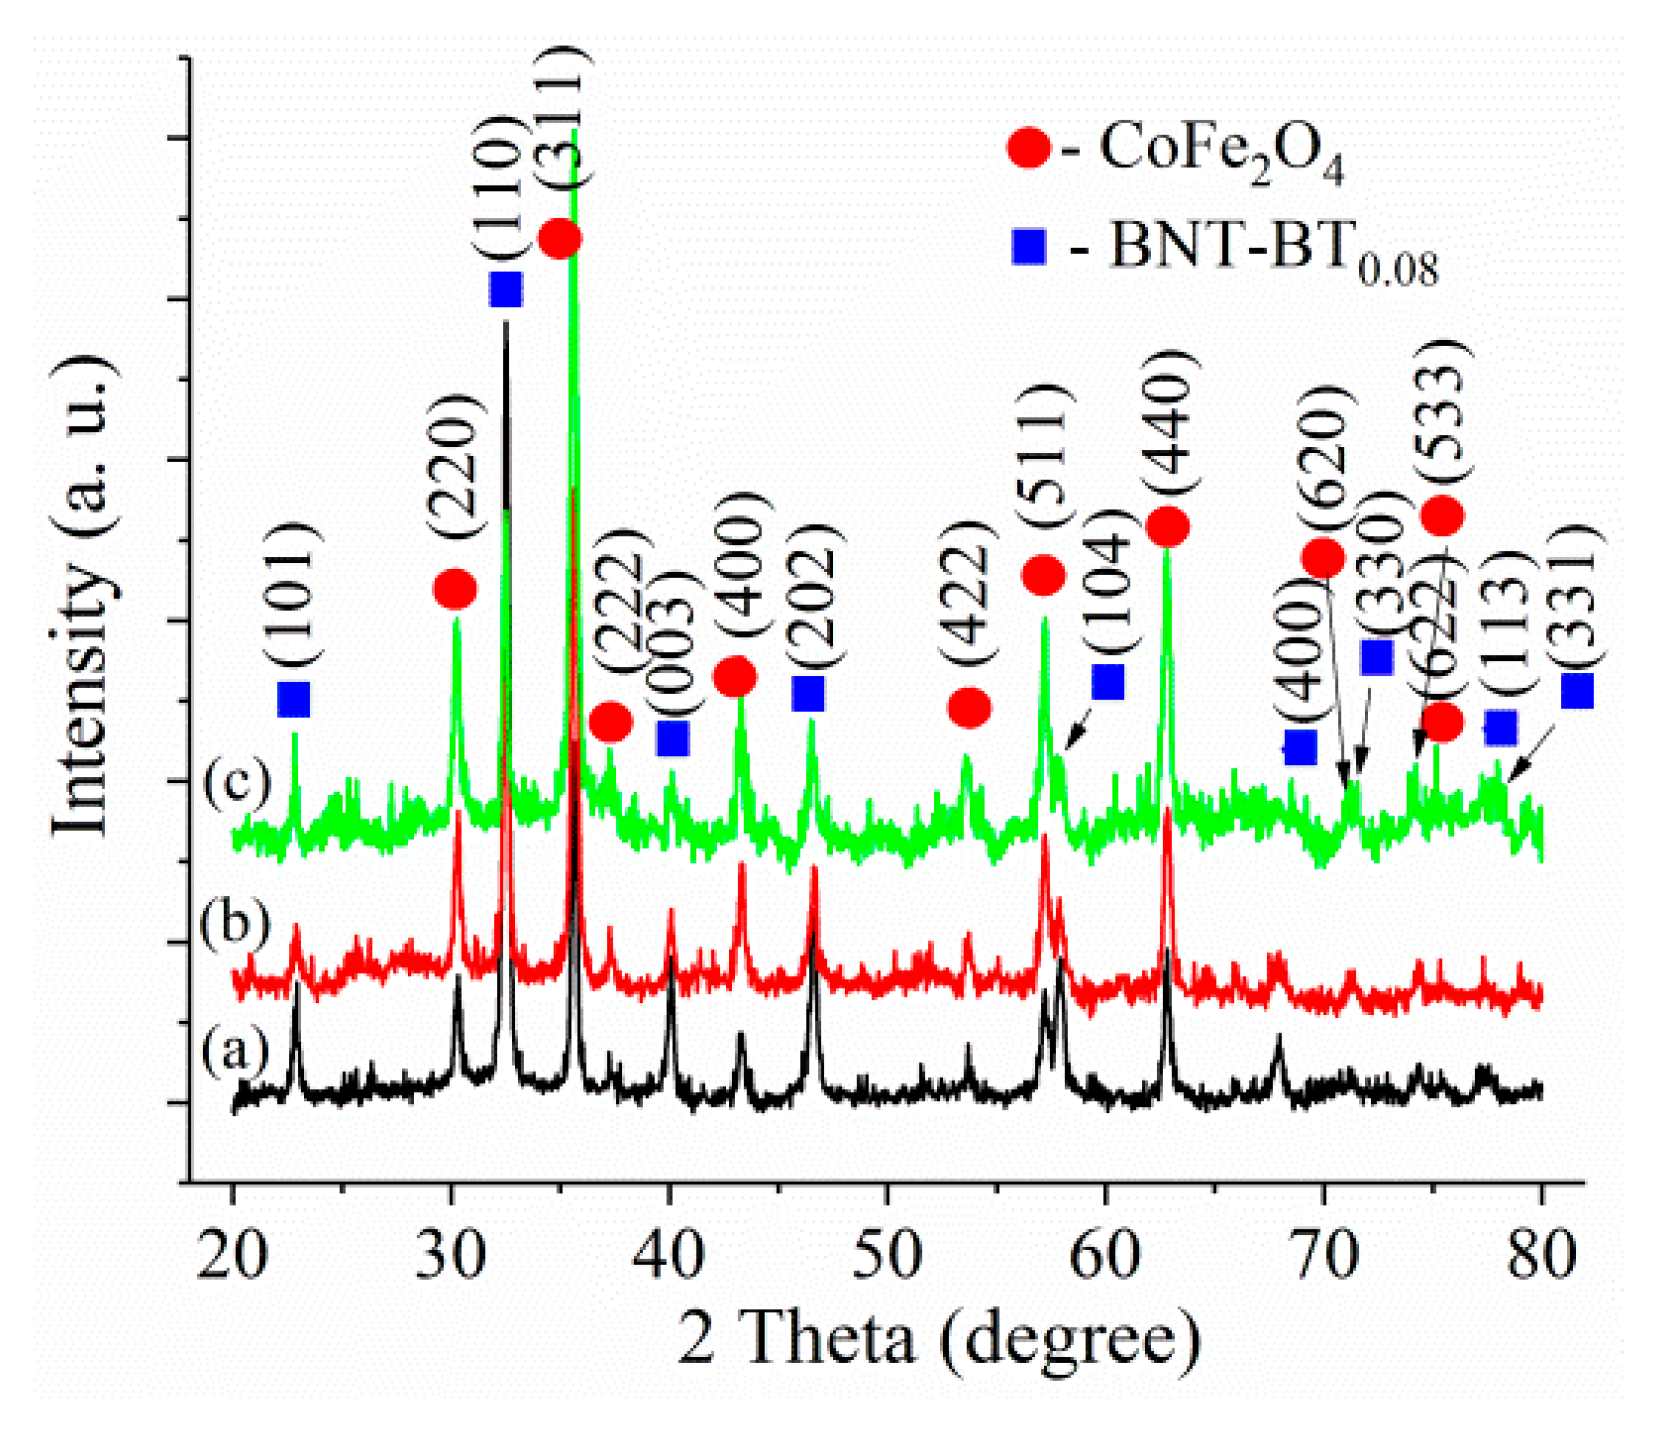
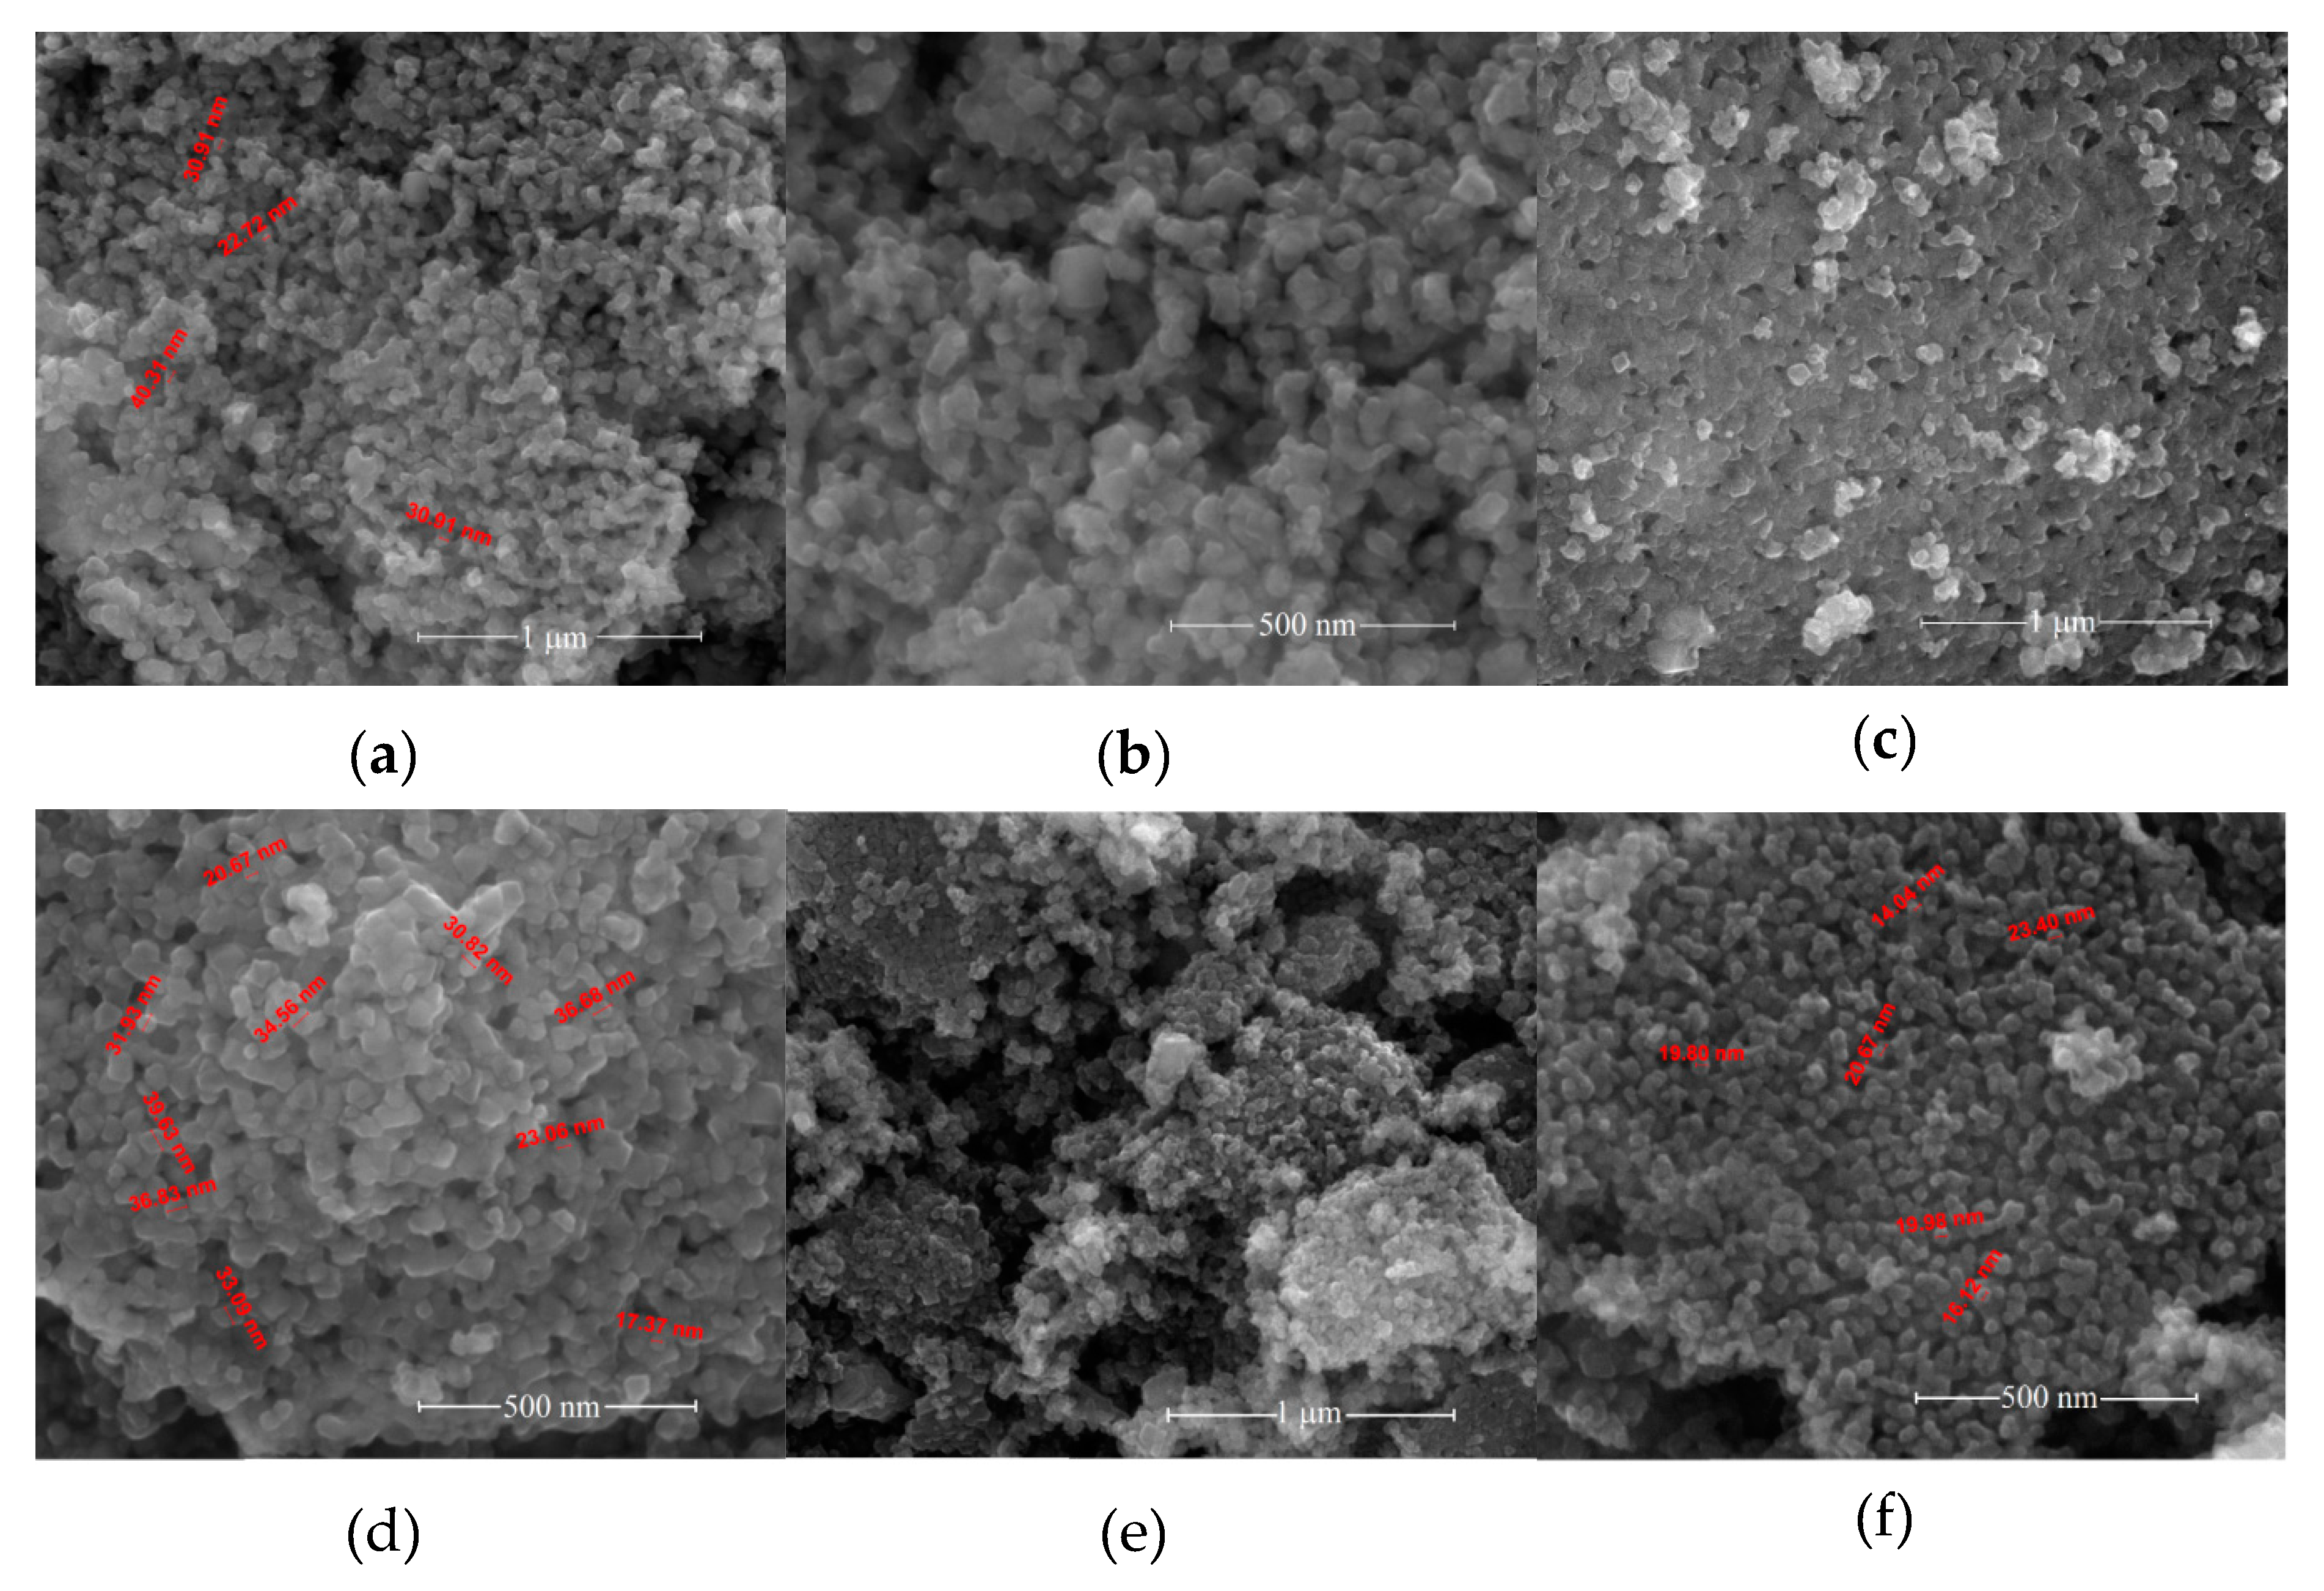
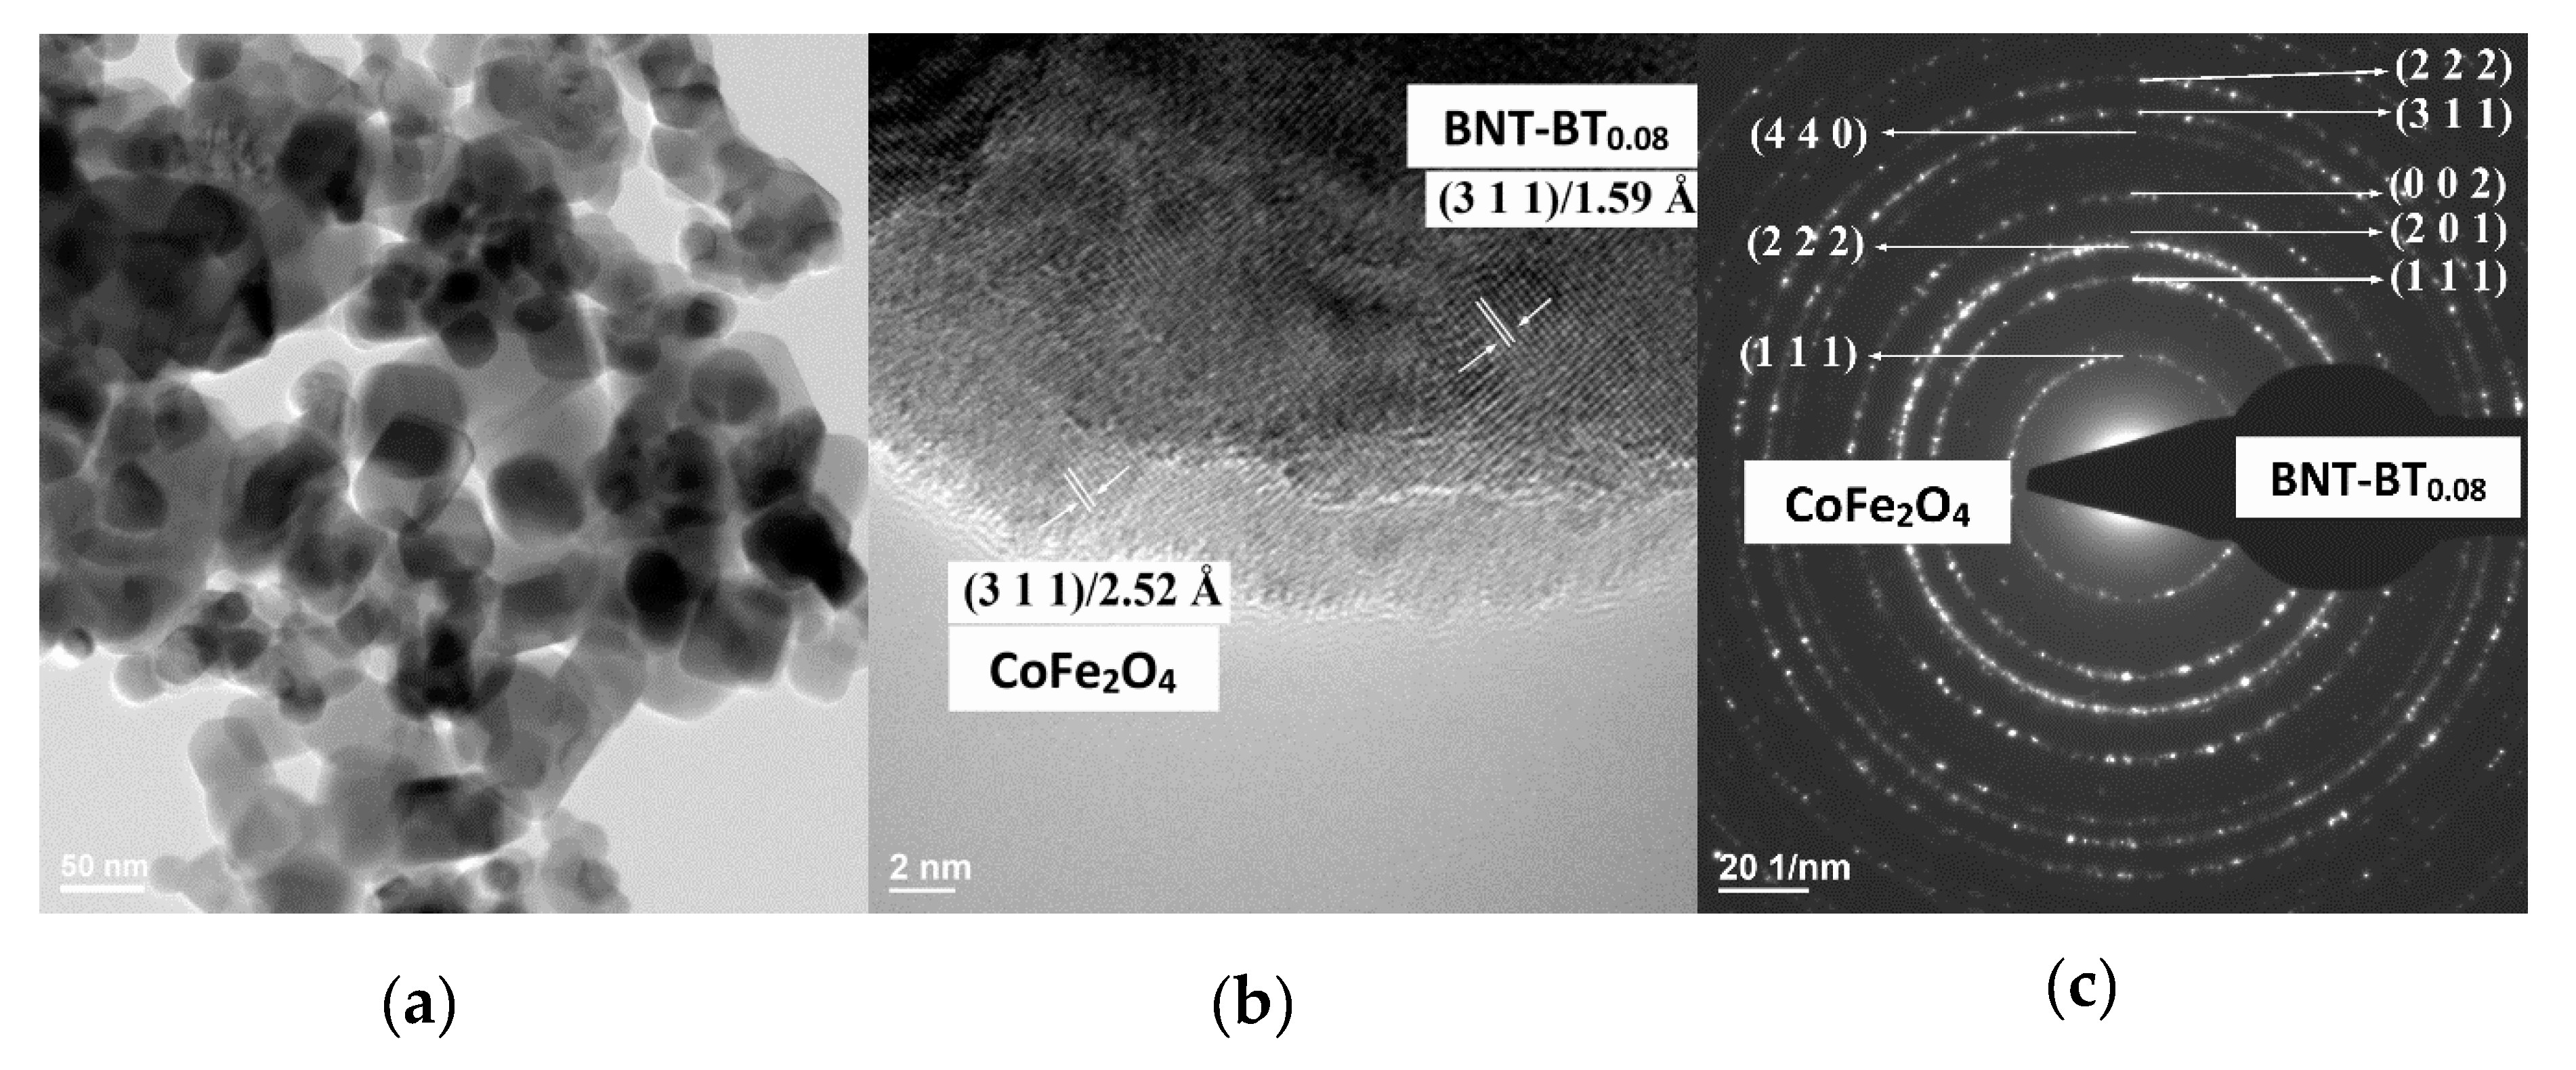
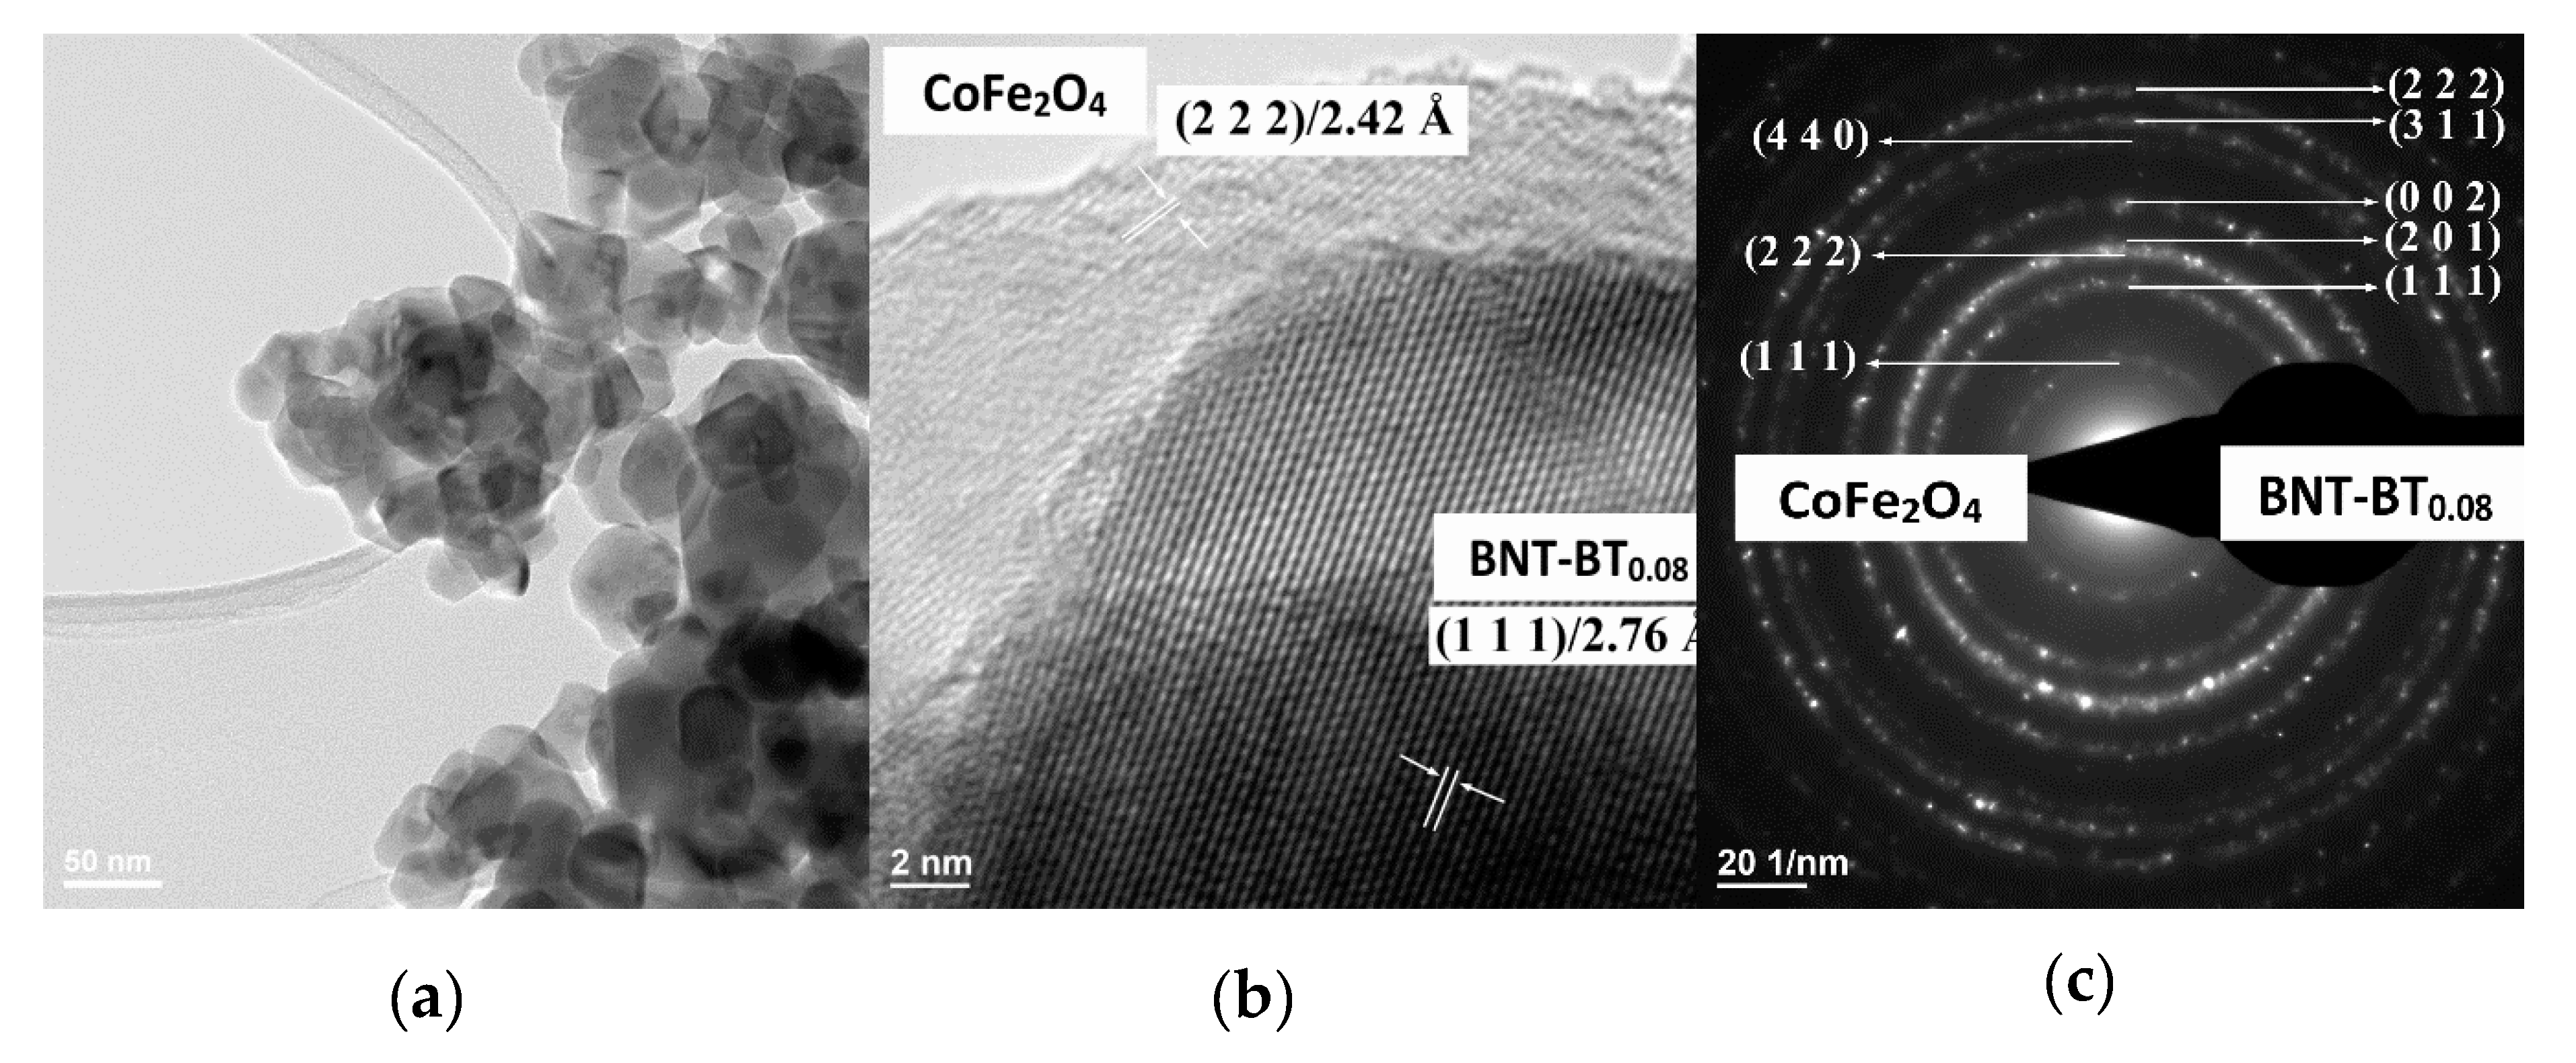
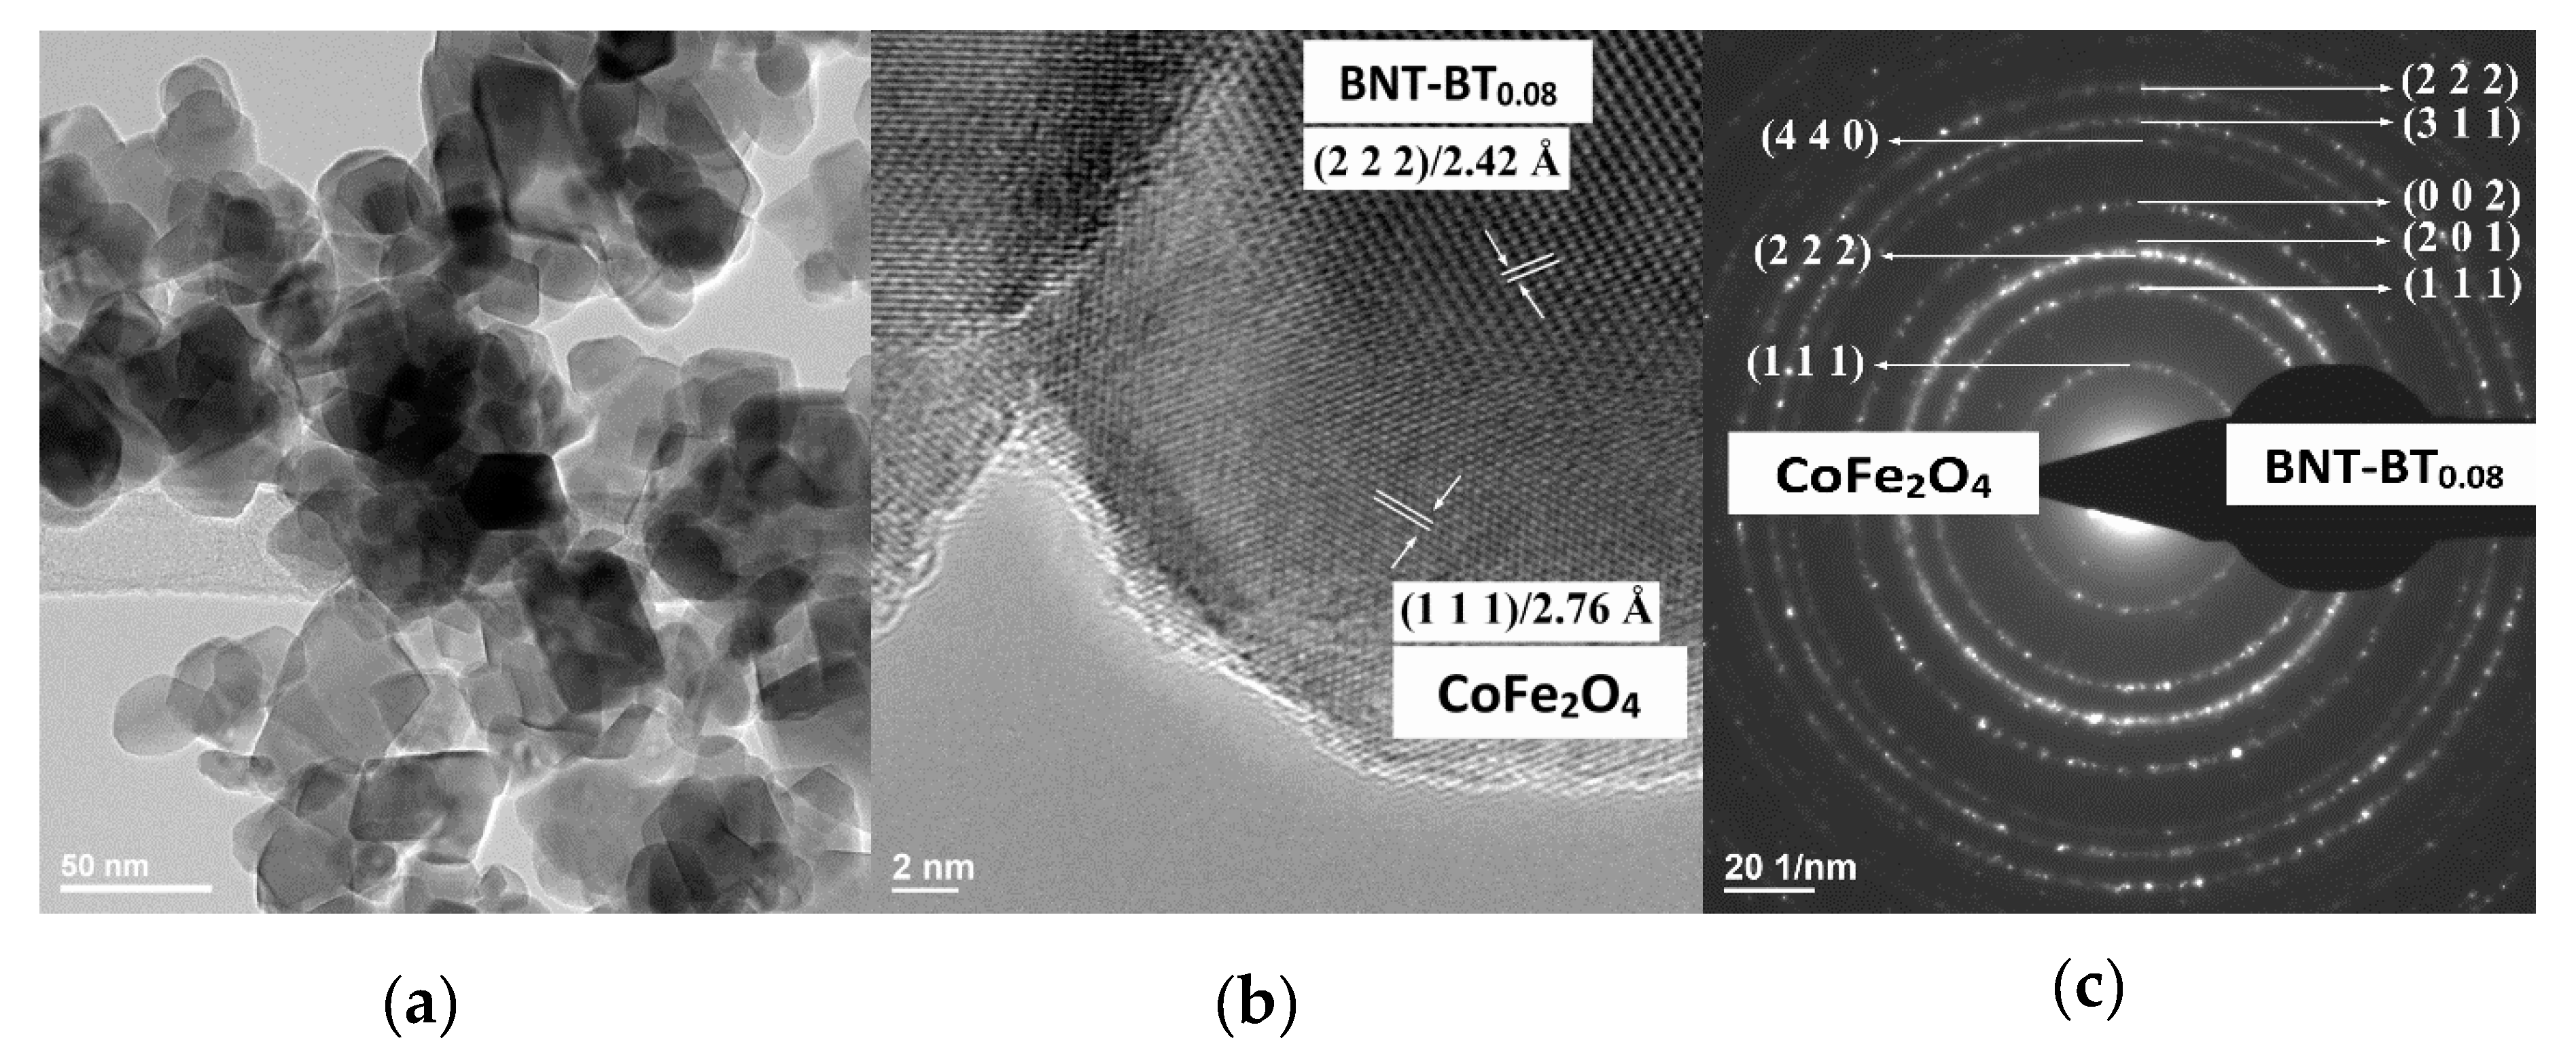
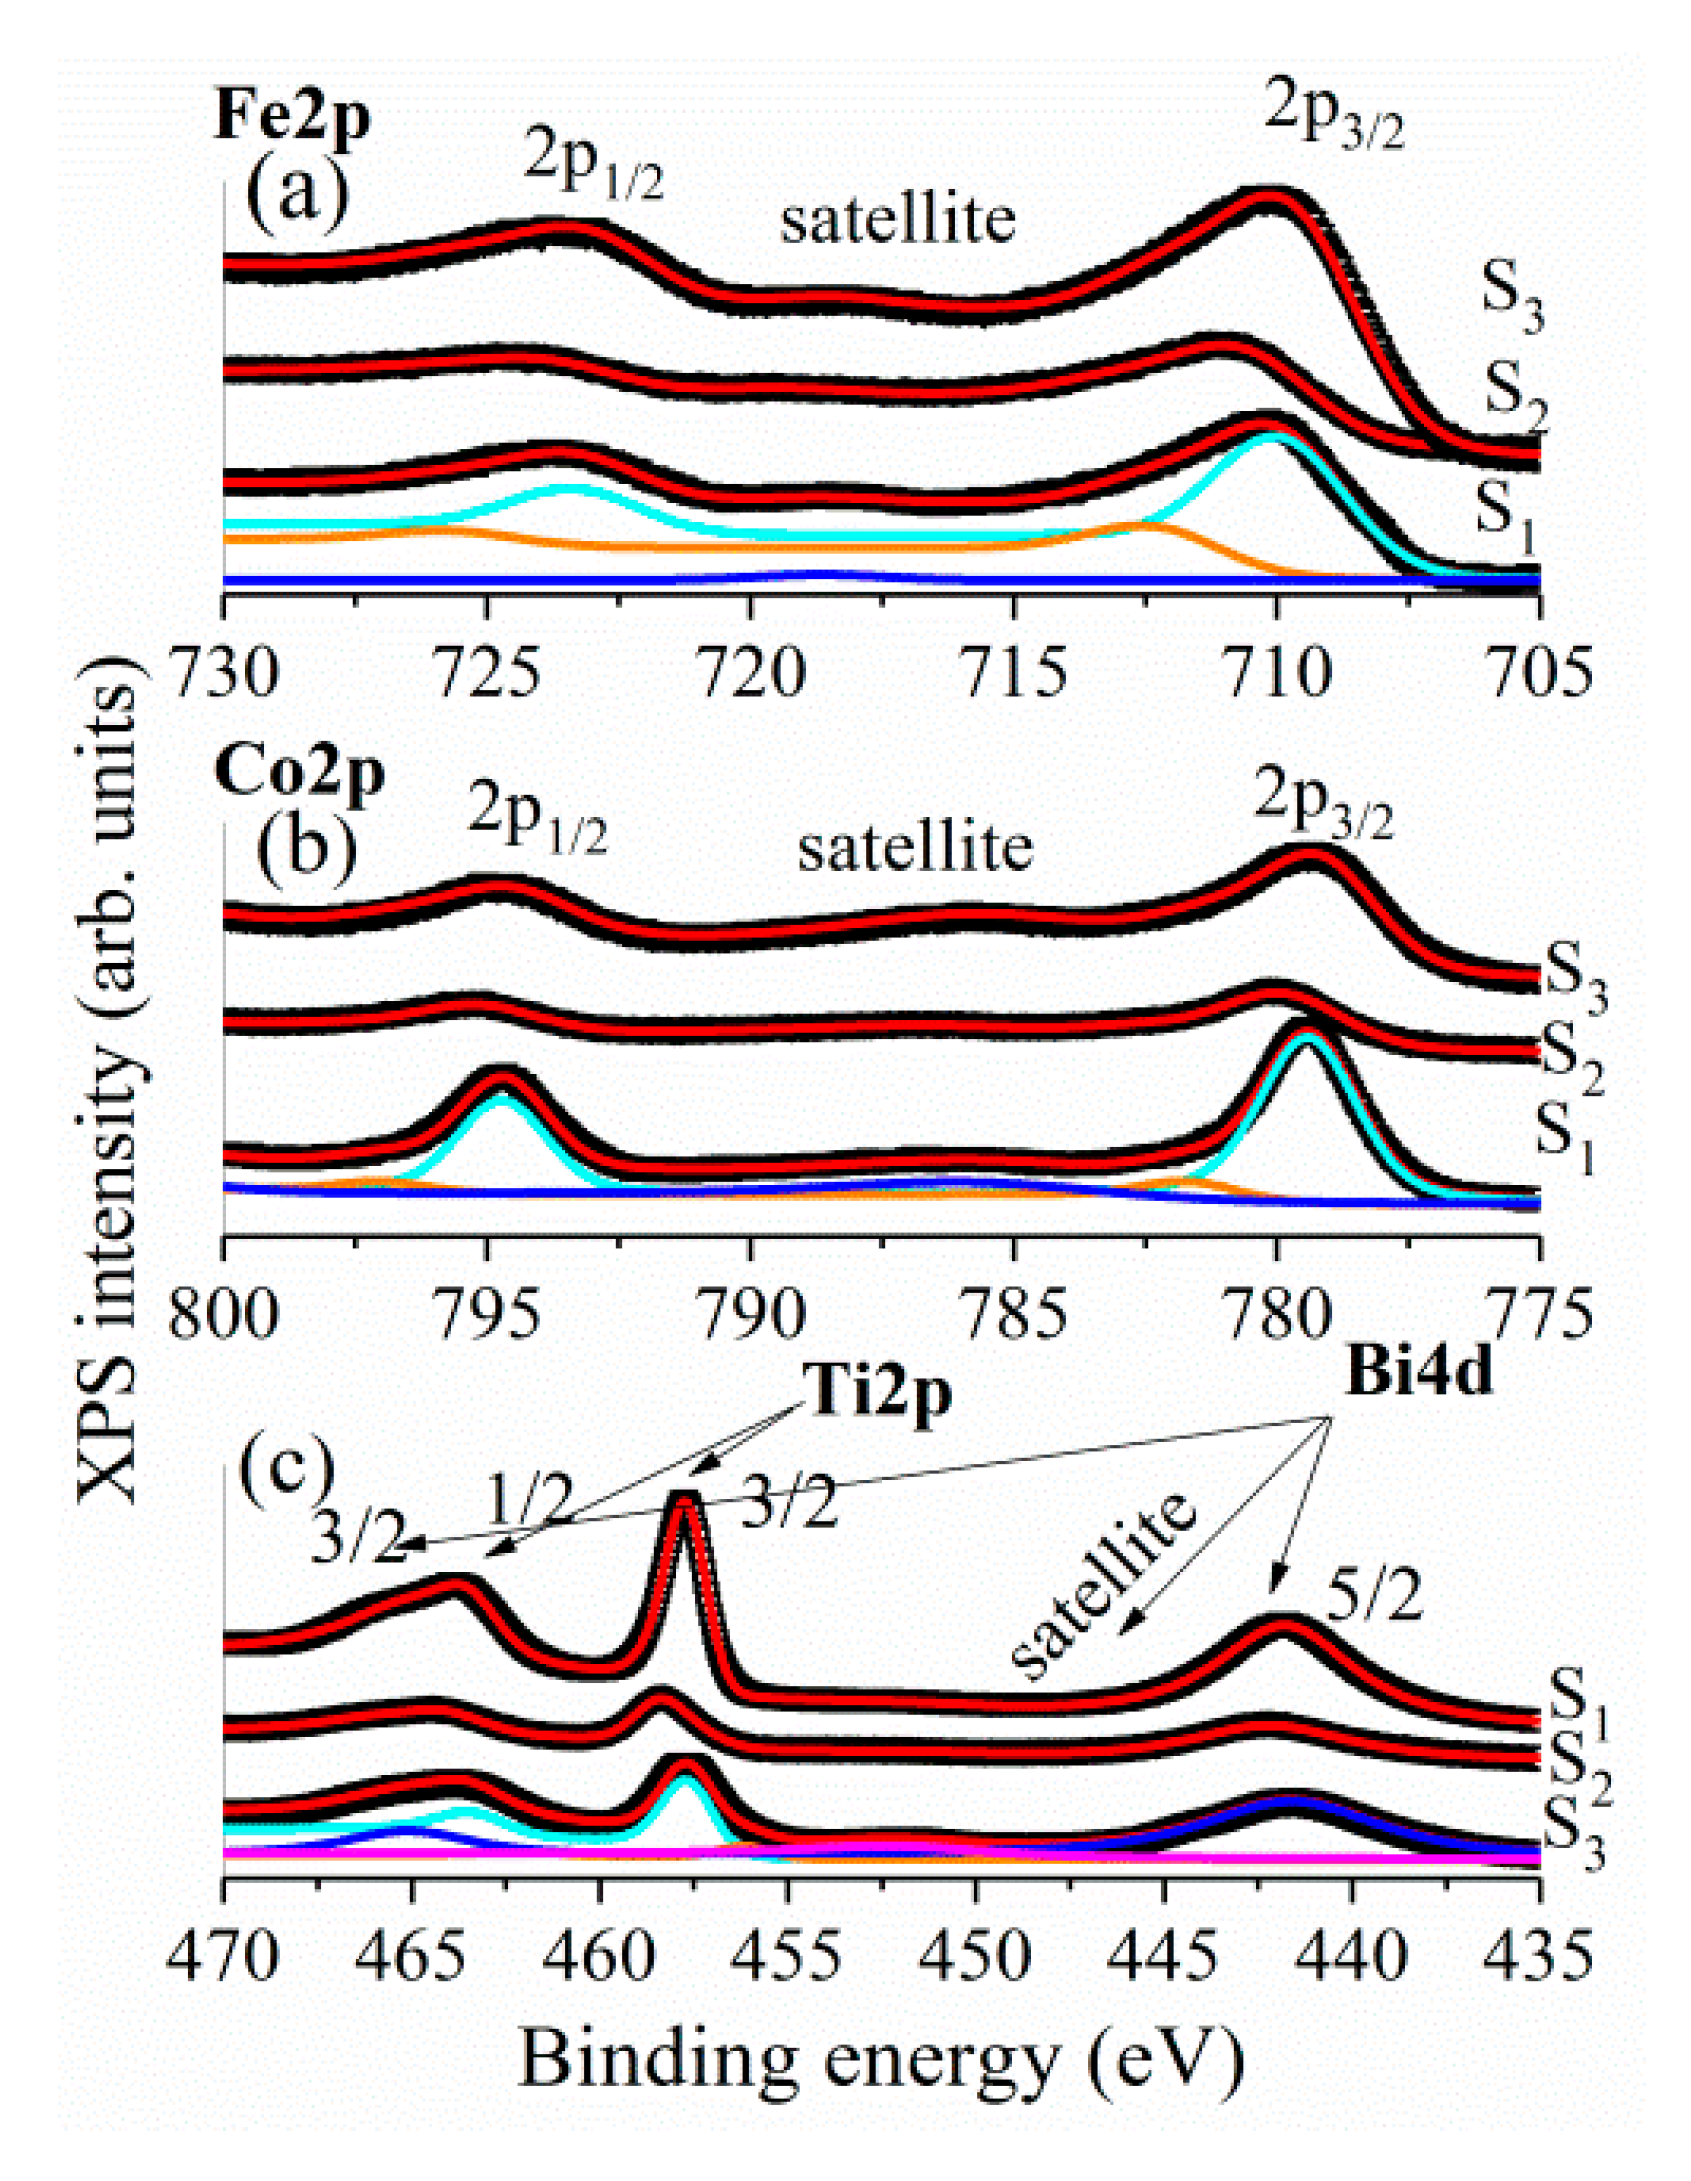
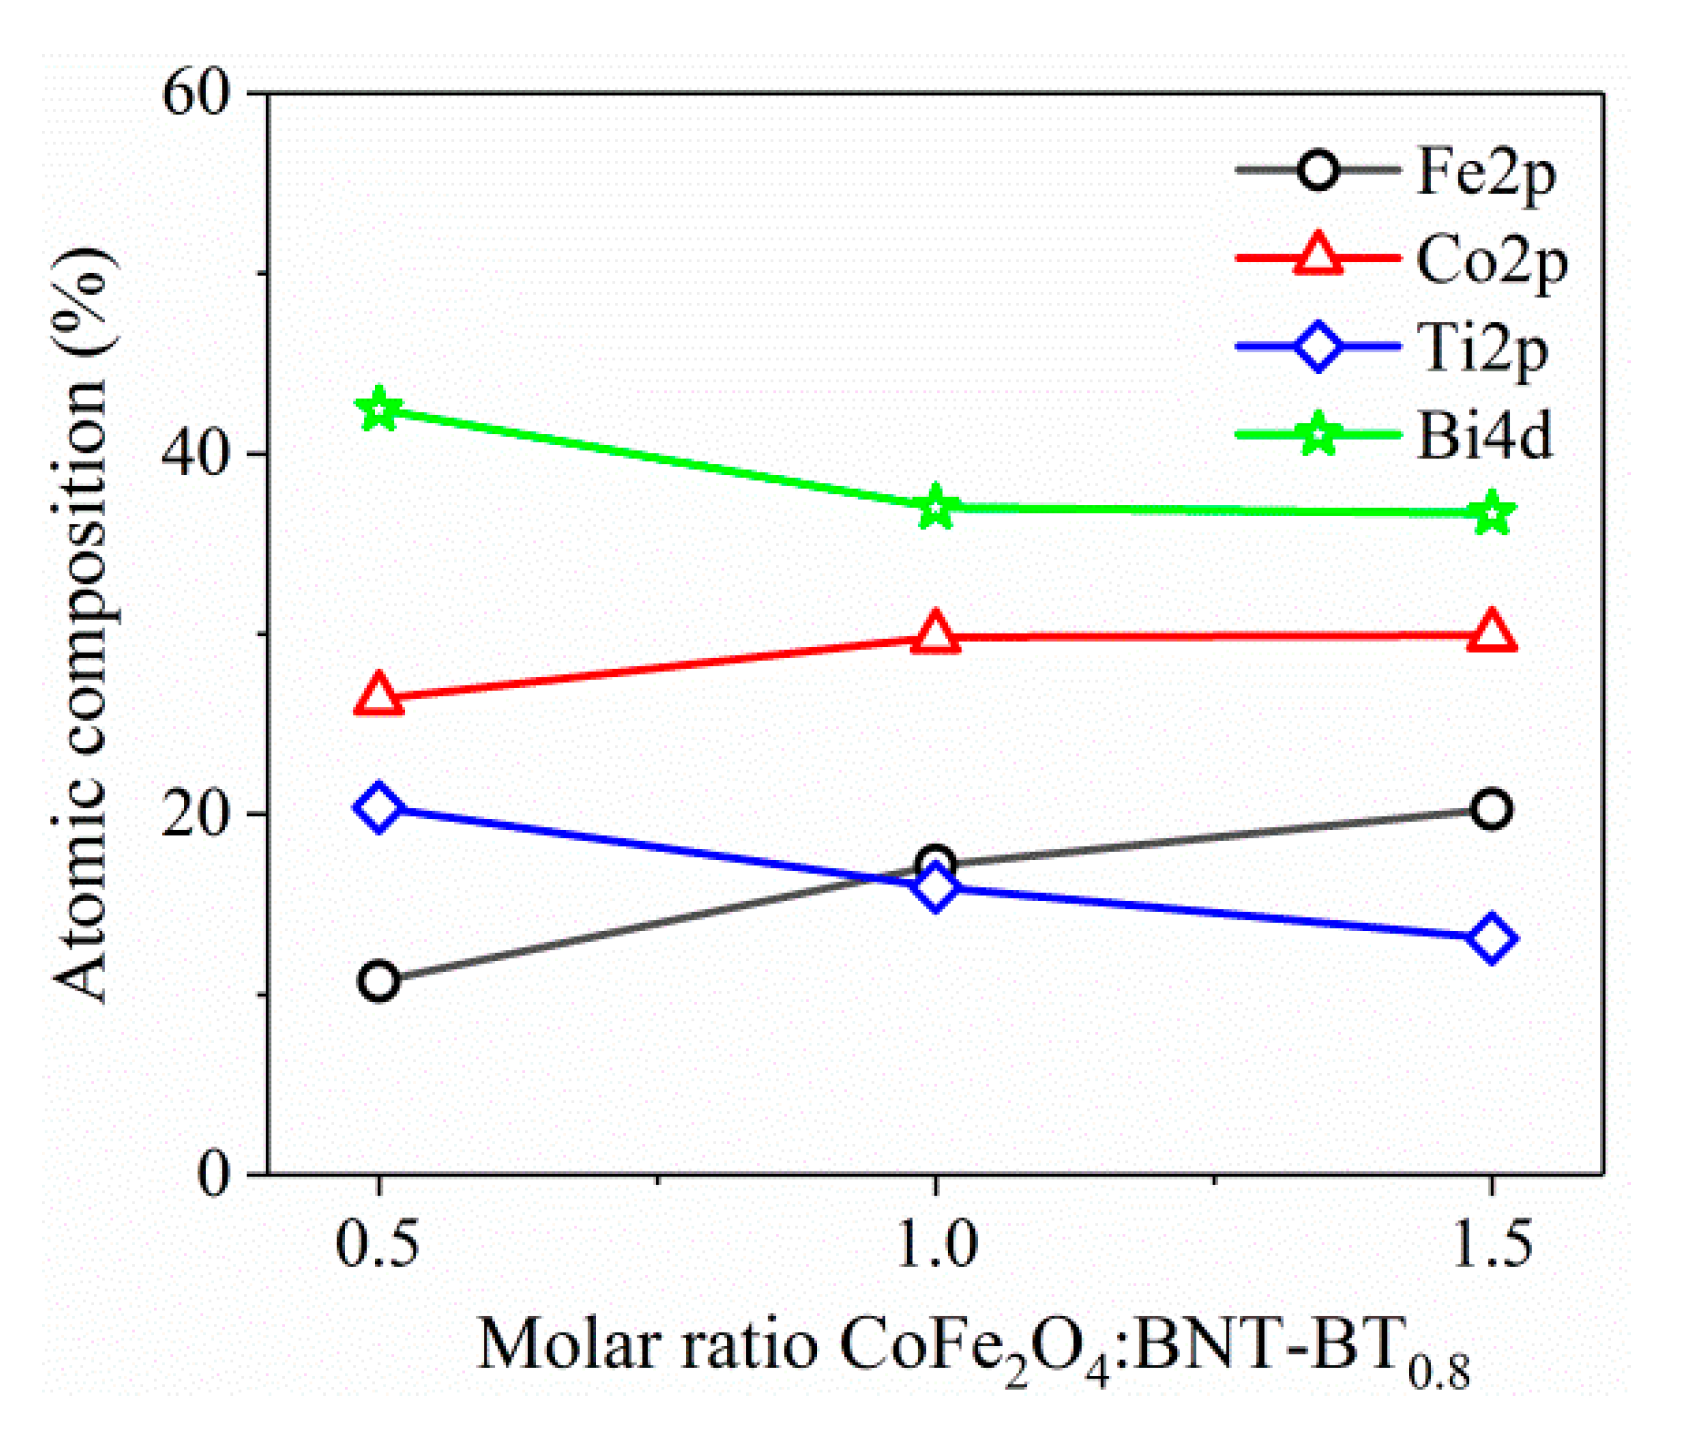
3.1. Structure and Microstructure Characterization

Figure 1 shows the XRD patterns of the BNT–BT0.08/CoFe2O4 core–shell powders calcined at 700 °C for 1h in air.
As can be seen, from Figure 1, the diffraction peaks of the Bi0.5Na0.5TiO3 tetragonal perovskite structure (space group P4bm) (JCPDS 011–4032) [22] are higher for the BNT–BT0.08/CoFe2O4 = 1:0.5 and decrease in intensity with the increase of the CoFe2O4:BNT–BT0.08 ratio. At the same time, the peaks of the cubic spinel CoFe2O4 phase (space group Fd3m) [23] increase with increasing CoFe2O4. No secondary phases were detected by X–ray diffraction analyses in these nanocomposite samples. Detailed structural information for the BNT–BT0.08/CoFe2O4 core–shell powders was obtained using Rietveld refinement and presented in Table 1. The values of the average crystallite size for CoFe2O4 phases decrease with an increasing amount of CoFe2O4. It should be mentioned that the degree of tetragonality of BNT–BT0.08, calculated as the ratio of the lattice parameters c and a, decreases as the content of CoFe2O4 increases. The core-shell samples have similar degree of tetragonality as for BNT–BT0.08, considering the same synthesis. This observation could be attributed to the strain induced in the BNT–BT0.08 phase during CoFe2O4 crystallization, surrounding the BNT–BT0.08. Furthermore, as indicated in Section 3.2, the dielectric constant decreases with increasing CoFe2O4 content, thus having a similar behavior pattern as the degree of tetragonality. It is well known that the tetragonal phase of the perovskite materials has an increased dielectric constant compared with the cubic one.
Figure 2 shows SEM images of the BNT–BT0.08/CoFe2O4 core–shell powders calcined at 700 °C for 1h in air.
As can be seen in Figure 2, all the powders show core–shell nanoparticles with sizes between 15 and 40 nm. The powders present a uniform morphology; the particles having a polyhedral shape. In addition, the powders have a high degree of agglomeration due to the magnetic cobalt ferrite shell. The crystal structures of the core-shell nanopowders (samples S1S3) have also been examined by TEM.
The low-resolution TEM images (bright field images (BF–TEM images)) (Figure 3a, Figure 4a and Figure 5a) show nanoparticles, which show an agglomeration trend. The corresponding high–resolution TEM images for the nanoparticles (Figure 3b to Figure 5b) show nanoparticles of the calcined BNT–BT0.08/CoFe2O4 core/shell nanostructures with an estimated shell thickness of 4, 6 and 7 nm, respectively. HR–TEM images of the samples S1S3 reveal respective fringe spacings of 2.42 Å and 2.76 Å, which correspond to the interplanar spacings along the BNT–BT0.08 (222) and CoFe2O4 (111) directions. The SAED patterns present interplanar spacings of (222), (311), (002), (201) and (111) corresponding to tetragonal BNT–BT0.08 and (440), (222) and (111) interplanar spacings corresponding to the cubic CoFe2O4 phases (Figure 3c to Figure 5c). For the samples S1–S3, the HR–TEM and circular distinct ring patterns (SAED patterns) corresponding to the different lattice planes confirm the core–shell heterostructure of the grains, with BNT–BT0.08 and CoFe2O4 phases. Also, HR–TEM micrographs of core–shell interface clearly show the existence of an interface between grain core and layer shell for the powder samples analyzed.
XPS analyses were performed with the purpose of identifying the chemical composition and the valence of the cations, thus determining the influence of the CoFe2O4 on the magnetic properties of the BNT–BT0.08/CoFe2O4 core–shell composites. To our knowledge, this is the first study using XPS analysis on BNT–BT0.08/CoFe2O4 core–shell composites. The XPS spectra of BNT–BT0.08/CoFe2O4 for all pellets samples are illustrated in Figure 6. The core level spectra of the BNT–BT0.08/CoFe2O4 core–shell composites (Fe 2p, Co 2p, Ti 2p, Bi 4d) were deconvoluted using Voigt functions (Lorentzian and Gaussian widths) having a different inelastic background for each component [24,25,26]. For the analyses of the XPS data, all the binding energies for all peaks were calibrated using the value of the binding energy of C 1s of 284.8 eV. It should be mentioned that the C 1s photoelectron peak in all powders (not shown here) was observed at 283.6 eV, while for samples S1S3 its values were of 283.13 eV, 284.09 eV and 285.09, respectively.
The Fe 2p main peak was fitted with two doublets with binding energies at 710.5 eV and 712.6 eV attributed to Fe3+ ions in octahedral and tetrahedral sites, respectively [27]. It was calculated that around 80% of Fe3+ ions are located in octahedral sites while 20% are in tetrahedral sites. The satellite peak of Fe 2p3/2, located approximately 8 eV higher than the main peak, is clearly distinguishable. In a similar manner, the Co 2p XPS spectra were fitted with two doublets (Figure 6b) with binding energies at 779.7 eV and 781.4 eV and attributed to Co2+ ions in octahedral sites and tetrahedral sites, respectively. Furthermore, the signal at 785.9 eV was assigned to the satellite peak of Co 2p3/2 main line.
Figure 6c shows the XPS spectra of the Ti 2p and Bi 4d. One can notice that the peaks of Ti 2p1/2 and Bi 4d3/2 are partially overlapped, resulting in a broad bump around 464 eV [28]. Thus, the XPS peaks with binding energies at 441.7 eV and 465.1 eV are attributed to Bi 4d5/2 and Bi 4d3/2, which correspond to Bi3+, while the peaks at 457.7 and 463.6 eV are attributed to Ti 2p3/2 and Ti 2p1/2, corresponding to Ti4+. The atomic composition was calculated, for all the investigate samples, by taking into account the integral areas provided by the deconvolution procedure, normalized to the XPS atomic sensitivity factors described in [29] (Figure 7). As expected, by increasing the molar ratio BNT–BT0.08/CoFe2O4 from 1:0.5 to 1:1.5 the composition of Fe3+ and Co2+ ions increases.

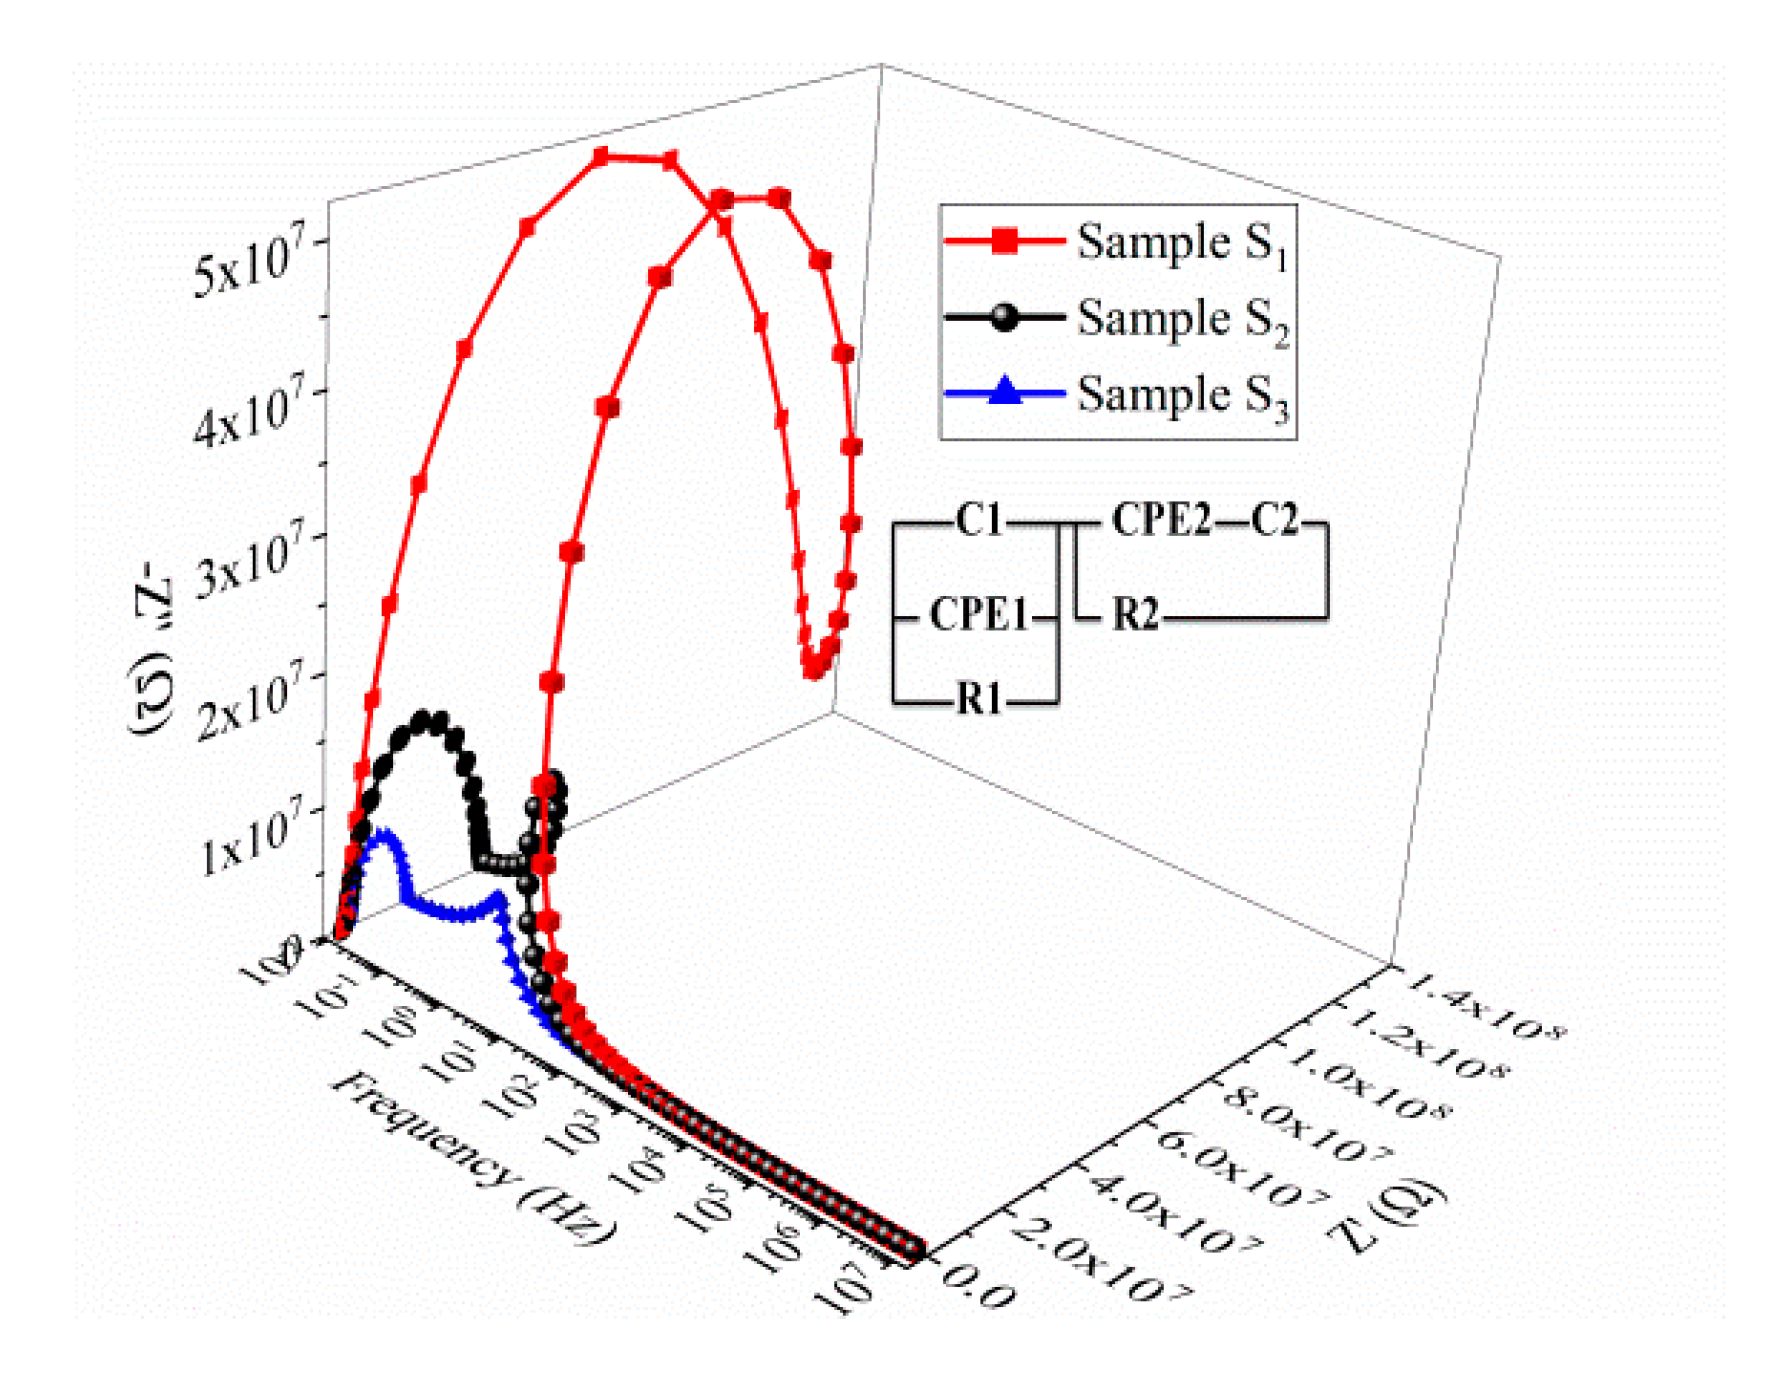
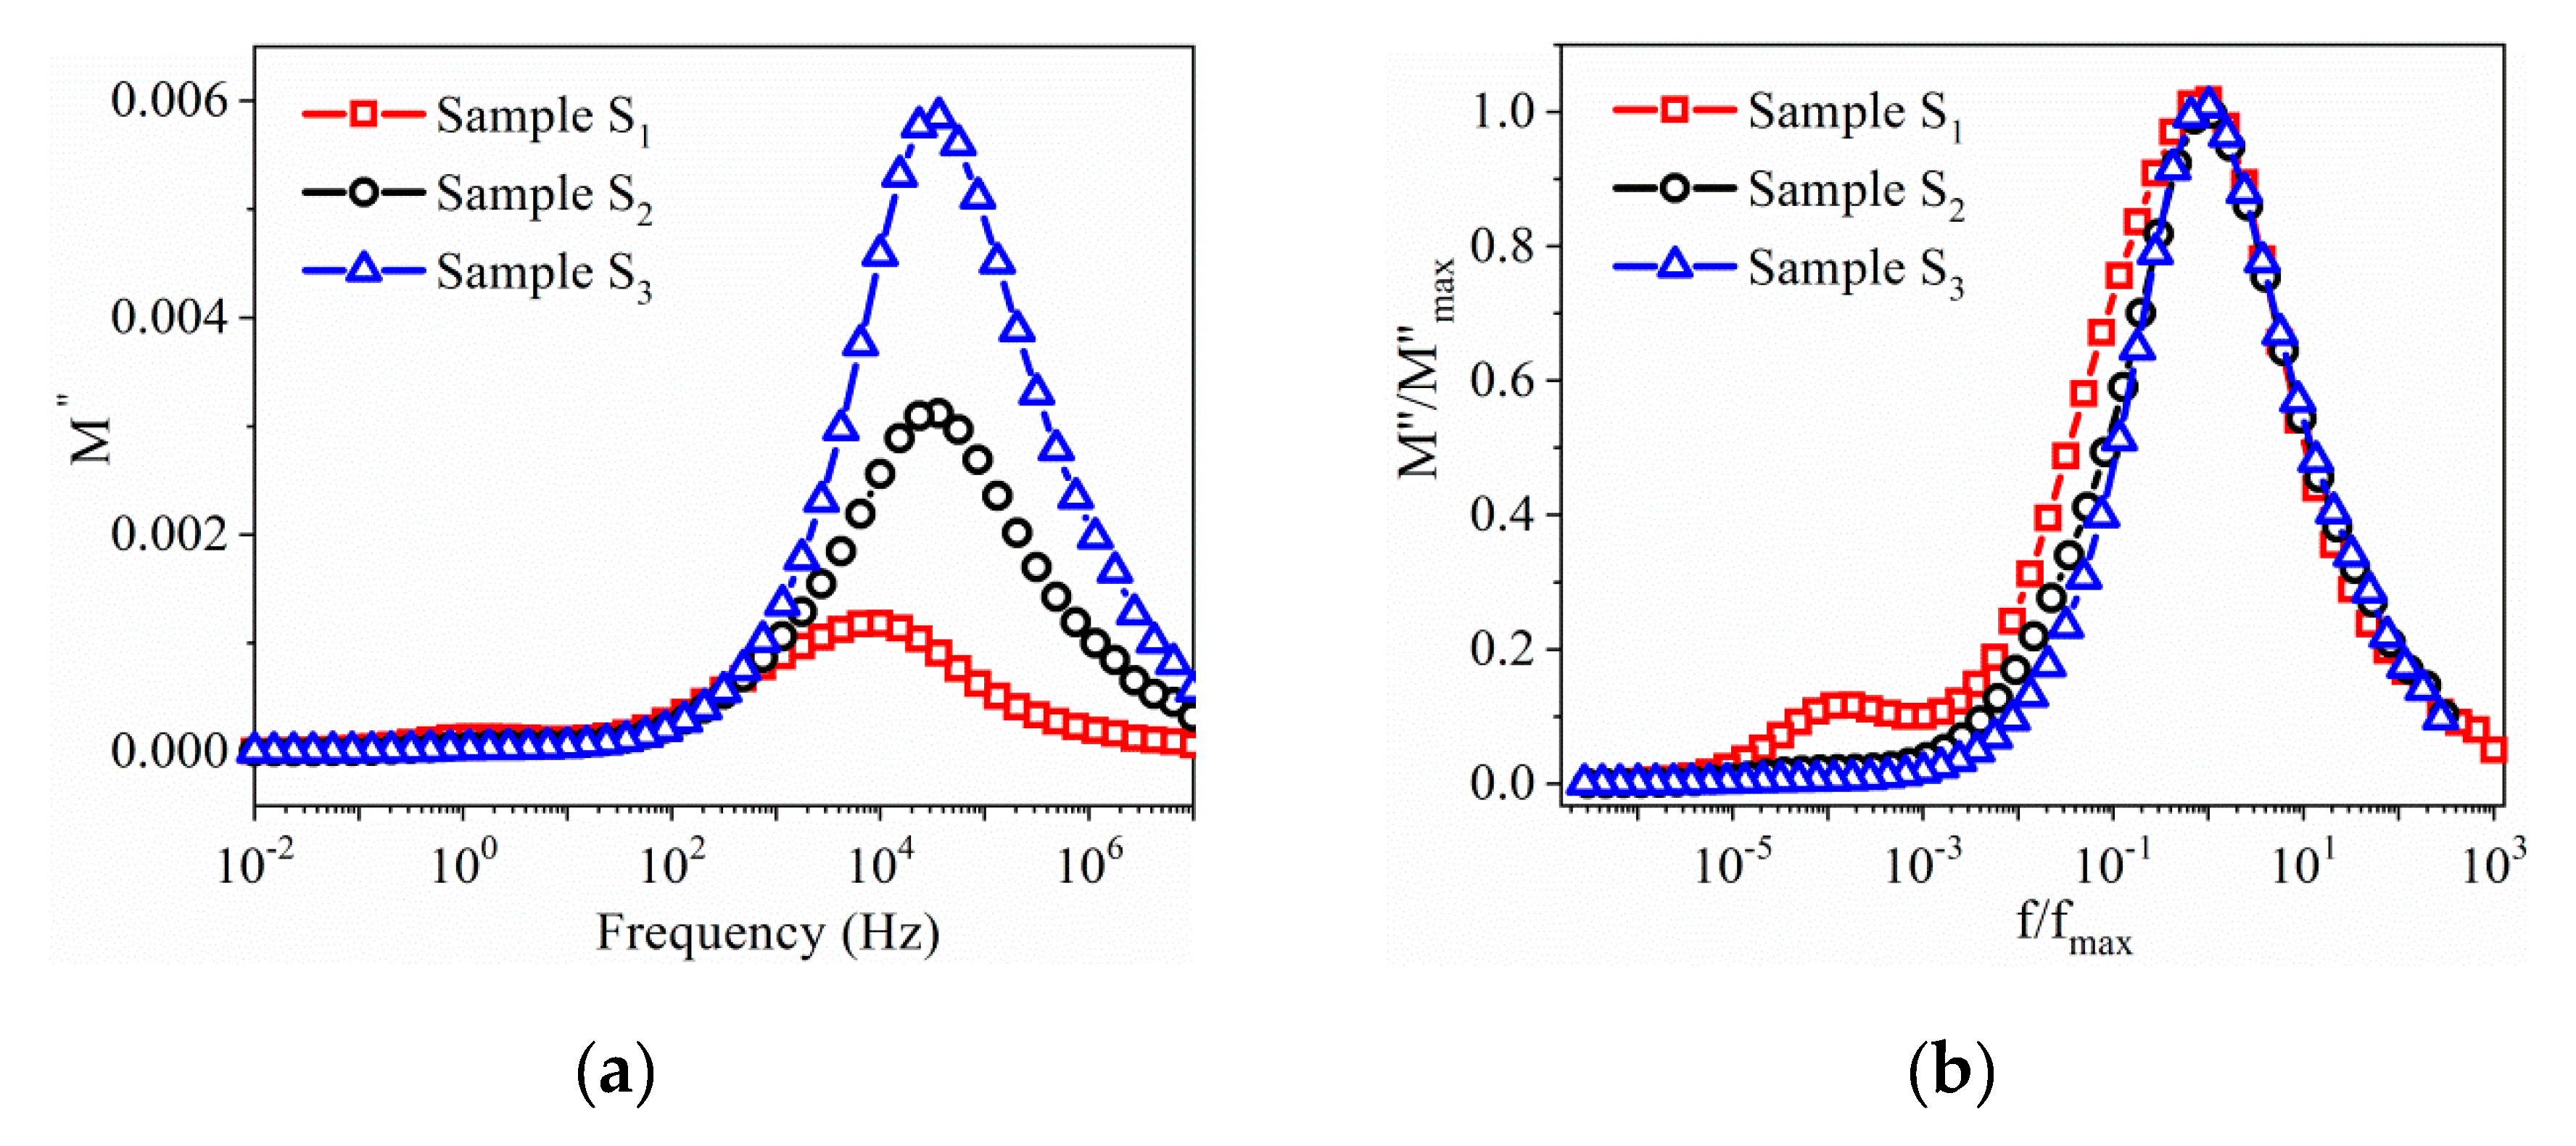
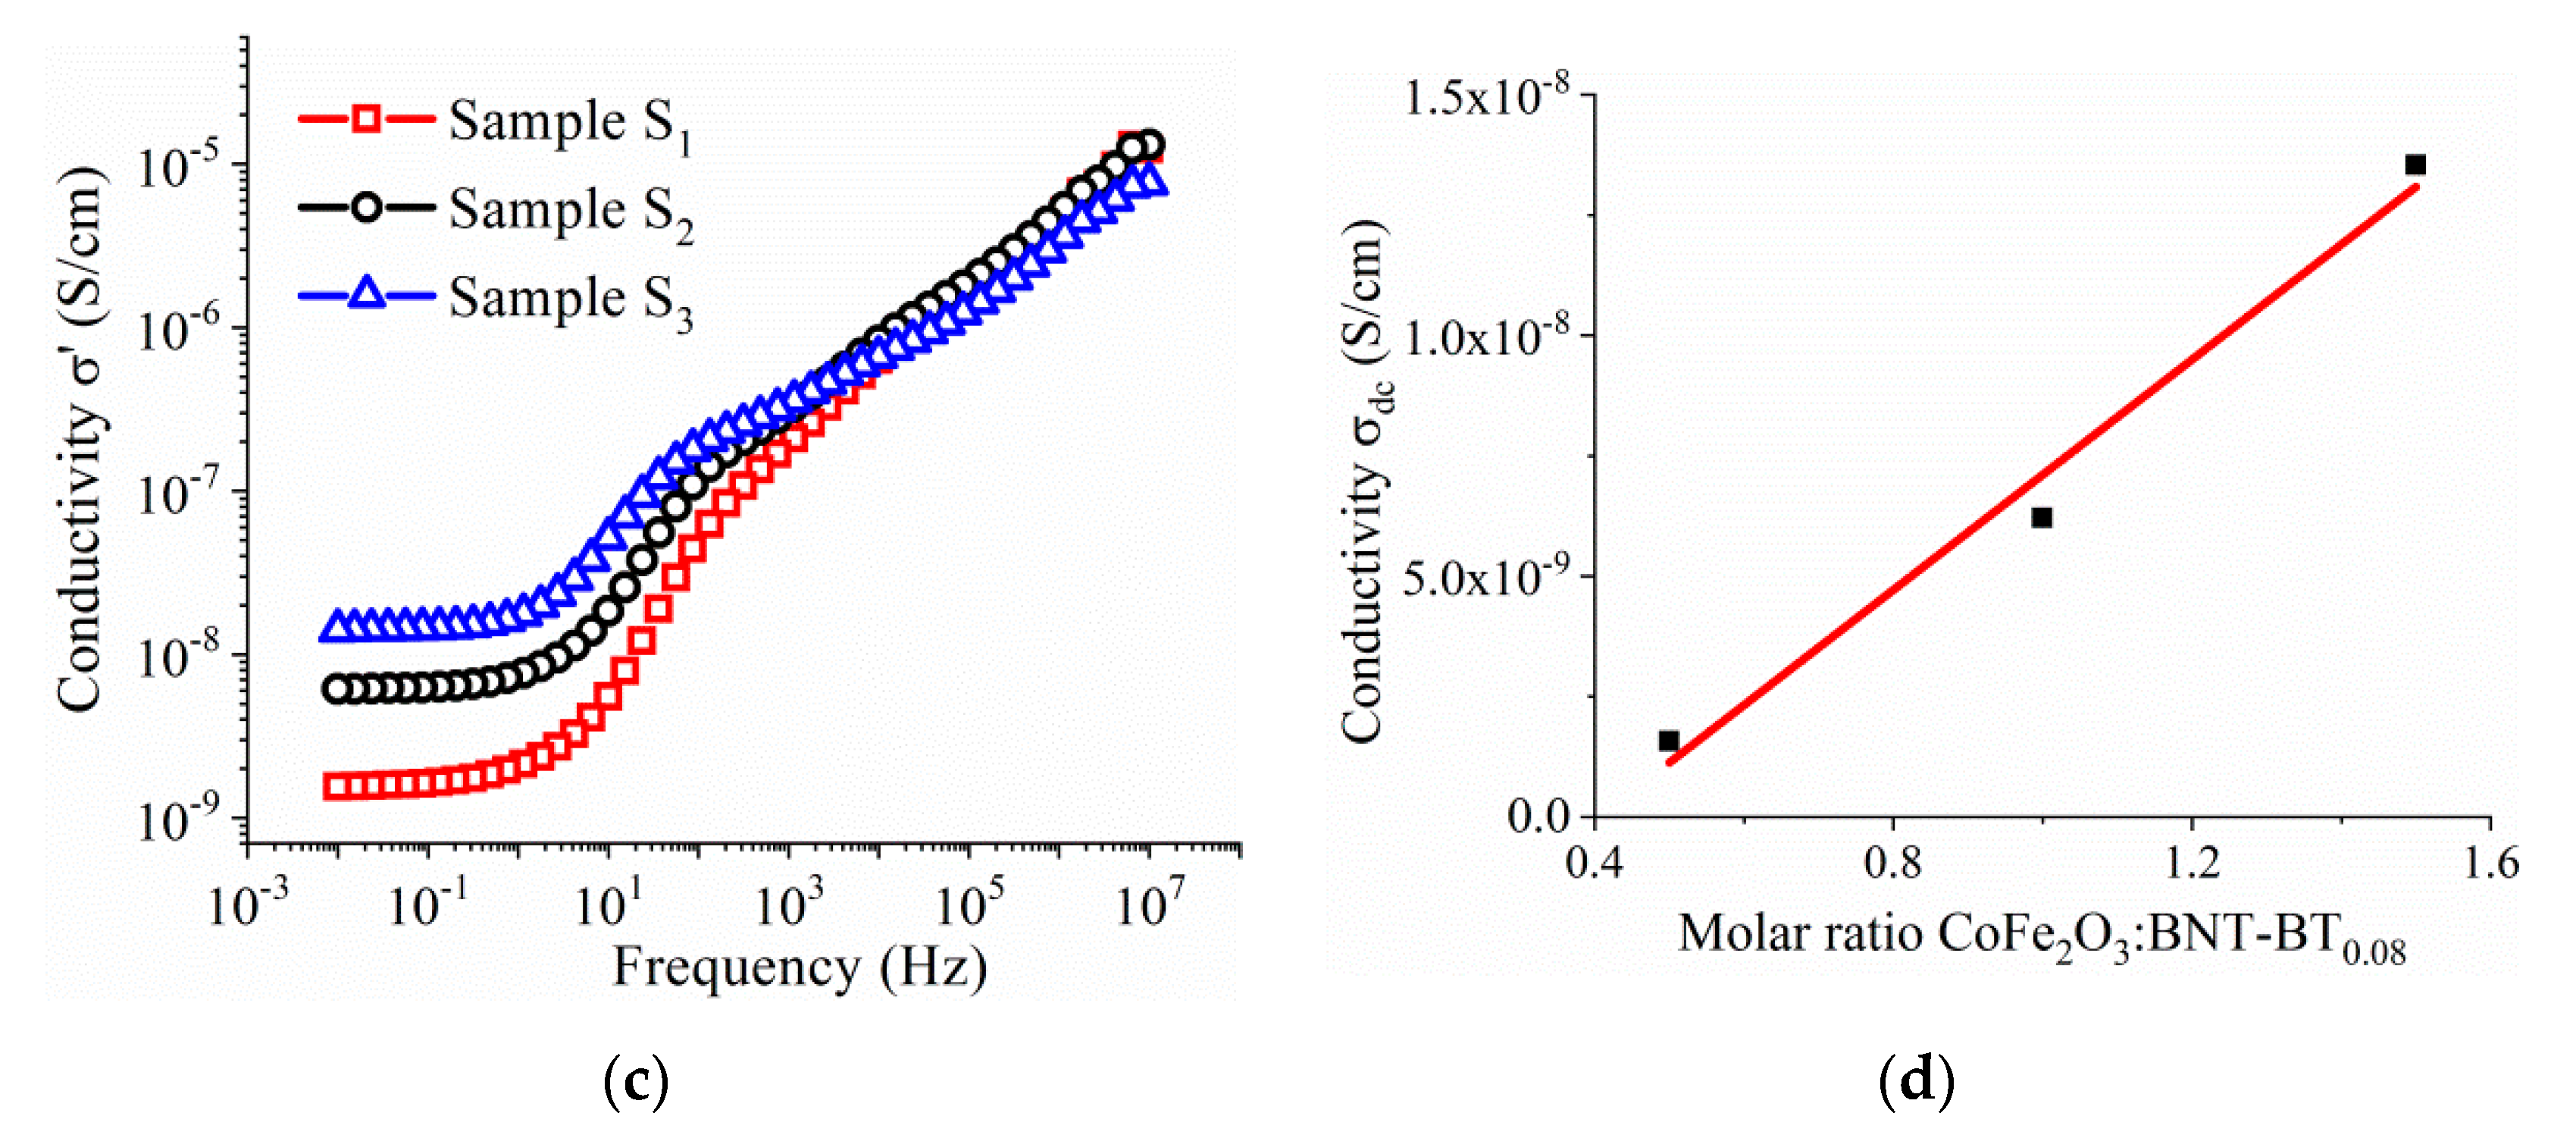
3.2. Complex Impedance Spectrum Analysis

The contribution from the sample-electrode interface, grain (intrinsic), grain boundary (extrinsic) and bulk resistance and capacitance is reflected in the charge transport mechanism and the macroscopic dielectric constant in polycrystalline materials. Using complex impedance spectroscopy measurements one can gain essential information regarding their individual contribution by analyzing the response of a crystalline material to an alternating field [30,31,32]. The electric properties of a material such as its resistive and capacitive parts are represented in terms of complex dielectric permittivity, ε, complex impedance, Z, and electric modulus, M, which are related to each other as: Z = Z′ + iZ″; M = 1/ε = M′ + iM″, where (Z′, M′) and (Z″, M″) are the real and imaginary components of impedance and modulus, respectively. Figure 8a,b show the variation of the real part (Z′) and the imaginary part (Z″) of the impedance with frequency, for the BNT–BT0.08/CoFe2O4 ceramics samples S1S3, measured at room temperature, in the range 10−2–107 Hz. One can observe that both values of the real and imaginary part of the impedance decrease with the rise of CoFe2O4 concentration in the composite, up to a frequency of 10 kHz, while at high frequencies the trend is reversed. It was found that for all the samples (S1S3), the loss spectrum, Z″ vs. frequency, shows the appearance of peaks with maxima at 1 Hz, indicating dielectric relaxation processes in this region. Moreover, in the high-frequency region (105–107 Hz), the loss spectrum appears to have a linear decrease with a slope about −1, which can be related to the exponent used in cases of polycrystalline materials to explain the Constant–Phase–Element (CPE) behavior [33,34].
Figure 9 shows the Cole–Cole plots of impedance for the BNT–BT0.08/CoFe2O4 ceramics for samples S1S3. In impedance plots (Cole-Cole plots), the radii of semicircles are equivalent to the resistive behavior of ceramic samples. With the increase of the CoFe2O4 concentration the radii of Cole–Cole plots start decreasing, indicating a decrease in resistivity (i.e., an increase of the conductivity with the CoFe2O4 amount, see Table 2).
The two semicircles present in the complex plots are a signature of the corresponding electrical process taking place in the material. Generally, the semicircles with smaller radii (i.e., lower resistance) will appear at higher frequencies, whereas at lower frequencies semicircles with higher radii will appear. In a polycrystalline material, in the high frequency region, the interface states of the grain boundaries cannot follow the ac signal. Thus, the semicircles result from the contribution of crystalline grains, while at low frequencies the semicircles correspond to the contribution of the grain boundaries [35,36]. The complex impedance data has been interpreted by using an appropriate equivalent circuit, which is a series arrangement of a resistance and capacitance that are connected in parallel, attributed to the grain contribution denoted C1, R1 and CPE1. The second component contains a parallel couple of a resistance and capacitance attributed to the grain boundary, denoted C2, R2 and CPE2. The parameters for the grain and grain boundary were estimated by fitting experimental data, modeled with the EIS Spectrum Analyzer, with an appropriate equivalent circuit (inset of Figure 9).
The frequency dependence of the imaginary part of the electric modulus (M″), shown in Figure 10, exhibits a very clear relaxation peak whose maximum position (around 104 Hz) shifts toward higher frequencies as the CoFe2O4 content in the composite increases. Earlier studies [18] showed the appearance of the relaxation in the same range of frequencies. Figure 10b shows the normalized plot (M″/Mmax″) versus log (f/fmax) of the modulus for the three samples S1S3. It is evident that the measured curves do not completely overlap. In addition, with decreasing of the CoFe2O4 concentration in the composite, the main peak gets broader, and a second peak appears (Figure 10b). The presence of a second peak in the M″ spectra, at 1 Hz, with decreasing the CoFe2O4 content, might be a signature of the suppression of some dynamical processes or the overlapping of either two effects (contribution of the grain and grain boundaries). This behavior is very clearly seen in the Cole–Cole plots of the impedance spectra, where, at high frequencies, a second depressed semicircle is more easily observed in the case of the BNT–BT0.08/CoFe2O4 core–shell composite with a molar ratio of 1:0.5.
Figure 11a shows the frequency dependence of the real part of relative permittivity (ε′) of the core–shell BNT–BT0.08/CoFe2O4 pellets sintered at 1100 °C for 10 min in air. With increasing frequency, ε′ exhibits high values in the low-frequency range and decreases with further increase of frequency. The dielectric constant decreases with increasing amounts of CoFe2O4 and decreases in resistive BNT–BT0.08 phases, up a frequency of 10 kHz, while at high frequencies the trend is reversed. The relaxation frequency that characterizes the dispersion in capacitance can be obtained from the maximum in the corresponding dielectric loss spectrum. The frequency dependence of the ε″ (illustrated in the inset of Figure 11a) shows a relaxation peak whose amplitude is shifted towards the high frequency side with decreasing the CoFe2O4 content.
The change of the total conductivity with the rise in frequency is shown in Figure 11c, where the low-frequency region (the plateau) is dominated by dc conduction. The value of the frequency-independent part of conductivity (σdc) was evaluated from the ac conductivity by fitting the experimental data in the low frequency range using Joncher’s power law (Figure 11c) σac = σdc + n, where A is constant, ω = 2πf is the angular frequency of the applied electric field and n is a power law exponent having a value lying between 0 and 1 [37,38]. It is observed that the values of the dc conductivity increase linearly with the amount of semi-conductive CoFe2O4 phase in the pellets (Figure 11d). Moreover, beyond 1 kHz, the values of the conductivity appear to merge at higher frequencies.

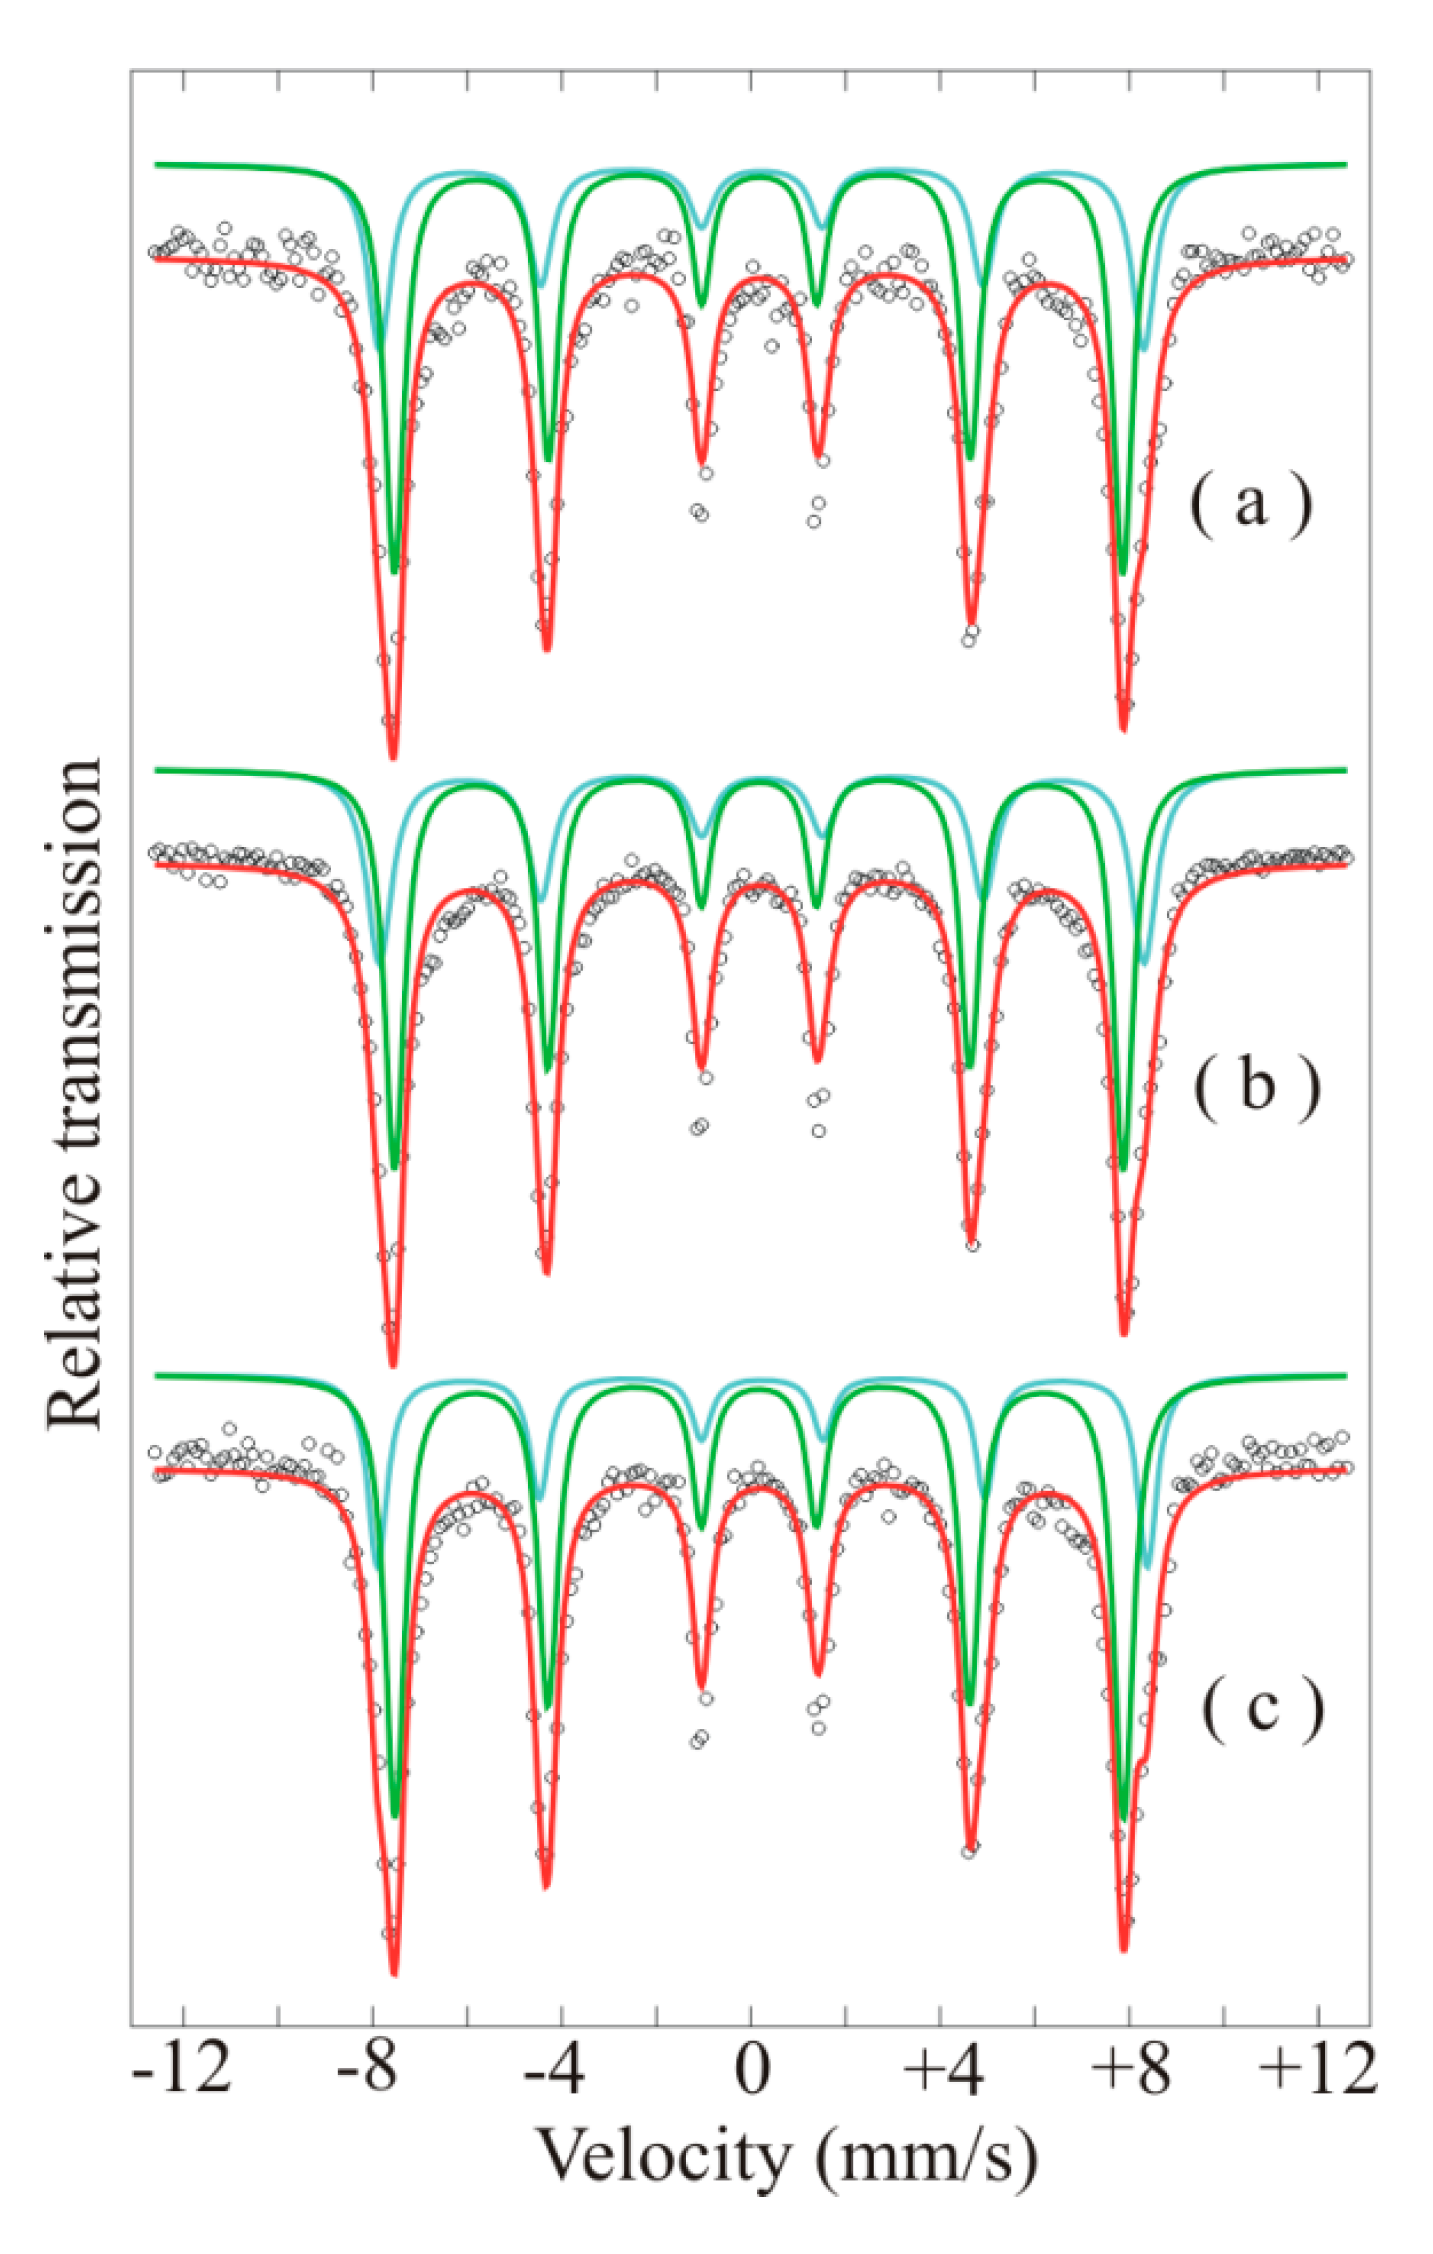
3.3. Mössbauer Spectroscopy Results

Co ferrite is an inverse spinel where, ideally, the tetrahedral sites are occupied by half of the Fe3+ ions, while the other half of the Fe3+ ions and the Co2+ ions are located on the octahedral sites. In real samples, cation disorder is common and the inversion degree is only partial. Some of the Co2+ ions are positioned on tetrahedral sites as well. Cationic distribution plays a crucial role in magnetism. However, these correlations are rarely shown in the literature. In this respect, 57Fe Mössbauer spectroscopy is a powerful method to probe the nature of magnetic ordering of Fe in ferrites, especially when partial inversion is present. The Mössbauer spectra of the powder samples are shown in Figure 12. Mössbauer spectra of all samples exhibit magnetically split sextets typical to ferrimagnetic spinels. The spectra were fitted using two magnetic sublattices corresponding to the Fe3+ ions located on the tetrahedral (T) and octahedral (O) coordination, respectively, coordinated by four and six oxygen atoms. No doublet due to superparamagnetic relaxation states or paramagnetic phases was observed. The hyperfine parameters and the relative areas of the two components, as well as the inversion degree and formula unit for the CoFe2O4, are shown in Table 3. Typical isomer shift (IS) and hyperfine magnetic field (Bhf) values for Co ferrites were obtained [39]. Quadrupole splitting values were very small (~10−2–10−3 mm/s) and are rather considered quadrupole corrections.
The chemical formula unit of the partially inverted CoFe2O4, giving the cationic distribution in the tetrahedral and octahedral positions, can be derived from the inversion parameter γ. The inversion degree is defined as the fraction of tetrahedral sites occupied by Fe3+ ions:
( C o 1 γ F e γ ) T e t r [ C o γ F e 2 γ ] O c t O 4
CoFe2O4 is completely inversed when x = 1. The degree of inversion can be estimated from the intensity ratio of the tetrahedral and octahedral sites obtained from the Mössbauer spectra, IT/IO, by the following relation:
I T I 0 = f T f 0 γ 2 γ
where fT/fO is the ratio of the recoilless fractions and is assumed to be 0.94 at room temperature and 1 at low temperatures [40].
Using Equation (2), the inversion degree and cationic distribution of the CoFe2O4 were obtained and are shown in Table 3, showing a partial inversion of CoFe2O4. The Mossbauer parameters account for Co ferrite in all three samples and are very similar, in agreement with [39]. The relative area of the sublattices are considerably influenced by cation occupation.

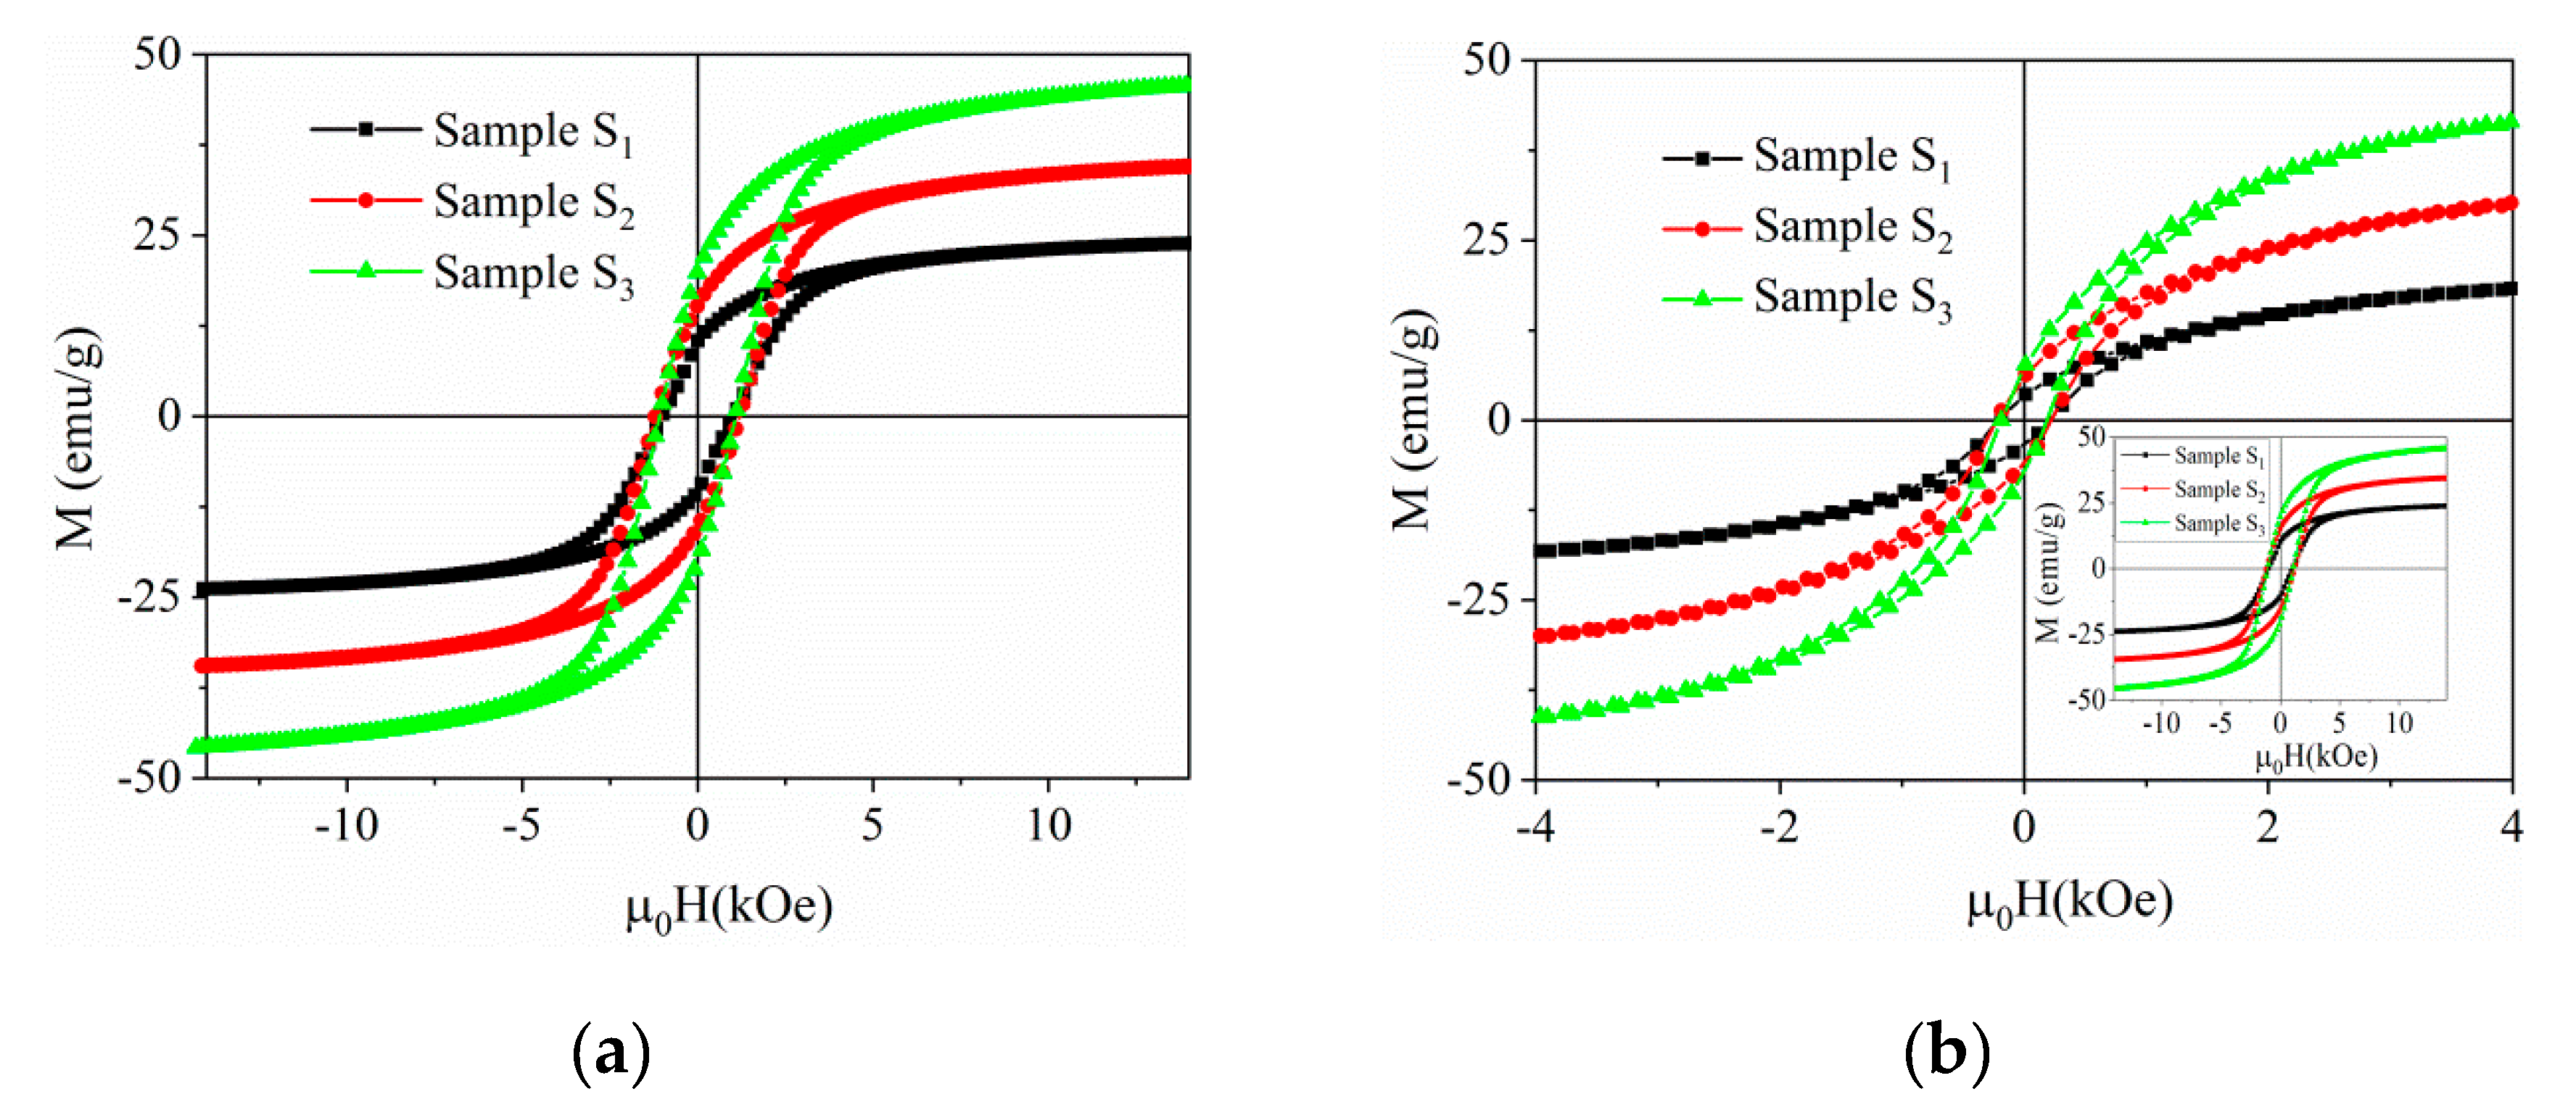
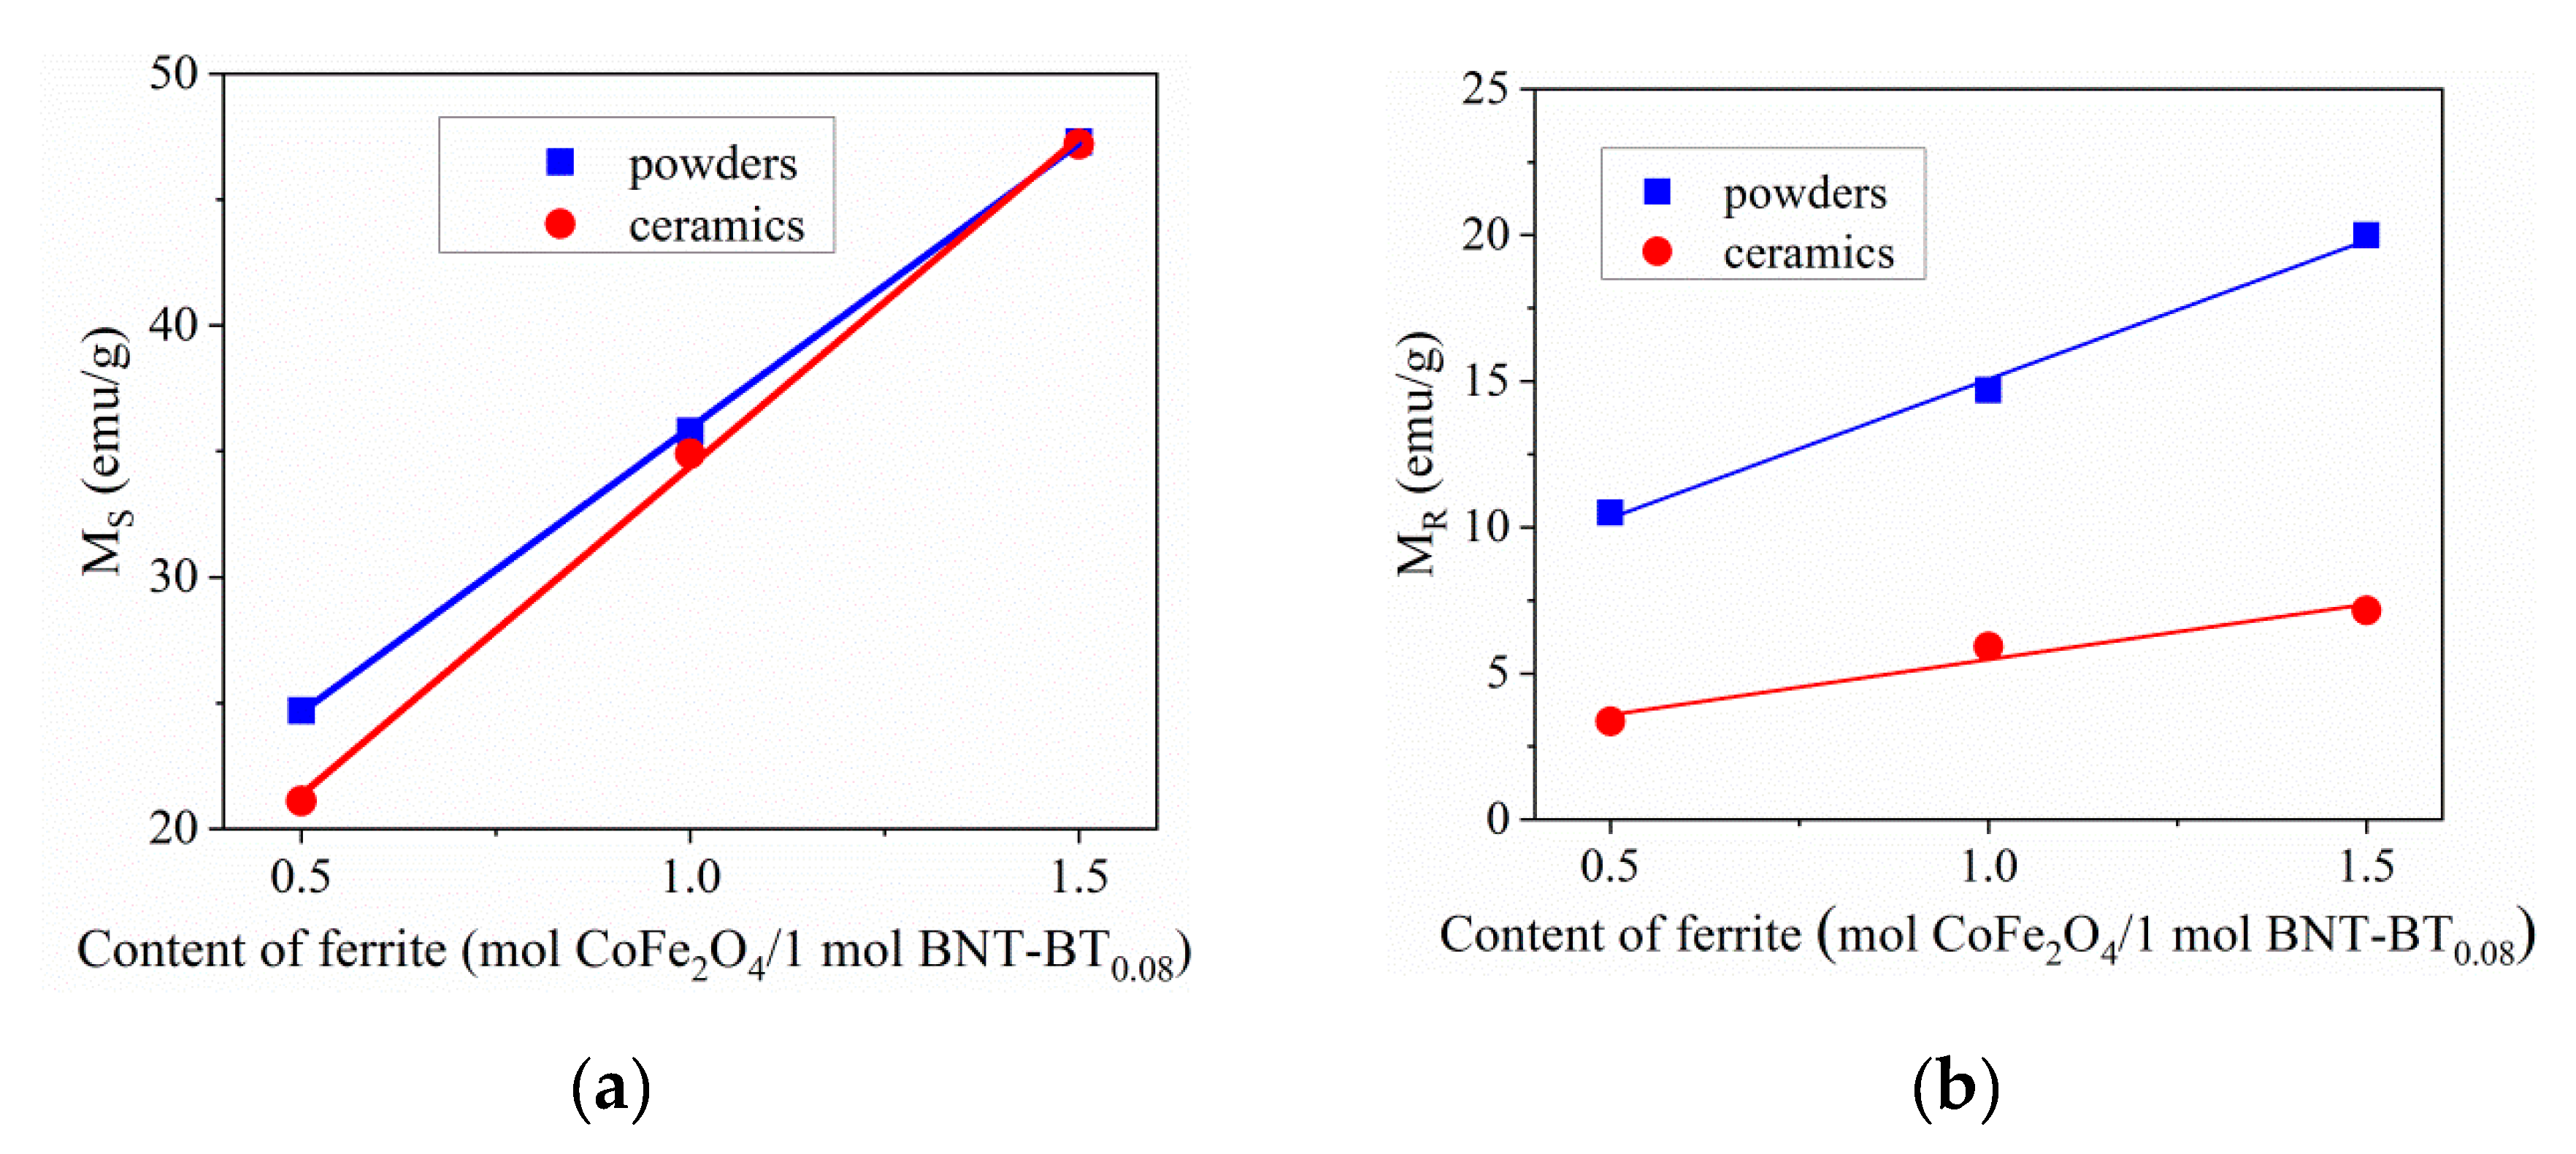
3.4. Magnetic Characterization

Figure 13 shows the magnetic field dependences of the magnetization measured at room temperature by vibrating sample magnetometry for BNT–BT0.08/CoFe2O4 core–shell nanocomposites, powders and ceramics. The extracted magnetic parameters are listed in Table 4. All samples showed ferrimagnetic-like behavior at room temperature. At the maximum applied field of 15 kOe, the magnetization of the samples was not completely saturated. Therefore, the law of approach to saturation (LAS) was applied:
M = M s ( 1 b H 2 ) + k H
where M is the magnetization, H is the applied magnetic field, MS is the saturation magnetization and κH is the so-called forced magnetization. The forced magnetization term can be neglected at room temperature in relatively low fields.
The saturation and remnant magnetization values of the BNT–BT0.08/CoFe2O4 core–shell nanostructures as a function of CoFe2O4 concentration are shown in Figure 14a,b.
As expected, the saturation and remanent magnetization values of the core–shell BNT–BT0.08/CoFe2O4 powders and ceramics increase linearly with the content of the magnetic CoFe2O4 coating while the amount of non-magnetic BNT–BT0.08 remains constant in the three samples. Moreover, the MS values were roughly similar for the powders and ceramics composites, suggesting that the sintering treatment does not strongly influence the saturation, given a certain concentration. However, the increase is not consistent with the ferrite content evolution due to different cationic distributions as evidenced by Mössbauer spectroscopy. Coercivity values in powder samples are high—even higher than single phase CoFe2O4 nanoparticles [32]—making the powder samples suitable for hard magnetic applications. The ceramics samples show thin magnetic hysteresis loops illustrating a soft magnetic behavior (Figure 13b). The coercivity is reduced multiple times in the ceramic samples relative to their powder counterparts (see Table 4). For both powder and ceramic samples, coercivity presents a non-monotonous variation with CoFe2O4 content: HC values for sample S3 (1.5 mol CoFe2O4/1 mol BNT–BT0.08) are higher than S1 (0.5 mol CoFe2O4/1 mol BNT–BT0.08) but lower than S2 (1 mol CoFe2O4/1 mol BNT–BT0.08). The lower coercivity of S3 may be related to a decrease of the stress anisotropy (due to microstructural strain) or to a decrease of the density of structural defects, similar to [42]. Further, the hysteresis loops of the powder samples are more closely approaching a rectangular shape relative to the corresponding ceramics, inducing higher squareness ratio values. Contrary to the ceramic samples, the hysteresis loops of the powder samples show a squareness ratio close to 0.5, thus approaching the ideal Stoner-Wohlfart case [43] for non-interacting uniaxial single domain particles with the easy axis being randomly oriented. Relative to other BNT–BT0.65/CoFe2O4 or BaTiO3/CoFe2O4 composites of similar CoFe2O4 content reported in the literature, our powder sample results show considerably higher saturation magnetization and coercivity values (see Table 4). The high-saturation magnetization obtained in Ref. [30] was achieved for a very high amount of CoFe2O4 relative to the BNT-BT0.08 component, approaching the case of the single phase CoFe2O4 nanoparticles [32]. The saturation magnetization obtained from magnetic measurements is reduced relative to the corresponding values calculated from the Mössbauer spectroscopy results. These differences cannot be explained solely by a partially inverted structure within the Néel model of ferrimagnetism of collinear spins. Spin canting phenomena can occur as a result of alteration of cation distribution due to chemical disorder (affecting the super-exchange interactions) and from broken exchange bonds causing magnetic topological frustration at the core-shell interface. The net magnetic moment per formula unit, nB (expressed in μB units), can be obtained by the following relation:
n B = M 0 cos ( θ R C S ) M T
where M0, MT are the net magnetic moments on the octahedral and tetrahedral sites, and θRCS is the canting angle at the octahedral site.
Using the values of the inversion degree determined by Mössbauer spectroscopy, the resulting canting angle values are approximately 31, 28 and 23 degrees for samples 1, 2 and 3, respectively. It may be observed that higher CoFe2O4 content induces a smaller canting angle and, therefore, better approaches the collinear spin structure.

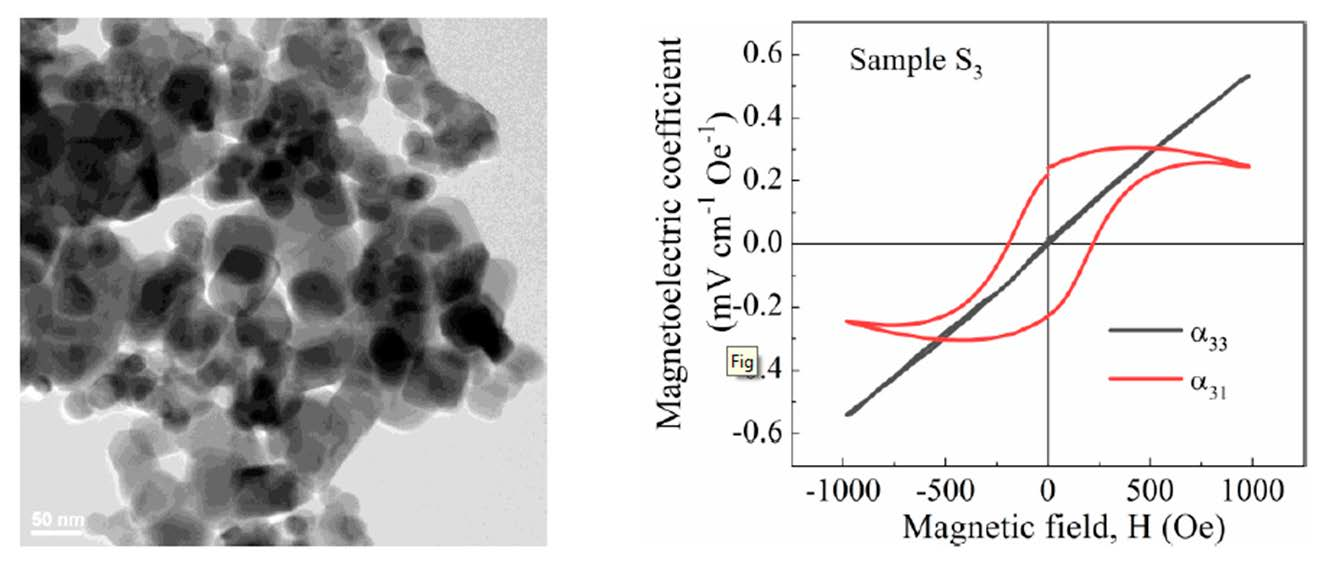
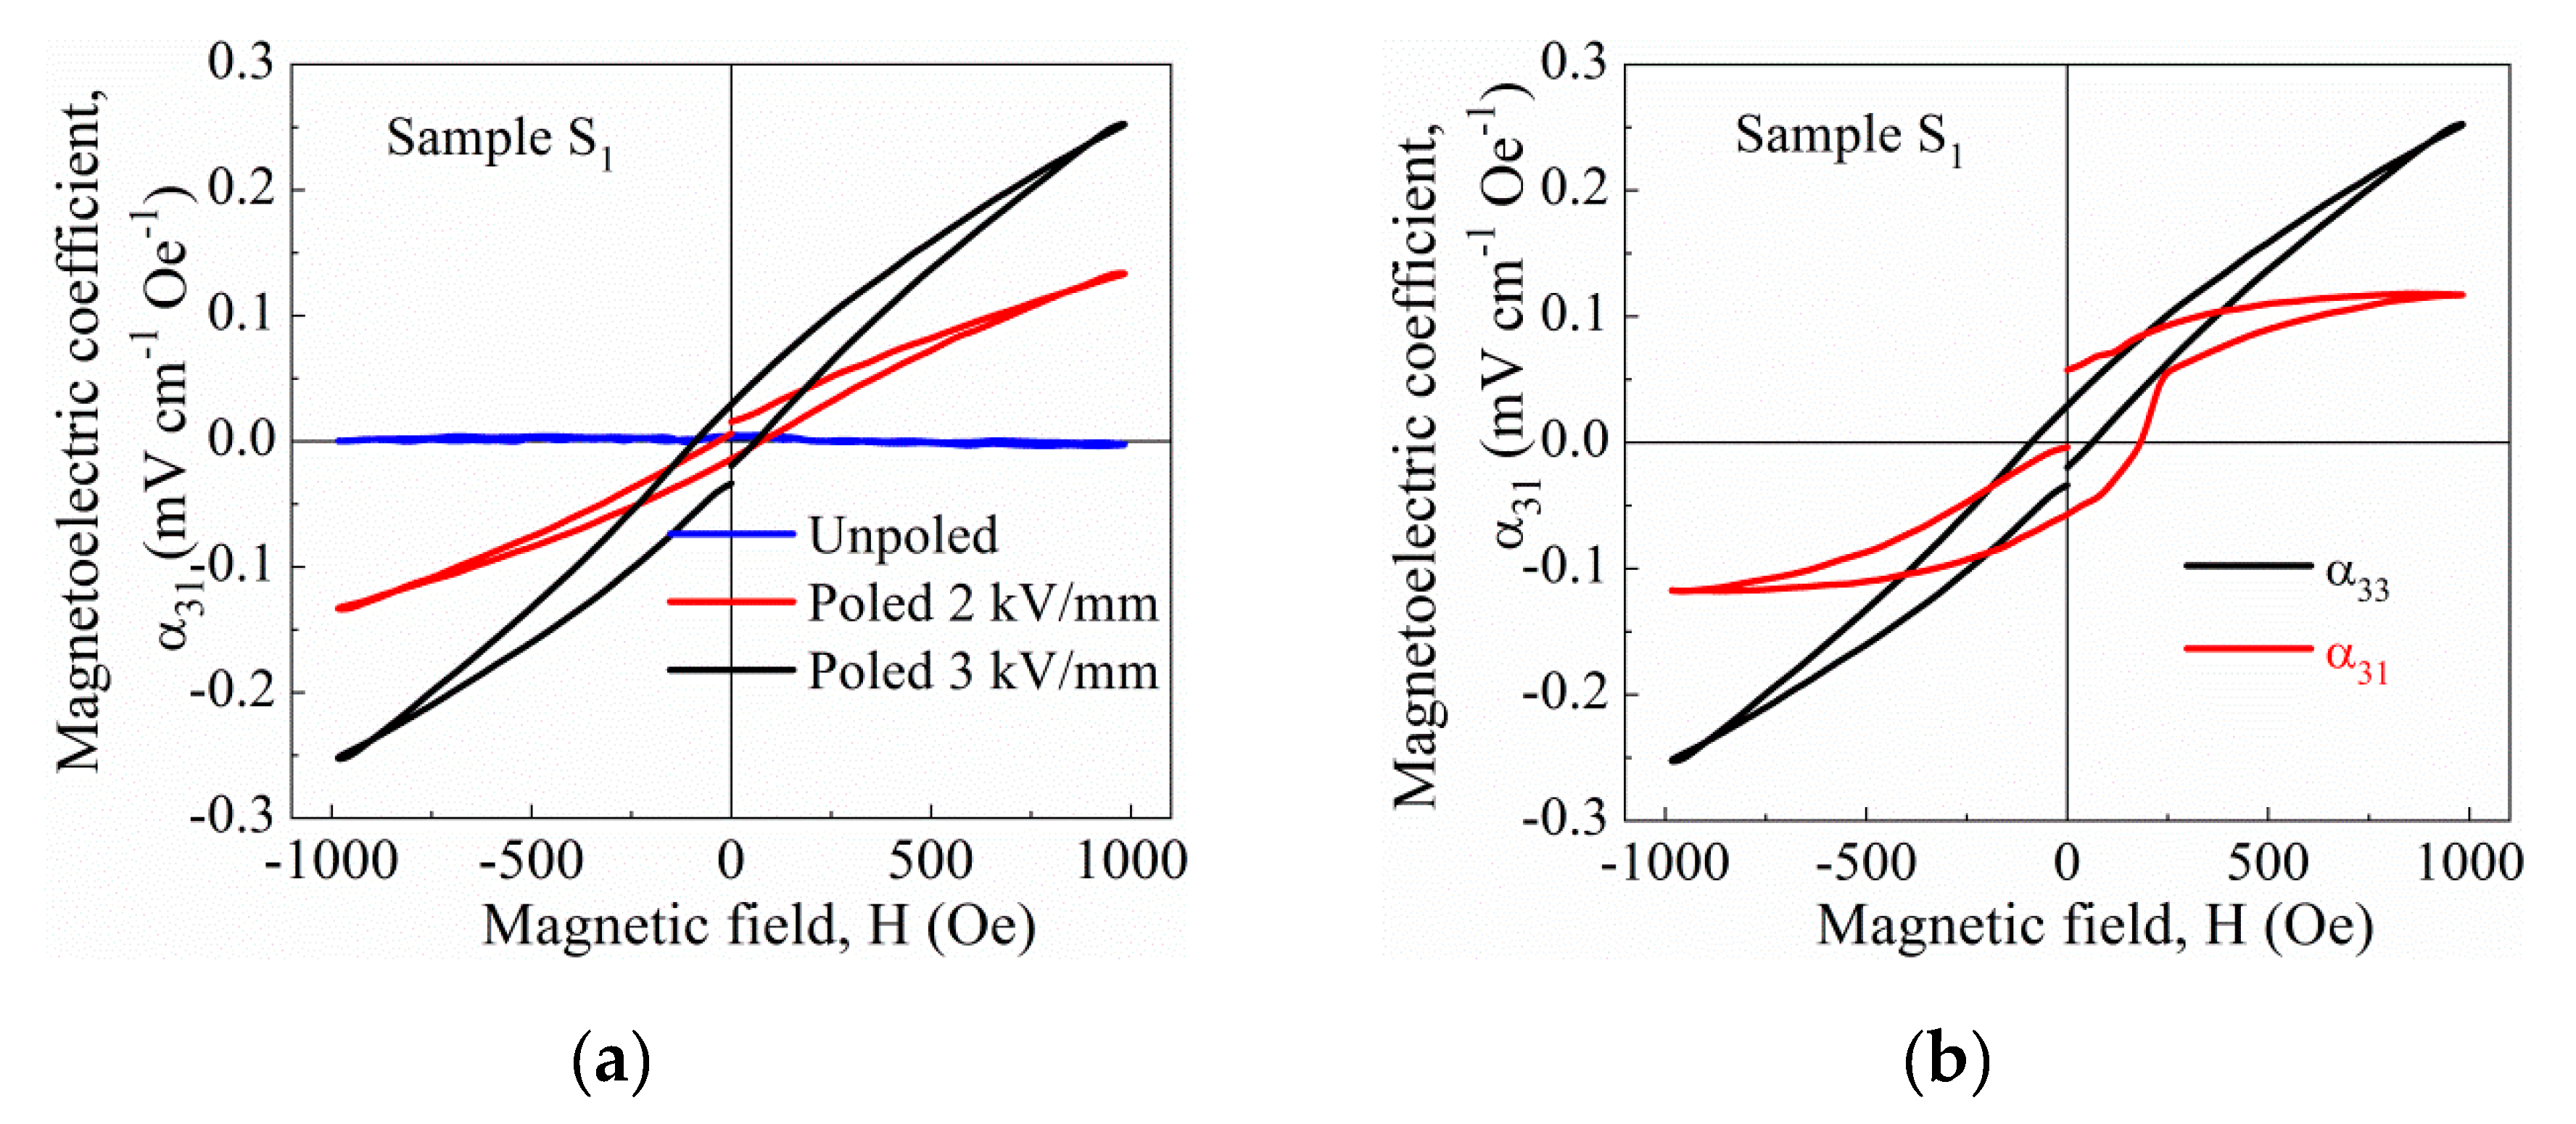
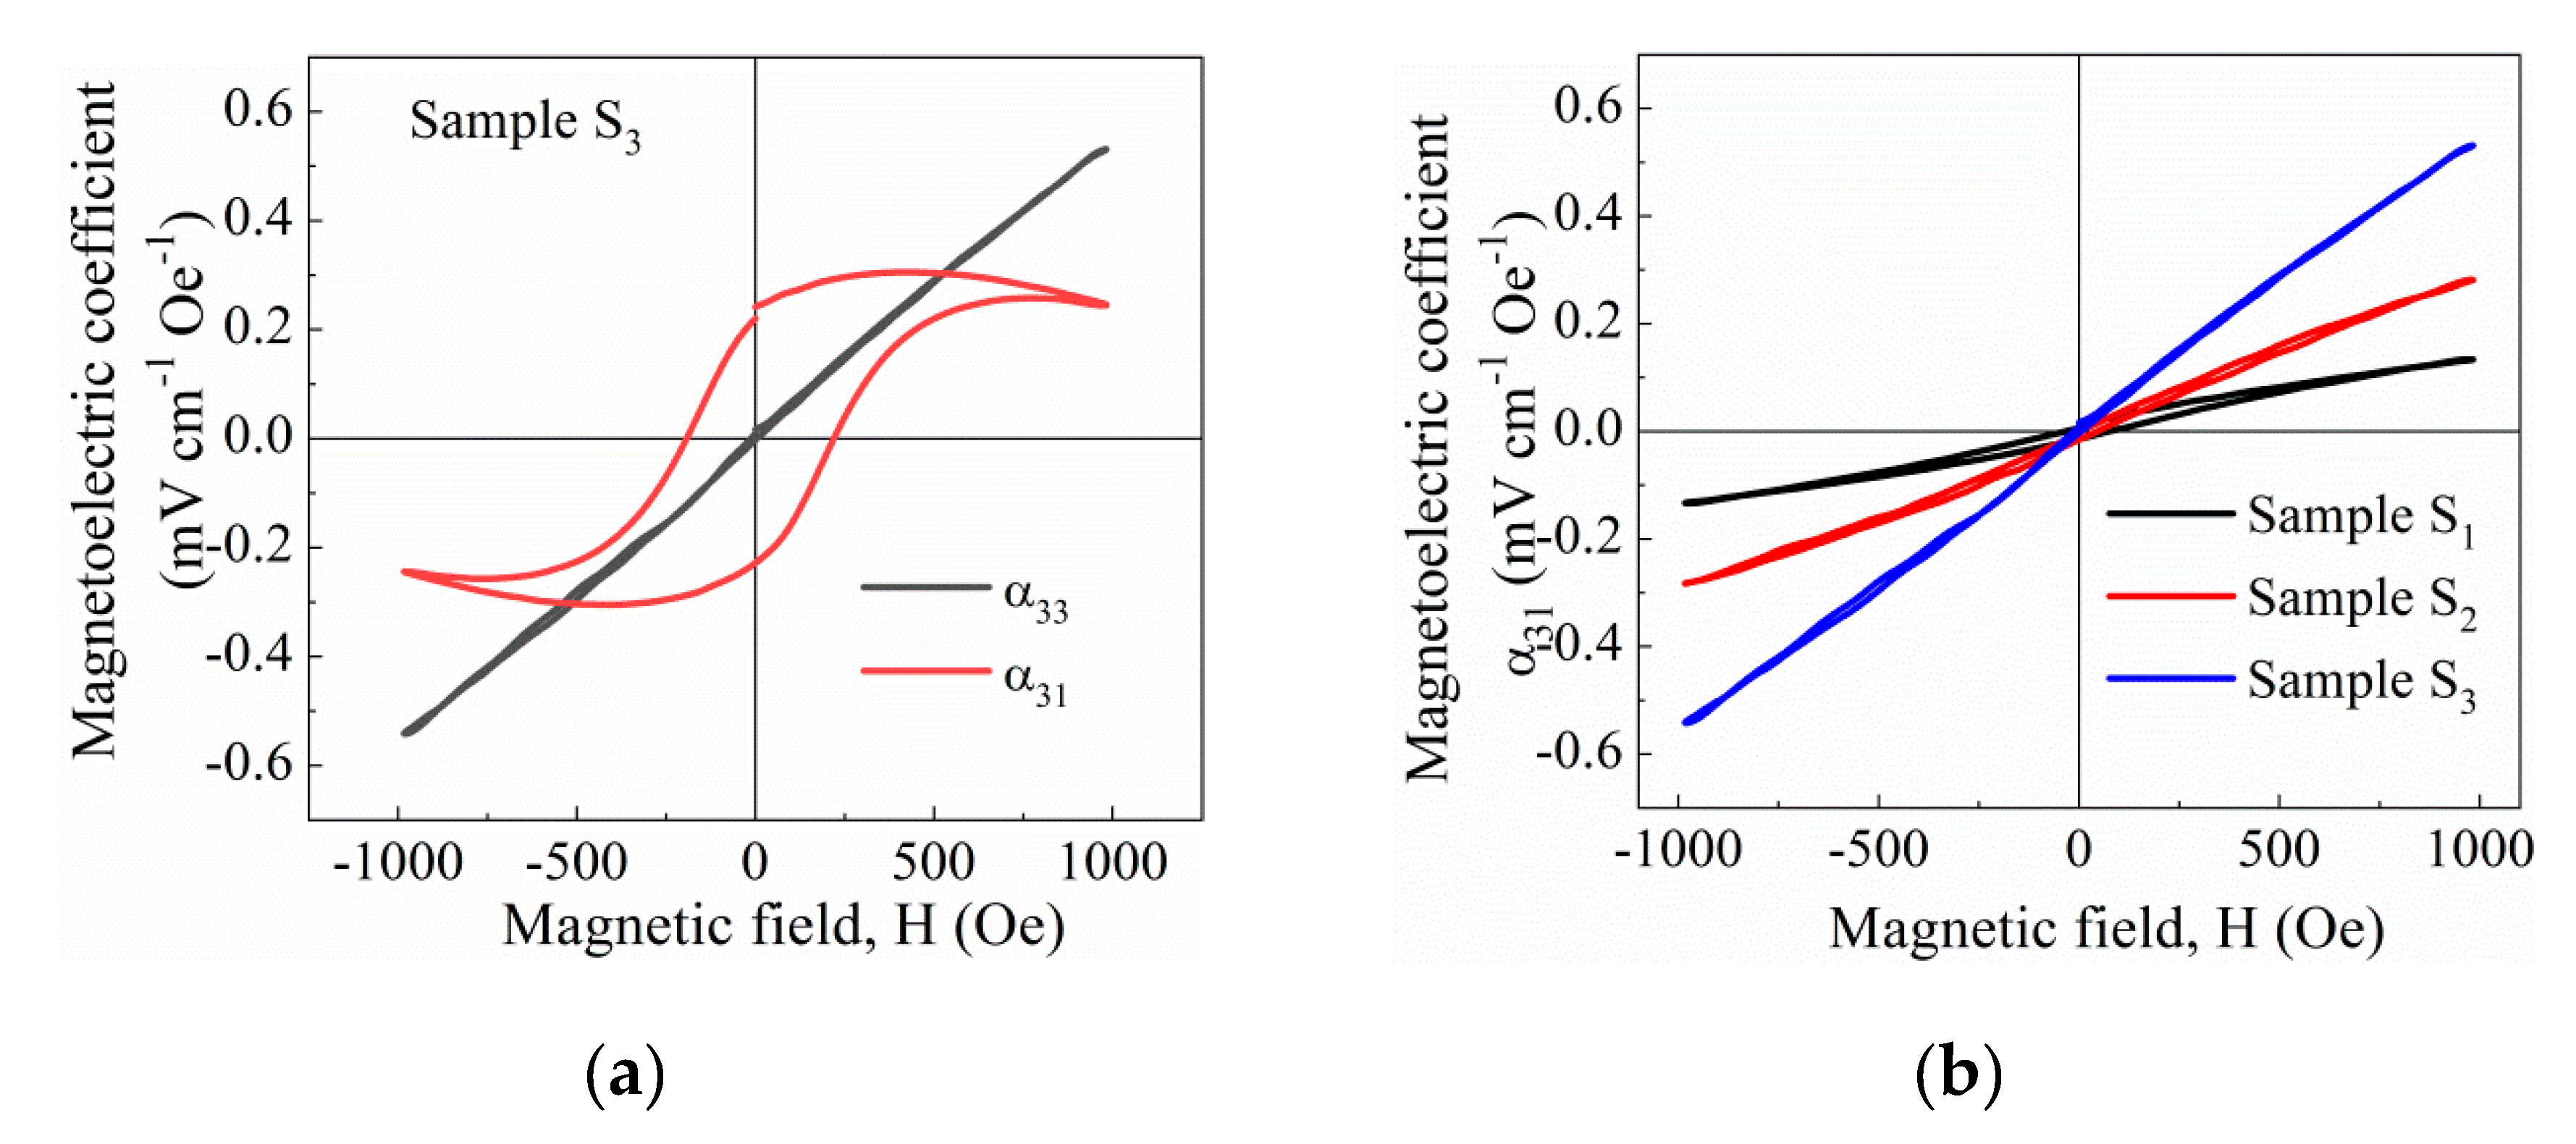
3.5. Magnetoelectric Voltage Response

Figure 15 shows the magnetoelectric voltage coefficients versus the DC magnetic field at room temperature for the BNT–BT0.08/CoFe2O4 core–shell ceramic with a 1:0.5 molar ratio (sample S1), measured in both longitudinal (α33) and transverse (α31) modes.
Sample S1 was previously poled at 2 and 3 kV/mm for 20 min at room temperature, which resulted in Berlincourt d33 piezoelectric coefficients of 2 and 5 pC/N. Hot poling was not possible because of non-negligible conduction, and higher electric fields resulted in large leakage currents that prevent the poling process. The d33 values achieved are rather low compared to figures from other particulate composites [3,10]. However, two issues must be taken into account: the high amount of CoFe2O4 phase in the composites, and the type of core-shell connectivity of these samples, in which the shell corresponds to the magnetic phase. This results in high conductivity values that prevent the application of high electric fields. Nevertheless, these samples could be poled up to 3 kV/mm and magnetoelectric coefficients measured. Note the increase of the longitudinal α33 with poling at increasing electric fields (Figure 15a), due to the higher d33 values achieved. Note also the difference between the longitudinal and transverse responses (Figure 15b) after poling at 3 kV/mm (d33 of 5 pC/N).
The magnetoelectric response of two-phase composites depends on a variety of different issues, such as the inherent properties of the constituent phases (permittivity, conductivity or the piezo-coefficients) or the quality of interfaces between them, but also on the measuring mode used, that is, the orientation of the magnetic field with respect to the polarization direction [44]. For particulate 0–3 composites, a larger signal is typically achieved in longitudinal mode (α33), in which magnetic fields are oriented parallel to the poling direction and the output voltage.
Figure 16a shows the magnetoelectric voltage coefficients versus DC magnetic field at room temperature for the BNT–BT0.08/CoFe2O4 core–shell ceramic with highest molar ratio (sample S3), measured in both longitudinal (α33) and transverse (α31) modes. This sample S3 could only be poled up to 2 kV/mm and a Berlincourt d33 coefficient of 6 pC/N resulted. Poling at higher fields resulted in very large leakage currents, due to a higher conductivity about one order of magnitude greater in this sample as compared to sample S1 (see also Figure 11d). Note again the difference between longitudinal and transverse responses, which is highly linear in the former and quite hysteretic for the latter, but also note that higher d33 and magnetoelectric responses achieved for sample S3 despite the lower poling field applied.. It should further be noted that the ME response measured is truly as demonstrated by their relationship with the polarization direction of the piezoelectric phase. In particular, if the sample is placed in the direction of polarization and in the opposite direction to the bias magnetic field, one obtains negative sign voltage. It must be stressed that we are considering the voltage response to a linear AC magnetic field, which strongly depends on the bias magnetization field; this type of curve in composites rules out the Faraday induction, which is indeed taken into account in our measurements. The linear and non-hysteretic response found in these composites could be very advantageous for applications in sensors and oscillators with low noise and high sensibility.
This difference between longitudinal and transverse responses is related to the shape magnetic anisotropy of the disc samples [45]. Indeed, in magnetoelectric composites, these curves are tightly related to the effective piezomagnetic coefficient, which can be eventually extracted from the magnetization hysteresis curves [44]. A peak value should be obtained at the position of maximum piezomagnetic coefficient, that is, the bias field for maximum response in CoFe2O4 is typically above 1 kOe [46]. Note, finally, the higher longitudinal α33 achieved with increasing the content of magnetic phase in these core-shell composites (Figure 16b). This may likely be due to the greater d33 achieved at equal poling fields (that is, samples S1, S2 and S3 results in d33 of 2, 4 and 6 pC/N, respectively, after poling at 2 kV/mm).

4. Conclusions

Multiferroic BNT–BT0.08/CoFe2O4 core–shell composites with uniform–nanosized grains were successfully fabricated using the sol–gel technique. The XRD analyses indicated the presence of two different crystallographic phases, BNT–BT0.08 and CoFe2O4. Additionally, from Rietveld analysis we showed that the values of the average crystallite size for CoFe2O4 phases decrease with increasing CoFe2O4 amount, whilst the tetragonality (c/a ratio) of the core shell samples decreases as the content of CoFe2O4 increases. As expected, the XPS results showed an increase in composition for Fe3+ and Co2+ ions with no modification of valence, thus confirming the X-Ray results. The TEM images proved the presence of core–shell microstructure of the BNT–BT0.08/CoFe2O4 nanocomposites.
Furthermore, the CoFe2O4 content has a significant influence on dielectric and magnetic properties, which consequently influences the magnetoelectric measurements. The magnetic properties of the BNT–BT0.08/CoFe2O4 revealed a close connection with the local structure of CoFe2O4. The remnant magnetization and saturation magnetization of the BNT–BT0.08/CoFe2O4 powders and ceramics increase with CoFe2O4 content. The coercivity increases with CoFe2O4 content except for the third sample, which has a higher CoFe2O4 contribution. This behavior could be related to a decrease of the stress anisotropy or to a decrease of the density of structural defects. The conductivity of the composites increases with increasing concentration of CoFe2O4. The piezoelectric and the magnetoelectric coefficients, measured in the longitudinal mode, increase and also with increase of the content of the magnetic phase. The maximum ME coefficient of the composite reaches up to about 0.6 mV/cm Oe.
Last, but not least, high attention should be focused on increasing the poling efficiency in this type of inverse core-shell magnetoelectric composites (with magnetic phase at the shell), in order to enhance the degree of polarization achieved, and thus the magnetoelectric voltage responses.

Author Contributions

M.C. carried out the synthesis of the materials and wrote the manuscript together with R.R.. P.G. and R.R. performed the dielectric measurements and analyzed the experimental data. H.A. performed the magnetoelectric measurements and commented on the results. S.G.G. analyzed the Mössbauer spectroscopy and magnetic results. B.S.V. handled the TEM characterization. V.A.S. performed the XRD analysis. R.T. conducted SEM characterization. M.H. participated at the sol-gel synthesis. C.G. discussed the results and commented on the manuscript. All authors have read and agreed to the published version of the manuscript.

Funding

This research received no external funding.

Acknowledgments

The authors gratefully acknowledge the financial support from Core Program PN19–0.3 (Contract No. 21 N/08.02.2019) from the Romanian Ministry of Research. R. Radu is most thankful to R.M. Costescu for her engagement in performing XPS measurements. The SEM spectroscopy characterization was possible due to the Project POSCCE, No.638/12.03.2014. H. Amorín acknowledges financial support from Spanish MINECO project MAT2017-88788-R.

Conflicts of Interest

The authors declare no conflict of interest.

References

  1. Cotica, L.F. Surface spin disorder effects in magnetite and poly(thiophene)-coated magnetite nanoparticles. J. Appl. Phys. 2010, 108, 064325. [Google Scholar] [CrossRef] [Green Version]
  2. Ryu, J. Magnetoelectric effect in composites of magnetostrictive and piezoelectric materials. J. Electroceram. 2002, 8, 107–119. [Google Scholar] [CrossRef]
  3. Wu, J.; Fan, Z.; Xiao, D.; Zhu, J.; Wang, J. Multiferroic bismuth ferrite-based materials for multifunctional applications: Ceramic bulks, thin films and nanostructures. Prog. Mater. Sci. 2016, 84, 335–402. [Google Scholar] [CrossRef] [Green Version]
  4. Wang, Y.; Grey, D.; Berry, D.; Gao, J.; Li, M.; Li, J.; Viehland, D. An Extremely Low Equivalent Magnetic Noise Magnetoelectric Sensor. Adv. Mater. 2011, 23, 4111–4114. [Google Scholar] [CrossRef]
  5. Marauska, S.; Jahns, R.; Kirschof, C.; Klaus, M.; Quandt, E.; Knochel, R.; Wagner, B. Highly sensitive wafer-level packaged MEMS magnetic field sensor based on magnetoelectric composites. Sens. Actuators A Phys. 2013, 189, 321–327. [Google Scholar] [CrossRef]
  6. Dong, S.; Zhai, J.; Li, J.F.; Viehland, D.; Priya, S. Multimodal system for harvesting magnetic and mechanical energy. Appl. Phys. Lett. 2008, 93, 103511–103513. [Google Scholar] [CrossRef] [Green Version]
  7. Liu, L. Multiferroic ferrite/perovskite oxide core/shell nanostructures. J. Mater. Chem. 2010, 20, 10665–10670. [Google Scholar] [CrossRef]
  8. Oliveira, P.N.; Silva, D.M.; Dias, G.S.; Santos, I.A.; Cotica, L.F. Synthesis and physical property measurements of CoFe2O4:BaTiO3 core–shell composite nanoparticles. Ferroelectrics 2016, 499, 76–82. [Google Scholar] [CrossRef]
  9. Cernea, M.; Ciuchi, I.V.; Vasile, B.S.; Surdu, V.A.; Bartha, C.; Iuga, A.; Galizia, P.; Galassi, C. Composite BNT-BT0.08/CoFe2O4 with core-shell nanostructure for piezoelectric and ferromagnetic applications. Mater. Sci. Eng. B 2019, 240, 7–15. [Google Scholar] [CrossRef]
  10. Yang, H.; Zhang, G.; Chen, X.; Zhou, H. Observation of magnetoelectric coupling and the electrical properties in 0.65BaTiO3–0.35Bi0.5Na0.5TiO3/CoFe2O4 particulate composites. J. Mater. Sci. Mater. Electron. 2015, 26, 6107–6112. [Google Scholar] [CrossRef]
  11. Gao, X.; Rodriguez, B.J.; Liu, L.; Birajdar, B.; Pantel, D.; Ziese, M.; Alexe, M.; Hesse, D. Microstructure and properties of well ordered multiferroic Pb(Zr,Ti)O3/CoFe2O4 nanocomposites. ACS Nano 2010, 4, 1099–1107. [Google Scholar] [CrossRef]
  12. Ryu, H.; Murugavel, P.; Lee, J.H.; Chae, S.C.; Noh, T.W.; Oh, Y.S.; Kim, H.J.; Kim, K.H.; Jang, J.H.; Kim, M.; et al. Magnetoelectric effects of nanoparticulate Pb(Zr0.52Ti0.48)O3–NiFe2O4. Appl. Phys. Lett. 2006, 89, 102907. [Google Scholar] [CrossRef] [Green Version]
  13. Corral-Flores, V.; Bueno-Baques, D.; Ziolo, R.F. Synthesis and characterization of novel CoFe2O4–BaTiO3 multiferroic core-shell-type nanostructures. Acta Mater. 2010, 58, 764–769. [Google Scholar] [CrossRef]
  14. Shvartsman, V.V.; Alawneh, F.; Borisov, P.; Kozodaev, D.; Lupascu, D.C. Converse magnetoelectric effect in CoFe2O4–BaTiO3 composites with a core–shell structure. Smart Mater. Struct. 2011, 20, 075006. [Google Scholar] [CrossRef] [Green Version]
  15. Betal, S.; Dutta, M.; Cotica, L.F.; Bhalla, A.; Guo, R. BaTiO3 Coated CoFe2O4–Core-Shell Magnetoelectric Nanoparticles (CSMEN) Characterization. Integr. Ferroelectr. 2015, 166, 225–231. [Google Scholar] [CrossRef]
  16. Chaudhuri, A.; Mandal, K. Large magnetoelectric properties in CoFe2O4:BaTiO3 core–shell nanocomposites. J. Magn. Magn. Mater. 2015, 377, 441–445. [Google Scholar] [CrossRef]
  17. Zhou, J.P.; Lv, L.; Liu, Q.; Zhang, Y.X.; Liu, P. Hydrothermal synthesis and properties of NiFe2O4@BaTiO3 composites with well–matched interface. Sci. Technol. Adv. Mater. 2012, 13, 045001. [Google Scholar] [CrossRef] [PubMed]
  18. Jnaneshwara, D.M.; Avadhani, D.N.; Prasad, B.D.; Nagabhushana, B.M.; Nagabhushana, H.; Sharma, S.C.; Shivakumara, C.; Rao, J.L.; Gopal, N.O.; Ke, S.C.; et al. Electron paramagnetic resonance, magnetic and electrical properties of CoFe2O4 nanoparticles. J. Magn. Magn. Mater. 2013, 339, 40–45. [Google Scholar] [CrossRef]
  19. Cernea, M.; Montanari, G.; Galassi, C.; Costa, A.L. Synthesis of La and Nb doped PZT powder by the gel–combustion method. Nanotechnology 2006, 17, 1731–1735. [Google Scholar] [CrossRef]
  20. Chakrabarti, N.; Maiti, H.S. Improved process for preparation of lead zirconate titanate powder, IN189960-B. 24 May 2003. [Google Scholar]
  21. Brand, R.A. Improving the validity of hyperfine field distributions from magnetic alloys. Nucl. Instrum. Method B 1987, 28, 398–416. [Google Scholar] [CrossRef]
  22. Jones, G.O.; Thomas, P.A. Investigation of the structure and phase transitions in the novel A-site substituted distorted perovskite compound Na0.5Bi0.5TiO3. Acta Crystallogr. Sect. B Struct. Sci. 2002, 58, 168–178. [Google Scholar] [CrossRef] [PubMed] [Green Version]
  23. Teillet, J.; Bouree, F.; Krishnan, R. Magnetic structure of CoFe2O4. J. Magn. Magn. Mater. 1993, 123, 93–96. [Google Scholar] [CrossRef]
  24. Teodorescu, C.M.; Esteva, J.M.; Karnatak, R.C.; El Afif, A. An approximation of the Voigt I profile for the fitting of experimental X-ray absorption data. Nucl. Instrum. Method Phys. Res. Sect. A 1994, 345, 141–147. [Google Scholar] [CrossRef]
  25. Shirley, D.A. High-Resolution X-Ray Photoemission Spectrum of the valence bands of gold. Phys. Rev. 1972, 55, 4709–4714. [Google Scholar] [CrossRef] [Green Version]
  26. Mardare, D.; Luca, D.; Teodorescu, C.M.; Macovei, D. On the hydrophilicity of nitrogen-doped TiO2 thin films. Surf. Sci. 2007, 601, 4515–4520. [Google Scholar] [CrossRef]
  27. Wang, W.P.; Yang, H.; Xian, T.; Jiang, J.L. XPS and magnetic properties of CoFe2O4 nanoparticles synthesized by a polyacrylamide gel route. Mater. Trans. 2012, 53, 1586–1589. [Google Scholar] [CrossRef] [Green Version]
  28. Hou, D.F.; Hu, X.L.; Wen, Y.W.; Shan, B.; Hu, P. Electrospun sillenite Bi12MO20 (M = Ti, Ge, Si) nanofibers: General synthesis, band structure, and photocatalytic activity. Phys. Chem. Chem. Phys. 2013, 15, 20698–20705. [Google Scholar] [CrossRef]
  29. Wagner, C.D.; Davis, L.E.; Zeller, M.V.; Taylor, J.A.; Raymond, R.M.; Gale, L.H. Empirical atomic sensitivity factors for quantitative analysis by electron spectroscopy for chemical analysis. Surf. Interface Anal. 1981, 3, 211–225. [Google Scholar] [CrossRef]
  30. Kumar, A.; Singh, B.P.; Choudhary, R.N.P.; Thakur, A.K. Characterization of electrical properties of Pb-modified BaSnO3 using impedance spectroscopy. Mater. Chem. Phys. 2006, 99, 150–159. [Google Scholar] [CrossRef]
  31. Behera, B.; Nayak, P.; Choudhary, R.N.P. Impedance spectroscopy study of NaBa2V5O15 ceramic. J. Alloys Compds. 2007, 436, 226–232. [Google Scholar] [CrossRef]
  32. Hao, J.; Xu, Z.; Chu, R.; Li, W.; Du, J. Lead-free electrostrictive (Bi0.5Na0.5)TiO3–(Bi0.5K0.5)TiO3–(K0.5Na0.5)NbO3 ceramics with good thermostability and fatigue-free behavior. J. Mater. Sci. 2015, 50, 5328–5336. [Google Scholar] [CrossRef]
  33. Jamnik, J.; Maier, J. Generalised equivalent circuits for mass and charge transport: Chemical capacitance and its implications. Phys. Chem. Chem. Phys 2001, 3, 1668–1678. [Google Scholar] [CrossRef]
  34. Padmasree, K.P.; Kanchan, D.K.; Kulkami, A.R. Impedance and Modulus studies of the solid electrolyte system 20CdI2–80[xAg2O–y(0.7V2O5–0.3B2O3)], where 1 ≤ x/y ≤ 3. Solid State Ionics 2006, 177, 475–482. [Google Scholar] [CrossRef]
  35. Ncib, W.; Ben Jazia Kharrat, A.; Wederni, M.A.; Chniba-Boudjada, N.; Khirouni, K.; Boujelben, W. Investigation of structural, electrical and dielectric properties of sol-gel prepared La0.67-xEuxBa0.33Mn0.85Fe0.15O3 (x = 0.0, 0.1) manganites. J. Alloys Compd. 2018, 768, 249–262. [Google Scholar] [CrossRef]
  36. Costa, M.M.; Pires, G.F.M.; Terezo, A.J., Jr.; Grac¸, M.P.F.; Sombra, A.S.B. Impedance and modulus studies of magnetic ceramic oxide Ba2Co2Fe12O22(Co2Y) doped with Bi2O3. J. Appl. Phys. 2011, 110, 034107. [Google Scholar] [CrossRef]
  37. Yordanov, S.P.; Ivanov, I.; Carapanov, C.P. Dielectric properties of the ferroelectric Bi2Ti2O7 ceramics. J. Phys. D 1998, 31, 800–806. [Google Scholar] [CrossRef]
  38. Shi, M.; Zuo, R.; Xu, Y.; Jiang, Y.; Yu, G.; Su, H.; Zhong, J. Preparation and characterization of CoFe2O4 powders and films via the sol–gel method. J. Alloys Compd. 2012, 512, 165–170. [Google Scholar] [CrossRef]
  39. Greenwood, N.N.; Gibb, T.C. Mossbauer Spectroscopy; Chapman and Hall Ltd.: London, UK, 1971. [Google Scholar]
  40. Sawatzky, G.A.; Van Der Woude, F.; Morrish, A. H Recoilless-Fraction Ratios for Fe57 in Octahedral and Tetrahedral Sites of a Spinel and a Garnet. Phys. Rev. 1969, 183, 383–386. [Google Scholar] [CrossRef]
  41. Cernea, M.; Vasile, B.S.; Ciuchi, I.V.; Surdu, V.A.; Bartha, C.; Iuga, A.; Galizia, P.; Galassi, C. Synthesis and characterization of novel ferrite–piezoelectric multiferroic core–shell-type structure. J. Mater. Sci. 2018, 53, 9650–9661. [Google Scholar] [CrossRef]
  42. Chagas, E.F.; Ponce, A.S.; Prado, R.J.; Silva, G.M.; Bettini, J. Baggio-Saitovitch, Thermal effect on magnetic parameters of high-coercivity cobalt ferrite. J. Appl. Phys. 2014, 116, 033901. [Google Scholar] [CrossRef] [Green Version]
  43. Stoner, E.C.; Wohlfarth, E.P. A mechanism of magnetic hysteresis in heterogeneous alloys. Philos. Trans. R. Soc. A 1948, 240, 599–644. [Google Scholar] [CrossRef]
  44. Amorín, H.; Algueró, M.; Del Campo, R.; Vila, E.; Ramos, P.; Dolle, M.; Romaguera-Barcelay, Y.; Pérez de la Cruz, J.; Castro, A. High-sensitivity piezoelectric perovskite for magnetoelectric composites. Sci. Technol. Adv. Mater. 2015, 16, 016001. [Google Scholar] [CrossRef] [PubMed]
  45. Bichurin, M.I.; Petrov, V.M.; Priya, S. Magnetoelectric Multiferroic Composites. In Ferroelectrics—Physical Effects; Lallart, M., Ed.; InTech: Chicago, IL, USA, 2011; pp. 277–302. [Google Scholar]
  46. Santa-Rosa, W.; da Silva, P.S.; M’Peko, J.C.; Amorín, H.; Algueró, M.; Venet, M. Enhanced piezomagnetic coefficient of cobalt ferrite ceramics by Ga and Mn doping for magnetoelectric applications. J. App. Phys. 2019, 125, 075107. [Google Scholar] [CrossRef]
Figure 1. XRD patterns of the BNT–BT0.08/CoFe2O4 core–shell powders: (a) sample S1, (b) sample S2, (c) sample S3 calcined at 700 °C for 1 h in air.
Nanomaterials 10 00672 g001
Figure 2. SEM micrographs at two magnifications of the BNT–BT0.08/CoFe2O4 core–shell powders samples: (a), (b) S1; (c), (d) S2 and (e), (f) S3.
Nanomaterials 10 00672 g002
Figure 3. (a) Bright field TEM (BF–TEM) image, (b) High Resolution-Transmission Electron Microscopy (HR–TEM) and (c) corresponding selected area electron diffraction (SAED) patterns of the BNT–BT0.08/CoFe2O4 core–shell powder (sample S1).
Nanomaterials 10 00672 g003
Figure 4. (a) BF–TEM image, (b) HR–TEM and (c) corresponding SAED patterns of the BNT–BT0.08/CoFe2O4 core–shell powder (sample S2).
Nanomaterials 10 00672 g004
Figure 5. (a) BF–TEM image, (b) HR–TEM and (c) corresponding SAED patterns of the BNT–BT0.08/CoFe2O4 core–shell powder (sample S3).
Nanomaterials 10 00672 g005
Figure 6. Core levels photoemission of: (a) Fe 2p; (b) Co 2p; (c) Ti 2p and Bi 4d measured on the BNT–BT0.08/CoFe2O4 core–shell powders (samples S1, S2 and S3).
Nanomaterials 10 00672 g006
Figure 7. The atomic composition, determined from core levels photoemission of Fe 2p, Co 2p, Ti 2p and Bi 4d, for the samples S1S3.
Nanomaterials 10 00672 g007
Figure 8. Frequency dependence of the (a) real and (b) imaginary part of impedance measured at room temperature. The dots represent the experimental data whilst the solid lines represent the best linear fit.
Nanomaterials 10 00672 g008
Figure 9. 3D Cole–Cole plots of impedance, measured at room temperature, of the BNT–BT0.08/CoFe2O4 sintered ceramics. The symbols represent the experimental data whereas the solid lines are the results of the fitting procedure using the equivalent circuit modeled with the EIS Spectrum Analyzer.
Nanomaterials 10 00672 g009
Figure 10. (a) Frequency dependence of imaginary part (M″) of the dielectric modulus; (b) the normalized plots (M″/M″ max) versus log (f/fmax).
Nanomaterials 10 00672 g010
Figure 11. Frequency dependence of: (a) the real part of the permittivity (ε′). The inset shows the imaginary part of the permittivity, (b) loss tangent, (c) AC conductivity for the sintered ceramics samples S1S3, and (d) the DC conductivity as function of the CoFe2O4 content.
Nanomaterials 10 00672 g011aNanomaterials 10 00672 g011b
Figure 12. Mössbauer spectra of the powder samples S1 (a), S2 (b) and S3 (c).
Nanomaterials 10 00672 g012
Figure 13. Room temperature magnetization hysteresis loops of BNT–BT0.08/CoFe2O4 core–shell powders (a) and ceramics (b) in 1:0.5, 1:1 and 1:1.5 molar ratios (sample S1, sample S2 and sample S3). The inset of (b) shows an extended view of the corresponding hysteresis curves.
Nanomaterials 10 00672 g013
Figure 14. Room temperature saturation (a) and remanent (b) magnetization values of BNT–BT0.08/CoFe2O4 core–shell powders and ceramics vs. content of CoFe2O4 (the lines connecting the experimental data are linear fittings).
Nanomaterials 10 00672 g014
Figure 15. Room-temperature magnetoelectric coefficients as a function of DC magnetic field of BNT–BT0.08/CoFe2O4 core-shell ceramic with a 1:0.5 molar ratio (sample S1): (a) measured in the longitudinal mode (α33) after poling at increasing electric fields, and (b) measured in both longitudinal (α33) and transverse (α31) modes after poling at 3 kV/mm.
Nanomaterials 10 00672 g015
Figure 16. Room temperature magnetoelectric coefficients as a function of DC magnetic field of BNT–BT0.08/CoFe2O4 core–shell ceramics: (a) for sample with 1:1.5 molar ratio (sample S3) measured in both longitudinal (α33) and transverse (α31) modes after poling at 2 kV/mm, and (b) for ceramics with 1:0.5, 1:1 and 1:1.5 molar ratios (sample S1, sample S2 and sample S3).
Nanomaterials 10 00672 g016
Table 1. Rietveld refinement results for the BNT–BT0.08/CoFe2O4 core–shell powders.
PowdersS1: 1:0.5S2: 1:1S3: 1:1.5
BNT–BT0.08CoFe2O4BNT–BT0.08CoFe2O4BNT–BT0.08CoFe2O4
a [Å]5.51928.37745.52318.38725.52608.3777
b [Å]5.51928.37745.52318.38725.52608.3777
c [Å]3.91268.37743.91378.38723.90648.3777
c/a0.7089 0.7086 0.7069
Volume [Å3]119.1825587.9251119.3868588.3788119.2883587.9922
Rexp5.86664.66764.2794
Rp3.30932.67392.5936
Rwp4.29083.45123.3441
χ20.53490.54670.6107
Average crystallite size, D [nm]28.3226.7631.6425.2629.0422.16
Table 2. Dielectric properties measured at room temperature for the BNT–BT0.08/CoFe2O4 core–shell ceramics.
SamplePermittivity εr, at 1 kHzTan δ, at 1kHzConductivity σdc, (S/cm)
S1, ceramic5150.6321.66 × 10−9
S2, ceramic4681.0866.27 × 10−9
S3, ceramic3181.7501.36 × 10−8
Table 3. Hyperfine parameters, relative areas, inversion degree and formula units obtained from the Mössbauer spectra. The errors on the last digit are found in brackets.
Sample CodeComponentIS
(mm/s)
QS (mm/s)Bhf
(T)
RA
(%)
γFormula Unit
S1T0.33(1)−0.01(2)50.1(1)34(2)0.708(Co0.292Fe0.708)[Co0.708Fe1.292]O4
O0.271(4)−0.014(8)47.77(4)66(2)
S2T0.331(5)−0.006(9)50.1(4)38(1)0.789(Co0.211Fe0.789)[Co0.789Fe1.211]O4
O0.271(2)0.047.80(2)62(1)
S3T0.341(6)0.050.48(5)29(1)0.606(Co0.394Fe0.606)[Co0.606Fe1.394]O4
O0.275(3)0.007(5)47.78(2)71(1)
Table 4. Magnetic properties, measured at room temperature for the BNT–BT0.08/CoFe2O4 core–shell powders and ceramics.
SampleCoFe2O4 Mass (out of 1)MS (emu/g)MR (emu/g)HC (Oe)
S1, powder0.3524.710.51016
S2, powder0.5235.814.71199
S3, powder0.6247.3201083
CoFe2O4 powder [32]182.852814
CoFe2O4 core – BaTiO3 shell powder composites [8]0.633.95.98399
CoFe2O4 core – BNT–BT0.08 shell composites [41]0.975736160
CoFe2O4 – BNT–BT0.65 particulate composites [10]0.12.50.53972
0.27.51.54500
0.3132.54676
0.41736000
S1, ceramic0.3521.13.36209
S2, ceramic0.5234.95.92223
S3, ceramic 0.6247.27.15187

