Bioimaging of C2C12 Muscle Myoblasts Using Fluorescent Carbon Quantum Dots Synthesized from Bread

 , , ,
, , ,  , , and
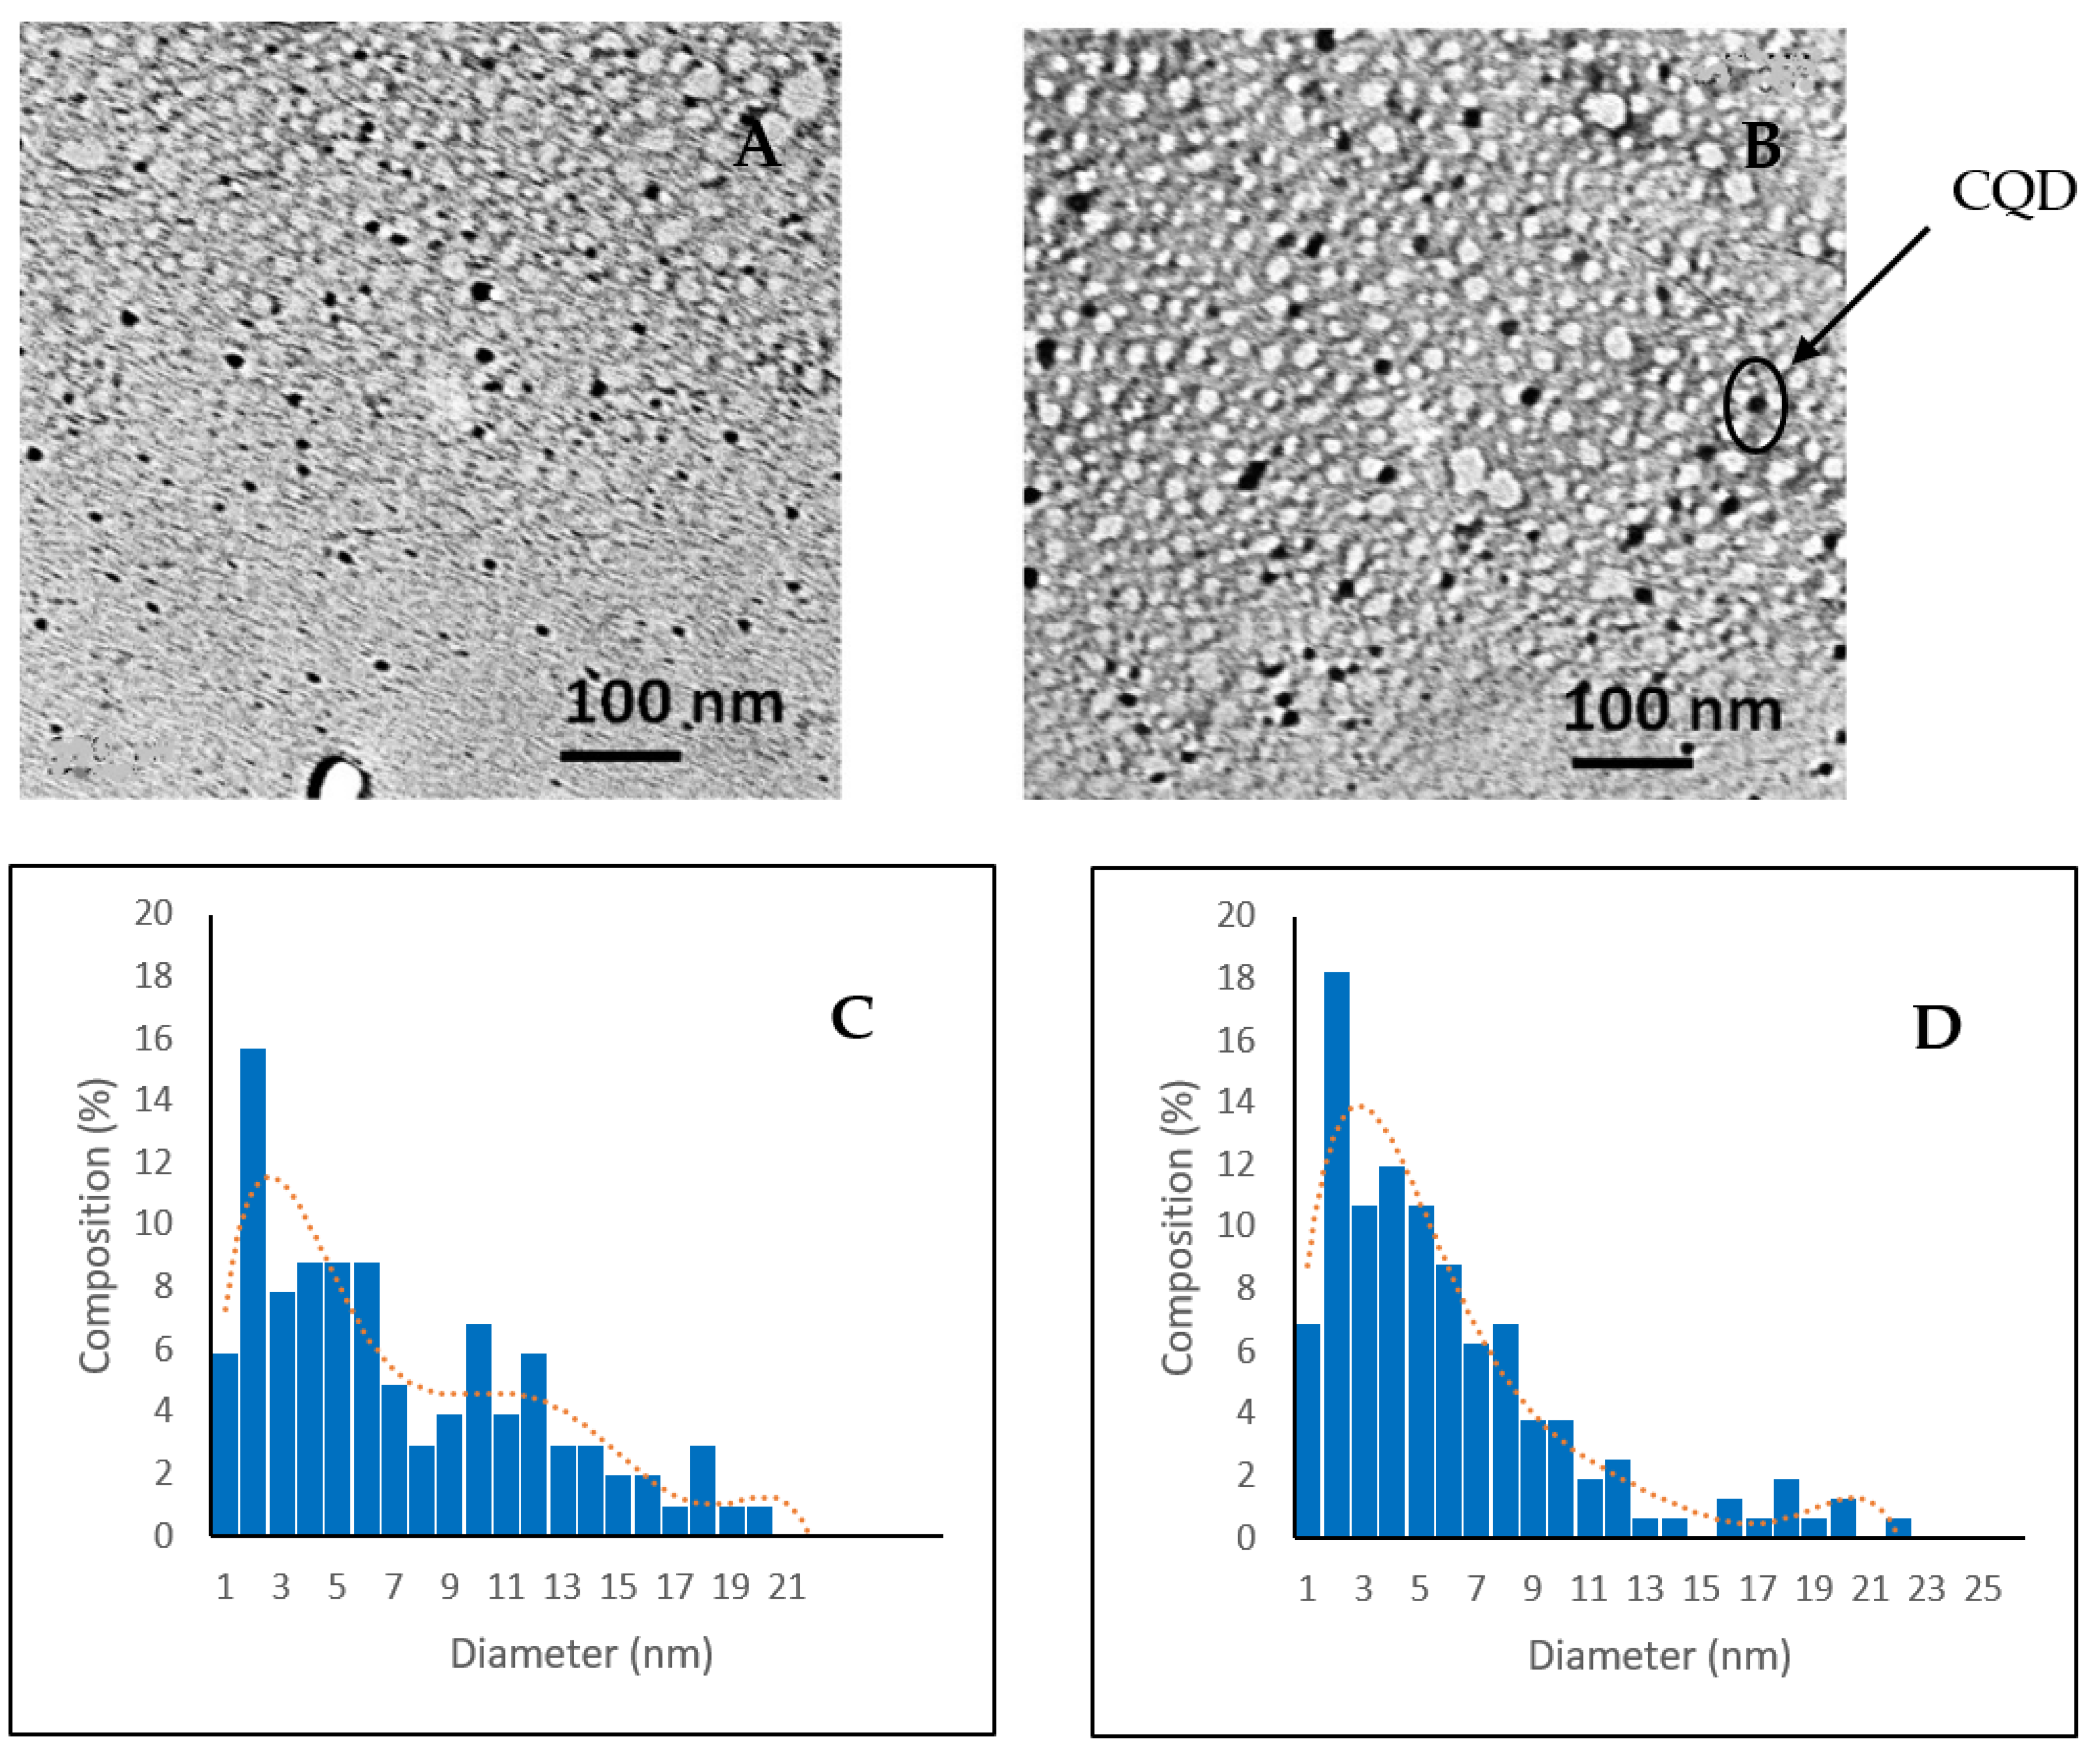
Abstract
:1. Introduction
2. Materials and Methods
2.1. Fabrication of CQD Samples
2.2. Chemical and Optical Characterization of CQD Samples
2.2.1. Transmission Electron Microscopy (TEM)
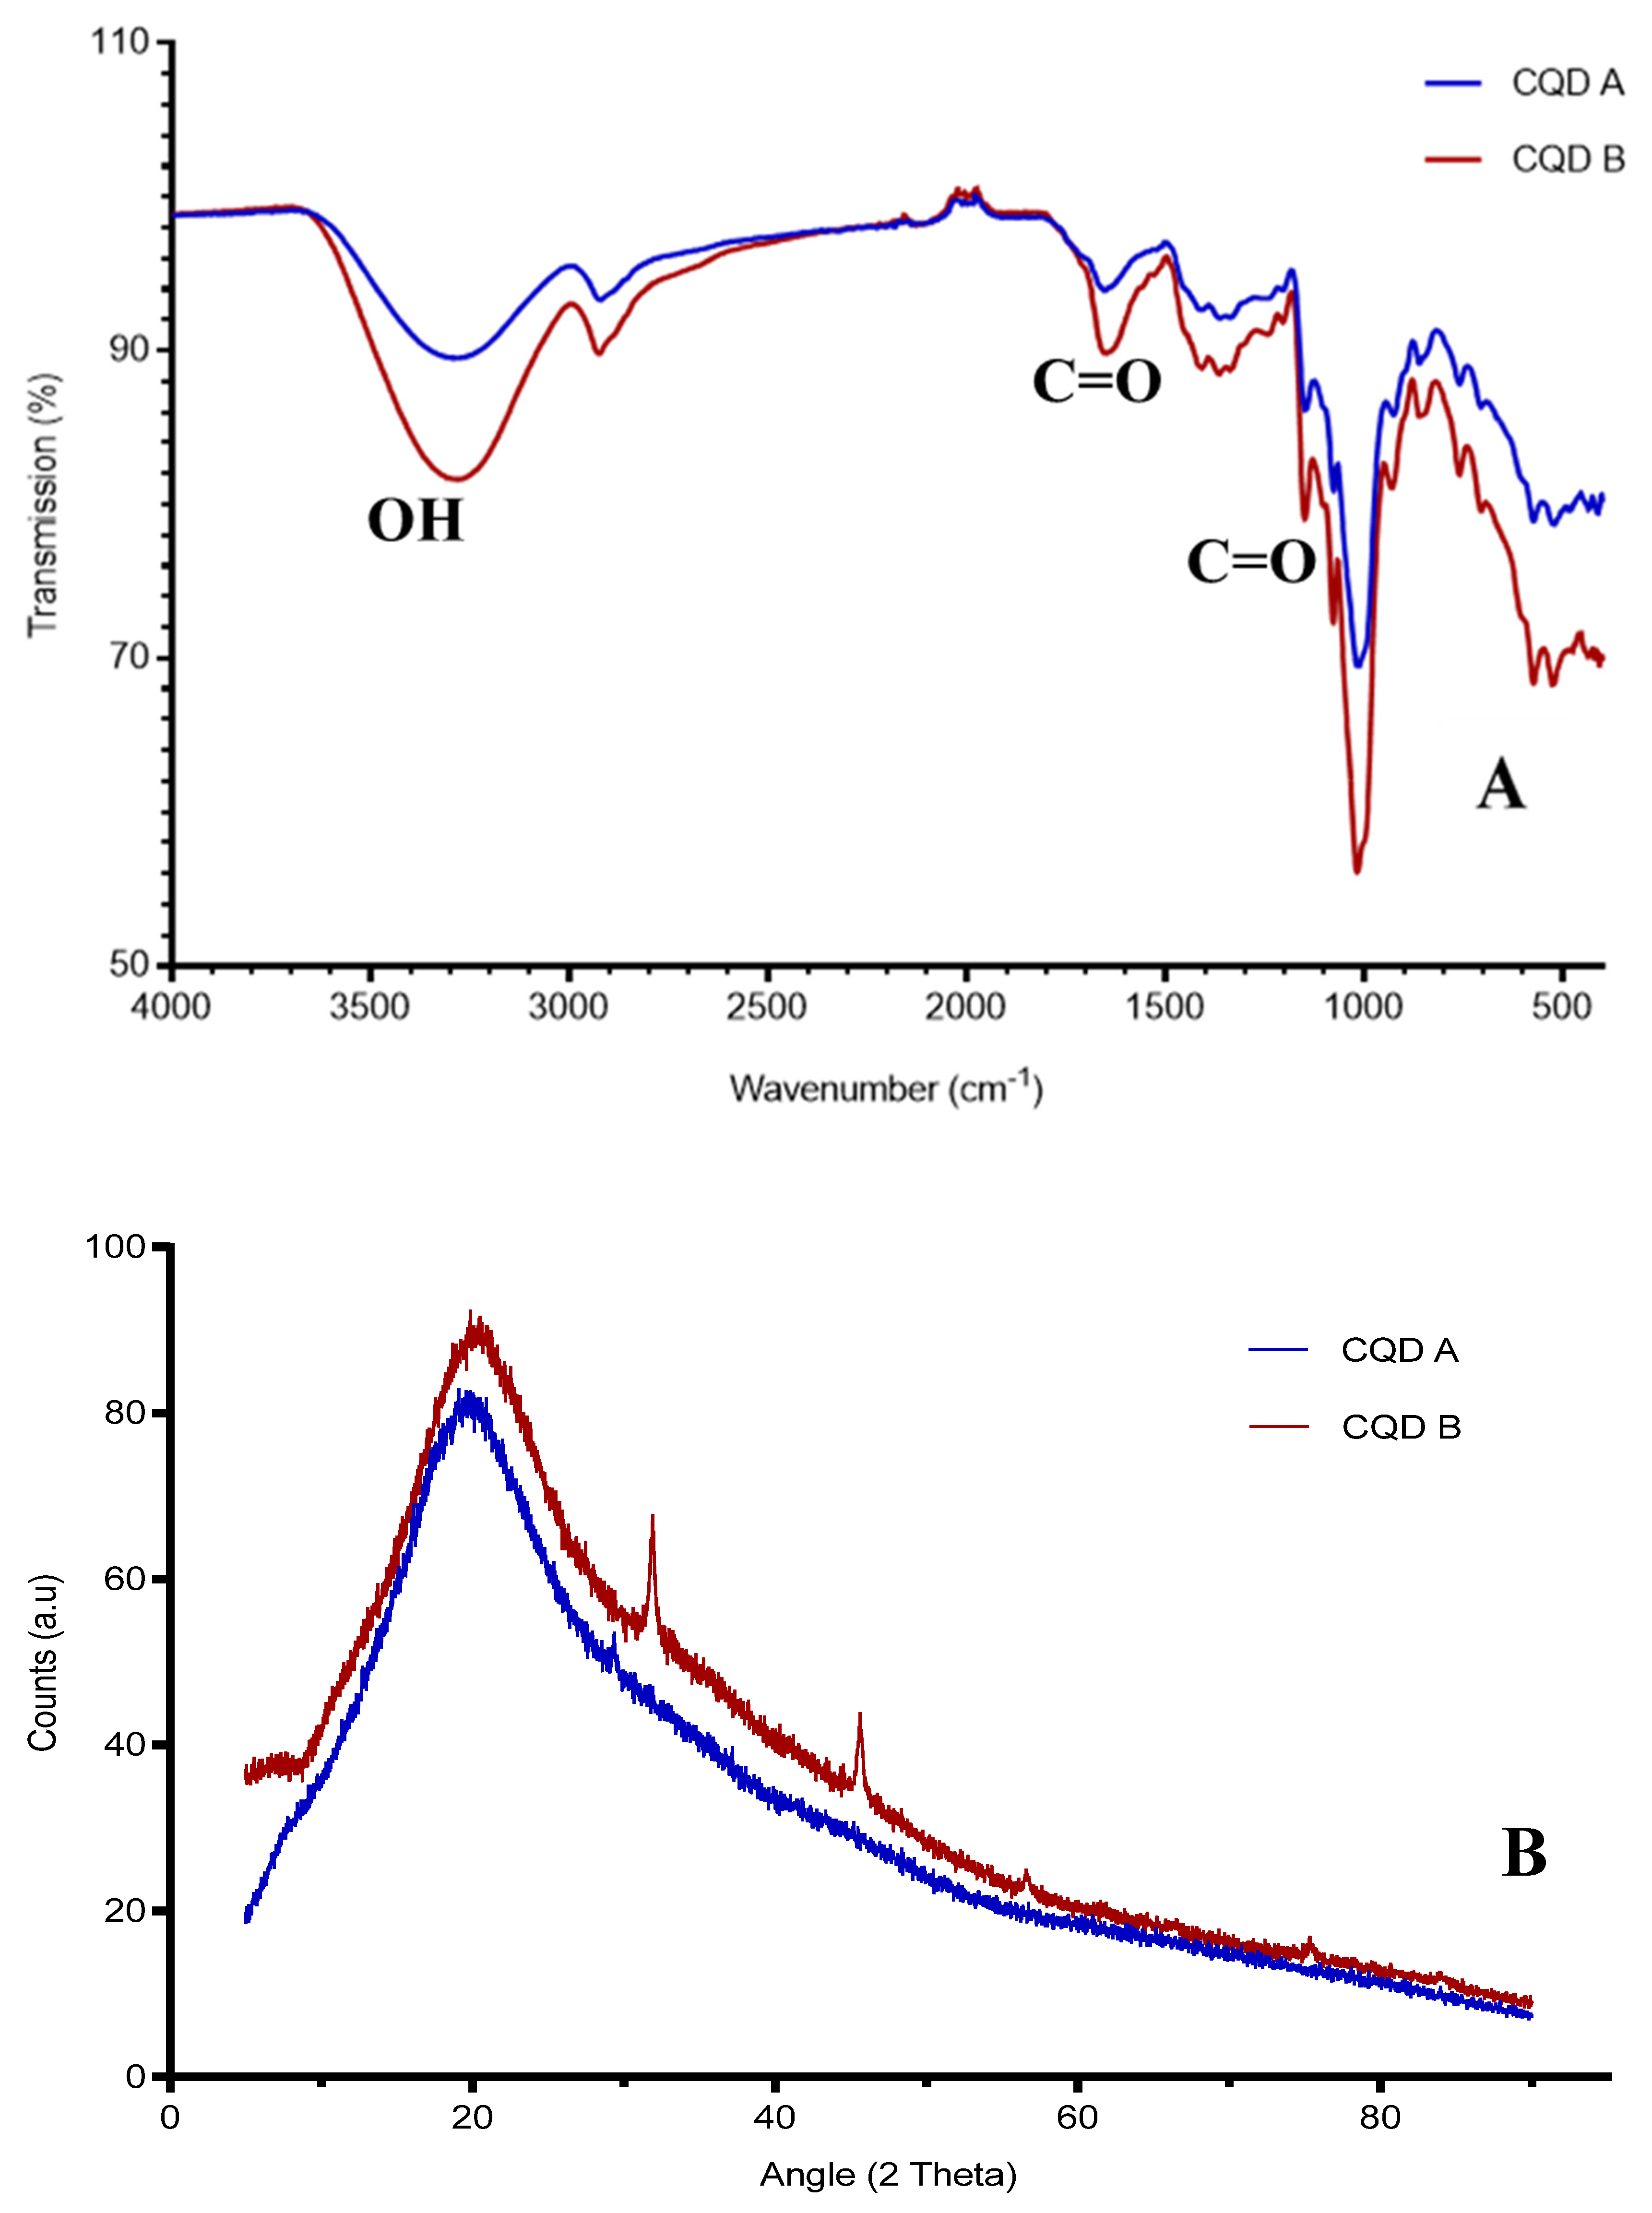
2.2.2. Fourier Transform Infrared Spectroscopy (FTIR)
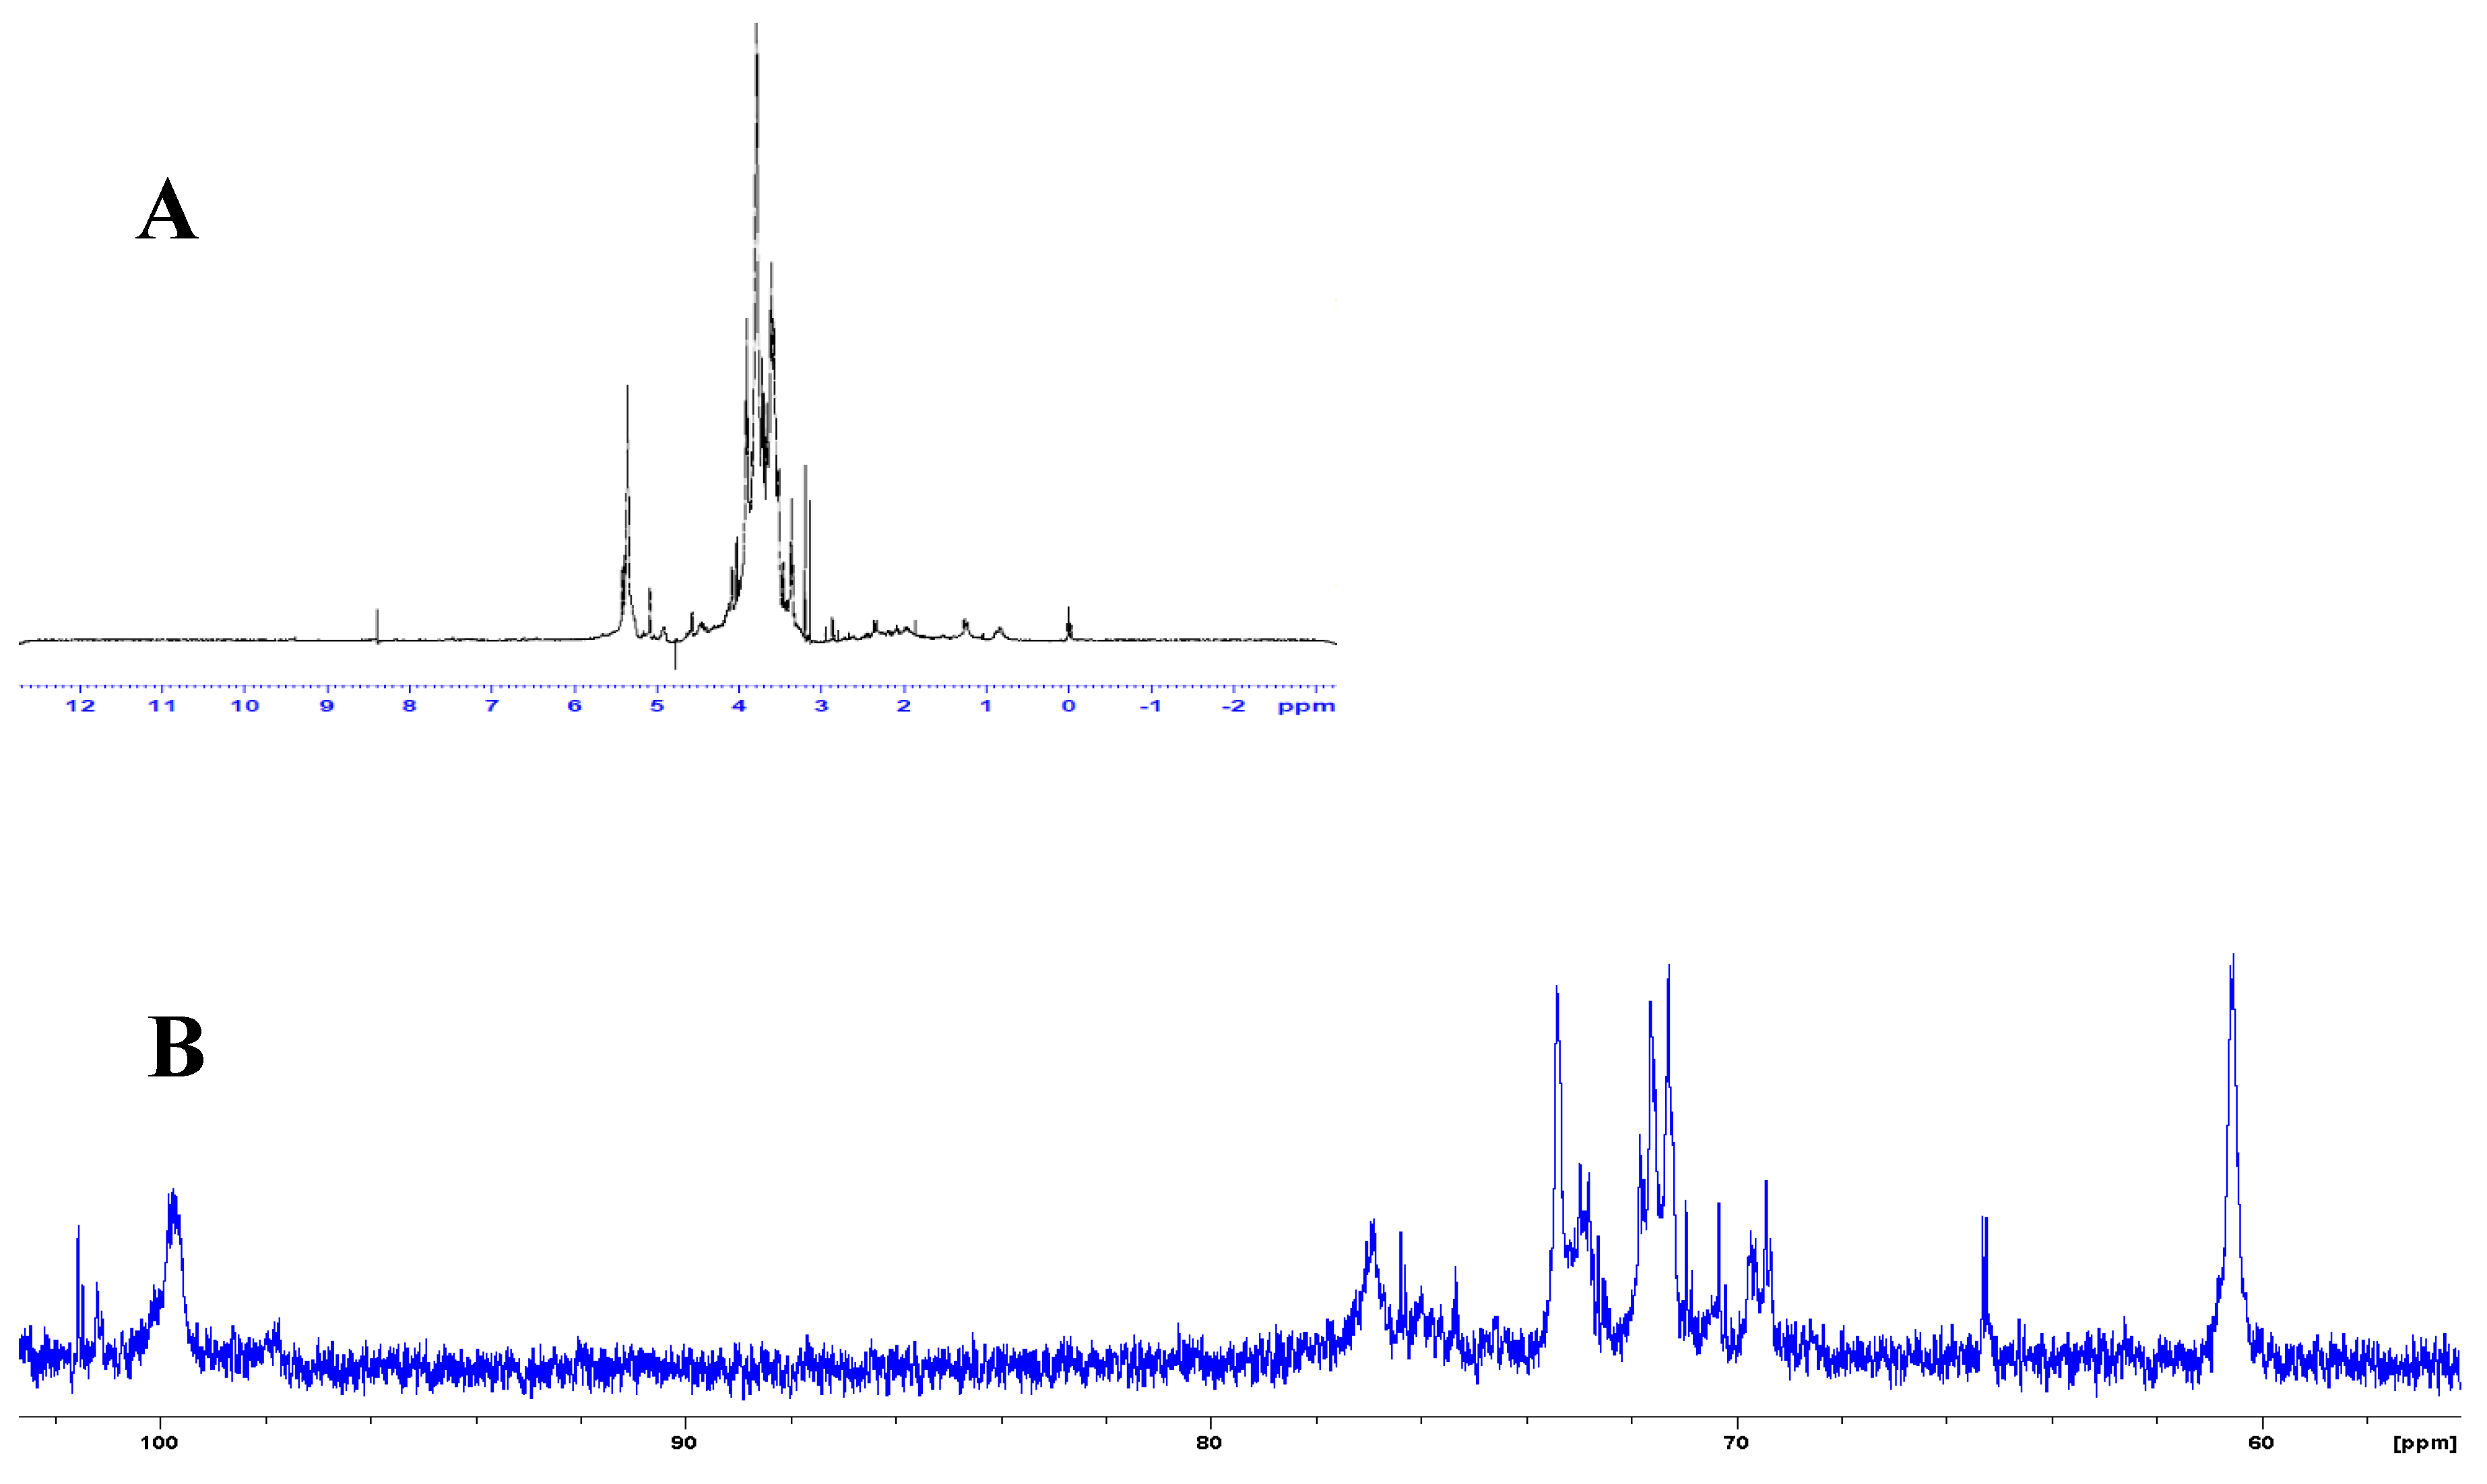
2.2.3. Nuclear Magnetic Resonance Spectroscopy (NMR)
2.2.4. X-Ray Diffraction (XRD)
2.2.5. Zeta Potential
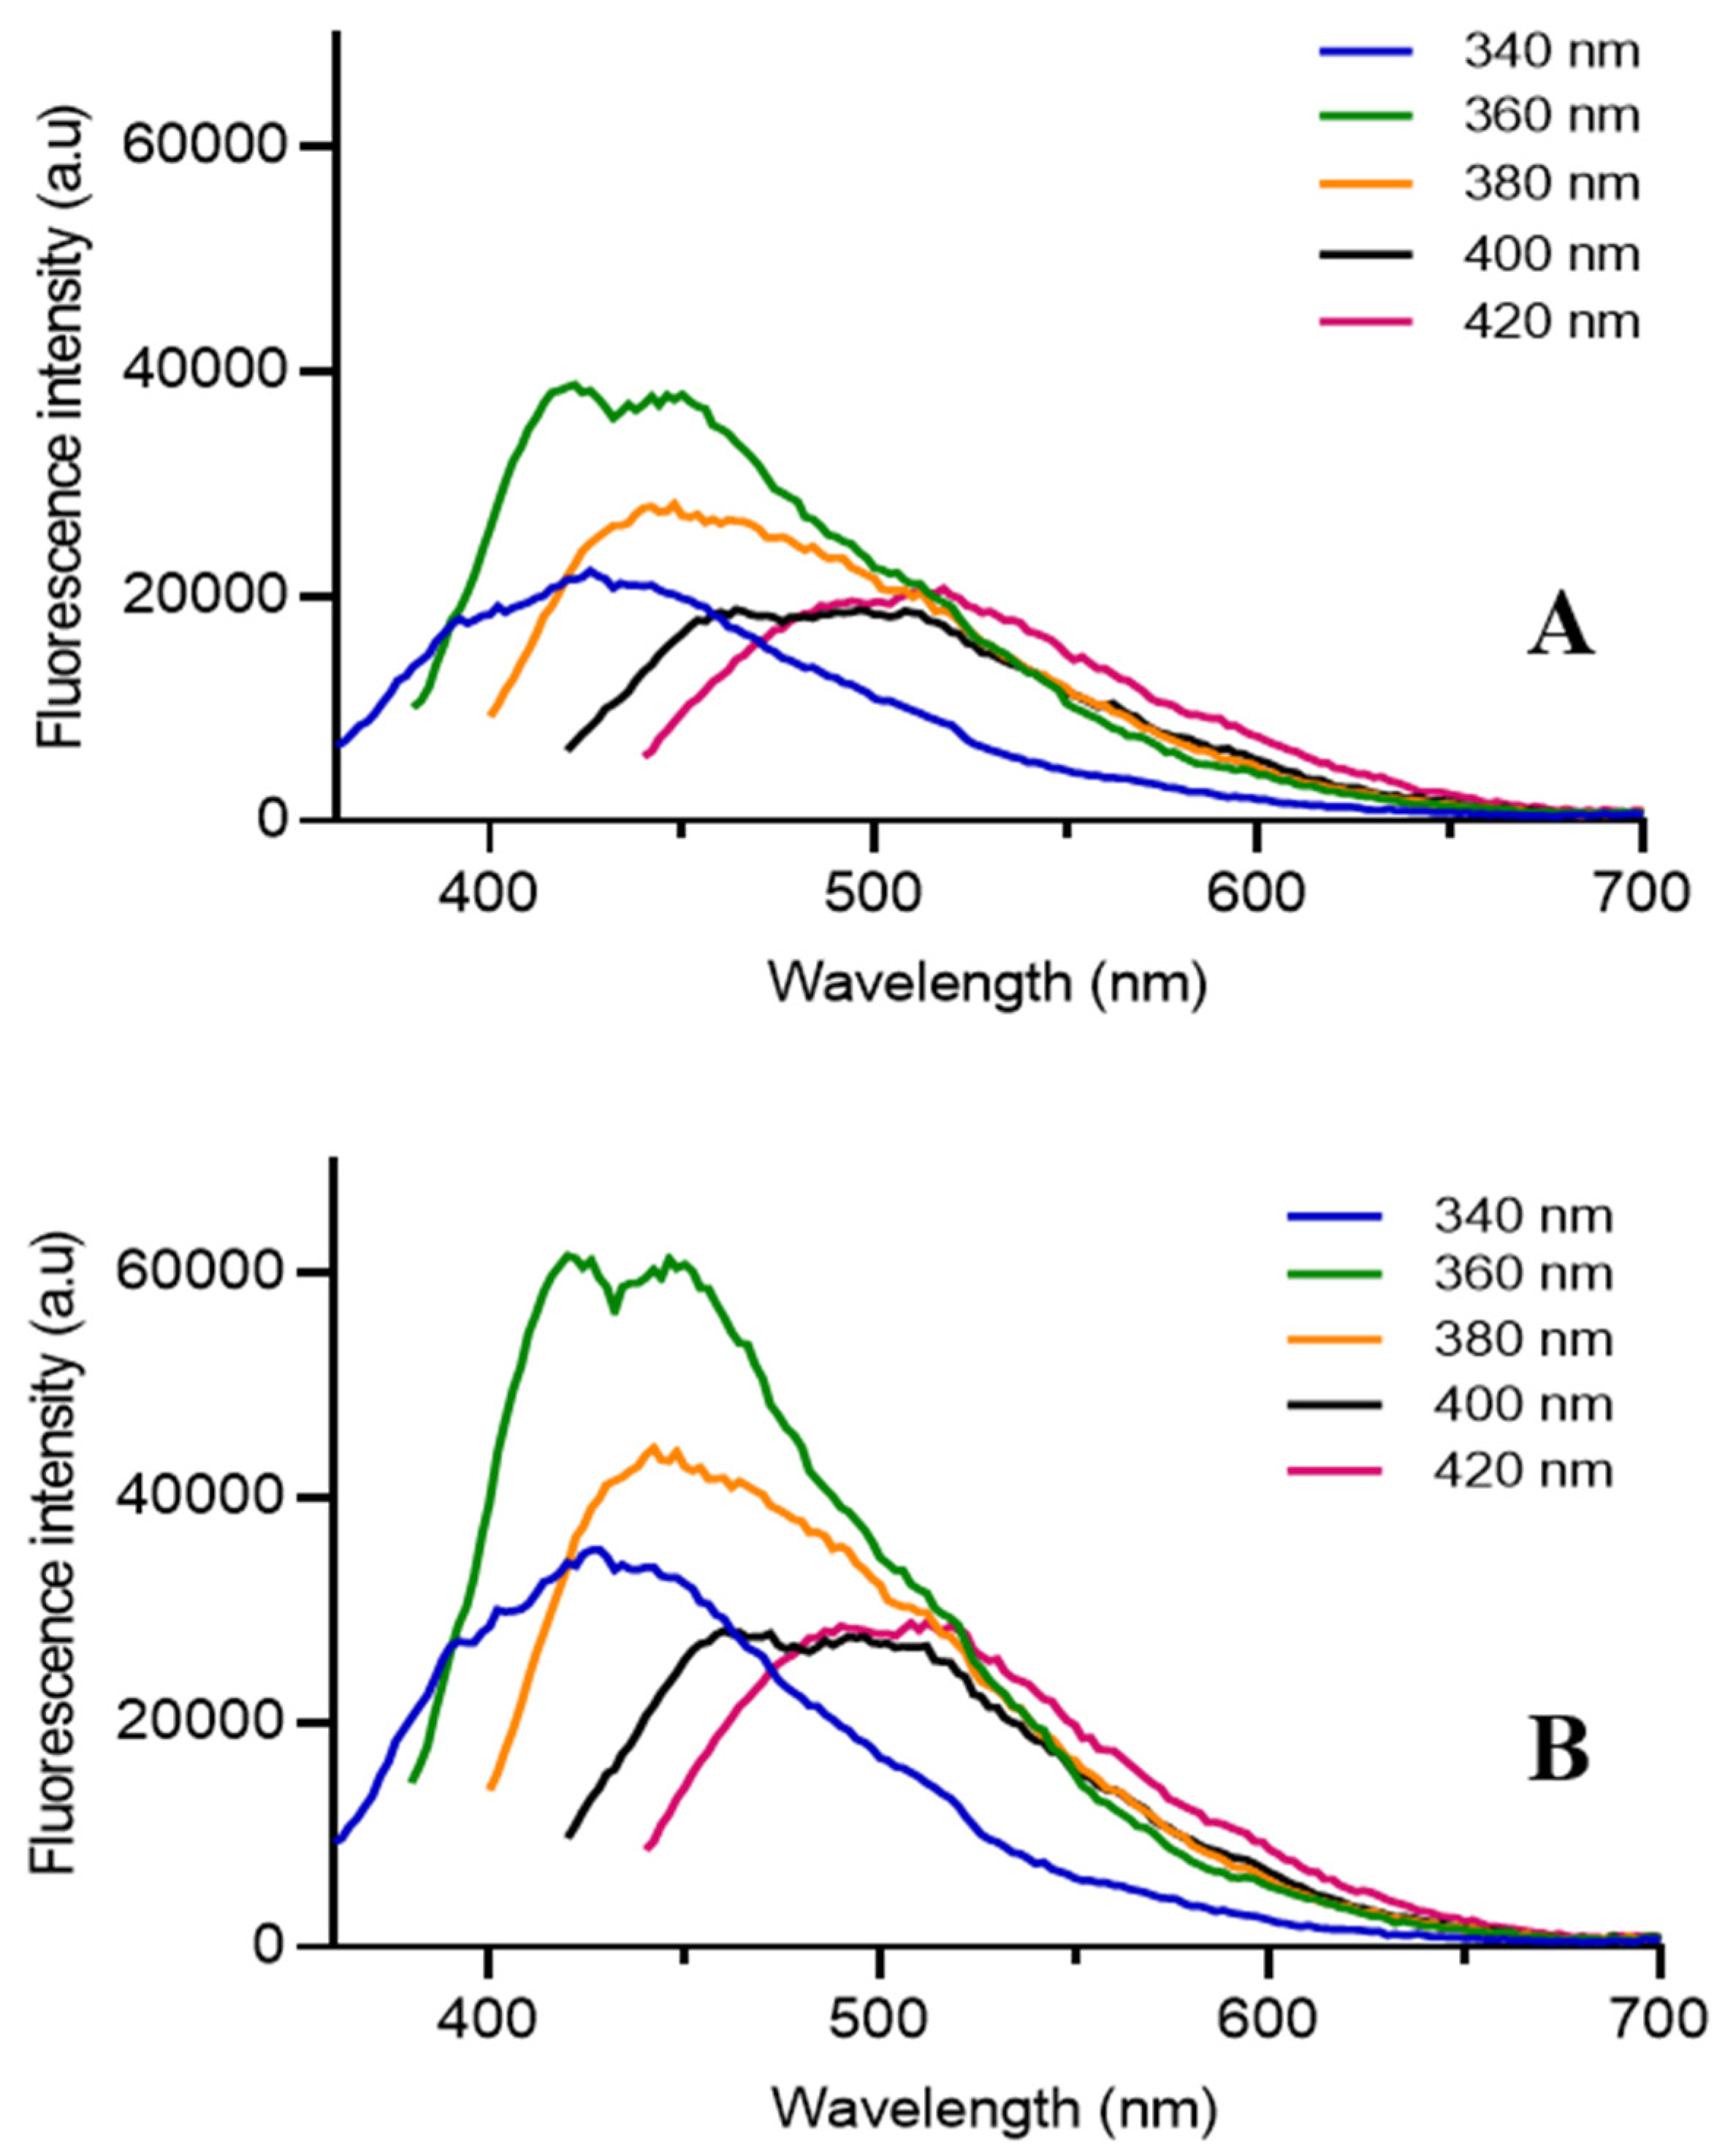
2.2.6. Fluorescence Measurements
2.3. Cell Culture
3. Results and Discussions
3.1. Characterization of CQD Samples
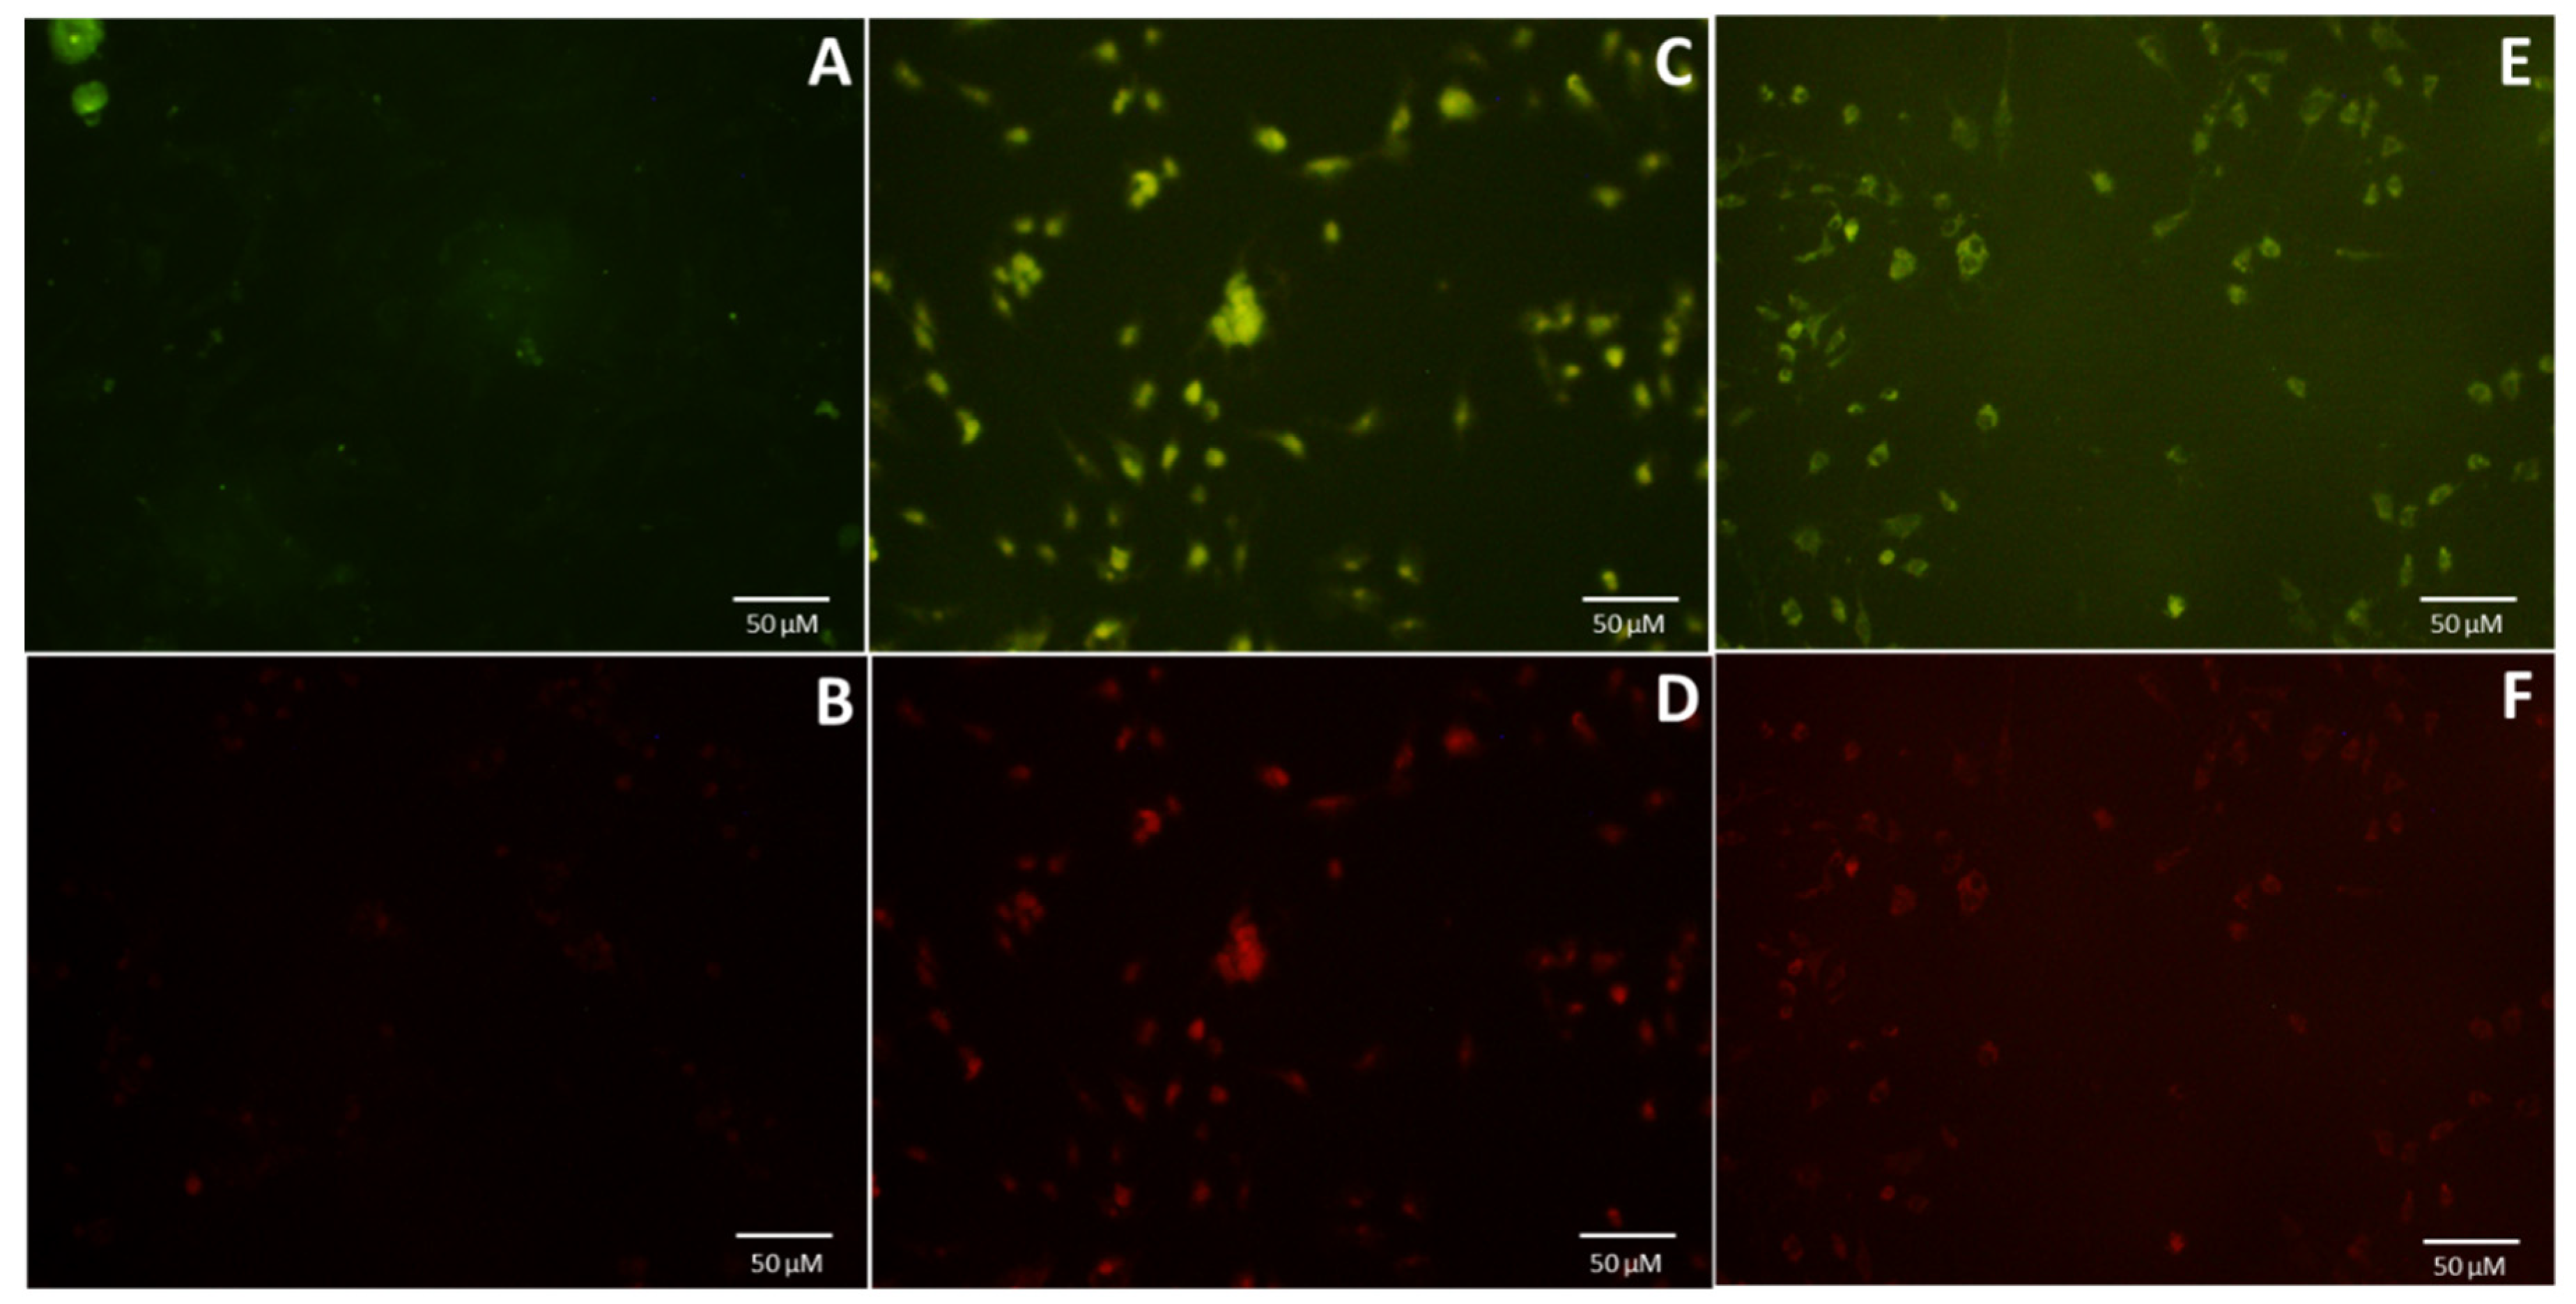
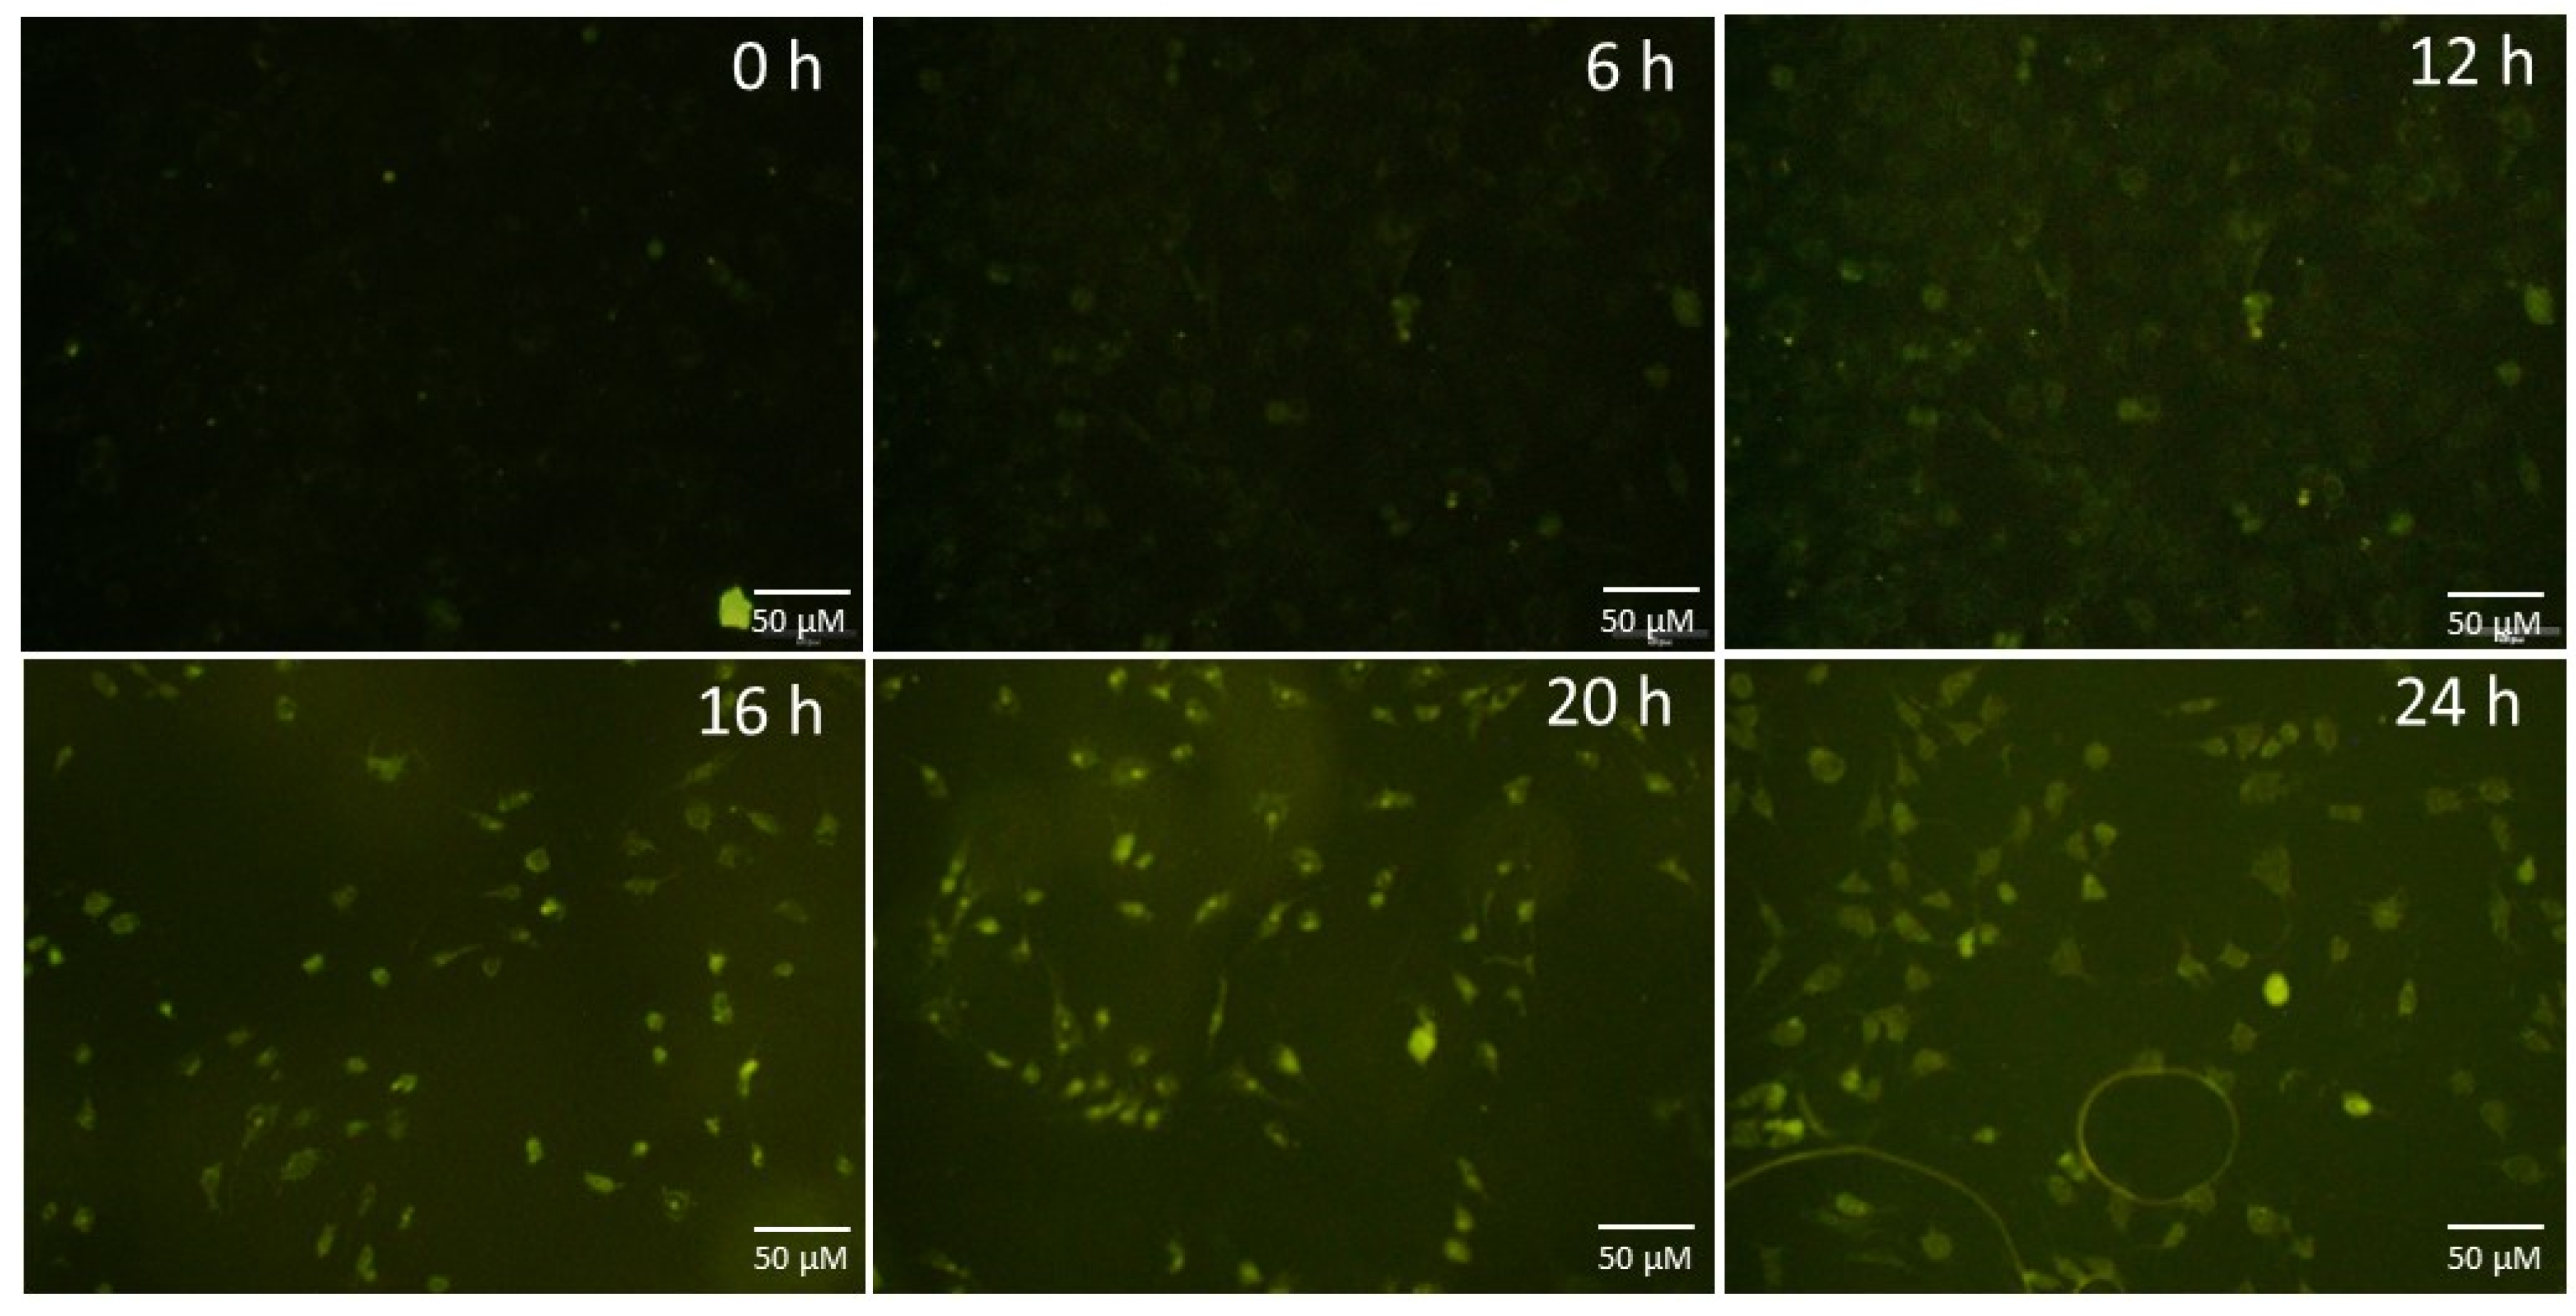
3.2. Internalization of CQDs by C2C12 Cells
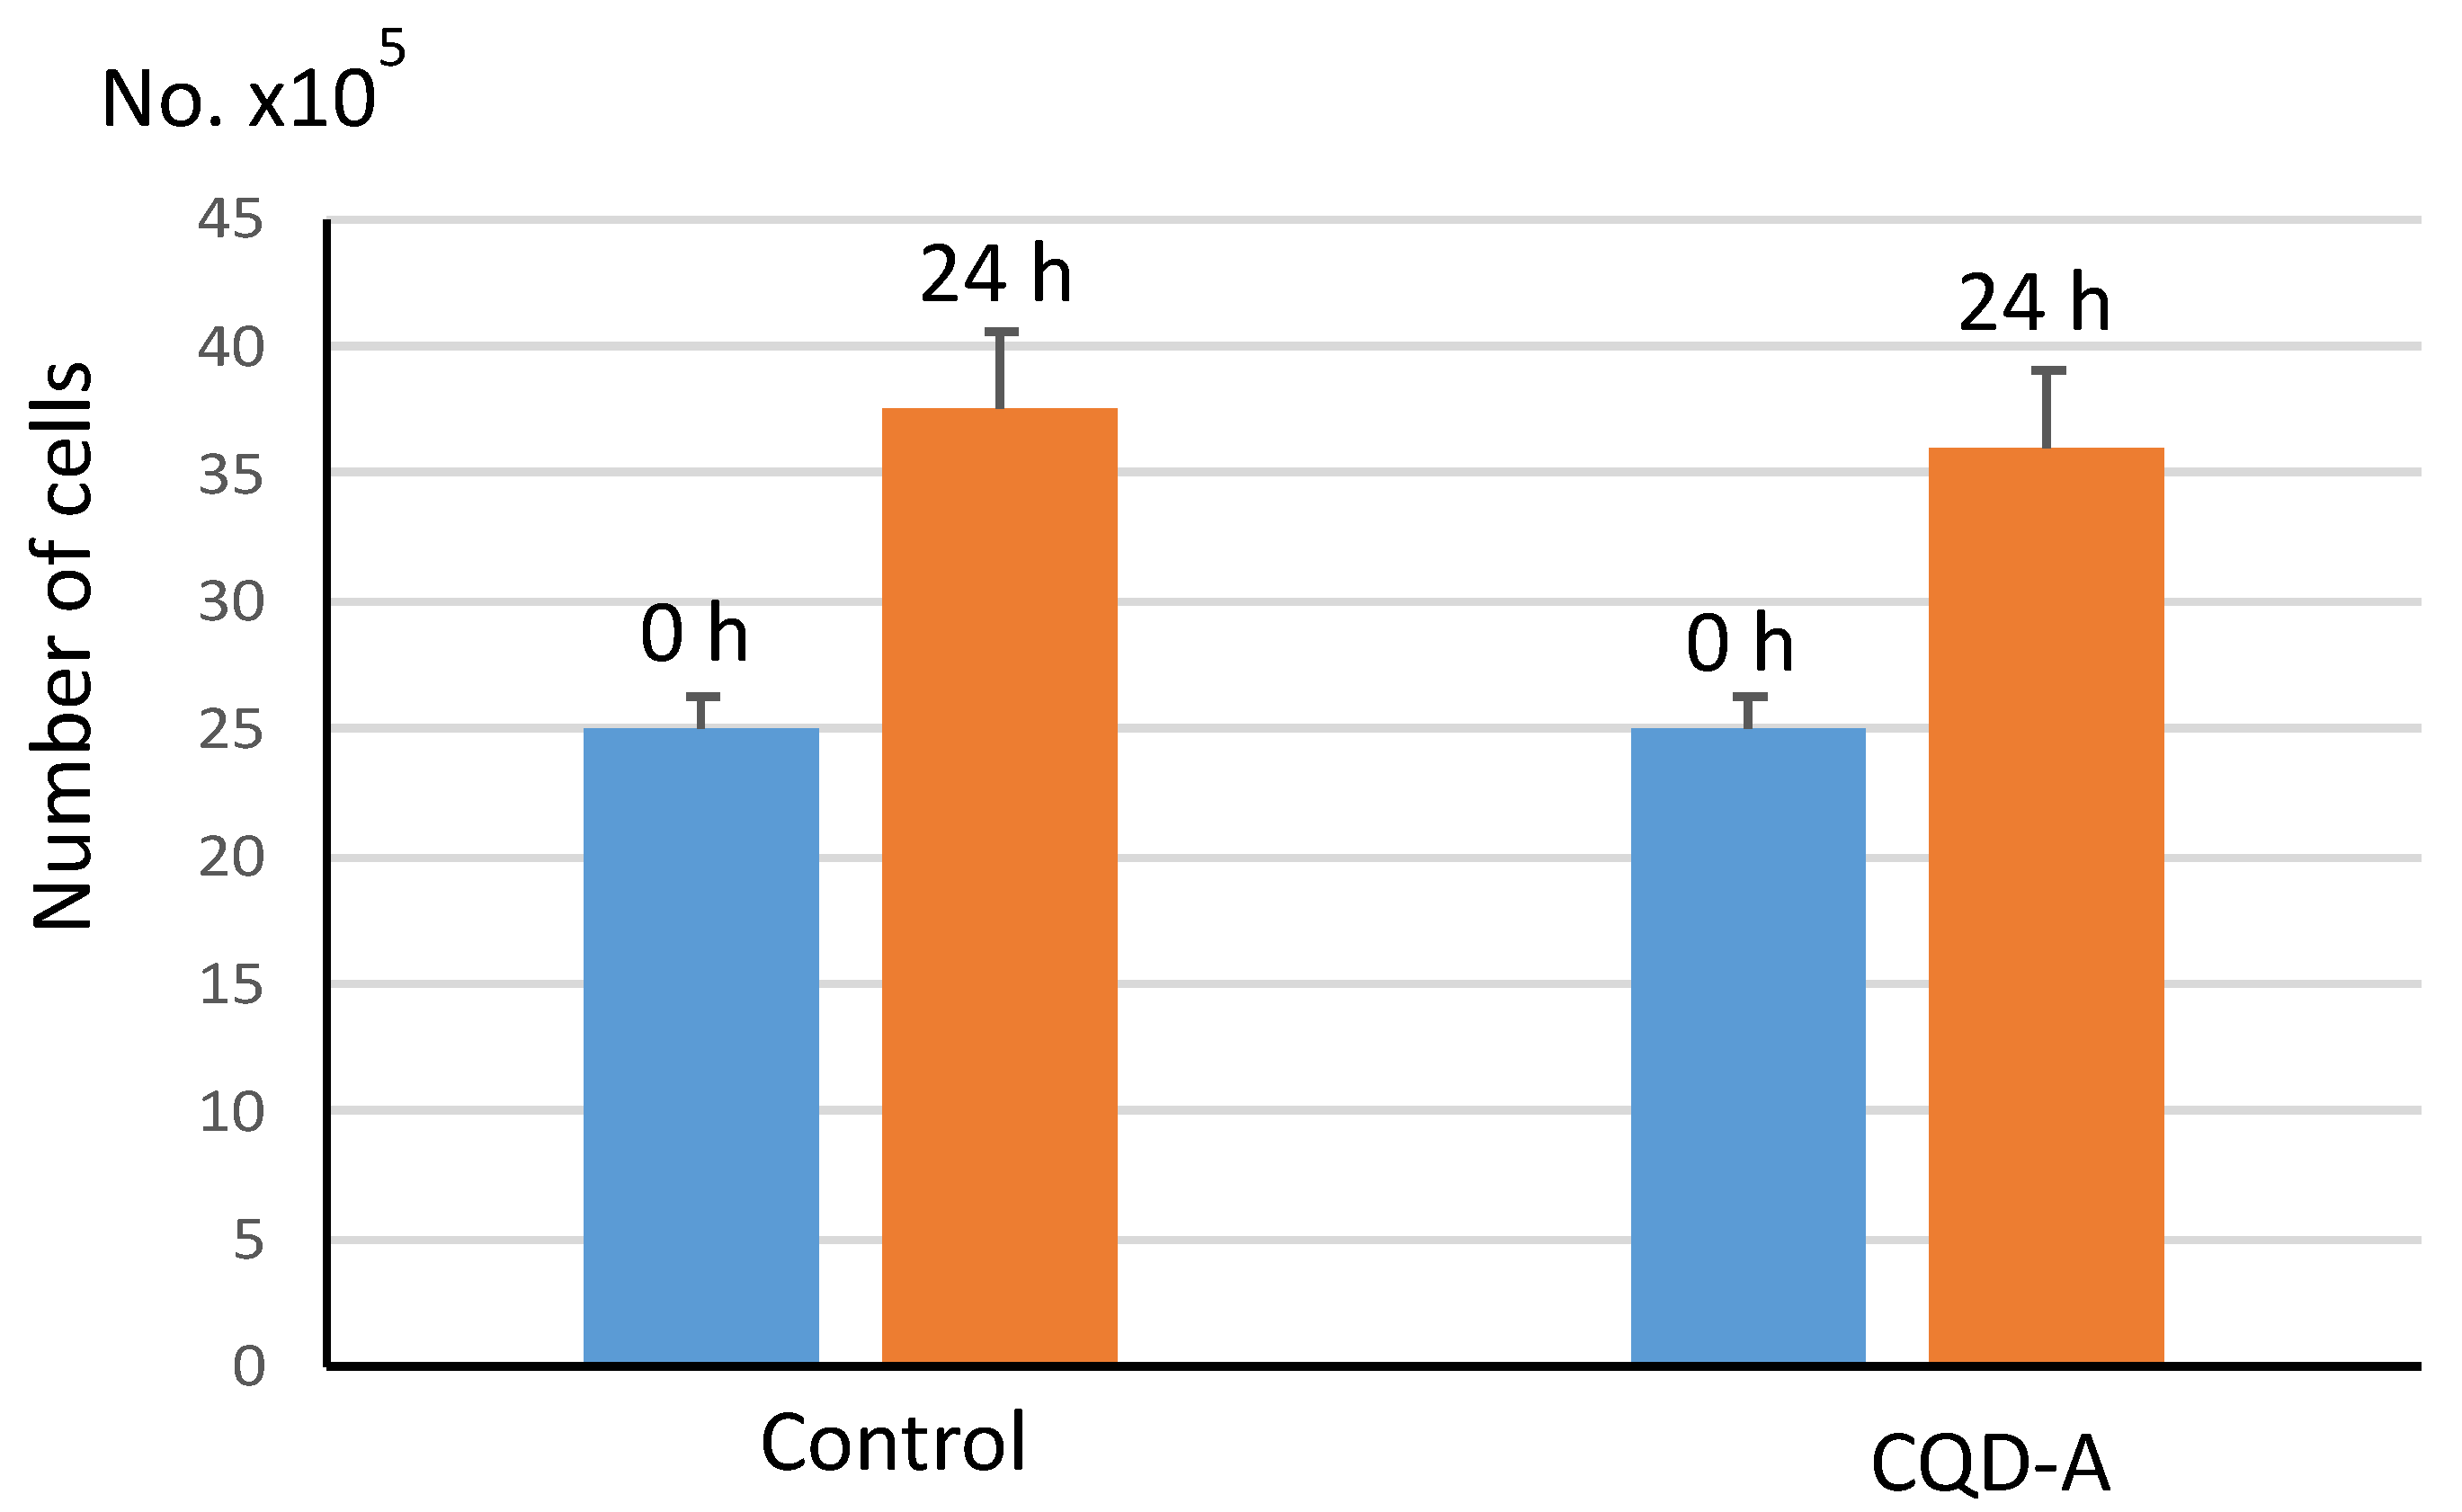
3.3. Cytotoxicity
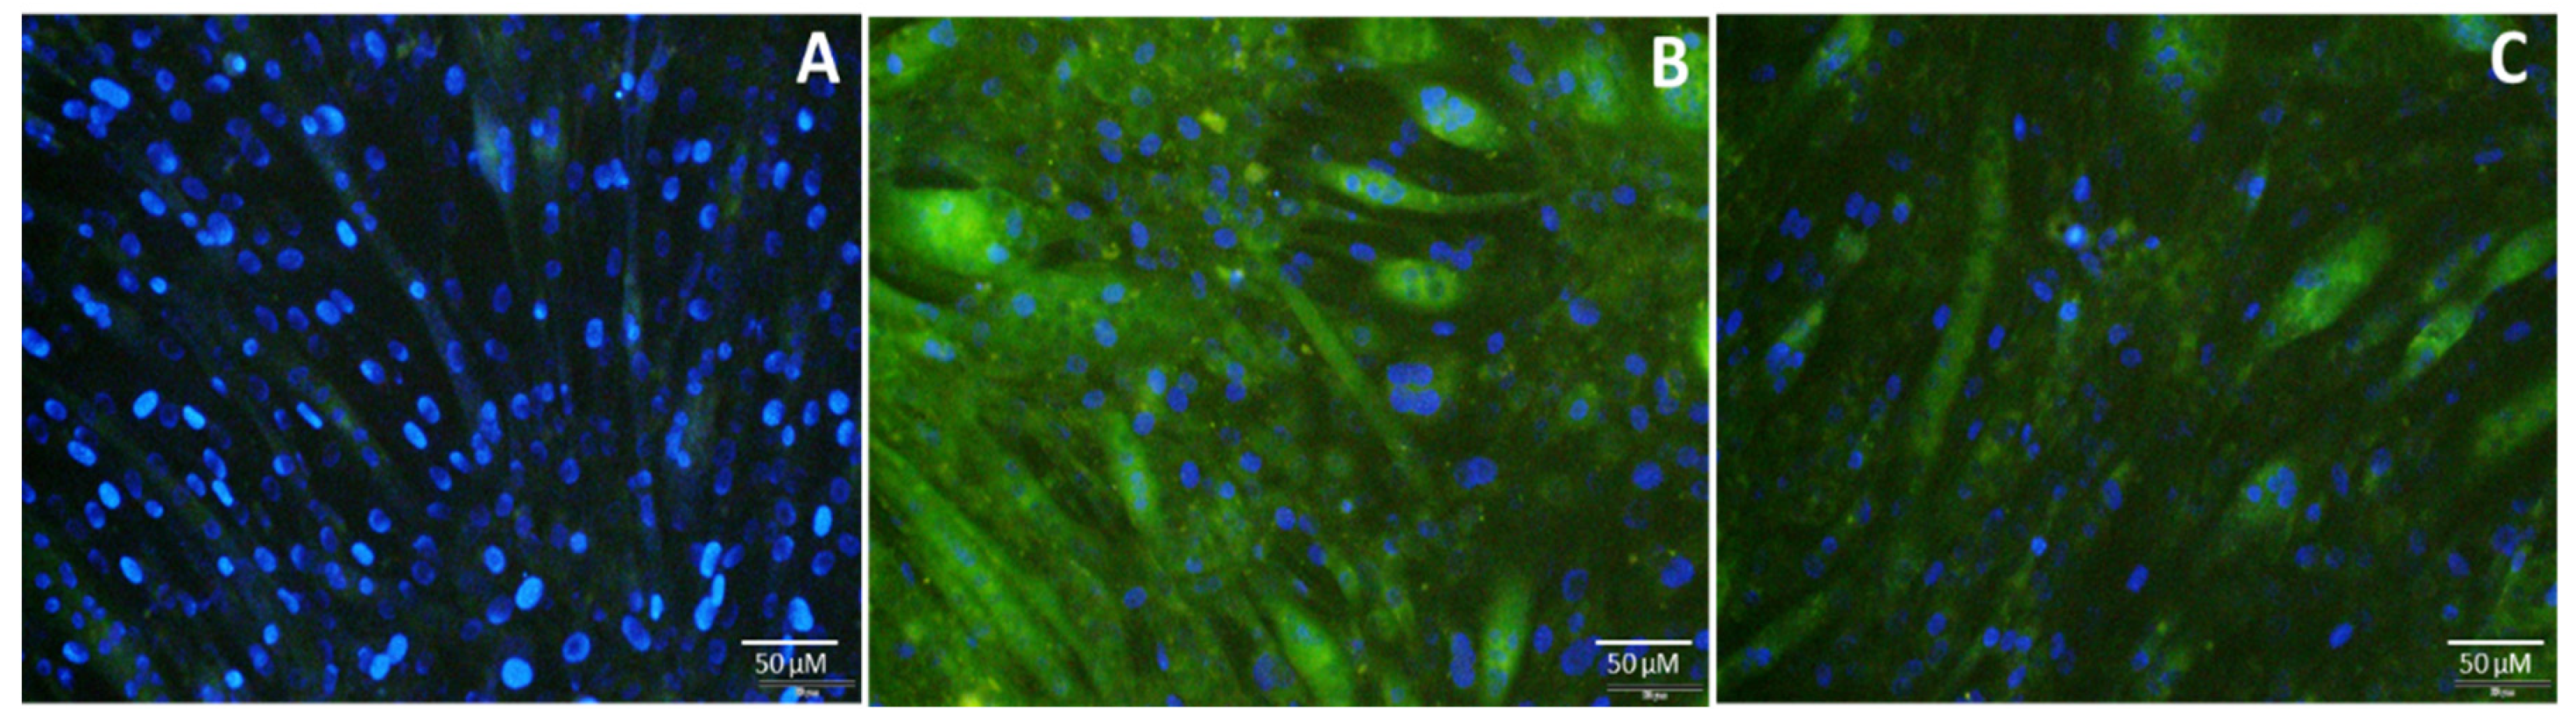
3.4. Uptake of CQDs by Muscle Myotube and Imaging
4. Conclusions
Supplementary Materials
Author Contributions
Funding
Conflicts of Interest
References
- Tao, H.; Yang, K.; Ma, Z.; Wan, J.; Zhang, Y.; Kang, Z.; Liu, Z. In vivo NIR fluorescence imaging, biodistribution and toxicology of photoluminescent carbon dots produced from carbon nanotubes and graphite. Small 2012, 8, 281–290. [Google Scholar] [CrossRef]
- Gao, X.; Cui, Y.; Levenson, R.M.; Chung, L.W.; Nie, S. In vivo cancer targeting and imaging with semiconductor quantum dots. Nat. Biotechnol. 2004, 22, 969–976. [Google Scholar] [CrossRef]
- Sharma, V.; Tiwari, P.; Mobin, S.M. Sustainable carbon-dots: Recent advances in green carbon dots for sensing and bioimaging. J. Mater. Chem. B 2017, 5, 8904–8924. [Google Scholar] [CrossRef]
- Wu, M.; Zhan, J.; Geng, B.; He, P.; Wu, K.; Wang, L.; Xu, G.; Li, Z.; Yin, L.; Pan, D. Scalable synthesis of organic-soluble carbon quantum dots: Superior optical properties in solvents, solids and LEDs. Nanoscale 2017, 9, 13195–13202. [Google Scholar] [CrossRef]
- Kuo, T.-R.; Sung, S.-Y.; Hsu, C.-W.; Chang, C.-J.; Chiu, T.-C.; Hu, C.-C. One-pot green hydrothermal synthesis of fluorescent nitrogen-doped carbon nanodots for in vivo bioimaging. Anal. Bioanal. Chem. 2016, 408, 77–82. [Google Scholar] [CrossRef]
- Li, C.-H.; Kuo, T.-R.; Su, H.-J.; Lai, W.-Y.; Yang, P.-C.; Chen, J.-S.; Wang, D.-Y.; Wu, Y.-C.; Chen, C.-C. Fluorescence-guided probes of aptamer-targeted gold nanoparticles with computed tomography imaging accesses for in vivo tumor resection. Sci. Rep. 2015, 5, 15675. [Google Scholar] [CrossRef]
- Luo, P.G.; Yang, F.; Yang, S.T.; Sonkar, S.K.; Yang, L.; Broglie, J.J.; Liu, Y.; Sun, Y.P. Carbon-based quantum dots for fluorescence imaging of cells and tissues. RSC Adv. 2014, 4, 10791–10807. [Google Scholar] [CrossRef]
- Ding, H.; Cheng, L.-W.; Ma, Y.-Y.; Kong, J.-L.; Xiong, H.-M. Luminescent carbon quantum dots and their application in cell imaging. New J. Chem. 2013, 37, 2515–2520. [Google Scholar] [CrossRef]
- Zhu, Z.; Li, Q.; Li, P.; Xun, X.; Zheng, L.; Ning, D.; Su, M. Surface charge controlled nucleoli selective staining with nanoscale carbon dots. PLoS ONE 2019, 14, e0216230. [Google Scholar] [CrossRef]
- Chandra, S.; Pathan, S.H.; Mitra, S.; Modha, B.H.; Goswami, A.; Pramanik, P. Tuning of photoluminescence on different surface functionalized carbon quantum dots. RSC Adv. 2012, 2, 3602–3606. [Google Scholar] [CrossRef]
- Li, X.; Wang, H.; Shimizu, Y.; Pyatenko, A.; Kawaguchi, K.; Koshizaki, N. Preparation of carbon quantum dots with tunable photoluminescence by rapid laser passivation in ordinary organic solvents. Chem. Commun. 2010, 47, 932–934. [Google Scholar] [CrossRef] [PubMed]
- Mei, Q.; Chen, J.; Zhao, J.; Yang, L.; Liu, B.; Liu, R.; Zhang, Z. Atomic oxygen tailored graphene oxide nanosheets emissions for multicolor cellular imaging. ACS Appl. Mater. Interfaces 2016, 8, 7390–7395. [Google Scholar] [CrossRef] [PubMed]
- Atienzar, P.; Primo, A.; Lavorato, C.; Molinari, R.; García, H. Preparation of graphene quantum dots from pyrolyzed alginate. Langmuir 2013, 29, 6141–6146. [Google Scholar] [CrossRef] [PubMed]
- Chen, W.; Li, D.; Tian, L.; Xiang, W.; Wang, T.; Hu, W.; Hu, Y.; Chen, S.; Chen, J.; Dai, Z. Synthesis of graphene quantum dots from natural polymer starch for cell imaging. Green Chem. 2018, 20, 4438–4442. [Google Scholar] [CrossRef]
- Tomskaya, A.E.; Egorova, M.N.; Kapitonov, A.N.; Nikolaev, D.V.; Popov, V.I.; Fedorov, A.L.; Smagulova, S.A. Synthesis of Luminescent N-Doped Carbon Dots by Hdrothermal Treatment. Phys. Status Solidi 2018, 255, 1700222. [Google Scholar] [CrossRef]
- Smagulova, S.A.; Egorova, M.N.; Tomskaya, A.E.; Kapitonov, A.N. Synthesis of Carbon Dots with Tunable Luminescence. J. Mater. Sci. Eng. 2017, 6, 1–6. [Google Scholar]
- Sahu, S.; Behera, B.; Maiti, T.K.; Mohapatra, S. Simple one-step synthesis of highly luminescent carbon dots from orange juice: Application as excellent bio-imaging agents. Chem. Commun. 2012, 48, 8835–8837. [Google Scholar] [CrossRef]
- Loi, E.; Ng, R.W.C.; Chang, M.M.F.; Fong, J.F.Y.; Ng, Y.H.; Ng, S.M. One-pot synthesis of carbon dots using two different acids and their respective unique photoluminescence property. Luminescence 2016, 32, 114–118. [Google Scholar] [CrossRef]
- Li, Y.; Zhong, X.; Rider, A.E.; Furman, S.A.; Ostrikov, K.K. Fast, energy-efficient synthesis of luminescent carbon dots. Green Chem. 2014, 16, 2566. [Google Scholar] [CrossRef] [Green Version]
- Yuan, F.; Xi, Z.; Shi, X.; Li, Y.; Li, X.; Wang, Z.; Fan, L.; Yang, S. Ultrastable and Low-Threshold Random Lasing from Narrow-Bandwidth-Emission Triangular Carbon Quantum Dots. Adv. Opt. Mater. 2019, 7, 1801202. [Google Scholar] [CrossRef]
- Liu, G.; Wang, X.; Han, G.; Yu, J.; Zhao, H. Earth Abundant Colloidal Carbon Dots for Luminescent Solar Concentrators. Mater. Adv. 2020. [Google Scholar] [CrossRef]
- Crista, D.; El Mragui, A.; Algarra, M.; Esteves da Silva, J.C.; Luque, R.; Pinto da Silva, L. Turning Spent Coffee Grounds into Sustainable Precursors for the Fabrication of Carbon Dots. Nanomaterials 2020, 10, 1209. [Google Scholar] [CrossRef] [PubMed]
- Saxena, M.; Sarkar, S. Fluorescence imaging of human erythrocytes by carbon nanoparticles isolated from food stuff and their fluorescence enhancement by blood plasma. Mater. Express 2013, 3, 201–209. [Google Scholar] [CrossRef]
- Sk, M.P.; Jaiswal, A.; Paul, A.; Ghosh, S.S.; Chattopadhyay, A. Presence of amorphous carbon nanoparticles in food caramels. Sci. Rep. 2012, 383, 1038. [Google Scholar] [CrossRef] [PubMed]
- Adams, L.; Fagbenro-Owoseni, K. Tunable Carbon Quantum Dots from Starch via Microwave Assisted Carbonization. IJNeaM 2017, 10, 11–20. [Google Scholar]
- Zheng, X.T.; Ananthanarayanan, A.; Luo, K.Q.; Chen, P. Glowing graphene quantum dots and carbon dots: Properties, syntheses, and biological applications. Small 2015, 11, 1620–1636. [Google Scholar] [CrossRef] [PubMed]
- Molaei, M.J. A review on nanostructured carbon quantum dots and their application in biotechnology, sensors, and chemiluminescence. Talanta 2018, 196, 456–478. [Google Scholar] [CrossRef] [PubMed]
- Molaei, M.J. Carbon quantum dots and their biomedical and therapeutic applications: A riview. RSC Adv. 2019, 9, 6460–6481. [Google Scholar] [CrossRef]
- Liu, H.; Li, Z.; Sun, Y.; Geng, X.; Hu, Y.; Meng, H.; Ge, J.; Qu, L. Synthesis of luminescent carbon dots with ultrahigh quantum yield and inherent folate receptor-positive cancer cell targetability. Sci. Rep. 2018, 8, 1086. [Google Scholar] [CrossRef] [Green Version]
- Zhang, Q.; Zhang, X.; Bao, L.; Wu, Y.; Jiang, L.; Zheng, Y.; Wang, Y.; Chen, Y. The Application of Green-Synthesis-Derived Carbon Quantum Dots to Bioimaging and the Analysis of Mercury (II). J. Anal. Methods Chem. 2019, 2019, 9. [Google Scholar] [CrossRef] [Green Version]
- Ren, X.; Zhang, F.; Guo, B.; Gao, N.; Zhang, X. Synthesis of N-doped micropore carbon quantum dots with high quantum yield and dual-wavelength photoluminescence emission from biomass for cellular imaging. Nanomaterials 2019, 9, 495. [Google Scholar] [CrossRef] [PubMed] [Green Version]
- Blau, H.M.; Pavlath, G.K.; Hardeman, E.C.; Chiu, C.P.; Silberstein, L.; Webster, S.G.; Miller, S.C.; Webster, C. Plasticity of the differentiated state. Science 1985, 230, 758–766. [Google Scholar] [CrossRef] [PubMed] [Green Version]
- Chaudhary, S.; Kumar, S.; Kaur, B.; Mehta, S. Potential prospects for carbon dots as a fluorescence sensing probe for metal ions. RSC Adv. 2016, 6, 90526–90536. [Google Scholar] [CrossRef]
- De, B.; Karak, N. A green and facile approach for the synthesis of water soluble fluorescent carbon dots from banana juice. RSC Adv. 2013, 3, 8286–8290. [Google Scholar] [CrossRef]
- Huang, C.; Dong, H.; Su, Y.; Wu, Y.; Narron, R.; Yong, Q. Synthesis of carbon quantum dot nanoparticles derived from byproducts in bio-refinery process for cell imaging and in vivo bioimaging. Nanomaterials 2019, 9, 387. [Google Scholar] [CrossRef] [Green Version]
- Vogel, R.; Pal, A.K.; Jambhrunkar, S.; Patel, P.; Thakur, S.S.; Reátegui, E.; Parekh, H.S.; Saá, P.; Stassinopoulos, A.; Broom, M.F. High-resolution single particle zeta potential characterisation of biological nanoparticles using tunable resistive pulse sensing. Sci. Rep. 2017, 7, 1–13. [Google Scholar]
- Nimesh, S.; Chandra, R.; Gupta, N. Advances in Nanomedicine for the Delivery of Therapeutic Nucleic Acids; Woodhead Publishing: Cambridge, UK, 2017. [Google Scholar]
- Pan, L.; Sun, S.; Zhang, A.; Jiang, K.; Zhang, L.; Dong, C.; Huang, Q.; Wu, A.; Lin, H. Truly fluorescent excitation-dependent carbon dots and their applications in multicolor cellular imaging and multidimensional sensing. Adv. Mater. 2015, 27, 7782–7787. [Google Scholar] [CrossRef]
- Sharma, A.; Gadly, T.; Gupta, A.; Ballal, A.; Ghosh, S.K.; Kumbhakar, M. Origin of excitation dependent fluorescence in carbon nanodots. J. Phys. Chem. Lett. 2016, 7, 3695–3702. [Google Scholar] [CrossRef]
- Heinrichs, A. Stains and fluorescent dyes. Nat. Cell Biol. 2009, 11, S7. [Google Scholar] [CrossRef] [Green Version]
- Forterre, A.; Jalabert, A.; Berger, E.; Baudet, M.; Chikh, K.; Errazuriz, E.; De Larichaudy, J.; Chanon, S.; Weiss-Gayet, M.; Hesse, A.-M. Proteomic analysis of C2C12 myoblast and myotube exosome-like vesicles: A new paradigm for myoblast-myotube cross talk? PLoS ONE 2014, 9, e84153. [Google Scholar] [CrossRef]
- Dehghani, A.; Ardekani, S.M.; Hassan, M.; Gomes, V.G. Collagen derived carbon quantum dots for cell imaging in 3D scaffolds via two-photon spectroscopy. Carbon 2018, 131, 238–245. [Google Scholar] [CrossRef]
- McKee, C.; Chaudhry, G.R. Advances and challenges in stem cell culture. Colloids Surf. B 2017, 159, 62–77. [Google Scholar] [CrossRef] [PubMed]


© 2020 by the authors. Licensee MDPI, Basel, Switzerland. This article is an open access article distributed under the terms and conditions of the Creative Commons Attribution (CC BY) license (http://creativecommons.org/licenses/by/4.0/).
Share and Cite
K. Anpalagan, K.; V. Karakkat, J.; Truskewycz, A.; Saedi, A.A.; Joseph, P.; Apostolopoulos, V.; Nurgali, K.; Cole, I.; Cai, Z.; T. H. Lai, D. Bioimaging of C2C12 Muscle Myoblasts Using Fluorescent Carbon Quantum Dots Synthesized from Bread. Nanomaterials 2020, 10, 1575. https://doi.org/10.3390/nano10081575
K. Anpalagan K, V. Karakkat J, Truskewycz A, Saedi AA, Joseph P, Apostolopoulos V, Nurgali K, Cole I, Cai Z, T. H. Lai D. Bioimaging of C2C12 Muscle Myoblasts Using Fluorescent Carbon Quantum Dots Synthesized from Bread. Nanomaterials. 2020; 10(8):1575. https://doi.org/10.3390/nano10081575
Chicago/Turabian StyleK. Anpalagan, Karthiga, Jimsheena V. Karakkat, Adam Truskewycz, Ahmed Al Saedi, Paul Joseph, Vasso Apostolopoulos, Kulmira Nurgali, Ivan Cole, Zibo Cai, and Daniel T. H. Lai. 2020. "Bioimaging of C2C12 Muscle Myoblasts Using Fluorescent Carbon Quantum Dots Synthesized from Bread" Nanomaterials 10, no. 8: 1575. https://doi.org/10.3390/nano10081575