Incorporation of NiO into SiO2, TiO2, Al2O3, and Na4.2Ca2.8(Si6O18) Matrices: Medium Effect on the Optical Properties and Catalytic Degradation of Methylene Blue


Abstract
:1. Introduction
2. Materials and Methods
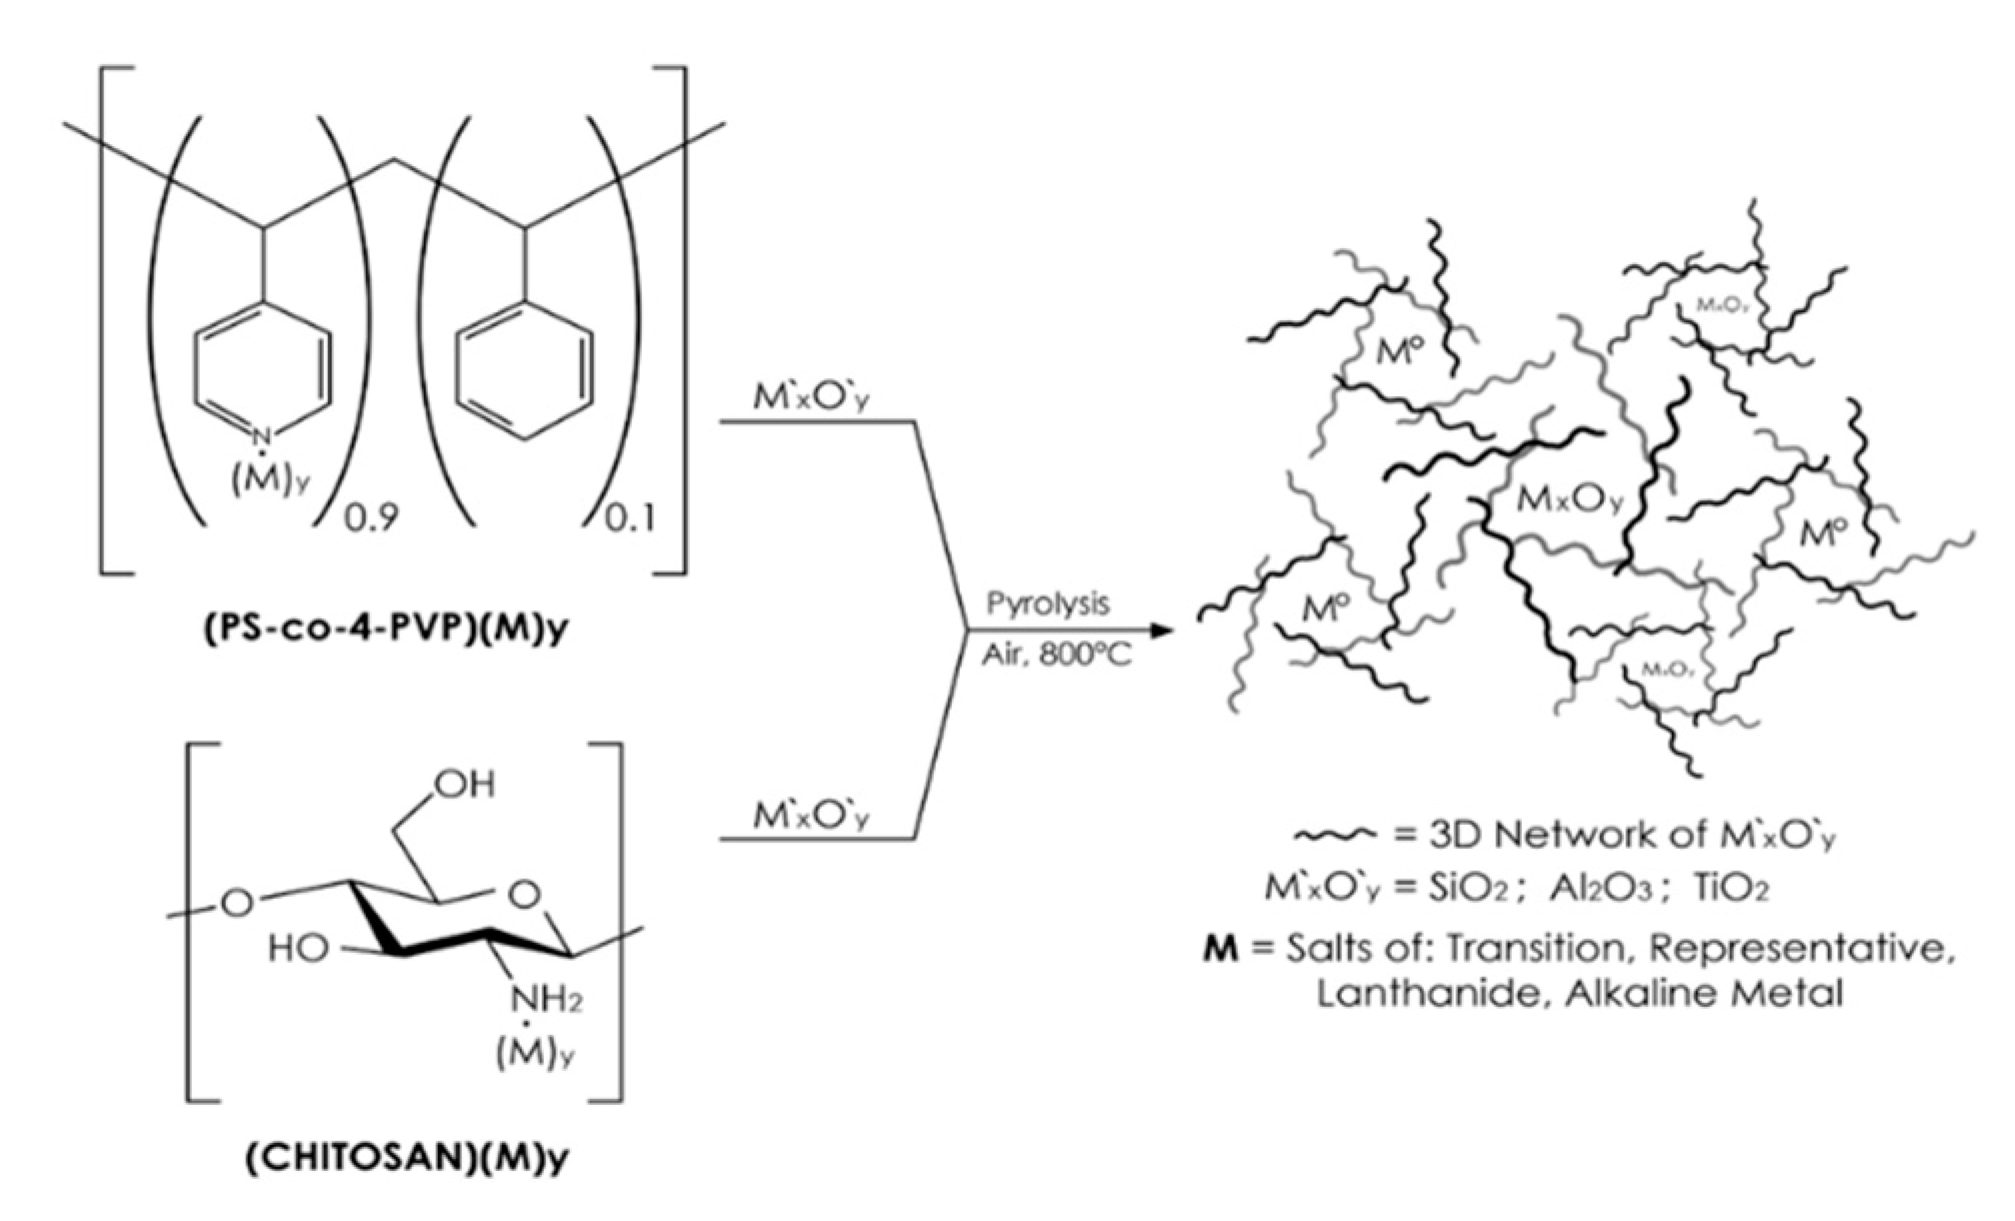
2.1. Preparation of the NiO/SiO2, NiO/TiO2, NiO/Al2O3 Composites
2.2. Preparation of the Chitosan (NiCl2·6H2O)x//TiO2 and PS-co-4-PVP (NiCl2)x//TiO2 Precursors
2.3. Preparation of the Chitosan (NiCl2·6H2O)x//Al2O3 and PS-co-4-PVP (NiCl2)x//Al2O3 Precursors
2.4. Preparation of the Precursors: Chitosan (NiCl2·6H2O)x//NiO/Na4.2Ca2.8(Si6O18) and PS-co-4-PVP (NiCl2)x//NiO/Na4.2Ca2.8(Si6O18)
2.5. Characterization
3. Results and Discussion
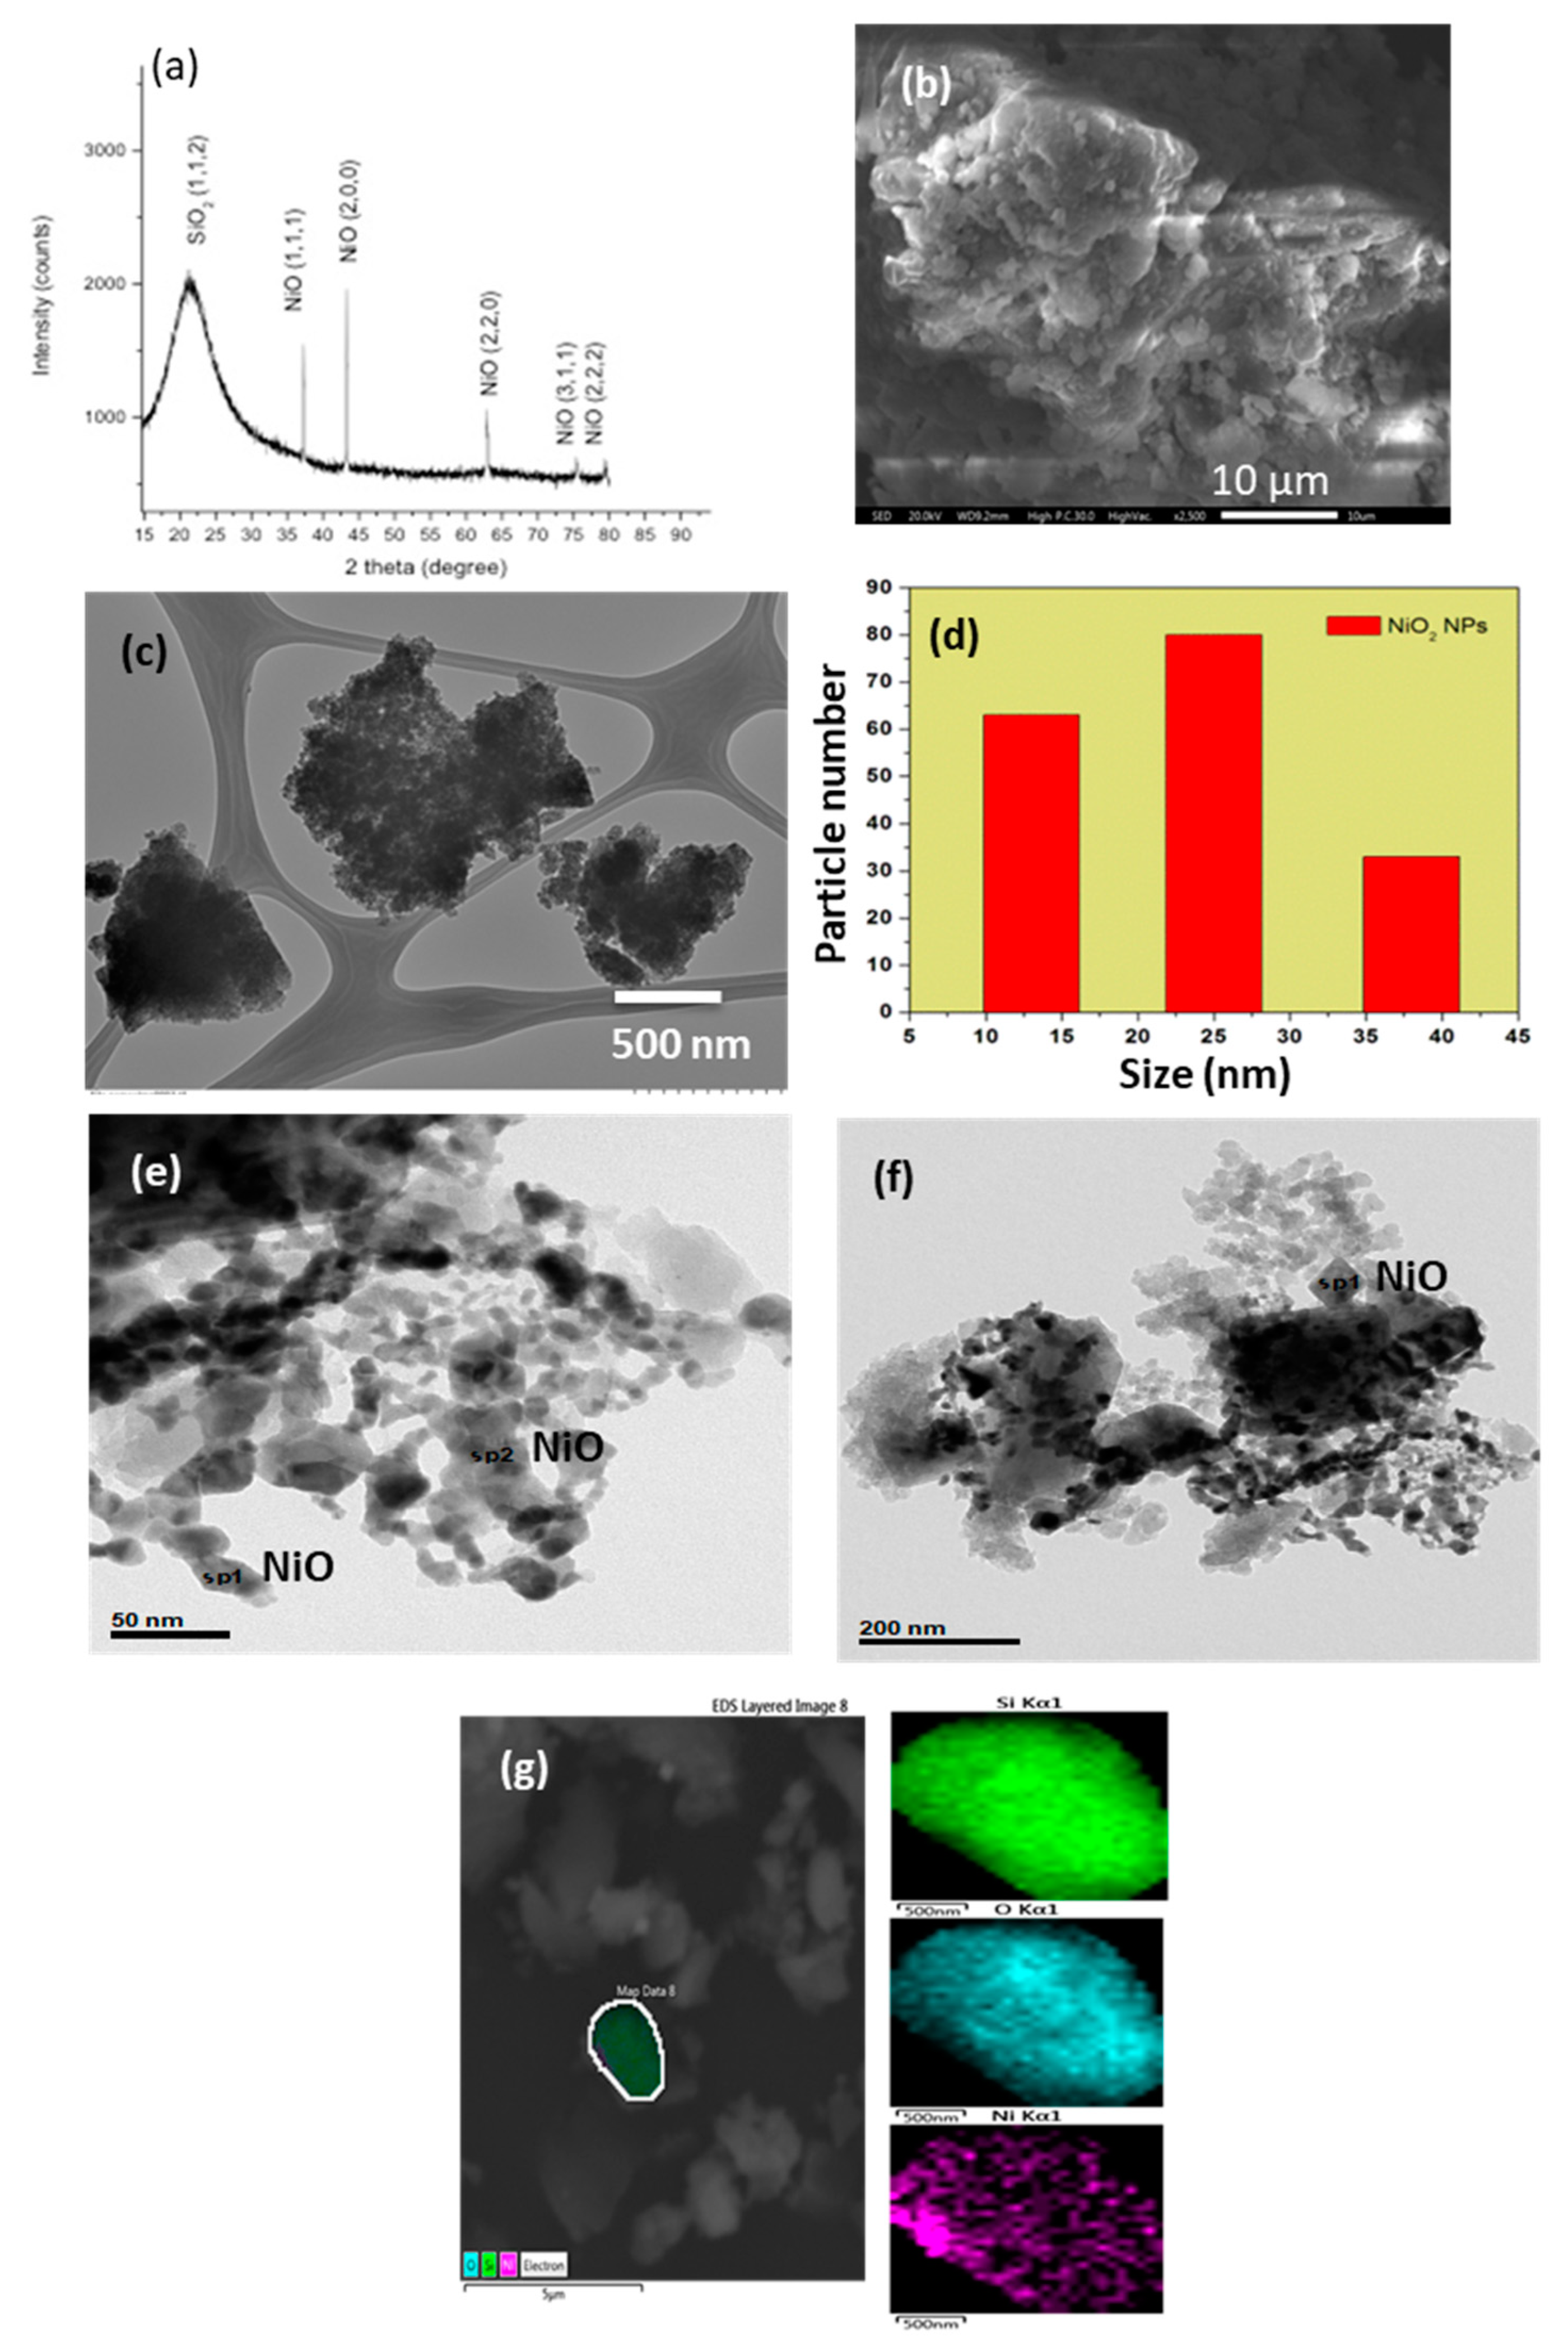
3.1. Composite NiO/SiO2
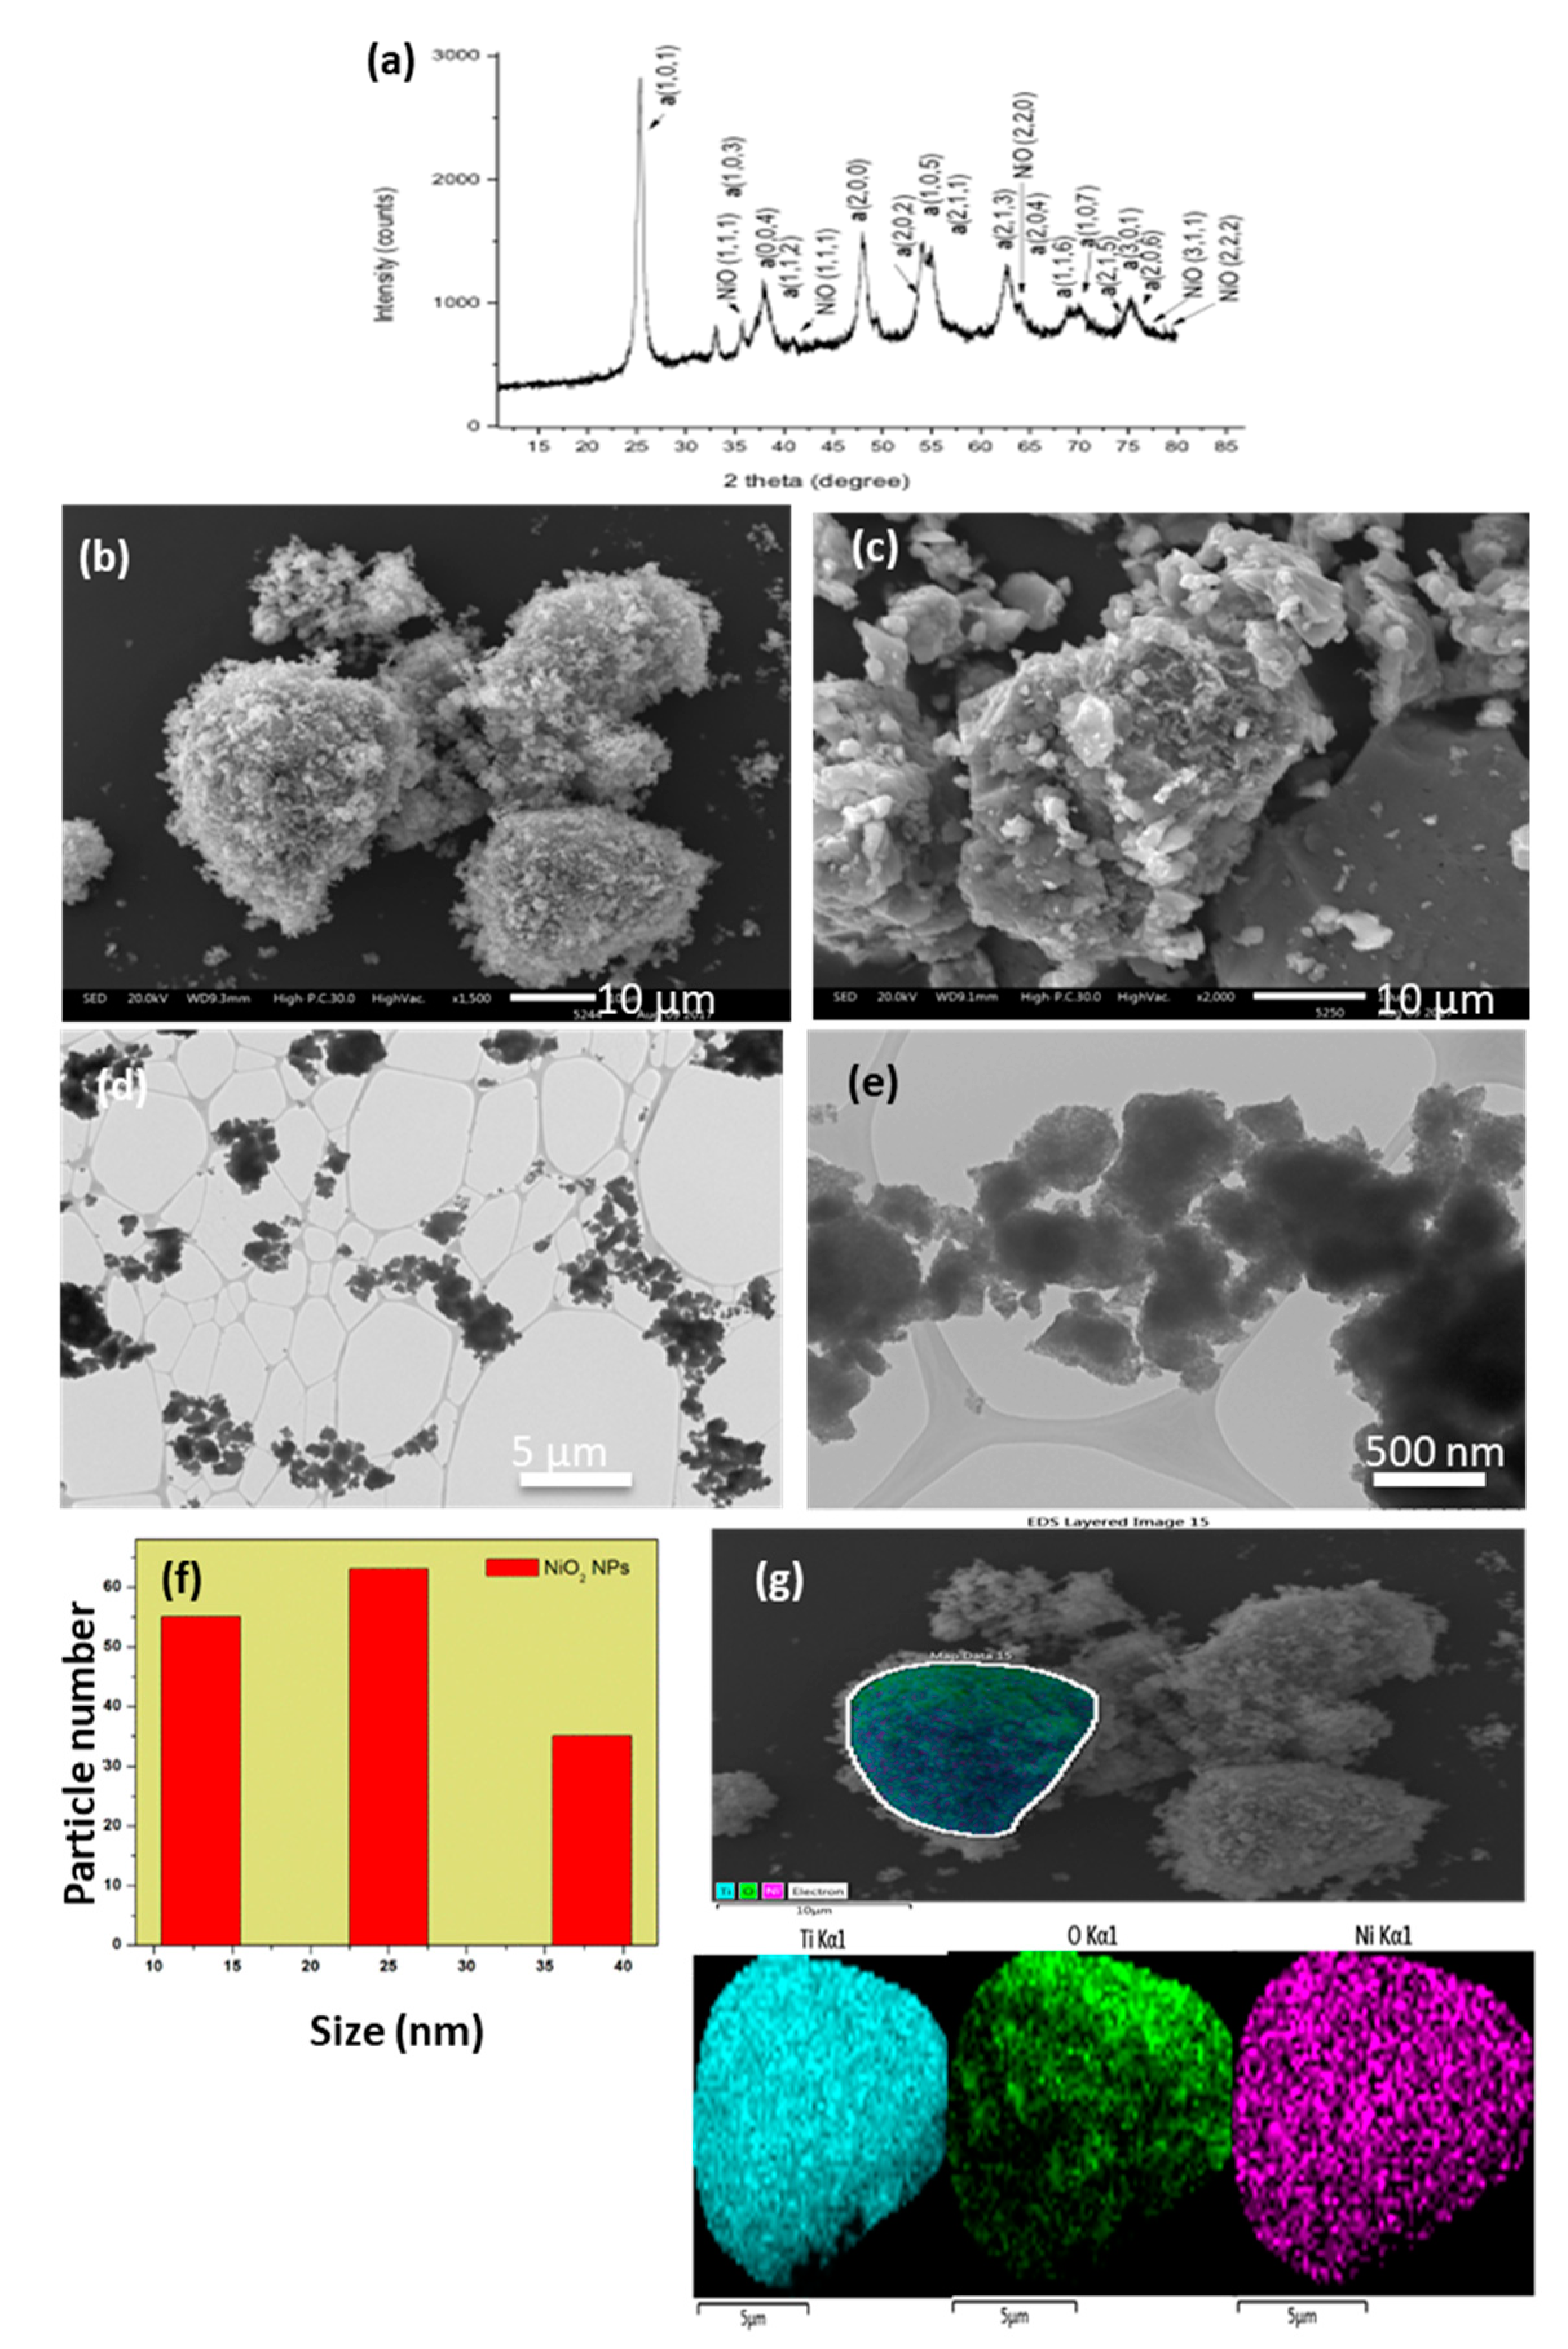
3.2. NiO/TiO2
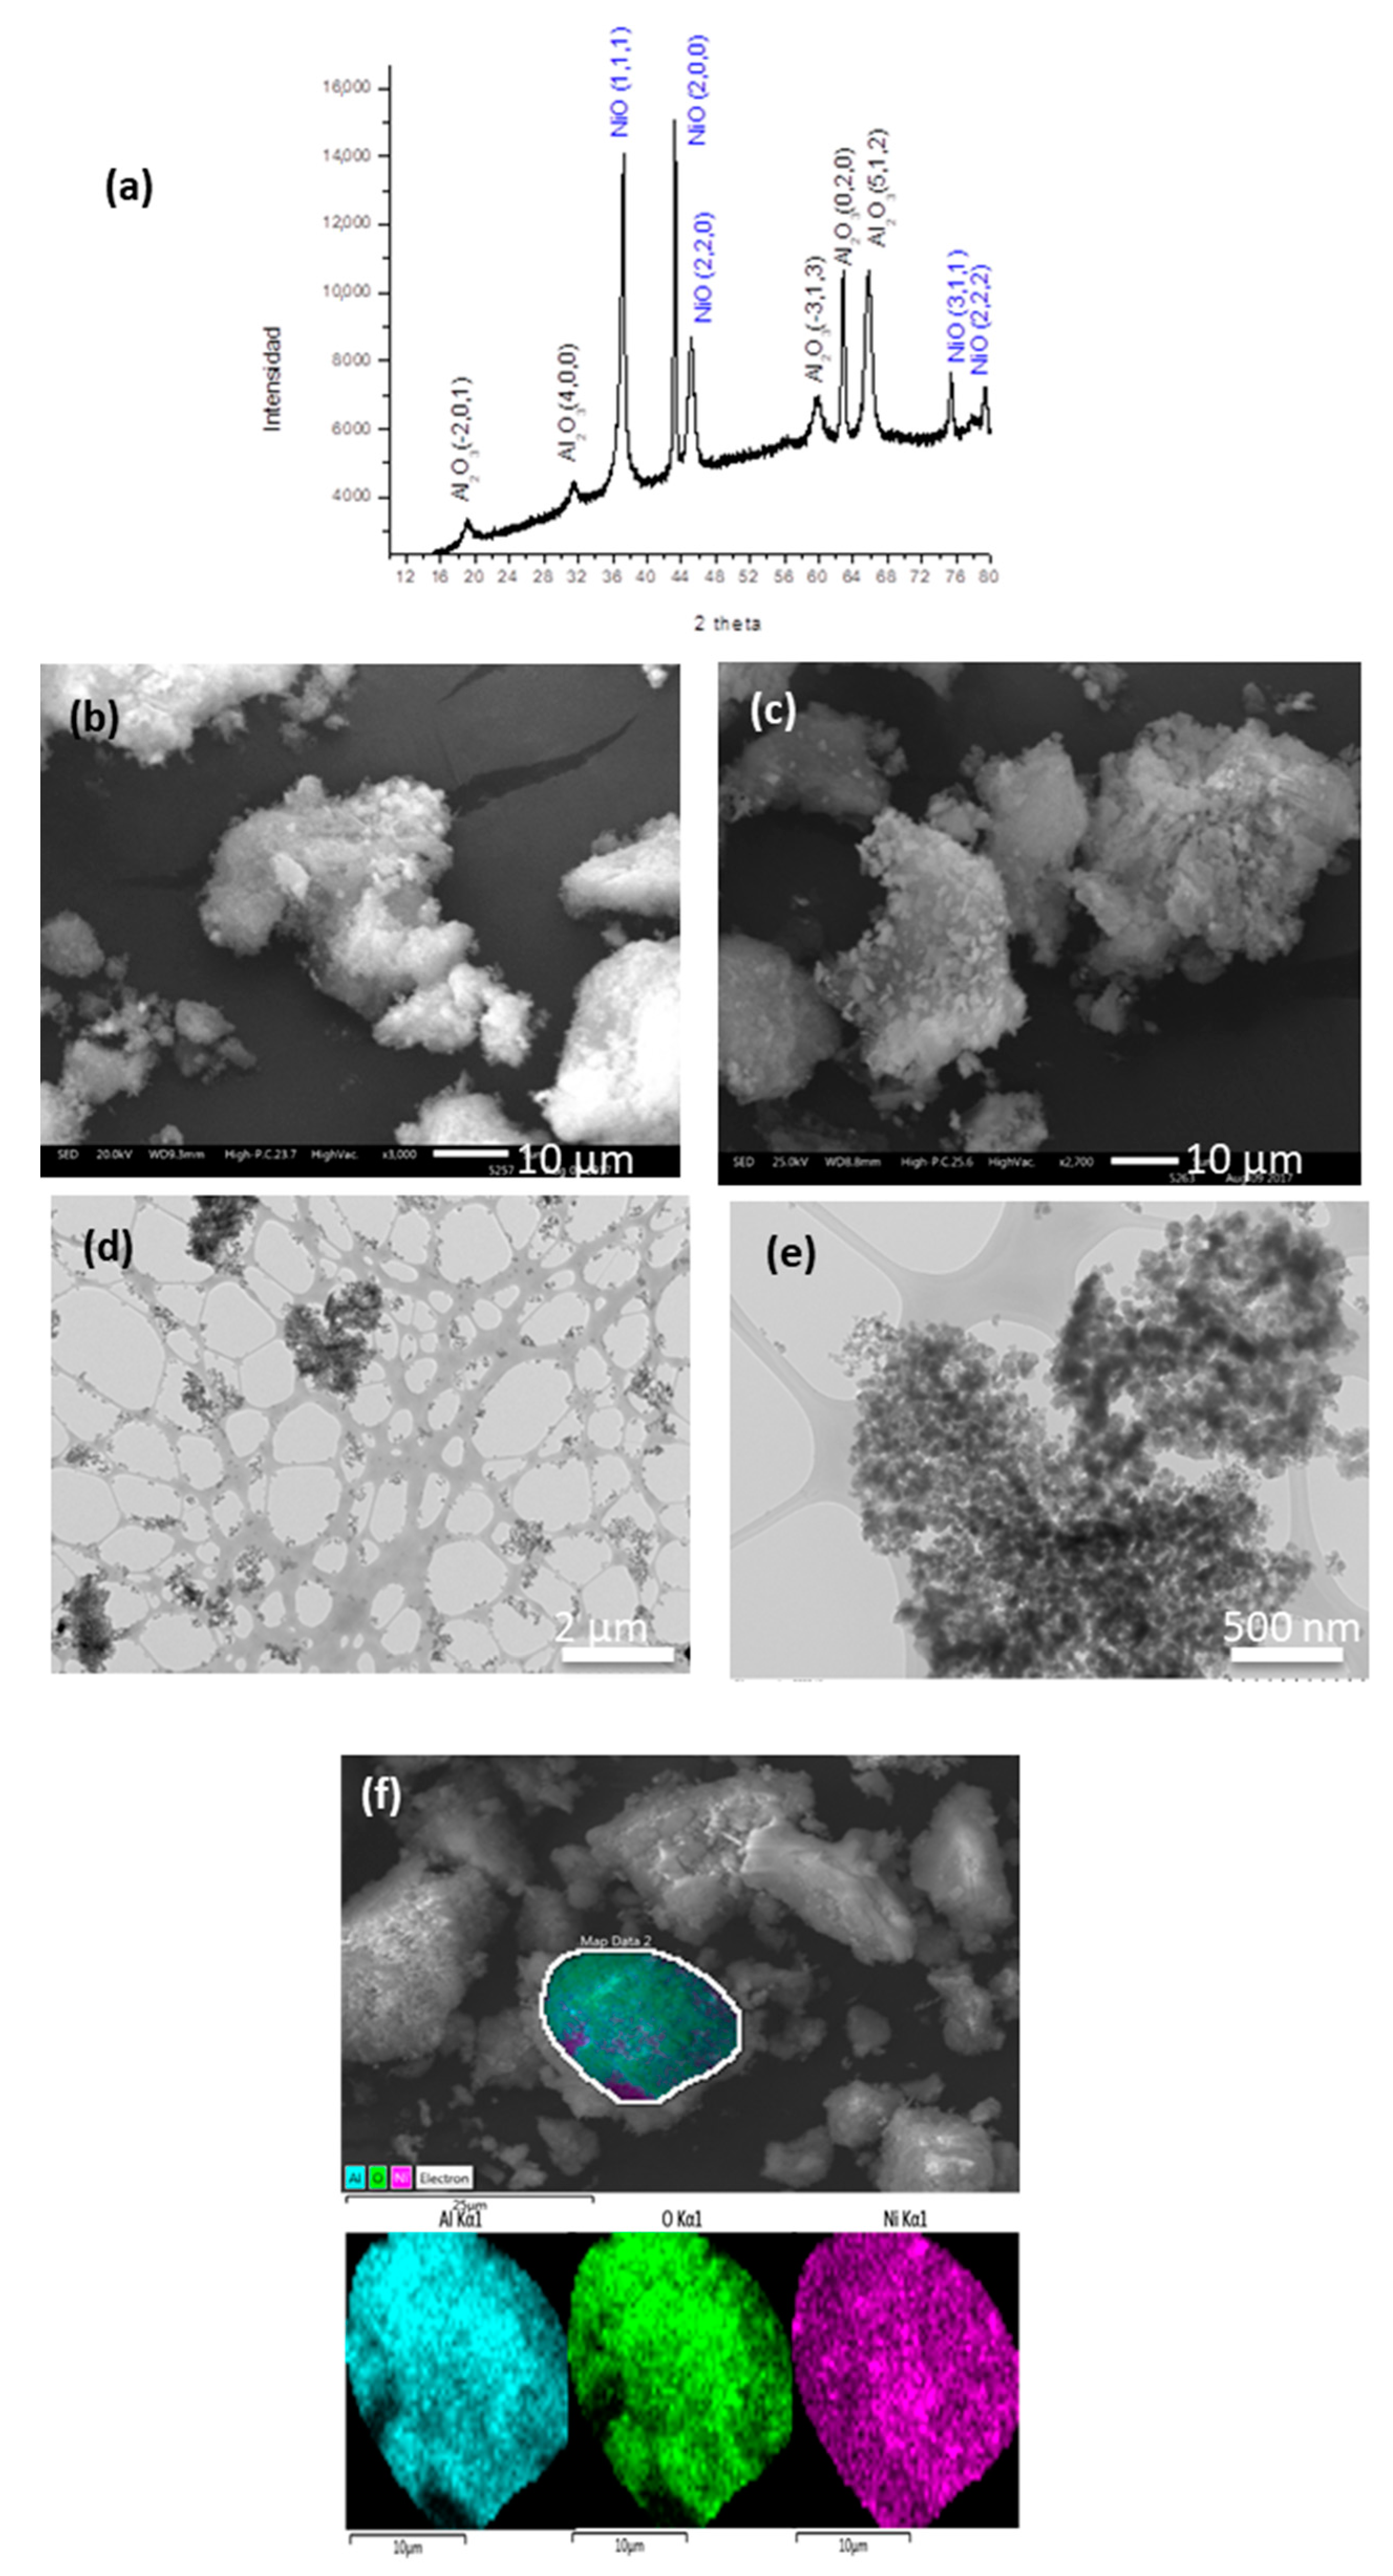
3.3. NiO/Al2O3
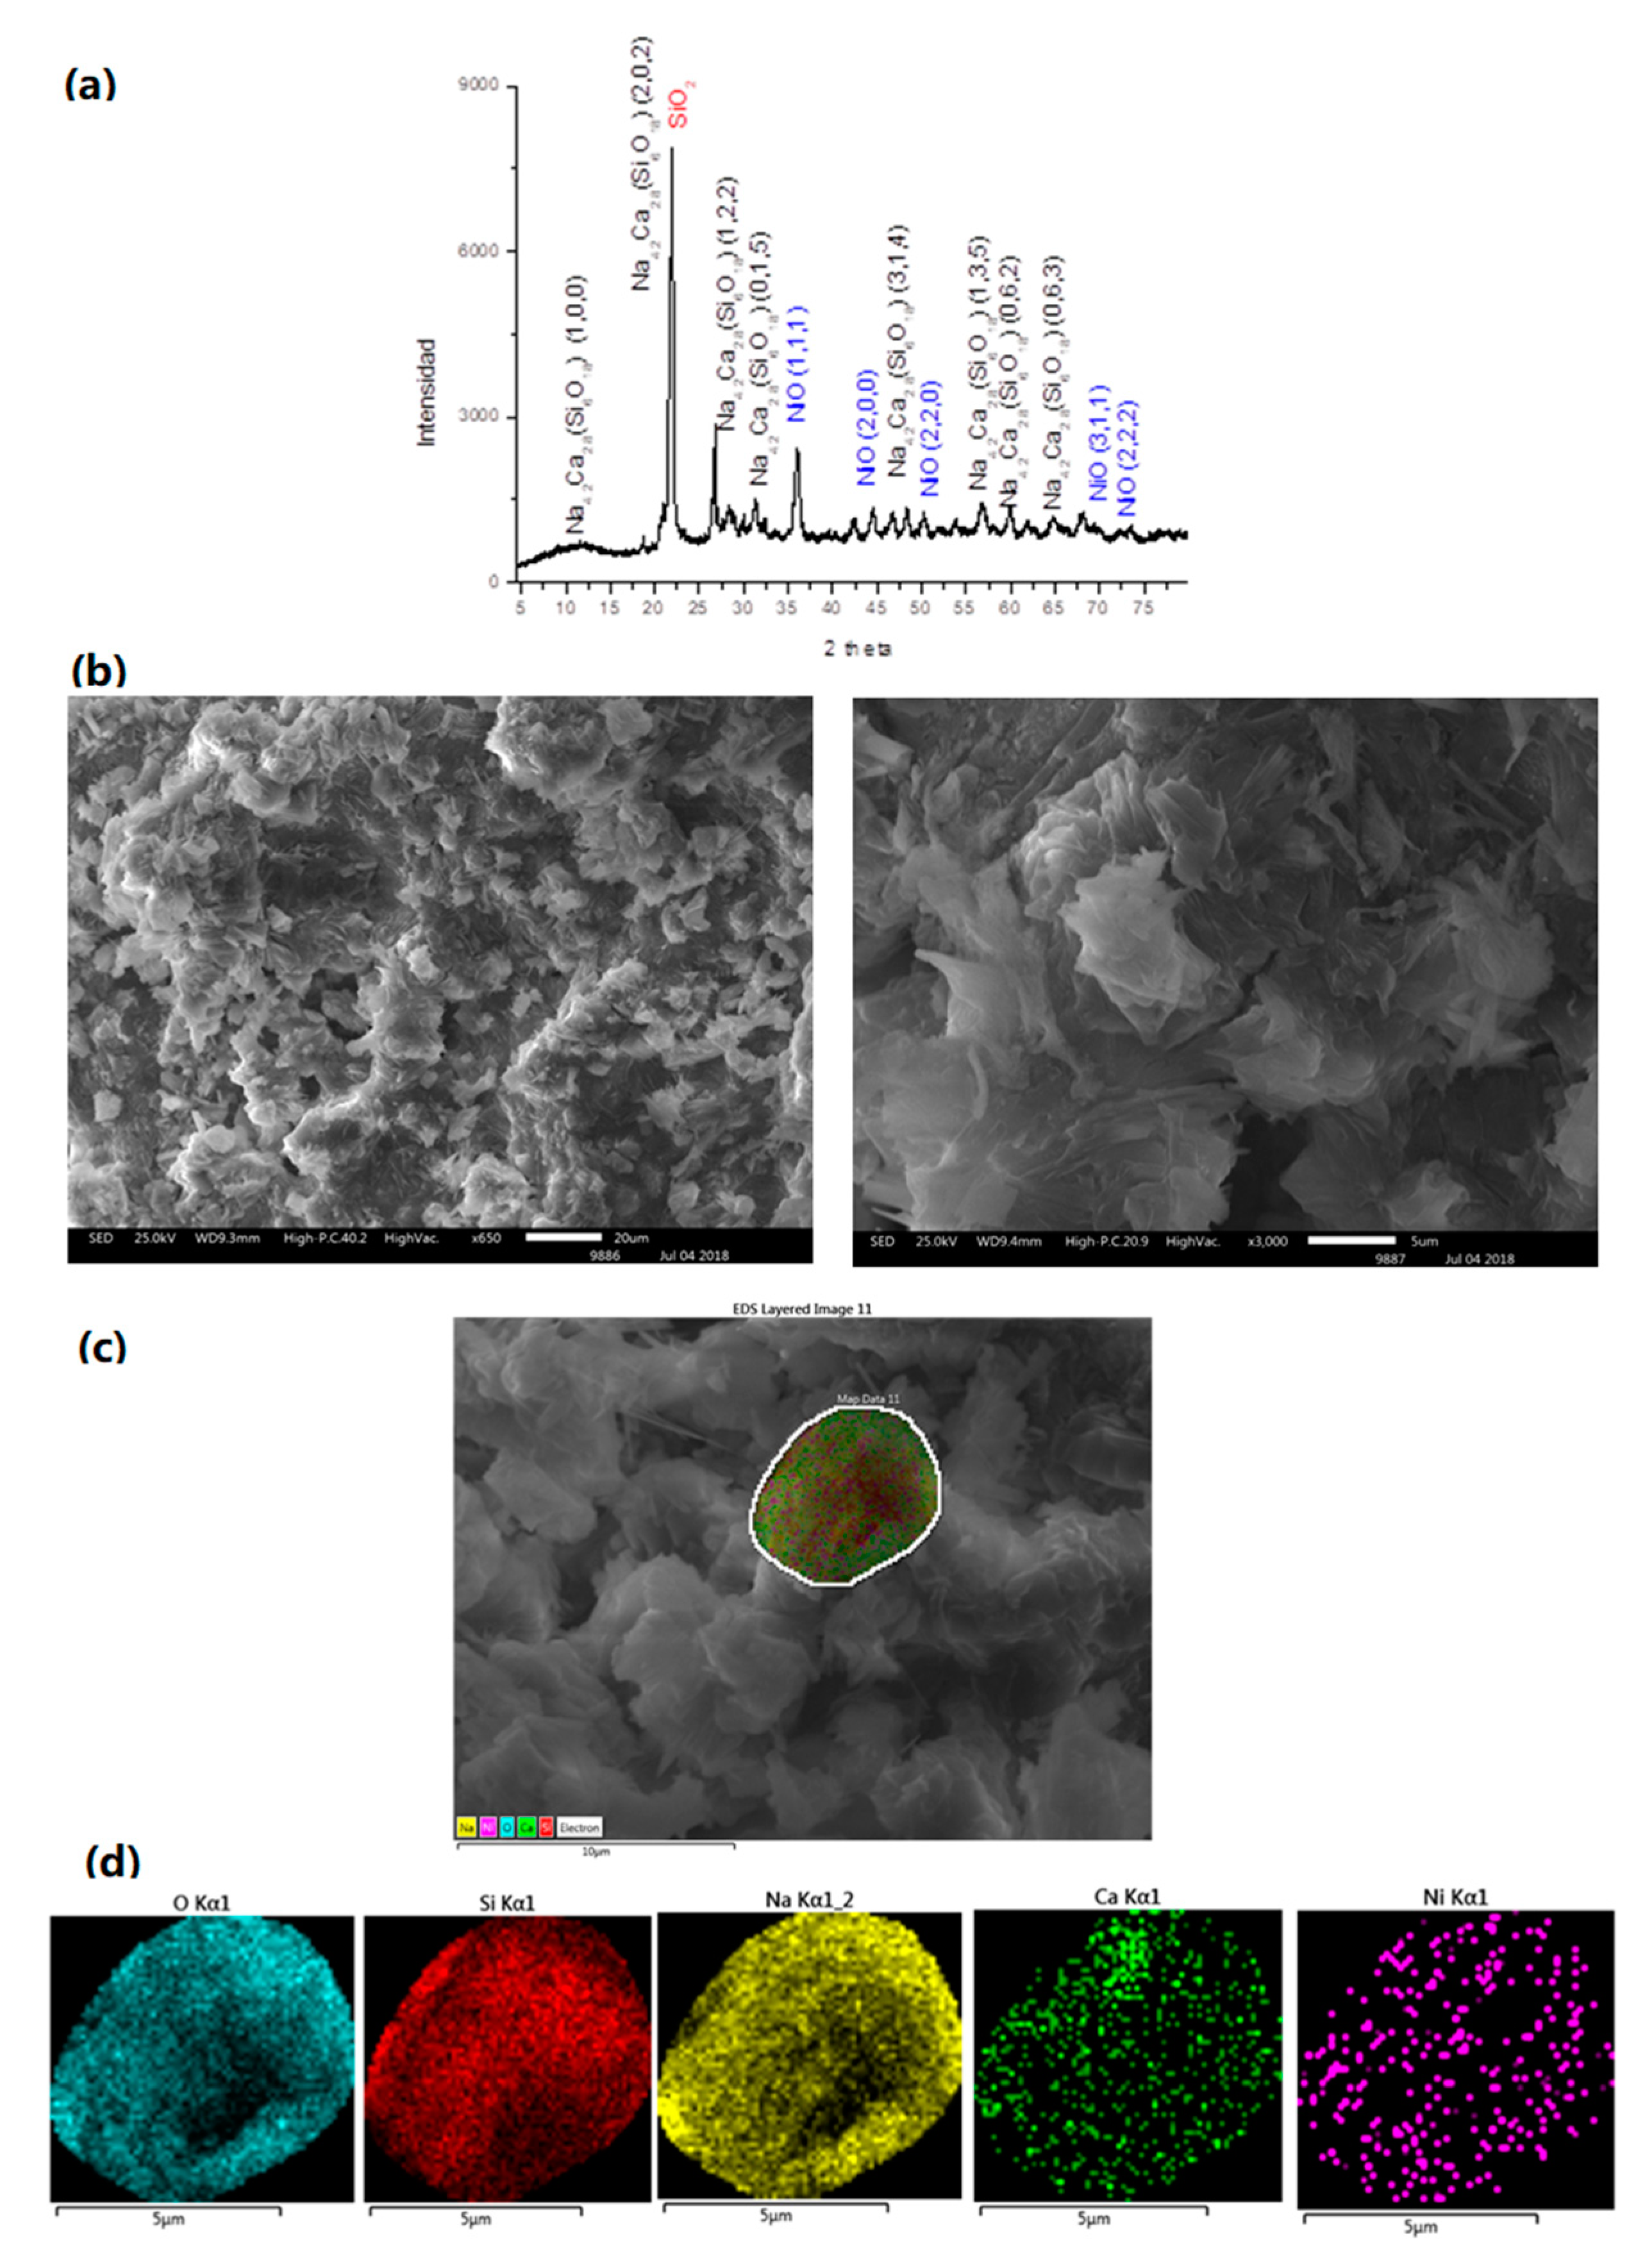
3.4. NiO/Na4.2Ca2.8(Si6O18)
3.5. Photocatalytic Behavior
3.6. NiO
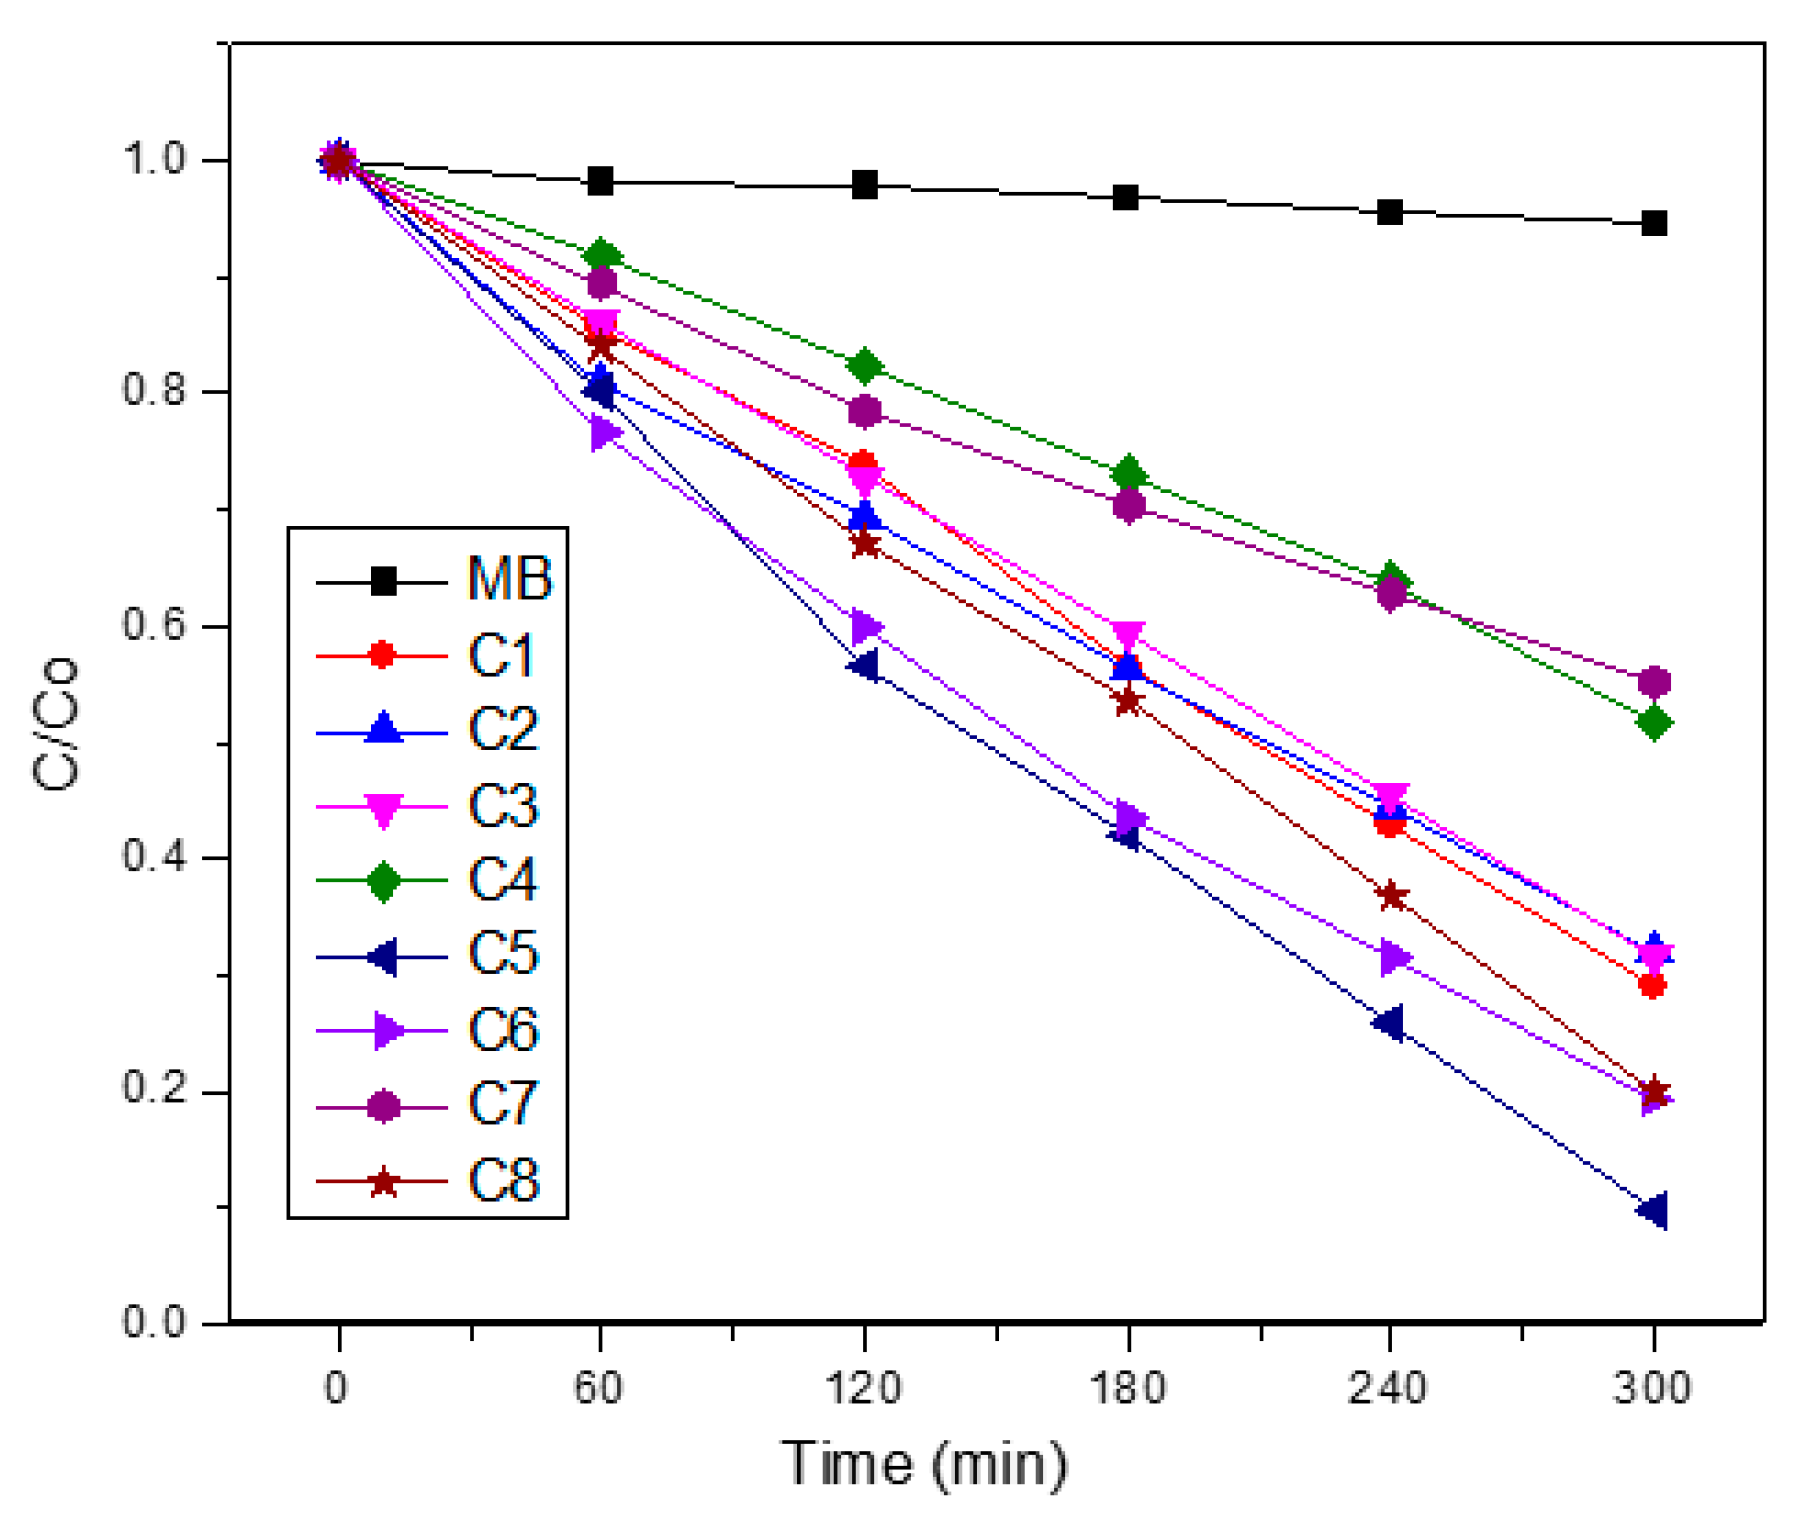
3.7. NiO in Matrices
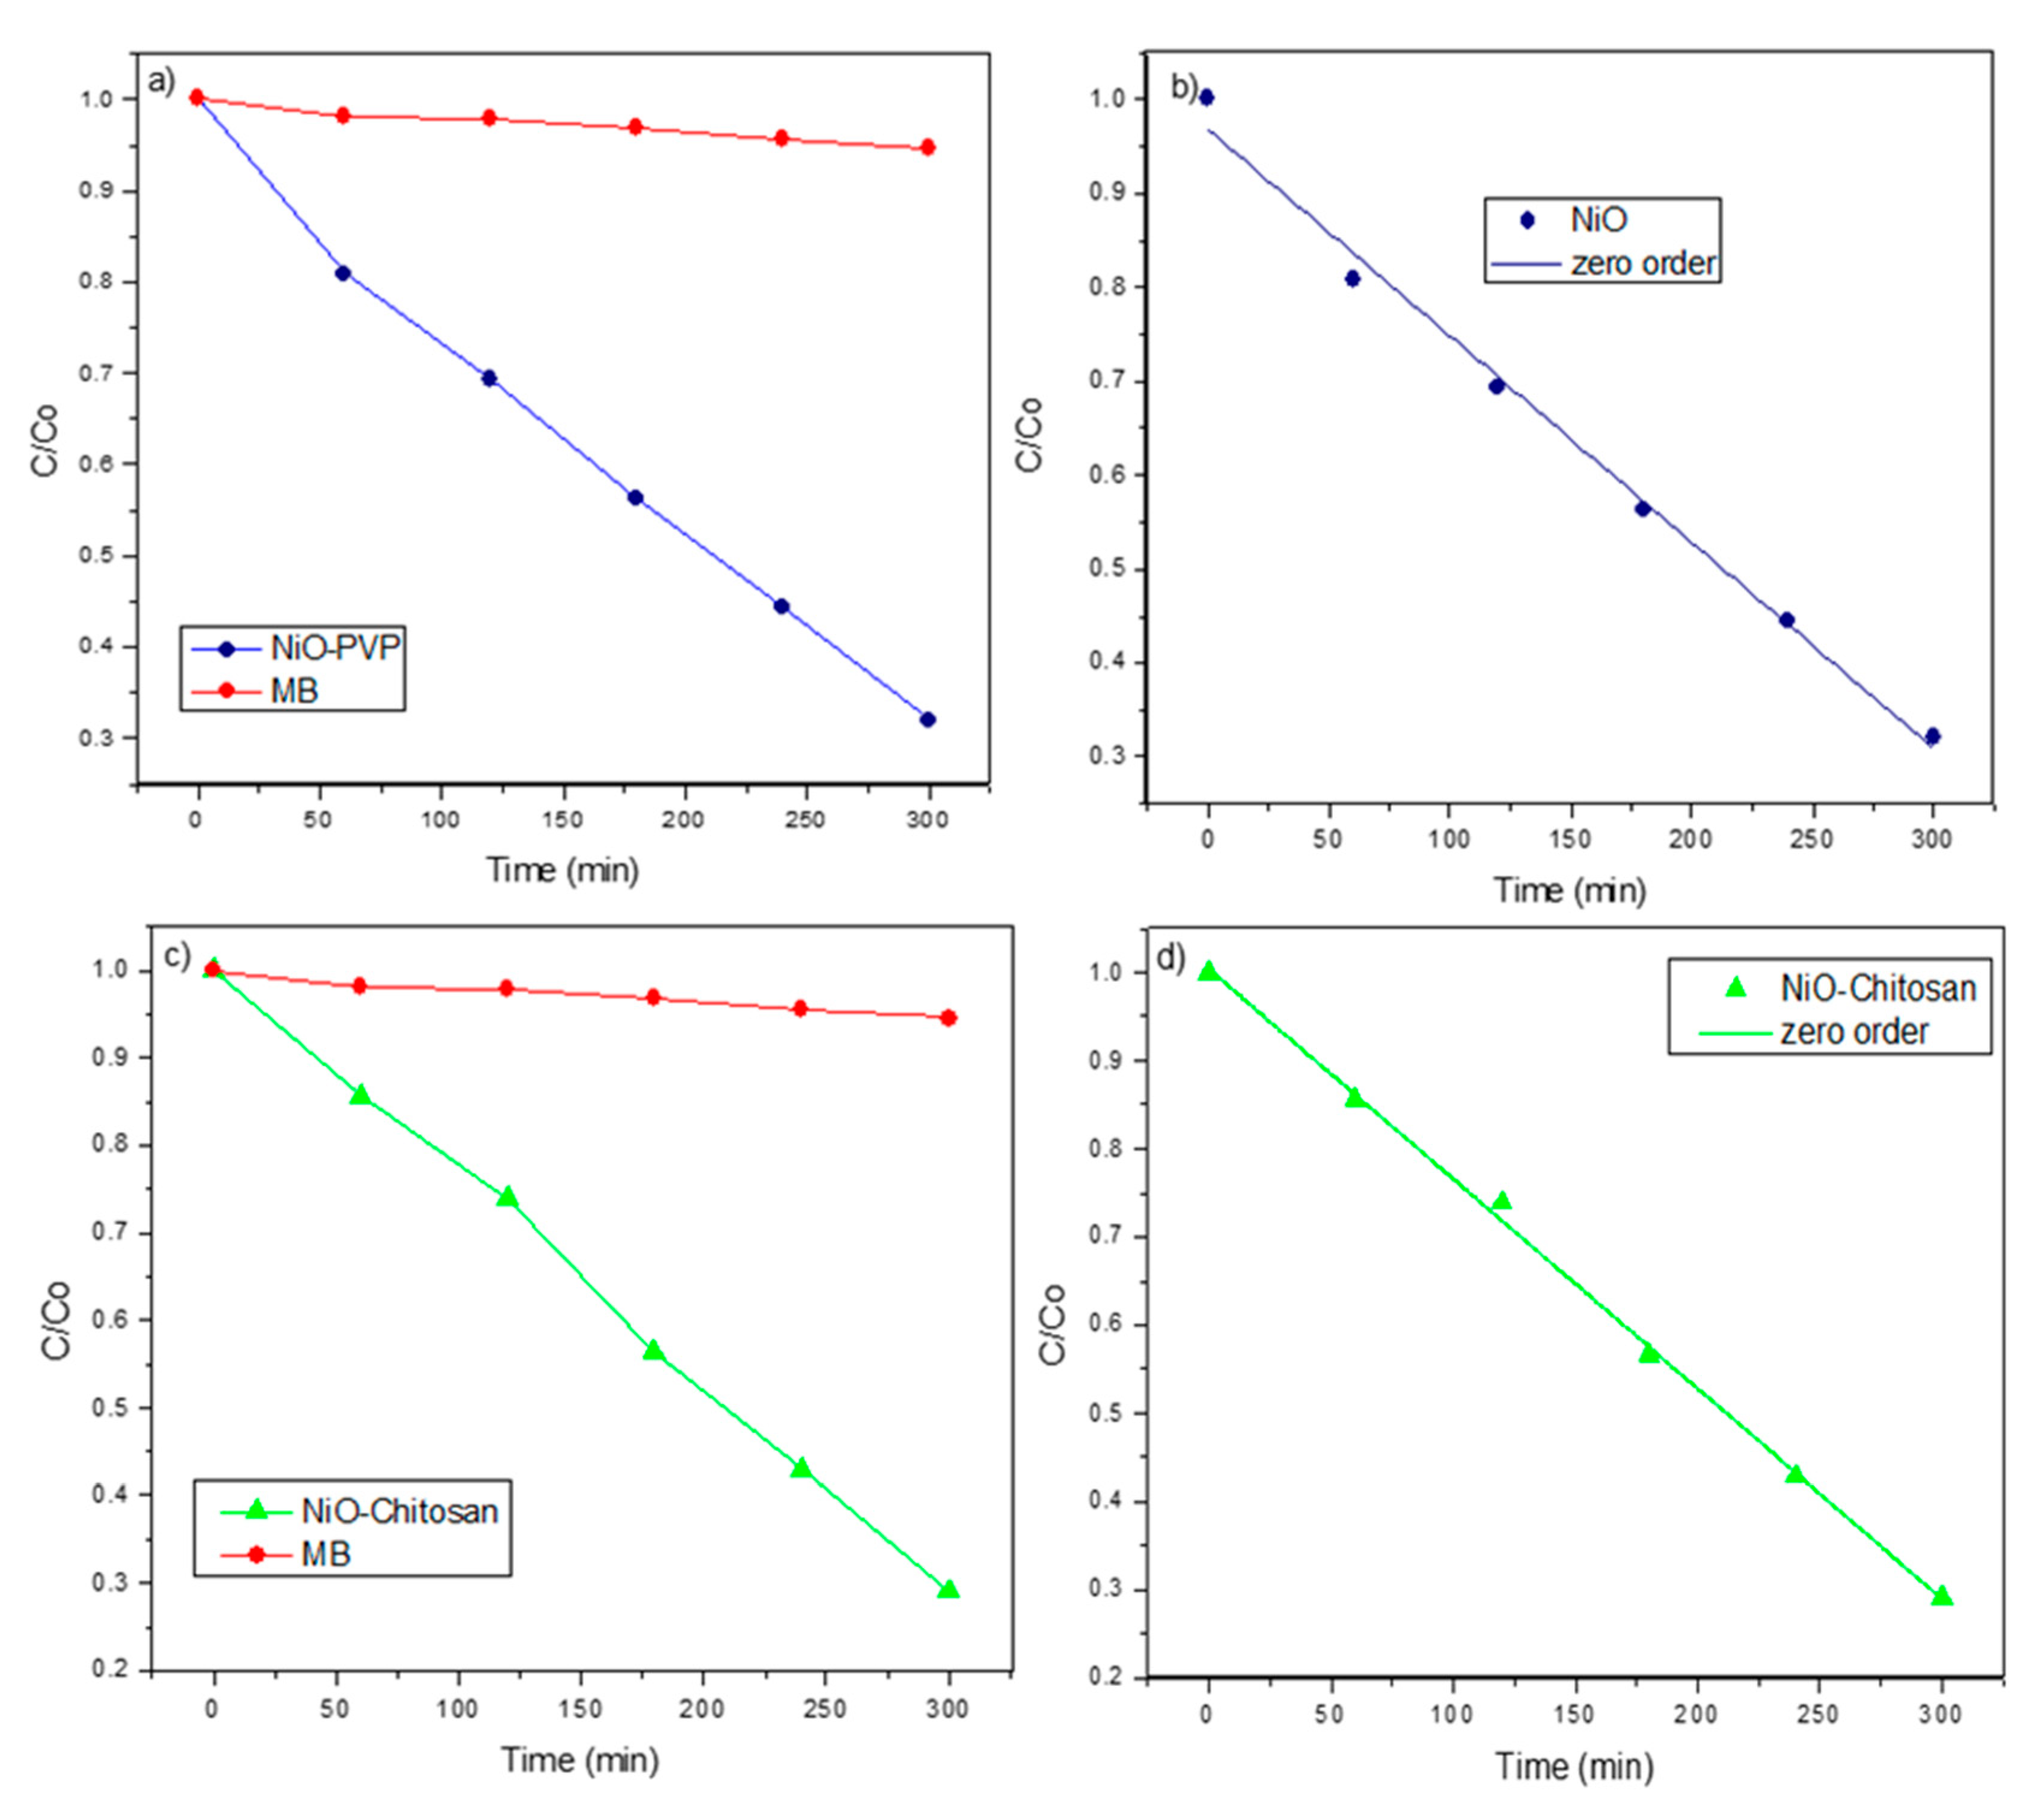
3.8. Photocatalytic Activity of the NiO/Na4.2Ca2.8(Si6O18) Composite
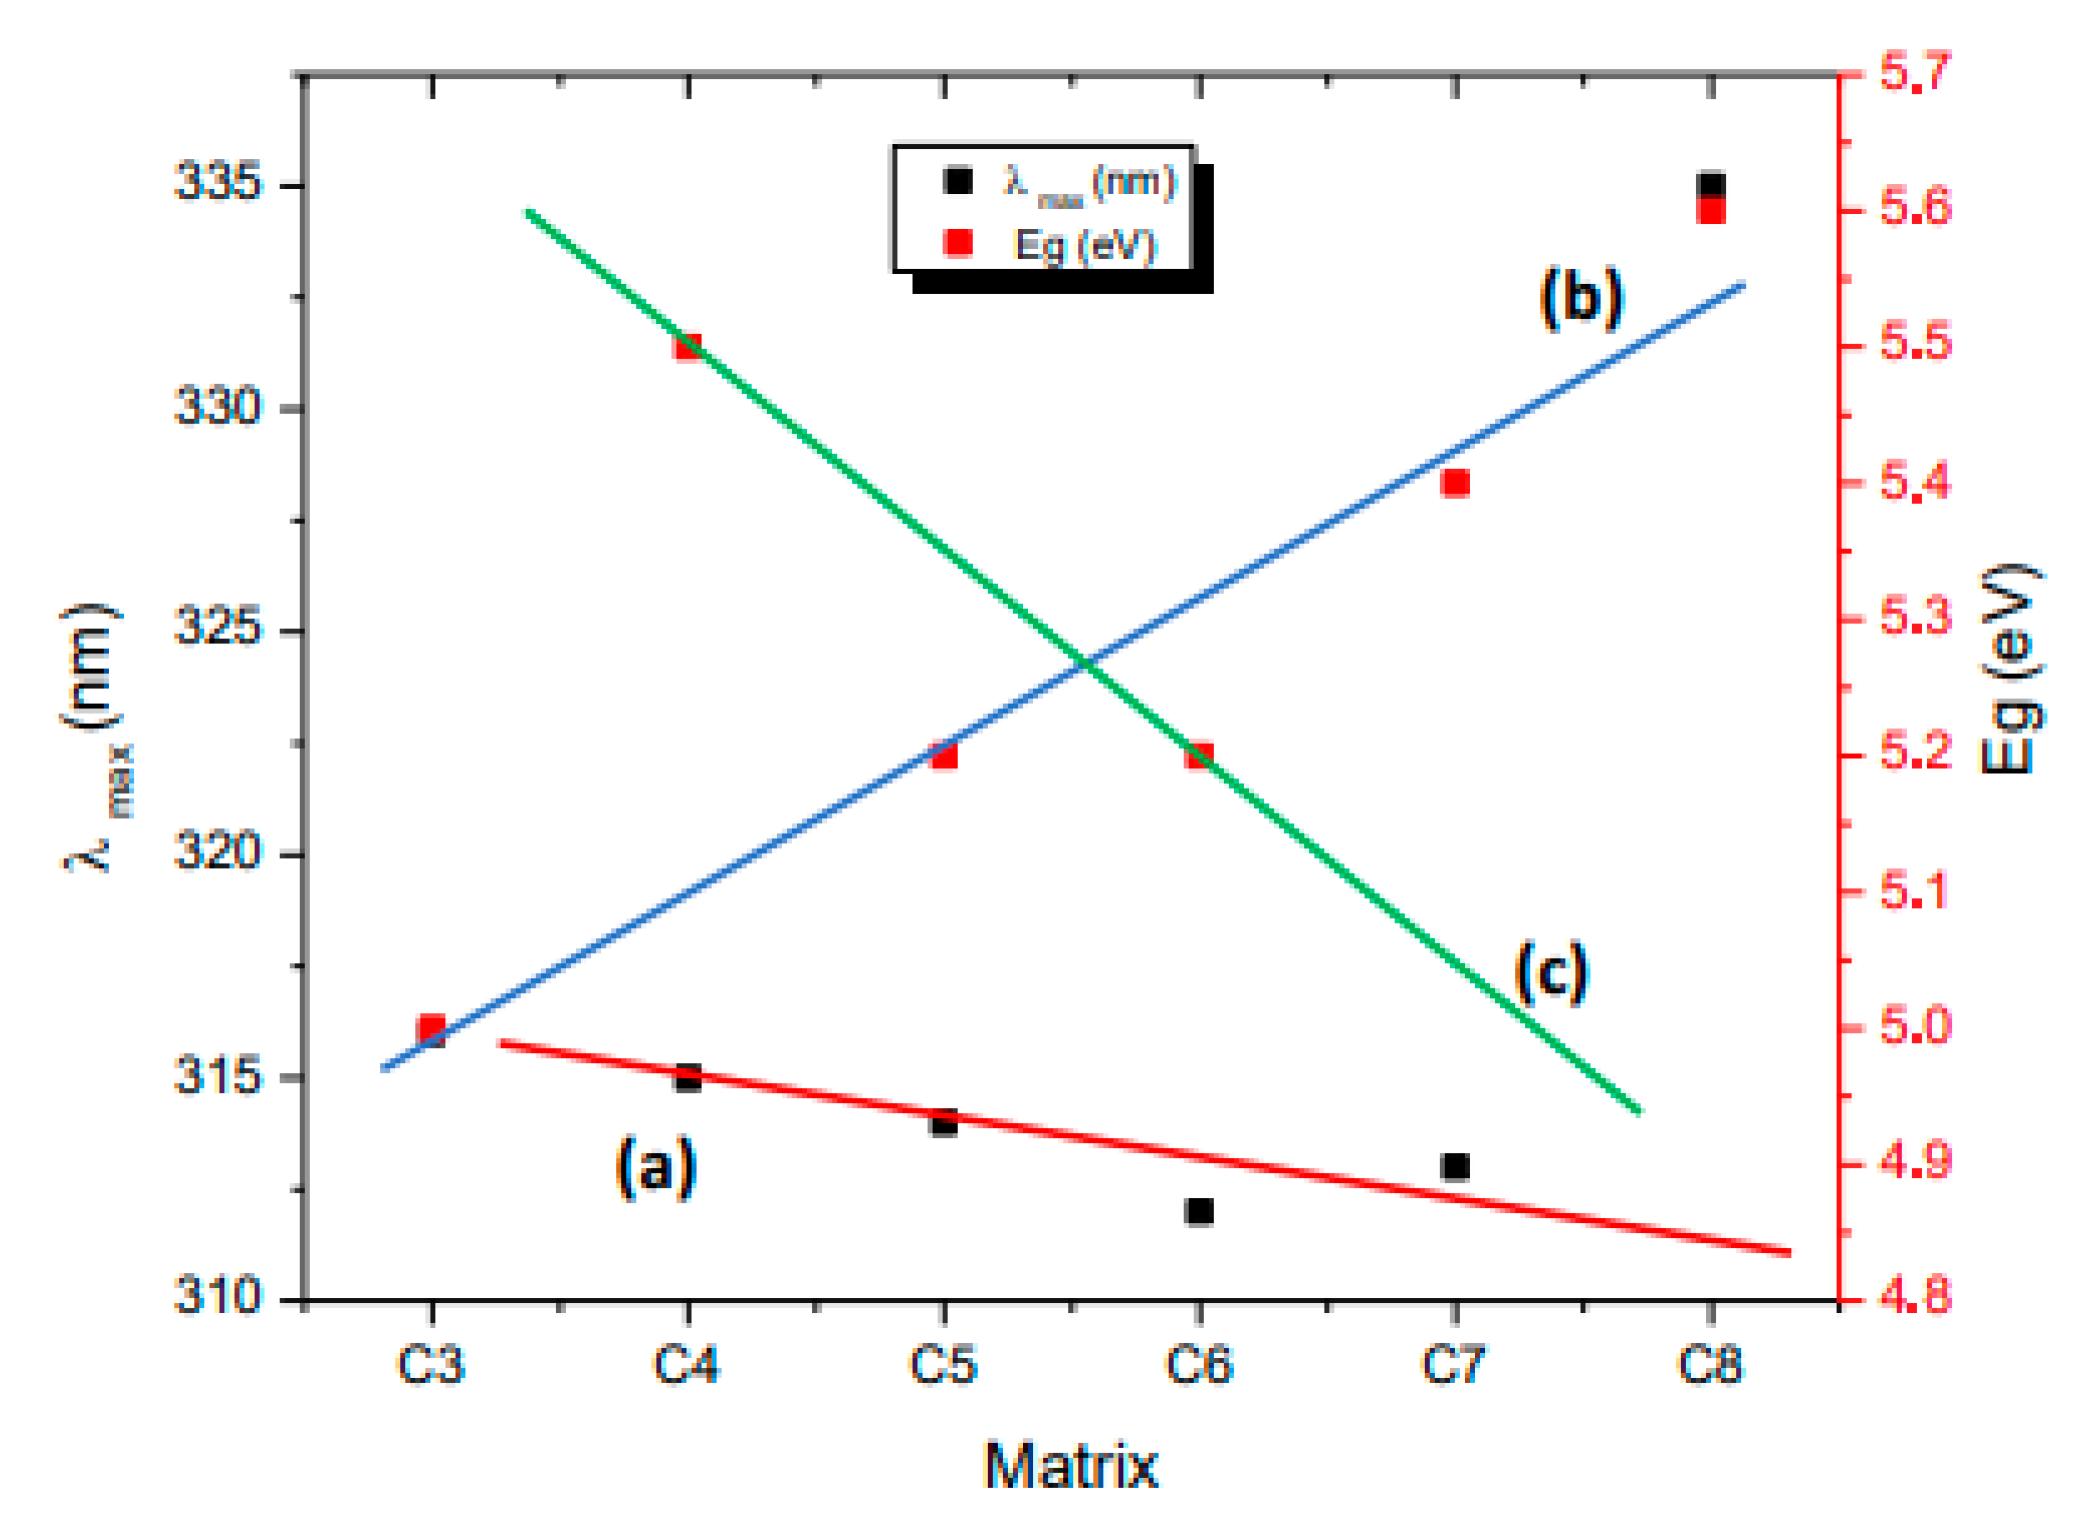
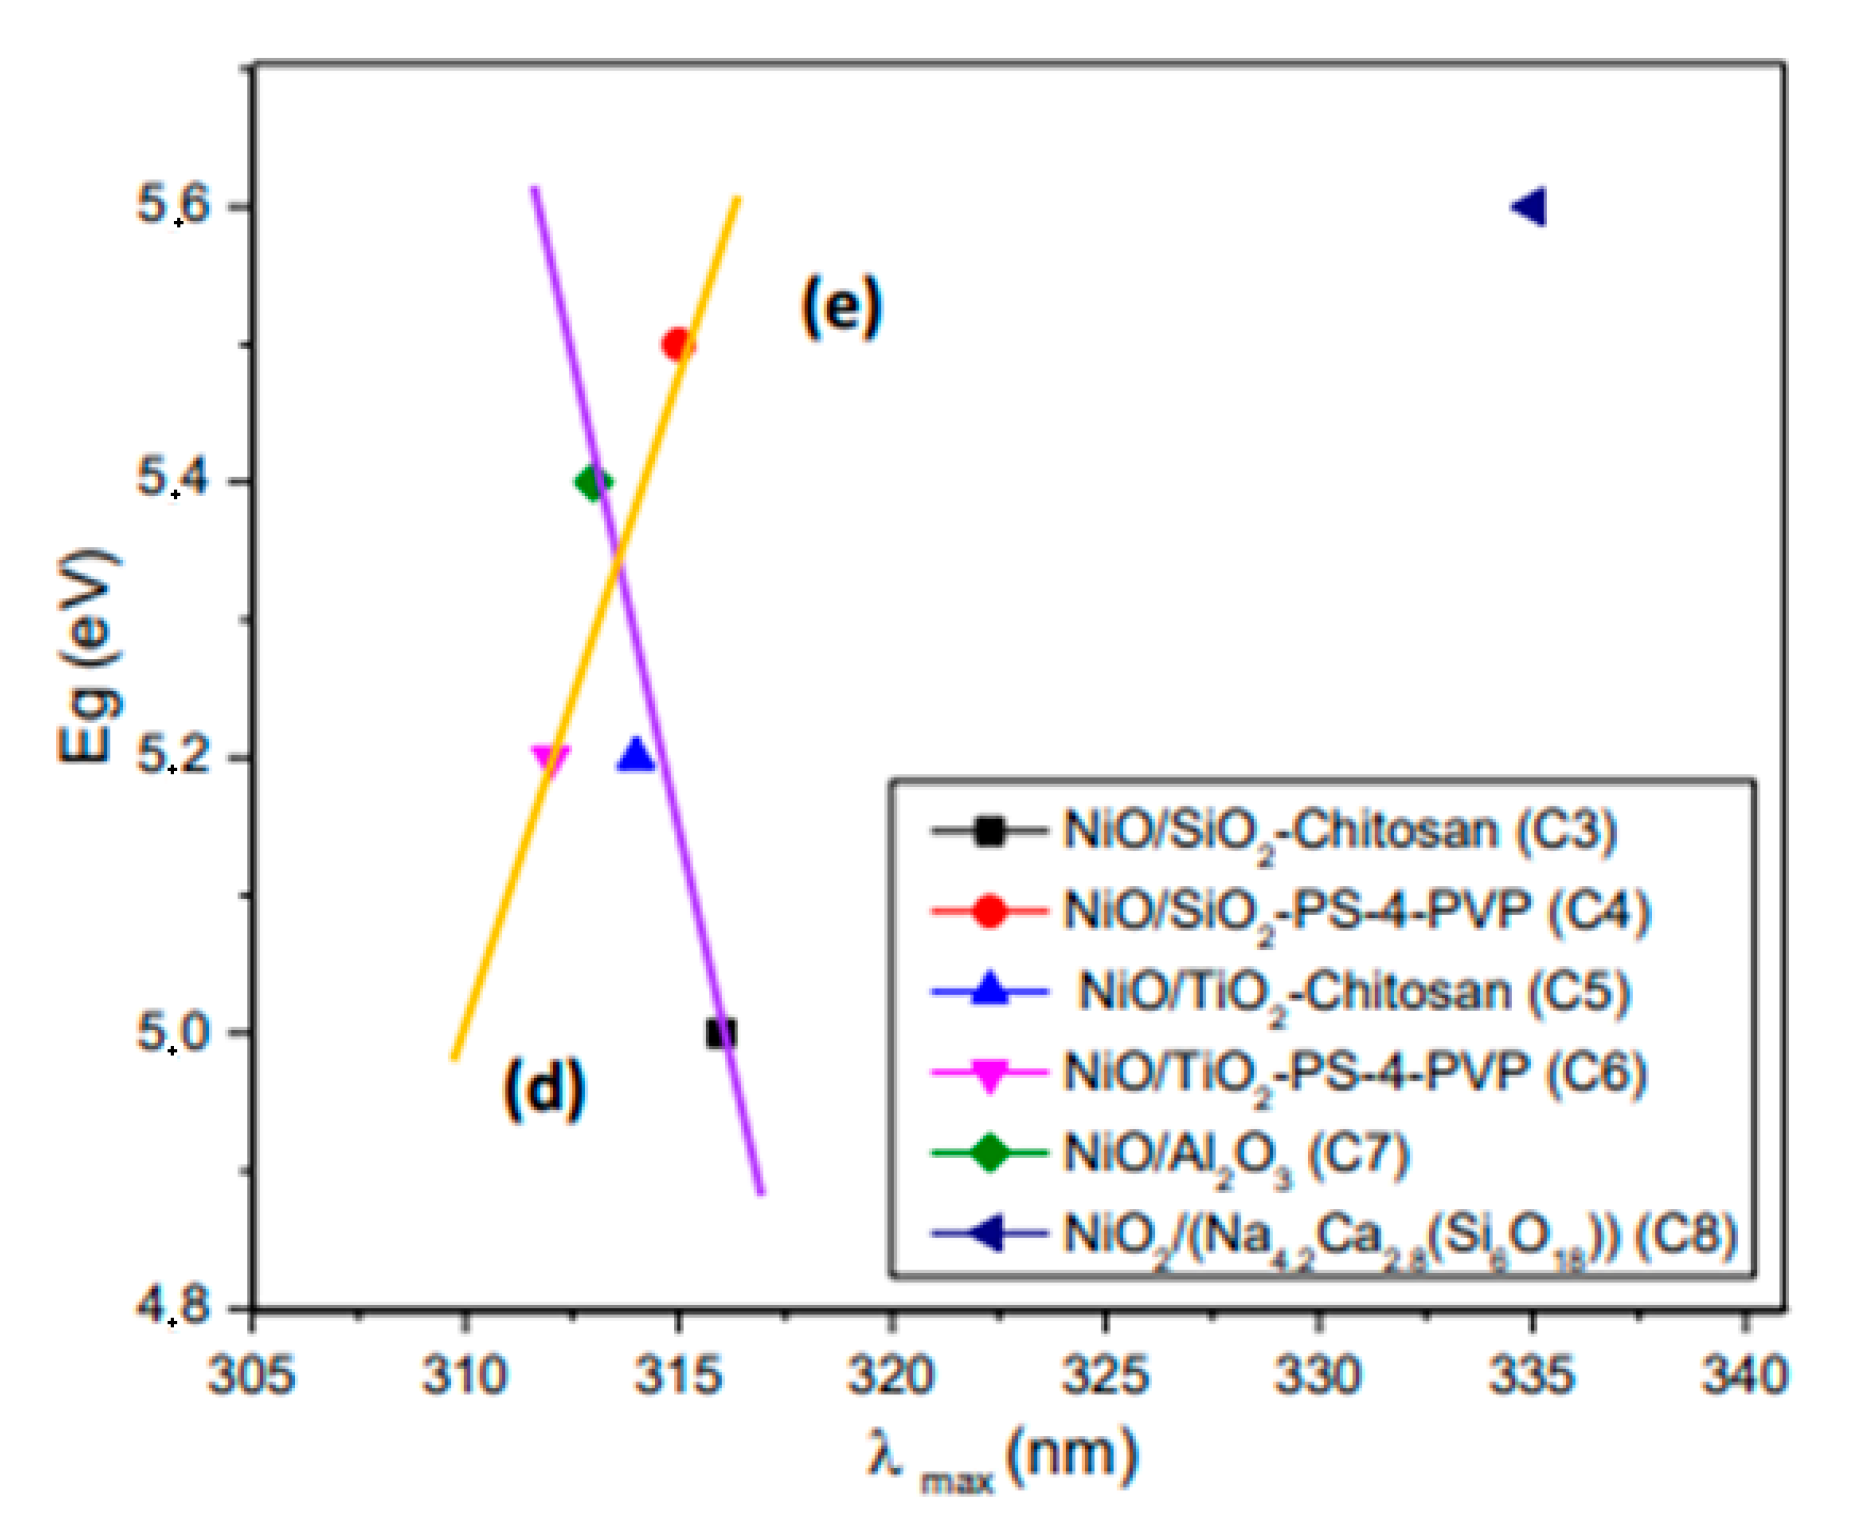
3.9. Effect of the Matrices on λmax and Eg
4. Conclusions
Supplementary Materials
Author Contributions
Funding
Conflicts of Interest
References
- Fernandez-Garcia, E.; Martinez-Arias, A.; Hanson, J.C.; Rodriguez, J.A. Nanostructured oxides in chemistry: Characterization and properties. Chem. Rev. 2014, 104, 4063–4104. [Google Scholar] [CrossRef] [PubMed]
- Srivastava, A.K. Oxide Nanostructures, Growth, Macrostructures and Properties; Pan Stanford Publishing: Singapore, 2014. [Google Scholar]
- Liu, S.; Han, M.-Y. Silica-coated metal nanoparticles. Chem. Asian J. 2010, 5, 36–45. [Google Scholar] [CrossRef]
- Sietsma, J.R.A.; Meeldijk, J.D.; Den Breejen, J.P.; Versluijs-Helder, M.; van Dillen, J.A.; De Jongh, P.E.; De Jong, K.P. The Preparation of Supported NiO and Co3O4 Nanoparticles by the Nitric Oxide Controlled Thermal Decomposition of Nitrates. Angew. Chem. Int. Ed. 2007, 46, 4547–4549. [Google Scholar] [CrossRef] [PubMed]
- Zhang, Z.; Shao, C.; Li, X.; Wang, C.; Zhang, M.; Liu, Y. Electrospun Nanofibers of p~Type NiO/n~Type ZnO Heterojunctions with Enhanced Photocatalytyc Activity. ACS Appl. Mater. Interface Sci. 2010, 10, 2915–2923. [Google Scholar] [CrossRef] [PubMed]
- Yu, J.; Wang, W.; Cheng, B. Synthesis and Enhanced Photocatalytic Activity of a Hierarchical Porous Flowerlike p–n Junction NiO/TiO2 Photocatalyst. Chem. Asian 2010, 5, 2499–2506. [Google Scholar] [CrossRef] [PubMed]
- Bonomo, M.; Dini, D.; Decker, F. Electrochemical and Photoelectrochemical Properties of Nickel Oxide (NiO) with Nanostructured Morphology for Photoconversion Applications. Front. Chem. 2018, 6, 601. [Google Scholar] [CrossRef] [PubMed]
- Jensen, T.R.; Duval, M.L.; Kelly, K.L.; Lazarides, A.A.; Schatz, G.C.; Van Duye, R.P. Nanosphere Lithography: Effect of the External Dielectric Medium on the Surface Plasmon Resonance Spectrum of a Periodic Array of Silver Nanoparticles. J. Phys. Chem. 1999, 103, 9846–9853. [Google Scholar] [CrossRef]
- Kelly, K.L.; Coronado, E.; Zhao, L.L.; Schatz, G. The optical properties of metal nanoparticles: The influence of size, shape, and dielectric environment. J. Phys. Chem. 2003, 107, 668–677. [Google Scholar] [CrossRef]
- Prevel, B.; Palpant, B.; Lerme, J.; Pellarin, M.; Treilleux, M.; Saviot, L.; Duval, E.; Perez, A.; Broyer, M. Comparative Analysis of Optica Properties of Gold and Silver Clusters Embedded in Alumina Matrix. NanoStructured Mater. 1999, 12, 307–310. [Google Scholar] [CrossRef]
- Matsuoka, J.; Yoshida, H.; Nasu, H.; Kamiya, K. Preparation of Gold Microcrystal-Doped TiO2, ZrO2 and Al2O3 Films through Sol-Gel Process. J. Sol Gel. Tech. 1997, 9, 145–155. [Google Scholar] [CrossRef]
- Chandra, P.; Doke, D.S.; Unbarkar, S.D.; Biradar, A.V. One-pot synthesis of ultrasmall MoO3 nanoparticles supported on SiO2, TiO2, and ZrO2 nanospheres: An efficient epoxidation catalyst. J. Mater. Chem. A 2014, 2, 19056–19060. [Google Scholar] [CrossRef]
- Soares, V.O.; Daguano, J.K.M.B.; Lombello, C.B.; Bianchin, O.S.; Gonçalves, L.M.G.; Zanotto Edgar, D. New sintered wollastonite glass-ceramic for biomedical applications. Ceram. Int. 2018, 44, 20019–20027. [Google Scholar] [CrossRef]
- Volzone, C.; Stábile, F.M. Structural Changes by Thermal Treatment up to Glass Obtention of P2O5-Na2O-CaO-SiO2 Compounds with Bioglass Composition Types. New J. Glass Ceram. 2013, 3, 53–57. [Google Scholar] [CrossRef] [Green Version]
- Martel Estrada, S.A.; Armendáriz, I.O.; Torres García, A.; Hernández, J.F.; Rodríguez, C.A. González Evaluation of In Vitro Bioactivity of 45S5 Bioactive Glass/Poly Lactic Acid Scaffolds Produced by 3D Printing. Int. J. Compos. Mater. 2017, 7, 144–149. [Google Scholar]
- Diaz, C.; Barrientos, L.; Carrillo, D.; Valdebenito, J.; Valenzuela, M.L.; Allende, P.; Geaney, H.; O’Dwyer, C. Solvent-less method for efficient photocatalytic α-Fe2O3 nanoparticles using macromolecular polymeric precursors. New J. Chem. 2016, 40, 6768–6776. [Google Scholar] [CrossRef]
- Diaz, C.; Valenzuela, M.L.; Laguna-Bercero, M.A.; Orera, A.; Bobadilla, D.; Abarca, S.; Peña, O. Synthesis and magnetic properties of nanostructured metallic Co, Mn and Ni oxide materials obtained from solid-state metal macromolecular complex precursors. RSC Adv. 2017, 7, 27729–27736. [Google Scholar] [CrossRef] [Green Version]
- Díaz, C.; Valenzuela, M.L.; Laguna, A.; Lavayen, V.; Jimenez, J.; Power, L.; O’Dwyer, C. Metallophosphazene Precursor Routes to Solid-State Deposition of Metallic and Dielectric Micro- and Nanostructures on Si and SiO2. Langmuir 2010, 26, 10223–10233. [Google Scholar] [CrossRef]
- Díaz, C.; Valenzuela, M.L.; Segovia, M.; De la Campa, R.; Soto, A.P. Solution, Solid-State Two Step Synthesis and Optical Properties of ZnO and SnO Nanoparticles and Their Nanocomposites with SiO2. J. Clust. Sci. 2018, 29, 251–266. [Google Scholar] [CrossRef] [Green Version]
- Díaz, C.; Valenzuela, M.L.; Bobadilla, D.; Laguna-Bercero, M.A. Bimetallic Au//Ag Alloys inside SiO2 using a solid-state method. J. Clust. Sci. 2017, 28, 2809–2815. [Google Scholar] [CrossRef] [Green Version]
- Zong, J.; Zhu, Y.; Yang, X.; Li, C. Confined growth of CuO, NiO, and Co3O4 nanocrystals in mesoporous silica (MS) spheres. J. Alloys Compd. 2011, 509, 2970–2975. [Google Scholar] [CrossRef]
- Shufu, C.; Sujuan, Z.; Wei, L.; Wei, Z. Preparation and activity evaluation of p-n junction photocatalyst NiO/TiO2. J. Hazard. Mater. 2008, 155, 320–326. [Google Scholar] [CrossRef] [PubMed]
- Yu, J.H.; Yang, H.; Jung, R.H.; Lee, J.W.; Boo, J.H. Hierarchical NiO/TiO2 composite structures for enhanced electrochromic durability. Thin Solid Films 2018, 664, 1–5. [Google Scholar] [CrossRef]
- Chen, J.-Z.; Chen, T.-H.; Lai, L.-W.; Li, P.-Y.; Liu, H.-W.; Hong, Y.-Y.; Liu, D.-S. Preparation and Characterization of Suface Photocatalytic Activity with NiO/TiO2 Nanocomposite Structure. Materials 2015, 8, 4273–4286. [Google Scholar] [CrossRef] [Green Version]
- Wang, T.T.; Chiang, C.L.; Lin, Y.C.; Srinivasadesikan, V.; Lin, M.C.; Lin, Y.G. KSCN-activation of hydrogenated NiO/TiO2 for enhanced photocatalytic hydrogen evolution. Appl. Surf. Sci. 2020, 511, 145548. [Google Scholar] [CrossRef]
- Makhlouf, S.; AKhalil, K.M.S. Humidity sensing properties of NiO/Al2O3 nanocomposite materials. Solid State Ion. 2003, 164, 97–106. [Google Scholar] [CrossRef]
- Rogojan, R.; Andronescu, E.; Ghitulica, C.; Vasile, B. Synthesis and Characterization of Alumina Nano-power Obtanined by Sol-Gel Method. UPB Sci. Bull. Ser. B 2011, 73, 67–76. [Google Scholar]
- Adams, L.A.; Essien, E.R.; Shaibu, R.O.; Oki, A. Sol-Gel Synthesis of SiO2-CaO-Na2O-P2O5 Bioactive Glass Ceramic from Sodium Metasilicate. New J. Glass Ceram. 2013, 3, 11–15. [Google Scholar] [CrossRef] [Green Version]
- Kamire, R.J.; Majewski, M.B.; Hoffeditz, W.L.; Ohelan, B.T.; Farha, O.K.; Hupop, J.T.; Wasielewski, M.R. Photodriven hydrogen evolution by molecular catalysts using Al2O3-protected perylene-3,4-dicarboximide on NiO electrodes. Chem. Sci. 2017, 8, 541–549. [Google Scholar] [CrossRef] [Green Version]
- El-Shaarawy, M.; El-rafa, M.A.; Gouda, M.; Khoder, H.; Ramadan, M. Electrical and Optical Properties for Nano (SiO2)100-x:(NiO)x Glass Matrix. IOSR J. Appl. Phys. 2014, 6, 18–29. [Google Scholar] [CrossRef]
- Díaz, C.; Valenzuela, M.L. Metallic Nanostructures Using Oligo and Polyphosphazenes as Template or Stabilizer in Solid State. In Encyclopedia of Nanoscience and Nanotechnology; Nalwa, H.S., Ed.; American Scientific Publishers: Valencia, CA, USA, 2010; Volume 16, pp. 239–256. [Google Scholar]
- Wang, X.; Li, X.; Sun, X.; Li, F.; Wang, Q.; He, D. Nanostructured NiO electrode for high rate Li-ion batteries. J. Mater. Chem. 2011, 21, 3571–3573. [Google Scholar] [CrossRef]
- Dar, F.I.; Moonooswamy, K.R.; Es-Souni, M. Morphology and property control of NiO nanostructures for supercapacitor applications. Nanoscale Res. 2013, 8, 1–7. [Google Scholar] [CrossRef] [Green Version]
- Duan, H.; Zheng, X.; Yuan, S.; Li, Y.; Tian, Z.; Deng, Z.; Su, B. Sub-3 nm NiO nanoparticles: Controlled synthesis, and photocatalytic activity. Mater. Lett. 2012, 81, 245–247. [Google Scholar]
- Wang, C.; Li, J.; Liang, X.; Zhang, Y.; Guo, G. Photocatalytic organic pollutants degradation in metal–organic frameworks. Energy Environ. Sci. 2014, 7, 2831–2867. [Google Scholar] [CrossRef]
- Ukoba, K.O.; Eloka-Eboca, A.C.; Inambao, F.L. Review of nanostructured NiO thin film deposition using the spray pyrolysis technique. Renew. Sustain. Energy Rev. 2018, 82, 2900–2915. [Google Scholar] [CrossRef]
- Carlucci, C.; Xu, H.; Scremin, B.F.; Giannini, C.; Sibillano, T.; Carlino, E.; Videtta, V.; Gigli, G.; Ciccarella, G. Controllable one-pot synthesis of anatase TiO2 nanorods with the microwave-solvothermal method. Sci. Adv. Mater. 2014, 6, 1668–1675. [Google Scholar] [CrossRef]
- Allende-González, P.; Laguna-Bercero, M.A.; Barrientos, L.; Valenzuela, M.L.; Díaz, C. Solid State Tuning of TiO2 Morphology, Crystal Phase, and Size through Metal Macromolecular Complexes and Its Significance in the Photocatalytic Response. ACS Appl. Energy Mater. 2018, 7, 3159–3170. [Google Scholar] [CrossRef]
- Ahmed, M.A. Synthesis and structural features of mesoporous NiO/TiO2 nanocomposites prepared by sol–gel method for photodegradation of methylene blue dye. J. Photochem. Photobiol. A Chem. 2012, 238, 63–70. [Google Scholar] [CrossRef]
- Faisal, M.; Harraza, F.A.; Ismailc, A.A.; El-Tonib, A.M.; Al-Sayaria, S.A. Novel mesoporous NiO/TiO2 nanocomposites with enhanced photocatalytic activity under visible light illumination. Ceram. Int. 2018, 44, 7047–7056. [Google Scholar] [CrossRef]
- Sim, L.C.; Ng, K.W.; Ibrahim, S.; Saravanan, P. Preparation of Improved p-n Junction NiO/TiO2 Nanotubes for Solar-Energy-Driven Light Photocatalysis. Int. J. Photoenergy 2013, 2013. [Google Scholar] [CrossRef] [Green Version]
- Gangwar, J.; Gupta, B.K.; Tripathi, S.K.; Srivastava, A.K. Phase dependent thermal and spectroscopic responses of Al2O3 nanostructures with different morphogenesis. Nanoscale 2015, 7, 13313–13344. [Google Scholar] [CrossRef]
- Ravichandran, R.; Wang, A.; Wager, J. Solid state dielectric screening versus band gap trends and implications. Opt. Mater. 2016, 60, 181–187. [Google Scholar] [CrossRef] [Green Version]
- Chadi, D.J.; Cohen, M.L. Correlation between the static dielectric constant and the minimum energy gap. Phys. Lett. A 1974, 49, 381–382. [Google Scholar] [CrossRef] [Green Version]
- Kalyanaraman, S.; Shajinshinu, P.M.; Vijayalakshmi, S. Refractive index, band gap energy, dielectric constant and polarizability calculations of ferroelectric Ethylenediaminium Tetrachlorozincate crystal. J. Phys. Chem. Solid 2015, 86, 108–113. [Google Scholar] [CrossRef]
- Ghazal, M.N.; Deparis, O.; De Coninck, J.; Gaigneaux, E.M. Tailored refractive index of inorganic mesoporous mixed-oxide Bragg stacks with bio-inspired hygrochromic optical properties. J. Mater. Chem. C 2013, 1, 6202–6209. [Google Scholar] [CrossRef]
- Kischkat, J.; Peters, S.; Gruska, B.; Semtsiv, M.; Chashnikova, M.; Klinkmuller, M.; Fedosenko, O.; Machulik, S.; Alesksandrova, A.; Monastyrski, G.; et al. Mid-infrared optical properties of thin films of aluminum oxide, titanium dioxide, silicon dioxide, aluminum nitride, and silicon nitride. Appl. Opt. 2012, 51, 6789–6798. [Google Scholar] [CrossRef]
- Hervé, P.; Vandamme, L.K.J. General relation between refractive index and energy gap in semiconductors. Infrared Phys. Technol. 1994, 35, 609–615. [Google Scholar] [CrossRef]
- Kumar, V.; Singh, J.K. Model for calculating the refractive index of different materials. Indian J. Pure Appl. Phys. 2010, 48, 571–574. [Google Scholar]
- Pesika, N.S.; Stebe, K.J.; Searson, P.C. Relationship between Absorbance Spectra and Particle Size Distributions for Quantum-Sized Nanocrystals. J. Phys. Chem. B 2003, 107, 10412–10415. [Google Scholar] [CrossRef]
- Goh, E.G.; Xu, X.; McCormick, P.G. Effect of particle size on the UV absorbance of zinc oxide nanoparticles. Scr. Mater. 2014, 78–79, 49–52. [Google Scholar] [CrossRef]
- Doak, J.; Gupta, R.K.; Manivannan, K.; Ghosh, K.; Kahol, P.K. Effect of particle size distributions on absorbance spectra of gold nanoparticles. Physica E 2010, 42, 1605–1609. [Google Scholar] [CrossRef]
- Gharibshahi, E.; Saion, E. Influence of Dose on Particle Size and Optical Properties of Colloidal Platinum Nanoparticles. Int. Mol. Sci. 2012, 13, 14723–14741. [Google Scholar] [CrossRef] [PubMed] [Green Version]


| Precursor | Precursor Formula | Matrix | Composite | Composite Number |
|---|---|---|---|---|
| (1) | Chitosan·NiCl2 (chitosan) | - | NiO | C1 |
| (2) | PSP-4-PVP·NiCl2 (PVP) | - | NiO | C2 |
| (3) | Chitosan·NiCl2 | SiO2 | NiO/SiO2 | C3 |
| (4) | PSP-4-PVP·NiCl2 | SiO2 | NiO/SiO2 | C4 |
| (5) | Chitosan·NiCl2 | TiO2 | NiO/TiO2 | C5 |
| (6) | PSP-4-PVP·NiCl2 | TiO2 | NiO/TiO2 | C6 |
| (7) | Chitosan·NiCl2 | Al2O3 | NiO/Al2O3 | C7 |
| (8) | Chitosan·NiCl2 | Na4.2Ca2.8(Si6O18) | NiO/Na4.2Ca2.8(Si6O18) | C8 |
| Composite | Precursor Formula | Particle Size (nm) | Reference |
|---|---|---|---|
| NiO | Chitosan·NiCl2 | >50 | [17] |
| NiO | PSP-4-PVP·NiCl2 | >50 | [17] |
| NiO/SiO2 | Chitosan·NiCl2 | 25 | This work |
| NiO/SiO2 | PSP-4-PVP·NiCl2 | 100 | This work |
| NiO/TiO2 | Chitosan·NiCl2 | 25 | This work |
| NiO/TiO2 | PSP-4-PVP·NiCl2 | 63 | This work |
| NiO/Al2O3 | Chitosan·NiCl2 | 30 | This work |
| NiO/Al2O3 | Chitosan·NiCl2 | 17 | This work |
| NiO/Na4.2Ca2.8(Si6O18) | Chitosan·NiCl2 | Not measured | This work |
| Photocatalyst | Apparent Photodegradation * | Discoloration Rate (%) | R2 Linear Fit (%) |
|---|---|---|---|
| NiO-CHITOSAN | 2.4 | 71% | 0.998 |
| NiO-PS-4-PVP | 2.2 | 68% | 0.991 |
| NiO/SiO2-CHITOSAN | 2.3 | 69% | 0.999 |
| NiO/SiO2-PS-4-PVP | 1.6 | 48% | 0.996 |
| NiO/TiO2 -CHITOSAN | 2.9 | 91% | 0.992 |
| NiO/TiO2-PS-4-PVP | 2.6 | 81% | 0.980 |
| NiO/Al2O3-CHITOSAN | 1.5 | 45% | 0.990 |
| NiO/Na4.2Ca2.8(Si6O18) | 2.6 | 75% | 0.990 |
Publisher’s Note: MDPI stays neutral with regard to jurisdictional claims in published maps and institutional affiliations. |
© 2020 by the authors. Licensee MDPI, Basel, Switzerland. This article is an open access article distributed under the terms and conditions of the Creative Commons Attribution (CC BY) license (http://creativecommons.org/licenses/by/4.0/).
Share and Cite
Diaz, C.; Valenzuela, M.L.; Cifuentes-Vaca, O.; Segovia, M.; Laguna-Bercero, M.A. Incorporation of NiO into SiO2, TiO2, Al2O3, and Na4.2Ca2.8(Si6O18) Matrices: Medium Effect on the Optical Properties and Catalytic Degradation of Methylene Blue. Nanomaterials 2020, 10, 2470. https://doi.org/10.3390/nano10122470
Diaz C, Valenzuela ML, Cifuentes-Vaca O, Segovia M, Laguna-Bercero MA. Incorporation of NiO into SiO2, TiO2, Al2O3, and Na4.2Ca2.8(Si6O18) Matrices: Medium Effect on the Optical Properties and Catalytic Degradation of Methylene Blue. Nanomaterials. 2020; 10(12):2470. https://doi.org/10.3390/nano10122470
Chicago/Turabian StyleDiaz, Carlos, María L. Valenzuela, Olga Cifuentes-Vaca, Marjorie Segovia, and Miguel A. Laguna-Bercero. 2020. "Incorporation of NiO into SiO2, TiO2, Al2O3, and Na4.2Ca2.8(Si6O18) Matrices: Medium Effect on the Optical Properties and Catalytic Degradation of Methylene Blue" Nanomaterials 10, no. 12: 2470. https://doi.org/10.3390/nano10122470