
Could Iron-Nitrogen Doping Modulate the Cytotoxicity of TiO2 Nanoparticles?
by
 , ,
, ,
Ionela Cristina Nica
1,2, 
Bogdan Andrei Miu
1 ,
,
Miruna S. Stan
1,2,*,
Lucian Diamandescu
3 and
Anca Dinischiotu
1 1
Department of Biochemistry and Molecular Biology, Faculty of Biology, University of Bucharest, 91-95 Splaiul Independentei, 050095 Bucharest, Romania
2
Research Institute of the University of Bucharest—ICUB, University of Bucharest, 050657 Bucharest, Romania
3
National Institute of Materials Physics (NIMP), Atomistilor 405A, Magurele, 077125 Bucharest, Romania
*
Author to whom correspondence should be addressed.
Nanomaterials 2022, 12(5), 770; https://doi.org/10.3390/nano12050770
Submission received: 23 January 2022
/
Revised: 22 February 2022
/
Accepted: 23 February 2022
/
Published: 25 February 2022
(This article belongs to the Special Issue Toxicity Assessment of Metal Nanoparticles and Metal Oxide Nanoparticles)
Abstract
:Titanium dioxide nanoparticles (TiO2 NPs) are found in several products on the market that include paints, smart textiles, cosmetics and food products. Besides these, TiO2 NPs are intensively researched for their use in biomedicine, agriculture or installations to produce energy. Taking into account that several risks have been associated with the use of TiO2 NPs, our aim was to provide TiO2 NPs with improved qualities and lower toxicity to humans and the environment. Pure TiO2 P25 NPs and the same NPs co-doped with iron (1%) and nitrogen atoms (P25-Fe(1%)-N NPs) by hydrothermal treatment to increase the photocatalytic activity in the visible light spectrum were in vitro evaluated in the presence of human lung cells. After 24 and 72 h of incubation, the oxidative stress was initiated in a time- and dose-dependent manner with major differences between pure P25 and P25-Fe(1%)-N NPs as revealed by malondialdehyde and reactive oxygen species levels. Additionally, a lower dynamic of autophagic vacuoles formation was observed in cells exposed to Fe-N-doped P25 NPs compared to the pure ones. Therefore, our results suggest that Fe-N doping of TiO2 NPs can represent a valuable alternative to the conventional P25 Degussa particles in industrial and medical applications.
1. Introduction
Metal oxide nanoparticles (NPs) display a high ability for various applications including microelectronics, energy storage, environmental decontamination, gas sensing, ceramic fabrication, biomedicine (imaging, drug delivery, therapy and theranostics) [1,2,3]. Titanium dioxide (TiO2) NPs are one of the most widely used nanoscale materials in several market products that contain TiO2. These include paints [4], smart textiles [5], cosmetics, skin care [6] or food products [7]. Recently, the entire field of nanotechnology has made considerable progress, and TiO2 NPs were introduced in biomedicine [8], agriculture [9] and electricity [10] and hydrogen [11] production.
Being so widespread in consumer products, it is necessary to assess the risks that TiO2 presents to human health. The accumulation over time of several scientific data supporting the carcinogenic effect of TiO2 in nanometric form has led the International Agency for Research on Cancer (IARC) to classify this material in group 2B carcinogens in 2010, this characteristic being attributed to substances that possibly trigger the development of malignant tumors in the human body. However, the scientific evidence was not convincing or sufficient since this agency’s report largely refers to TiO2 NPs that come into contact with humans through occupational inhalation [12]. Moreover, since 2009, at the level of the European Union, the concentration of TiO2 used in cosmetics is restricted to a percentage of 25% of product [13]. Ten years later, a new condition of use was introduced, prohibiting certain cosmetic preparations that can lead to the inhalation of TiO2 NPs [13]. The most recent regulation since 2020 is that the European Commission officially classified TiO2 as a category 2 suspected carcinogen by inhalation [14].
Despite all these facts, the academic community has not yet reached a consensus on the negative effects of NPs on health, with some authors suggesting that more scientific data are still needed [15,16,17]. However, it is currently accepted that nanomaterials can generate oxidative stress that is involved in triggering proinflammatory or apoptotic signaling pathways at a cellular level [18]. Numerous studies reported that TiO2 NPs induced a decrease in cell viability, while other in vitro studies showed that exposure to TiO2 NPs can also trigger apoptotic processes in BEAS-2B lung epithelial cells [19], WI38 lung fibroblasts, MCF10A non-malignant breast epithelial cells [20] and 16HBE14o bronchial epithelial cells [21]. In addition, it was reported that TiO2 NPs can induce cell death in a p53- [22] and Bax/Bcl-2-independent manner [23].
Nanotechnology can further advance only after all risks associated with NP use are clearly identified. Therefore, our aim was to prepare TiO2 NPs with improved qualities and lower toxicity to humans and the environment. Iron-nitrogen (Fe-N) doping of TiO2 NPs can represent a valuable alternative to the conventional P25 Degussa particles in industrial and medical applications.
2. Materials and Methods
2.1. Synthesis and Physicochemical Characterization of TiO2 NPs
TiO2 Degussa P25 powder (Sigma-Aldrich, St. Louis, MO, USA) was impregnated with 1% Fe and N atoms as follows: adequate amounts of TiO2 (Aeroxide® P25), FeCl3·6H2O and urea were dispersed under mechanical and ultrasonic stirring in distilled water. The resulting mixture was hydrothermally treated at 200 °C for 2 h in a Teflon-lined autoclave. The resulting powder was washed with ultrapure water to remove salts (until pH~6.5), then dried and calcined at 400 °C for 2 h in air.
The structure and morphology of both doped and non-doped TiO2 NPs were evaluated using a transmission electron microscope operating at 200 kV (JEOL JEM—ARM200F, JEOL Inc., Tokyo, Japan). In addition, the phase content of TiO2 NPs was determined by X-ray diffraction (XRD) measurements that were performed on a Bruker D8 Advance (Bruker, Hamburg, Germany), using CuKα radiation (λ = 1.5406 Å). The presence of iron and nitrogen in the doped samples was evidenced through X-ray photoelectron spectroscopy (XPS) measurements carried out in an analysis chamber equipped with a 150 mm hemispherical electron energy analyzer (Phoibos, SPECS Gmbh, Berlin, Germany) and a monochromatized Al Kα1 X-ray source (1486.74 eV). The complete procedure for the physicochemical characterization of TiO2 NPs was previously described [24].
In order to assess the hydrodynamic size and zeta potential, the TiO2 NPs suspensions were prepared at a concentration of 2 mg/mL in PBS, and of 10 and 50 µg/mL in cell culture media, sonicated for 5 min at room temperature with an ultrasonic processor UP50H (Hielscher Ultrasonics GmbH, Teltow, Germany) and then analyzed on a Malvern Zetasizer Nano-ZS instrument (Malvern Instruments, Malvern, Worcestershire, UK) by dynamic light scattering (DLS) and laser Doppler velocimetry (LDV) technologies. Three measurements have been done for each sample to determine the particles’ size and zeta potential.
2.2. In Vitro Cell Culture
In this experiment, normal human lung fibroblasts (MRC-5 cell line purchased from American Type Culture Collection (ATCC, Catalog Number CCL-171) were used for in vitro cytotoxicity testing. The cells were grown at 37 °C, in a humidified atmosphere with 5% CO2, using complete Eagle’s minimum essential medium (MEM; Gibco/Invitrogen, Carlsbad, CA, USA), containing 2 mM L-glutamine, 0.1 mM sodium pyruvate, 4.5 g/L glucose, and supplemented with 10% fetal bovine serum (FBS; Gibco/Invitrogen, Carlsbad, CA, USA). The growth medium was replaced with a fresh one every 2 days until 80% confluence was reached. Then, a 0.25% (w/v) Trypsin 0.53 mM EDTA solution (Sigma-Aldrich, St. Louis, MO, USA) was used to detach and split the cells for future sub-cultivations.
2.3. Cell Exposure to TiO2 NPs
Stock suspensions of 2 mg/mL TiO2 NPs were prepared by dispersing 10 mg of TiO2 powder in 5 mL of phosphate-buffered saline (PBS). The resulting suspensions were sonicated for 5 min at room temperature with an ultrasonic processor UP50H (Hielscher Ultrasonics GmbH, Teltow, Germany), sterilized by UV exposure for 30 min and then kept sterile until they were used. The fibroblasts were detached as described in Section 2.2, counted using a hemocytometer with a double counting chamber and an inverted phase-contrast microscope, and then seeded at 2 × 10⁴ cells/cm2 cell density into 24-well plates (for biocompatibility assessment), 96-well plates (for autophagy detection) or in 75 cm2 culture flasks (for oxidative stress analysis). The cells were allowed to adhere overnight and were then exposed to 10 and 50 µg/mL TiO2 NPs for 24 and 72 h. Cells grown in NP-free culture medium were used as controls for each test.
2.4. Cell Viability
Due to the high potential of TiO2 NPs to interfere with commonly used tetrazolium-based assays (e.g., MTS and MTT), the cell viability was measured using a Sulforhodamine B-based commercial kit (In Vitro Toxicology Assay Kit, Sulforhodamine B-based, St. Louis MO, USA) according to the manufacturer’s instructions. This method is used for cell density determination, based on total cellular protein content measurement. After TiO2 NPs exposure, the fibroblasts were fixed for one hour at 4 °C with a 50% trichloroacetic acid solution (1/4 volume of culture medium). Afterwards, cells were stained with 0.4% sulforhodamine B solution for 20 min (at room temperature), then rinsed quickly with 1% acetic acid solution. The incorporated dye was solubilized with 10 mM Tris Base solution. The absorbance was recorded at 550 nm using a microplate reader (TECAN GENios, Grödig, Austria) and the results were expressed relative to the control.
For a greater accuracy, the cell viability results were also confirmed by Trypan blue exclusion assay where 15 µL of fibroblasts suspension were mixed with 15 µL of 0.4% (w/v) Trypan blue solution, prepared in 0.81% NaCl and 0.06% (w/v) dibasic potassium phosphate (Sigma-Aldrich, St. Louis, MO, USA), and the cell viability was determined using the following formula:
% Viable cells = [1.00 − (Number of blue cells/Number of total cells)] × 100
The cell membrane integrity was also determined by the lactate dehydrogenase (LDH) amount released in culture medium using a commercial kit (TOX7, Sigma-Aldrich). Briefly, 100 µL of an equimolar mixture of dye, substrate and cofactor were added to 50 µL of cell culture supernatants, and then incubated for 30 min in dark. Afterwards, the reaction was stopped with 15 µL of 1 N HCl, and the absorbance was recorded at 490 nm using a microplate reader (TECAN GENios, Grödig, Austria).
Additionally, cell spreading, morphology and actin cytoskeleton dynamics were observed via fluorescence microscopy. After 24 and 72 h of treatment, the fibroblasts were fixed with 4% paraformaldehyde for 20 min and permeabilized by incubating for 1 h with a solution containing 0.1% Triton X-100 and 2% bovine serum albumin (BSA). Further, filamentous actin (F-actin) was labelled with 20 µg/mL phalloidin conjugated with FITC (Sigma-Aldrich, Munich, Germany). Images were captured using an inverted fluorescence microscope Olympus IX71 (Olympus, Tokyo, Japan).
2.5. Cell Lysates and Protein Concentration Assay
MRC-5 cells were harvested from flasks, washed with PBS and lysed by sonication (3 cycles × 30 s) on ice bath with an ultrasonic processor (Hielscher UP50H, Teltow, Germany). The obtained cellular homogenate was centrifuged (4 °C, 3000× g, 10 min) and the total protein extracts (supernatants) were collected for biochemical assays and stored at −80 °C until use.
The protein concentration of the cell lysates was determined according to the method described by Bradford [25] using the Bradford Reagent (Sigma-Aldrich, St. Louis, MO, USA) and a BSA standard curve.
2.6. Antioxidant Enzymes Assays
The activities of antioxidant enzymes were determined by spectrophotometric methods using SPECORD 200 PLUS double-beam spectrophotometer from AnalytikJena. Catalase (CAT) (EC 1.11.1.6) activity was measured by monitoring the decrease in absorbance of H2O2 at 240 nm, as described in Aebi’s method [26]. One unit of CAT activity represented the amount of enzyme that catalyzed the conversion of 1 µmole of H2O2 in 1 min under standard conditions. Glutathione peroxidase (GPx) (EC 1.11.1.9) activity was assessed according to the method of Beutler [27] by monitoring at 340 nm a coupled reaction with glutathione reductase that catalyzed NADPH oxidation. One unit of GPx activity was defined as the quantity of enzyme that catalyzes the transformation of 1 µmole of NADPH per minute. Glutathione S-transferase (GST) (EC 2.5.1.18) activity was determined as described in the method of Habig et al. [28] by measuring the rate of 1-chloro-2,4-dinitrobenzene (CDNB) conjugation with reduced glutathione (GSH) at 340 nm. One unit of GST activity was defined as the amount of enzyme that produced 1 µmole of conjugated product per minute. All data were obtained in physiological conditions at pH 7.4 and room temperature (25 °C), and the final results were calculated as specific enzymatic activities (units/mg of protein) and expressed relative to the control.
2.7. Reduced Glutathione Assay
The intracellular GSH concentration was determined using a Glutathione Assay kit (Sigma-Aldrich, St. Louis, MO, USA). In the first step, the proteins from cell lysates were precipitated with 5% sulfosalicylic acid (Sigma-Aldrich, St. Louis, MO, USA) and removed by centrifugation (4 °C, 10,000× g, 10 min). Further, the samples were incubated with 5,5′-dithiobis-2-nitrobenzoic acid (DTNB) at room temperature for 5 min to allow the reduction of DTNB into 5-thio-2-nitrobenzoic acid (TNB). The optical density was read at 405 nm using a microplate reader (TECAN GENios, Grödic, Germany) and the GSH content was expressed as nmoles/mg protein and represented relative to the control.
2.8. Lipid Peroxidation
Malondialdehyde (MDA) is one of the most widely used markers of lipid peroxidation. MDA level was measured using the fluorimetric method described previously by our group [29]. Volumes of 200 µL of cell lysates were mixed with 700 µL of 0.1 N HCl and incubated at room temperature for 20 min. Further, 900 µL of 0.025 M thiobarbituric acid were added and the mixture was incubated at 37 °C for 65 min. The relative fluorescence units were recorded using excitation wavelength set at 520 nm and emission wavelength set at 549 nm (FP-750 Spectrofluorometer, Jasco, Tokyo, Japan) and converted to nmoles of MDA using a standard curve of 1,1,3,3-tetramethoxypropane. Subsequently, the final MDA level was expressed as nmoles of MDA/mg protein and all results were represented relative to the control.
2.9. Intracellular Reactive Oxygen Species Level
The intracellular reactive oxygen species (ROS) level was determined using a fluorescent compound 2′,7′-dichlorofluorescein diacetate (DCFH-DA, Sigma-Aldrich, St. Louis, MO, USA). After TiO2 NPs exposure, the cells were washed with PBS and incubated with the dye for 30 min at 37 °C. Afterwards, the excess dye was removed, and the fibroblasts were resuspended in PBS and detached by scraping. The fluorescence was quantified using a fluorimeter (excitation wavelength = 488 nm and emission wavelength = 515 nm, FP-750 Spectrofluorometer, Jasco, Tokyo, Japan). All results were expressed relative to the control after fluorescence intensity was reported to the number of viable cells of each sample.
2.10. Autophagy Detection
Induction of autophagy in cells exposed to TiO2 NPs was established using the Autophagy/Cytotoxicity Dual Staining Kit (Cayman Chemical, Ann Arbor, MI, USA) that allowed the detection of autophagic vacuoles in cultured cells, but also the detection of dead cells. This technique uses the monodansylcadaverine (MDC) fluorescent compound to label autophagic vacuoles and propidium iodide (PI) as a marker for cell death. After 24 and 72 h of exposure, the culture medium was aspirated and the cells were incubated with PI for 2 min at room temperature, and then with MDC solution for 10 min at 37 °C. In parallel, MRC-5 cells previously incubated with 20 μM tamoxifen, a well-known inducer of autophagy, were also labeled. Further, the MDC solution was replaced with wash buffer and cells were immediately visualized by an Olympus IX71 fluorescence microscope (triple filter TRITC/FITC/DAPI, Olympus, Tokyo, Japan). The dead cells were revealed in red, while the autophagic vacuoles were shown in silver. The fluorescence was quantified using the image processing and analysis software ImageJ 1.48 (National Institutes of Health, Bethesda, MD, USA). The results were expressed as changes in fluorescence intensity compared to the control, analyzing 50 cell fields per sample.
2.11. Statistical Analysis
Data were expressed as mean value ± standard deviation (SD) of three independent experiments. Statistical differences between the samples and control were evaluated by Student’s t-test using the GraphPad Prism software (version 5; GraphPad Software, Inc., La Jolla, CA, USA), and a value of p < 0.05 was expressed as being statistically significant.
3. Results
3.1. Physicochemical Features of TiO2 NPs
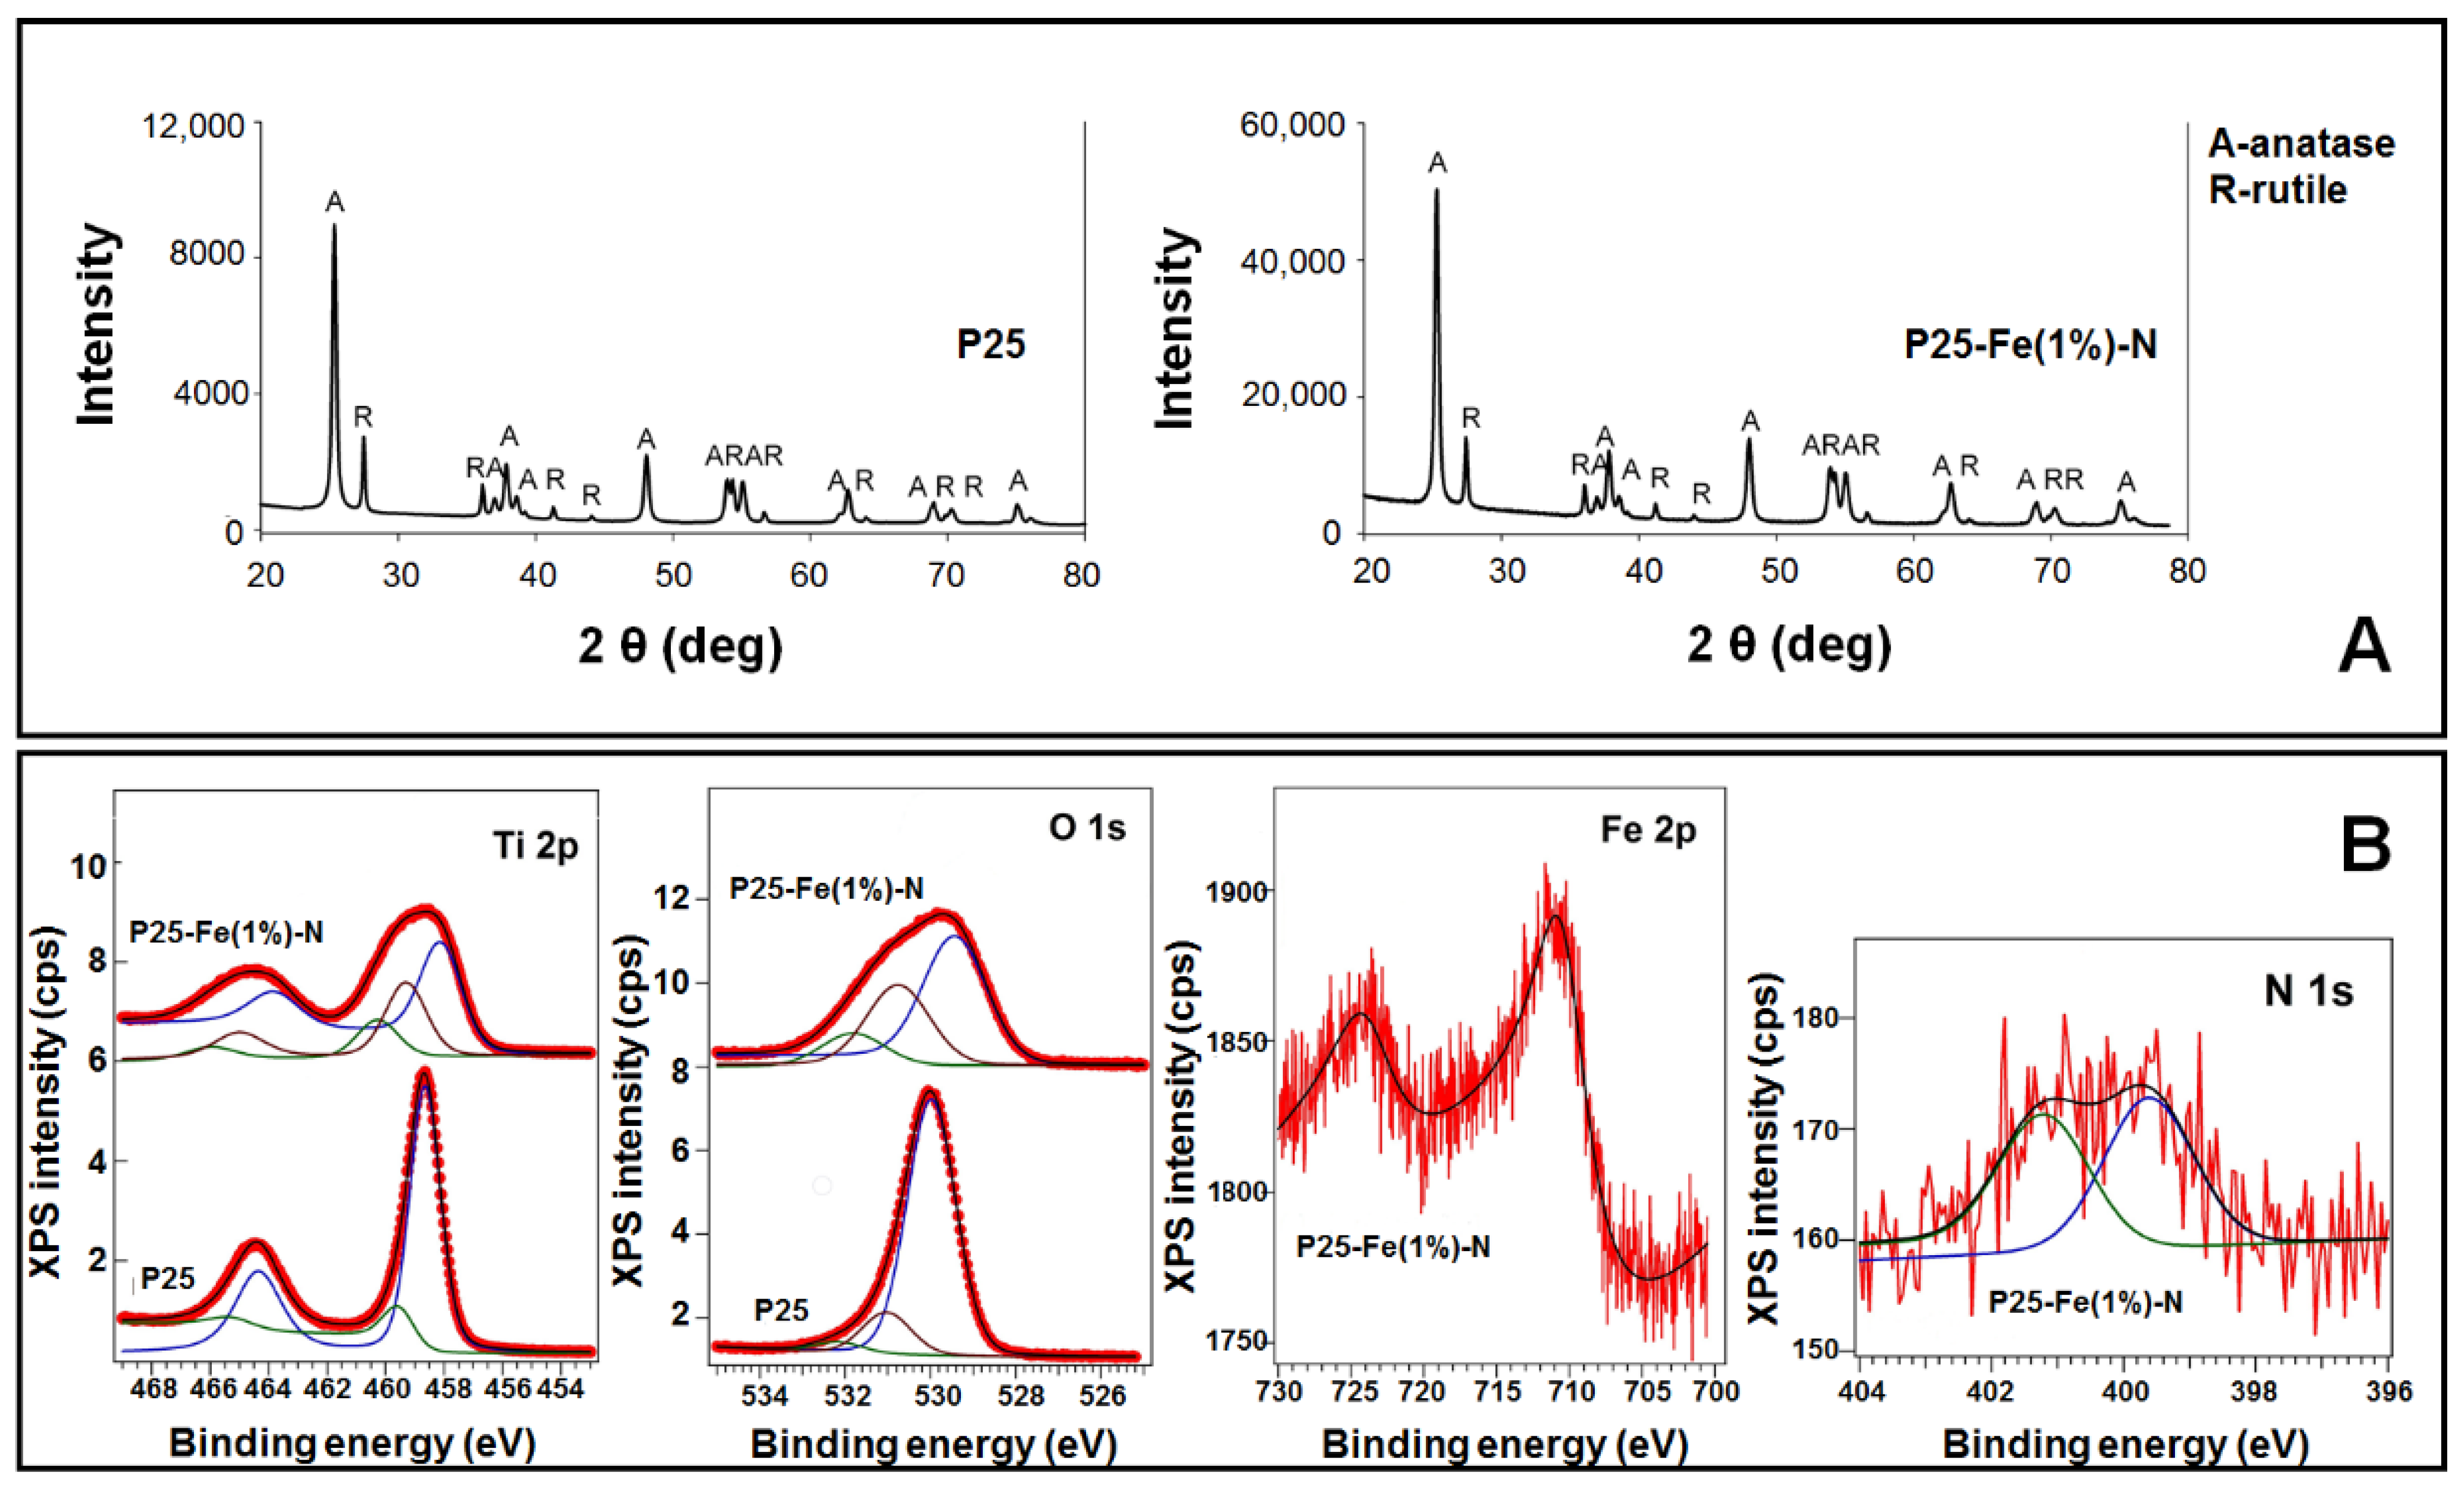
The crystal phase structure of the TiO2 NPs used in the present study was investigated using XRD. The X-ray diffractograms presented in Figure 1B, and the corresponding Rietveld refinement results summarized in Table 1, showed that both P25 and P25-Fe(1%)–N NPs consist of two phases: anatase (~83%) and rutile (~17%). This result is consistent with the well-known biphasic structure of commercial TiO2 P25. Additionally, the crystallite size of anatase phase (30 nm) was generally lower compared to the rutile one (50 nm).
The presence of iron and nitrogen atoms in the P25-Fe(1%)–N NPs was revealed through the XPS measurements. The characteristic spectra of Ti 2p, O 1s, Fe 2p and N 1s, with their corresponding binding energies, are represented in Figure 1B and Table 2, respectively. The main components of Ti 2p (458.65 eV) and O 1s (529.98 eV) in the pure TiO2 P25 NPs revealed a stoichiometric TiO2 with a O/Ti ratio of 2.02. Introducing the doping atoms into the structure of TiO2 led to a shift towards lower binding energies for both Ti 2p and O 1s, due to an oxygen deficiency as a consequence of the nitrogen doping. Normally, the Fe 2p signal is ~710 eV, very similar to the value reported in the present study, assigning this to the presence of Fe3+ in the synthesized P25-Fe(1%)–N NPs. Additionally, an extra component present in the Ti 2p spectrum of P25-Fe(1%)–N sample at ~460.37 eV can be associated with the formation of a Fe–O–Ti bond. A more detailed analysis of these two types of TiO2 NPs (pure and Fe–N co-doped P25 Degussa) was presented in our previous work [24,30].
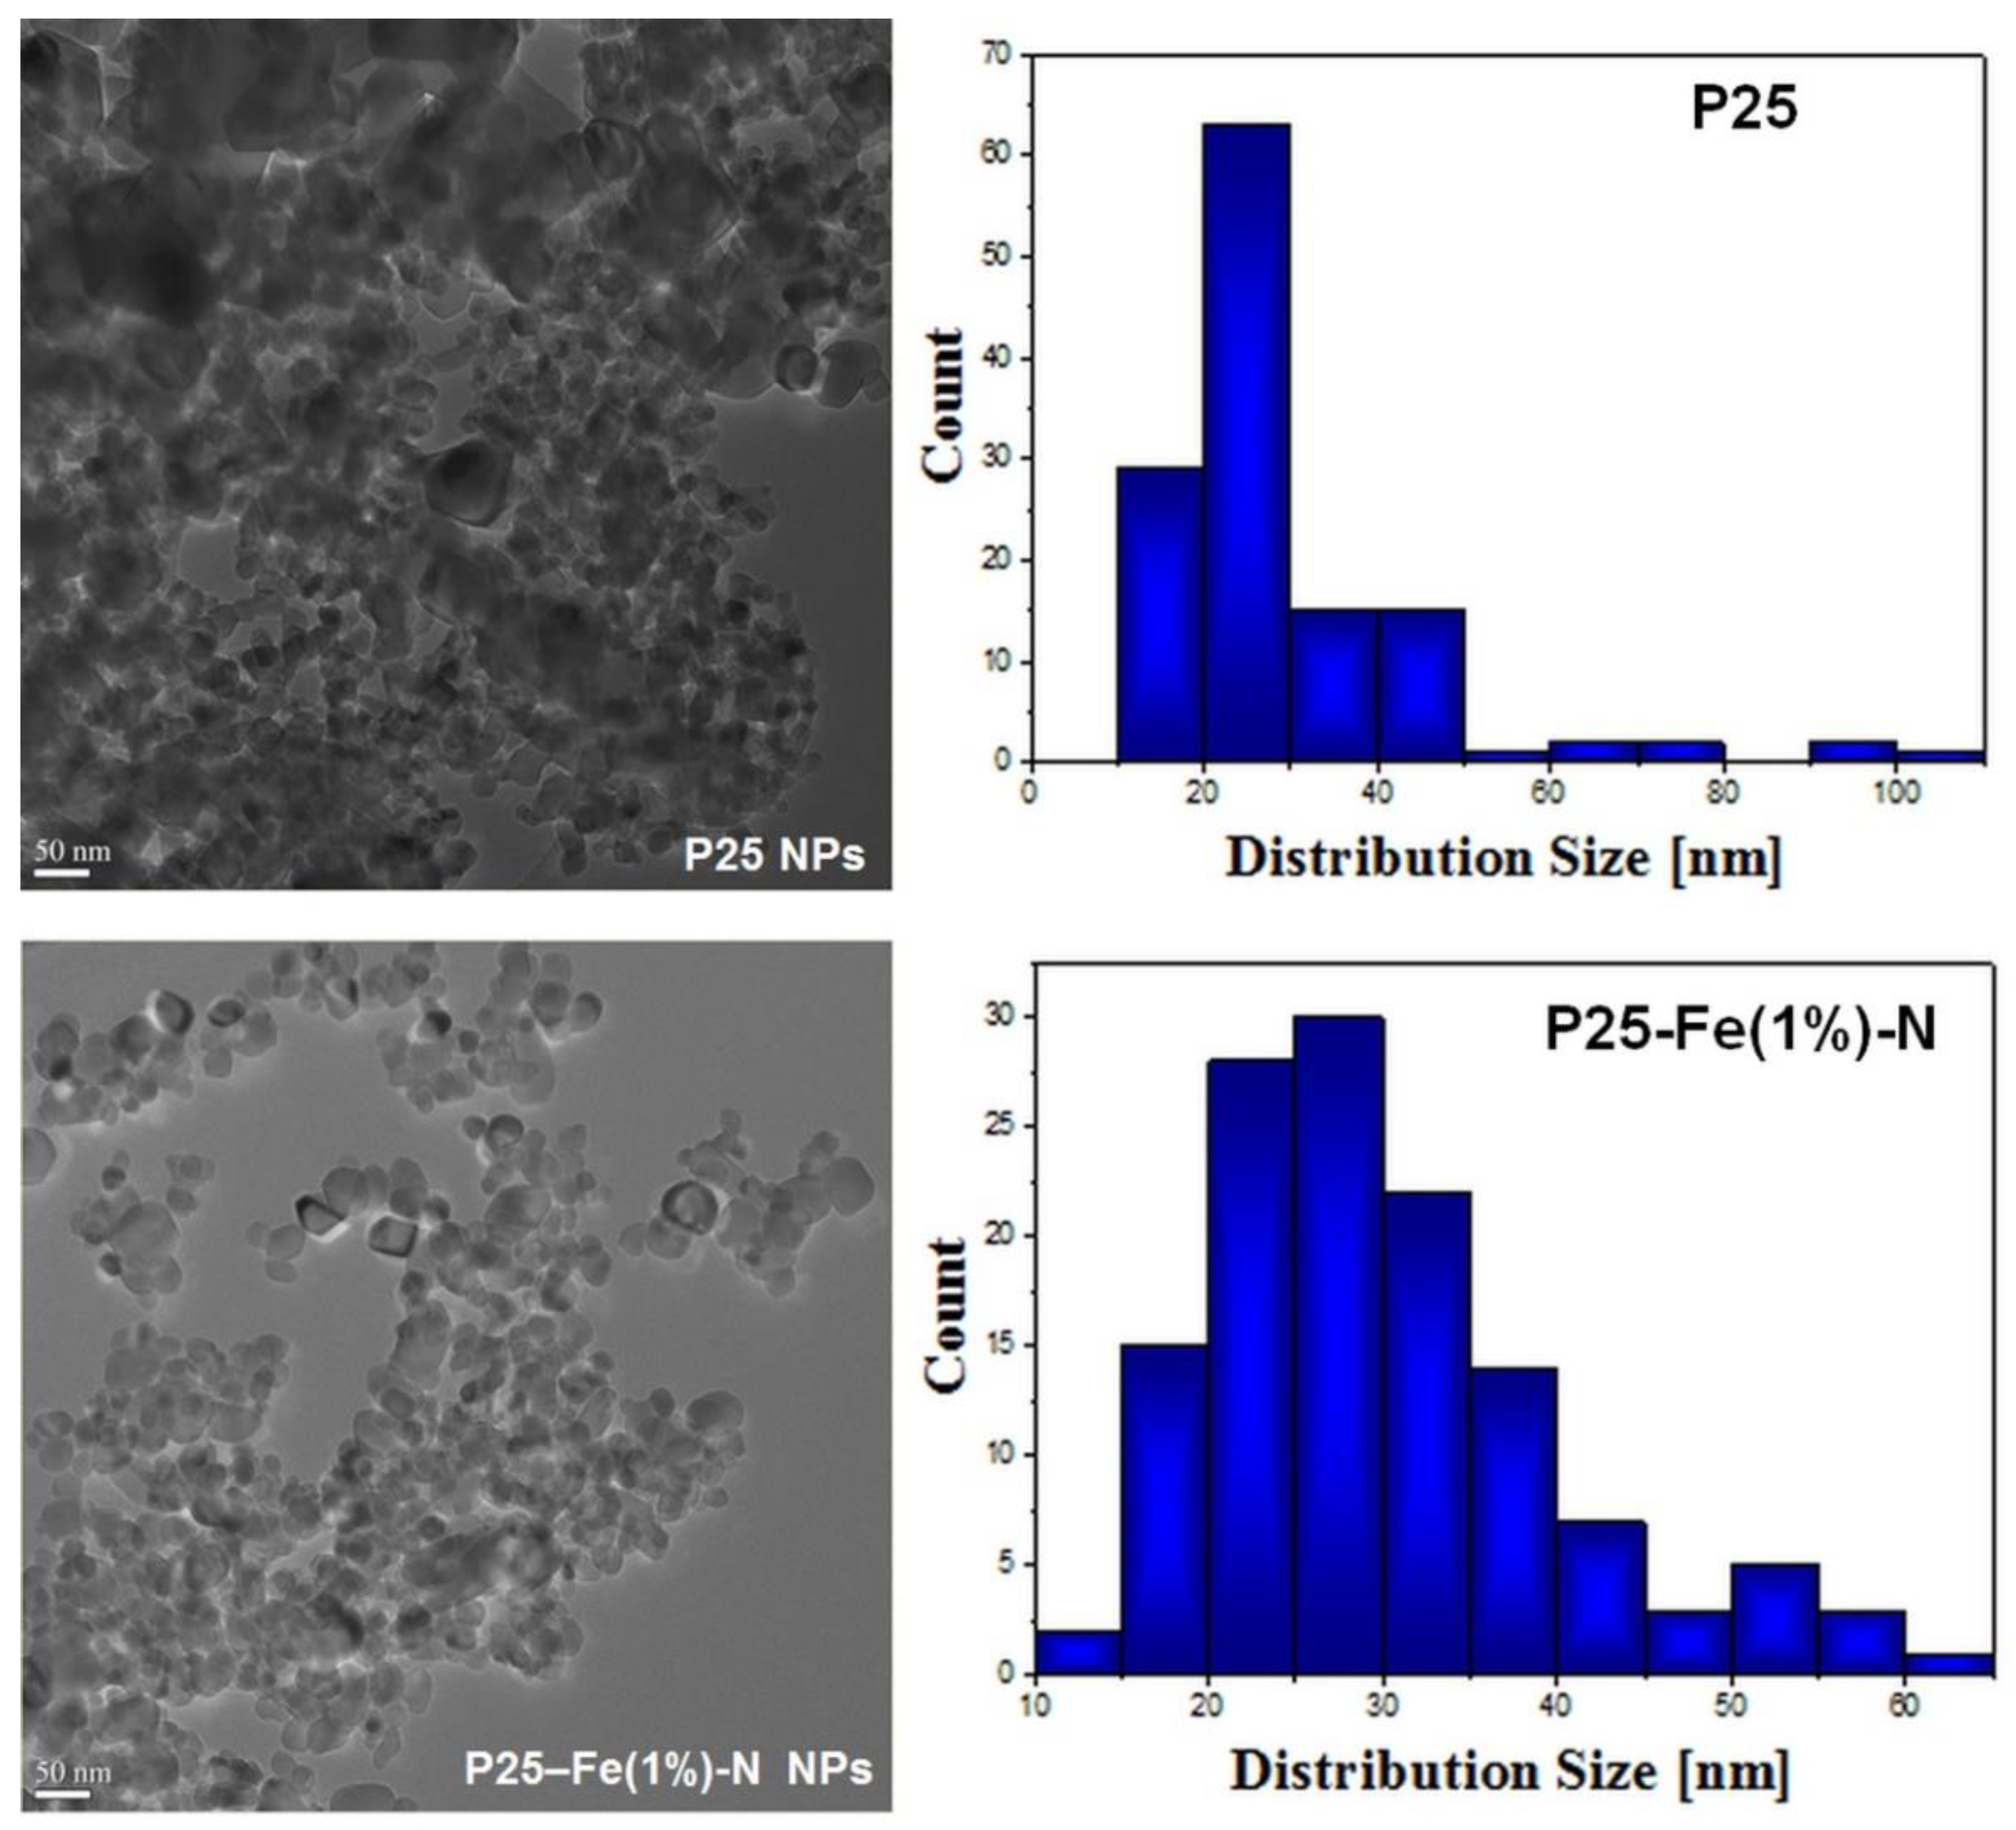
The primary size and shape of the TiO2 NPs were determined by electron microscopy imaging. The powder morphology of P25-based nanophotocatalysts as well as the corresponding particle distribution are presented in Figure 2. As shown by transmission electron microscopy (TEM) images, the P25 particles have a polyhedral shape with round corners, while the mean particle size was 29 ± 15 nm for pure P25 NPs and 30 ± 10 nm for P25-Fe(1%)–N NPs, these results being in good agreement with the XRD results presented in Table 1.
3.2. Agglomeration State and Colloidal Stability of TiO2 NPs
The Z-average represents the intensity weighted mean hydrodynamic size of the ensemble collection of particles measured by DLS, being a reliable measure of the average size of a particle size distribution. Our measurements revealed that both types of NPs have a great tendency to aggregate in PBS, the values being higher than 2 µm (Table 3). In culture medium, the NPs have lower diameters compared to those in PBS, proving that the serum proteins were able to induce a higher dispersity of particles by steric repulsion forces. Additionally, the P25 NPs had higher values compared to doped NPs for all times of incubation, suggesting that co-doping procedure Fe and N was able to provide better dispersed particles. By increasing the time of incubation, the Z-average values elevated for all types of particles and concentrations tested. However, compared to the time-dependent increase in hydrodynamic size, there was no concentration-dependent increase in the diameter.
Regarding the zeta potential, there was an important difference between the medium used for dispersion. The P25 NPs and P25-Fe(1%)–N NPs dispersed in PBS registered a value of approx. −25 mV and −22 mV, respectively, suggesting their strong negative surface charge. By incubating NPs in culture medium supplemented with animal serum, the zeta potential increased to ~−9.5 mV, regardless of the NP type or concentration tested. This change confirmed the interaction between NPs and serum proteins, which altered the surface charge. Increasing the time of incubation in this type of medium, the zeta potential was not changed very much, suggesting that the interaction with proteins was very fast and irreversible.
3.3. Influence of TiO2 NPs on Cell Viability of Human Lung Fibroblasts
The influence of TiO2 NPs on the viability and membrane integrity on normal human lung fibroblasts was evaluated by in vitro methods. For this purpose, MRC-5 cells were exposed to two different concentrations (10 and 50 µg/mL) of commercially available TiO2 P25 Degussa NPs and Fe(1%)-N doped TiO2 P25 NPs for 24 and 72 h. These concentrations were selected based on key studies from available literature [31,32]. Additionally, it is worth noting that due to the predisposition of TiO2 NPs to form large aggregates (>100 nm) in suspension, higher doses may show no toxic effects.
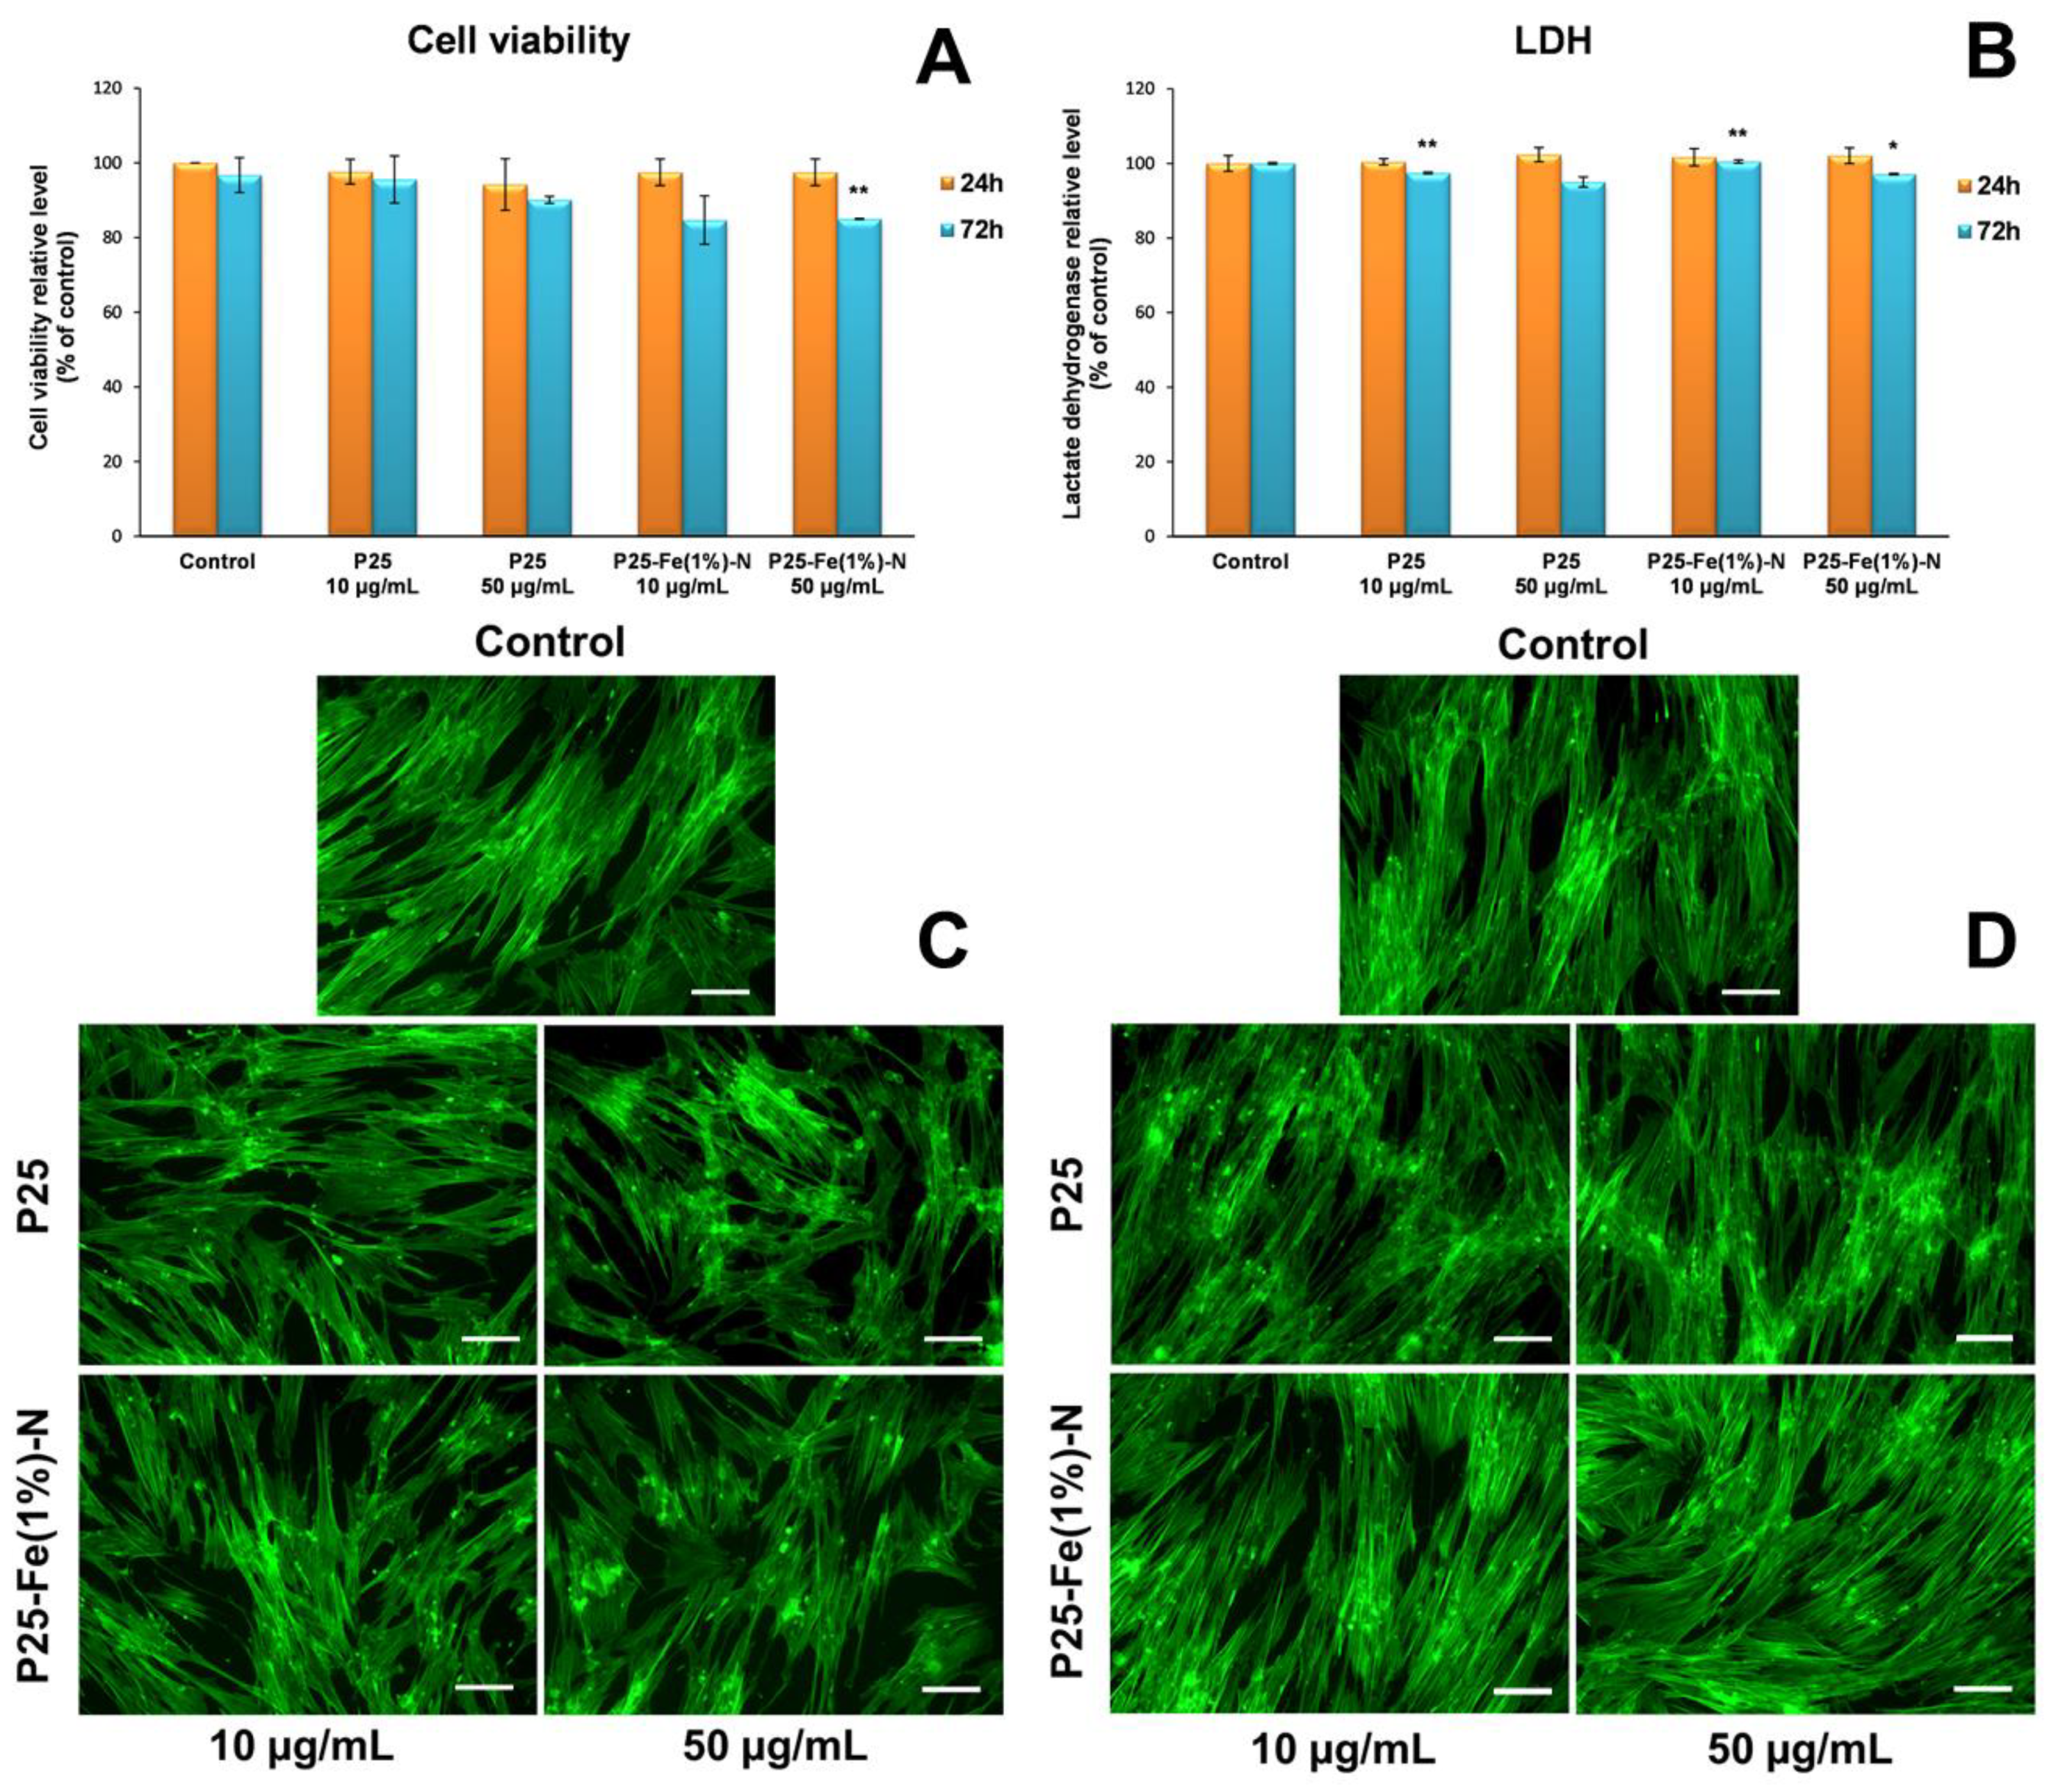
Figure 3A revealed that no significant changes in cell viability were observed after 24 h of exposure to TiO2 NPs compared to the control (untreated cells). In contrast, after 72 h, both doses of P25-Fe(1%)-N NPs decreased cell viability by almost 15% compared to the control and even compared to cells exposed to 10 µg/mL commercial TiO2 P25 NPs. The presence of 50 µg/mL TiO2 P25 NPs in the cell culture media also induced a 10% decrease in cell viability of MRC-5 fibroblasts.
To better describe the cytotoxicity of TiO2 NPs, the LDH leakage level was measured. Figure 3B shows the amount of LDH released into the culture medium by fibroblasts exposed to nanophotocatalysts. In contrast to the results obtained by the Sulforhodamine B-based assay, the LDH levels suggested that TiO2 NPs did not affect the cell membrane integrity of MRC-5 cells in the first 24 h of exposure (Figure 3). Instead, after 72 h, both non-doped TiO2 P25 and Fe-N-containing TiO2 NPs lead to a slight dose-dependent reduction in the amount of LDH released in the culture medium compared to the control, which could be correlated with a proportional decline in cell number compared to the control. However, these two analyses showed that non-doped TiO2 P25 NPs had no effect on the viability of MRC-5 lung fibroblasts. Additionally, the results suggest that P25-Fe(1%)-N NPs exerted a more pronounced toxicity on cell viability, but their effect can be considered only moderate.
Actin cytoskeleton analysis can provide important information about the influence of TiO2 NPs on cell morphology. Morphological changes of MRC-5 cells after exposure to TiO2 P25 and P25-Fe(1%)-N NPs were evidenced by fluorescence microscopy. Figure 3C,D show the actin cytoskeleton organization, which are consistent with the results of the cell viability tests shown in Figure 3A,B. Thus, it was observed that human lung fibroblasts maintained their specific elongated morphology after 24 and 72 h of TiO2 NPs exposure with no significant differences between the samples and control or between the types of nanophotocatalysts. Moreover, the presence of TiO2 NPs in the culture medium did not change the cellular behavior.
3.4. ROS Generation by TiO2 NPs and Cellular Antioxidant Defense
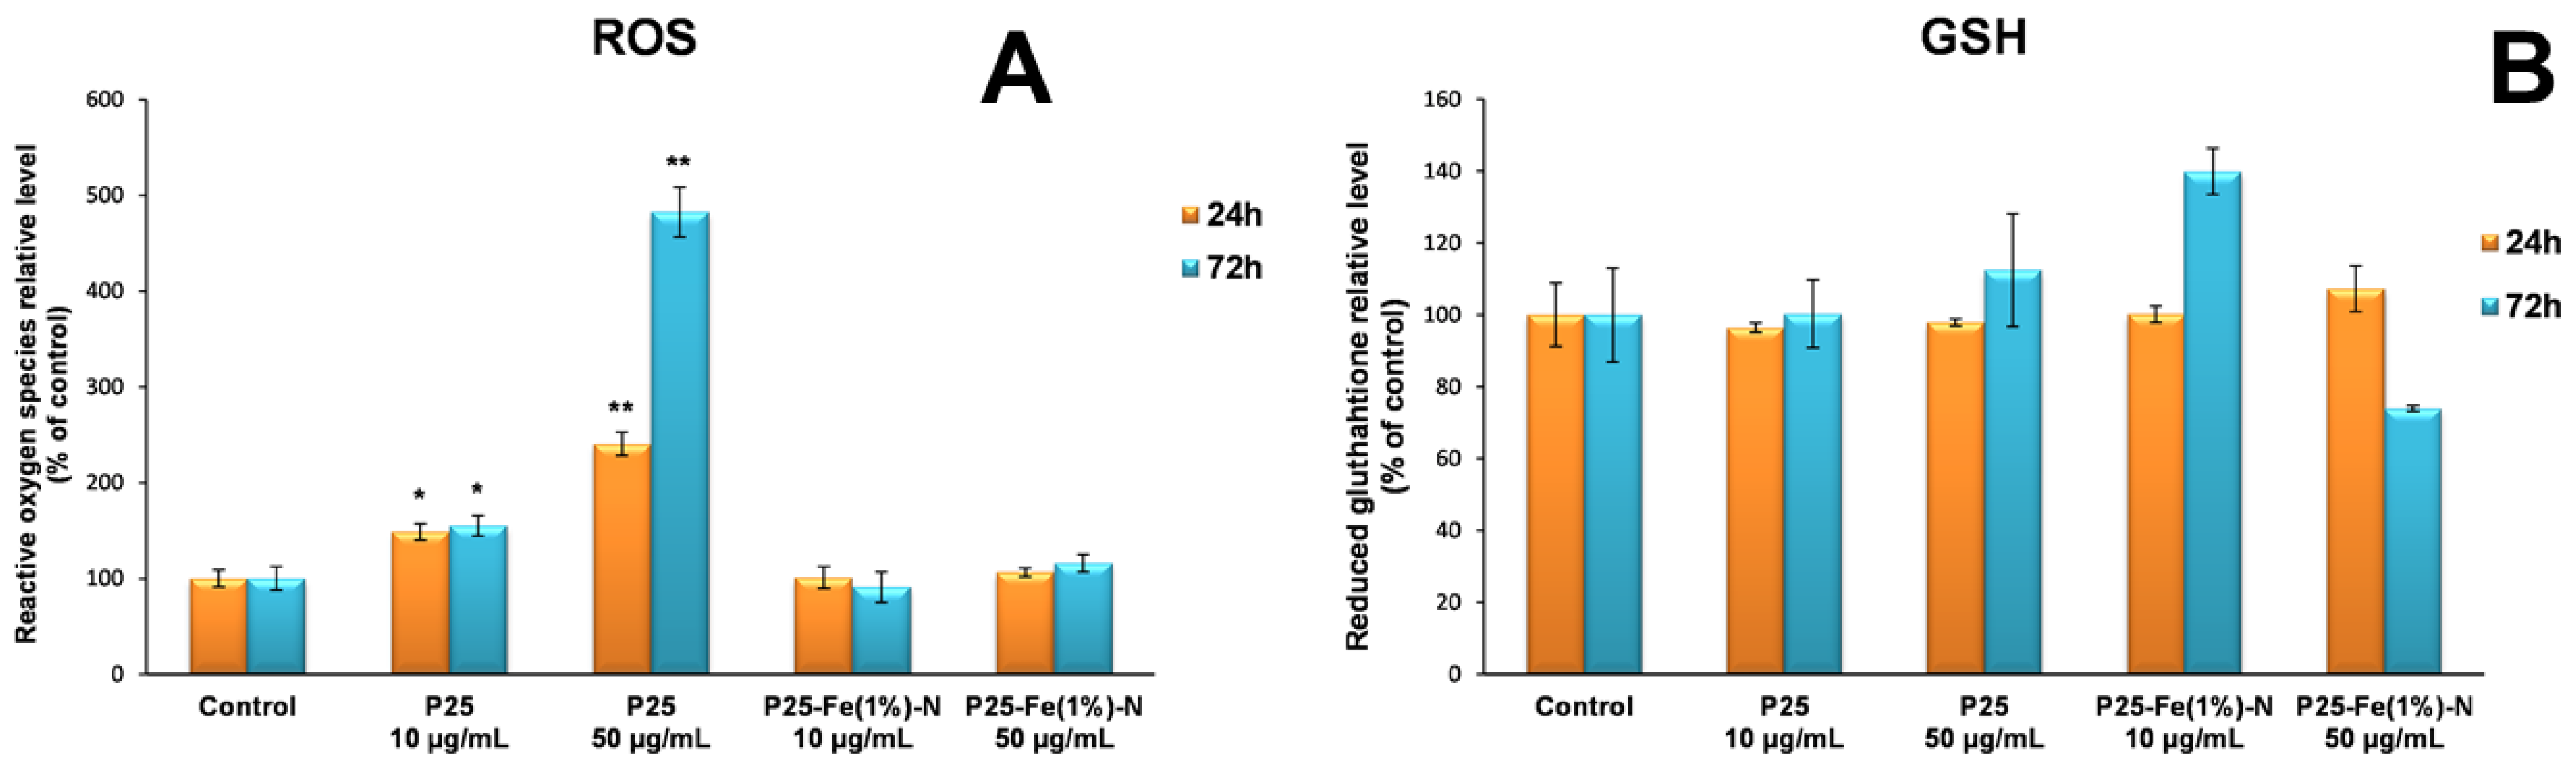
In order to assess if TiO2 P25 and P25-Fe(1%)-N NPs can induce oxidative stress, the level of intracellular ROS was measured using the fluorescence intensity of dichlorofluorescein (DCF). The results presented in Figure 4A showed that TiO2 P25 NPs had a significant effect of stimulating ROS production, their level increasing up to five times compared to the control after 72 h of exposure to the higher dose of 50 µg/mL. This major difference between the two samples suggests that Fe-doped TiO2 NPs can be considered harmless compared to non-impregnated ones (P25 Degussa).
ROS generated as a result of the cellular metabolism, as well as due to nanomaterials exposure, can be counteracted by non-enzymatic and enzymatic antioxidant systems. In order to evaluate the non-enzymatic antioxidant defense system responsible for the cell protection against oxidative injuries induced by ROS, the GSH levels were measured. The 24 h exposure of MRC-5 fibroblasts to photocatalytic NPs did not result in major changes in GSH levels (Figure 4B), but after 72 h of incubation with 10 µg/mL P25-Fe(1%)-N an increase in GSH level by almost 40% over the control was registered. In contrast, the higher dose of the same nanophotocatalyst (50 µg/mL) induced a GSH depletion. It was also observed that GSH concentration was similar to the control in the case of lung cells exposed to TiO2 P25 NPs for 24 and 72 h.
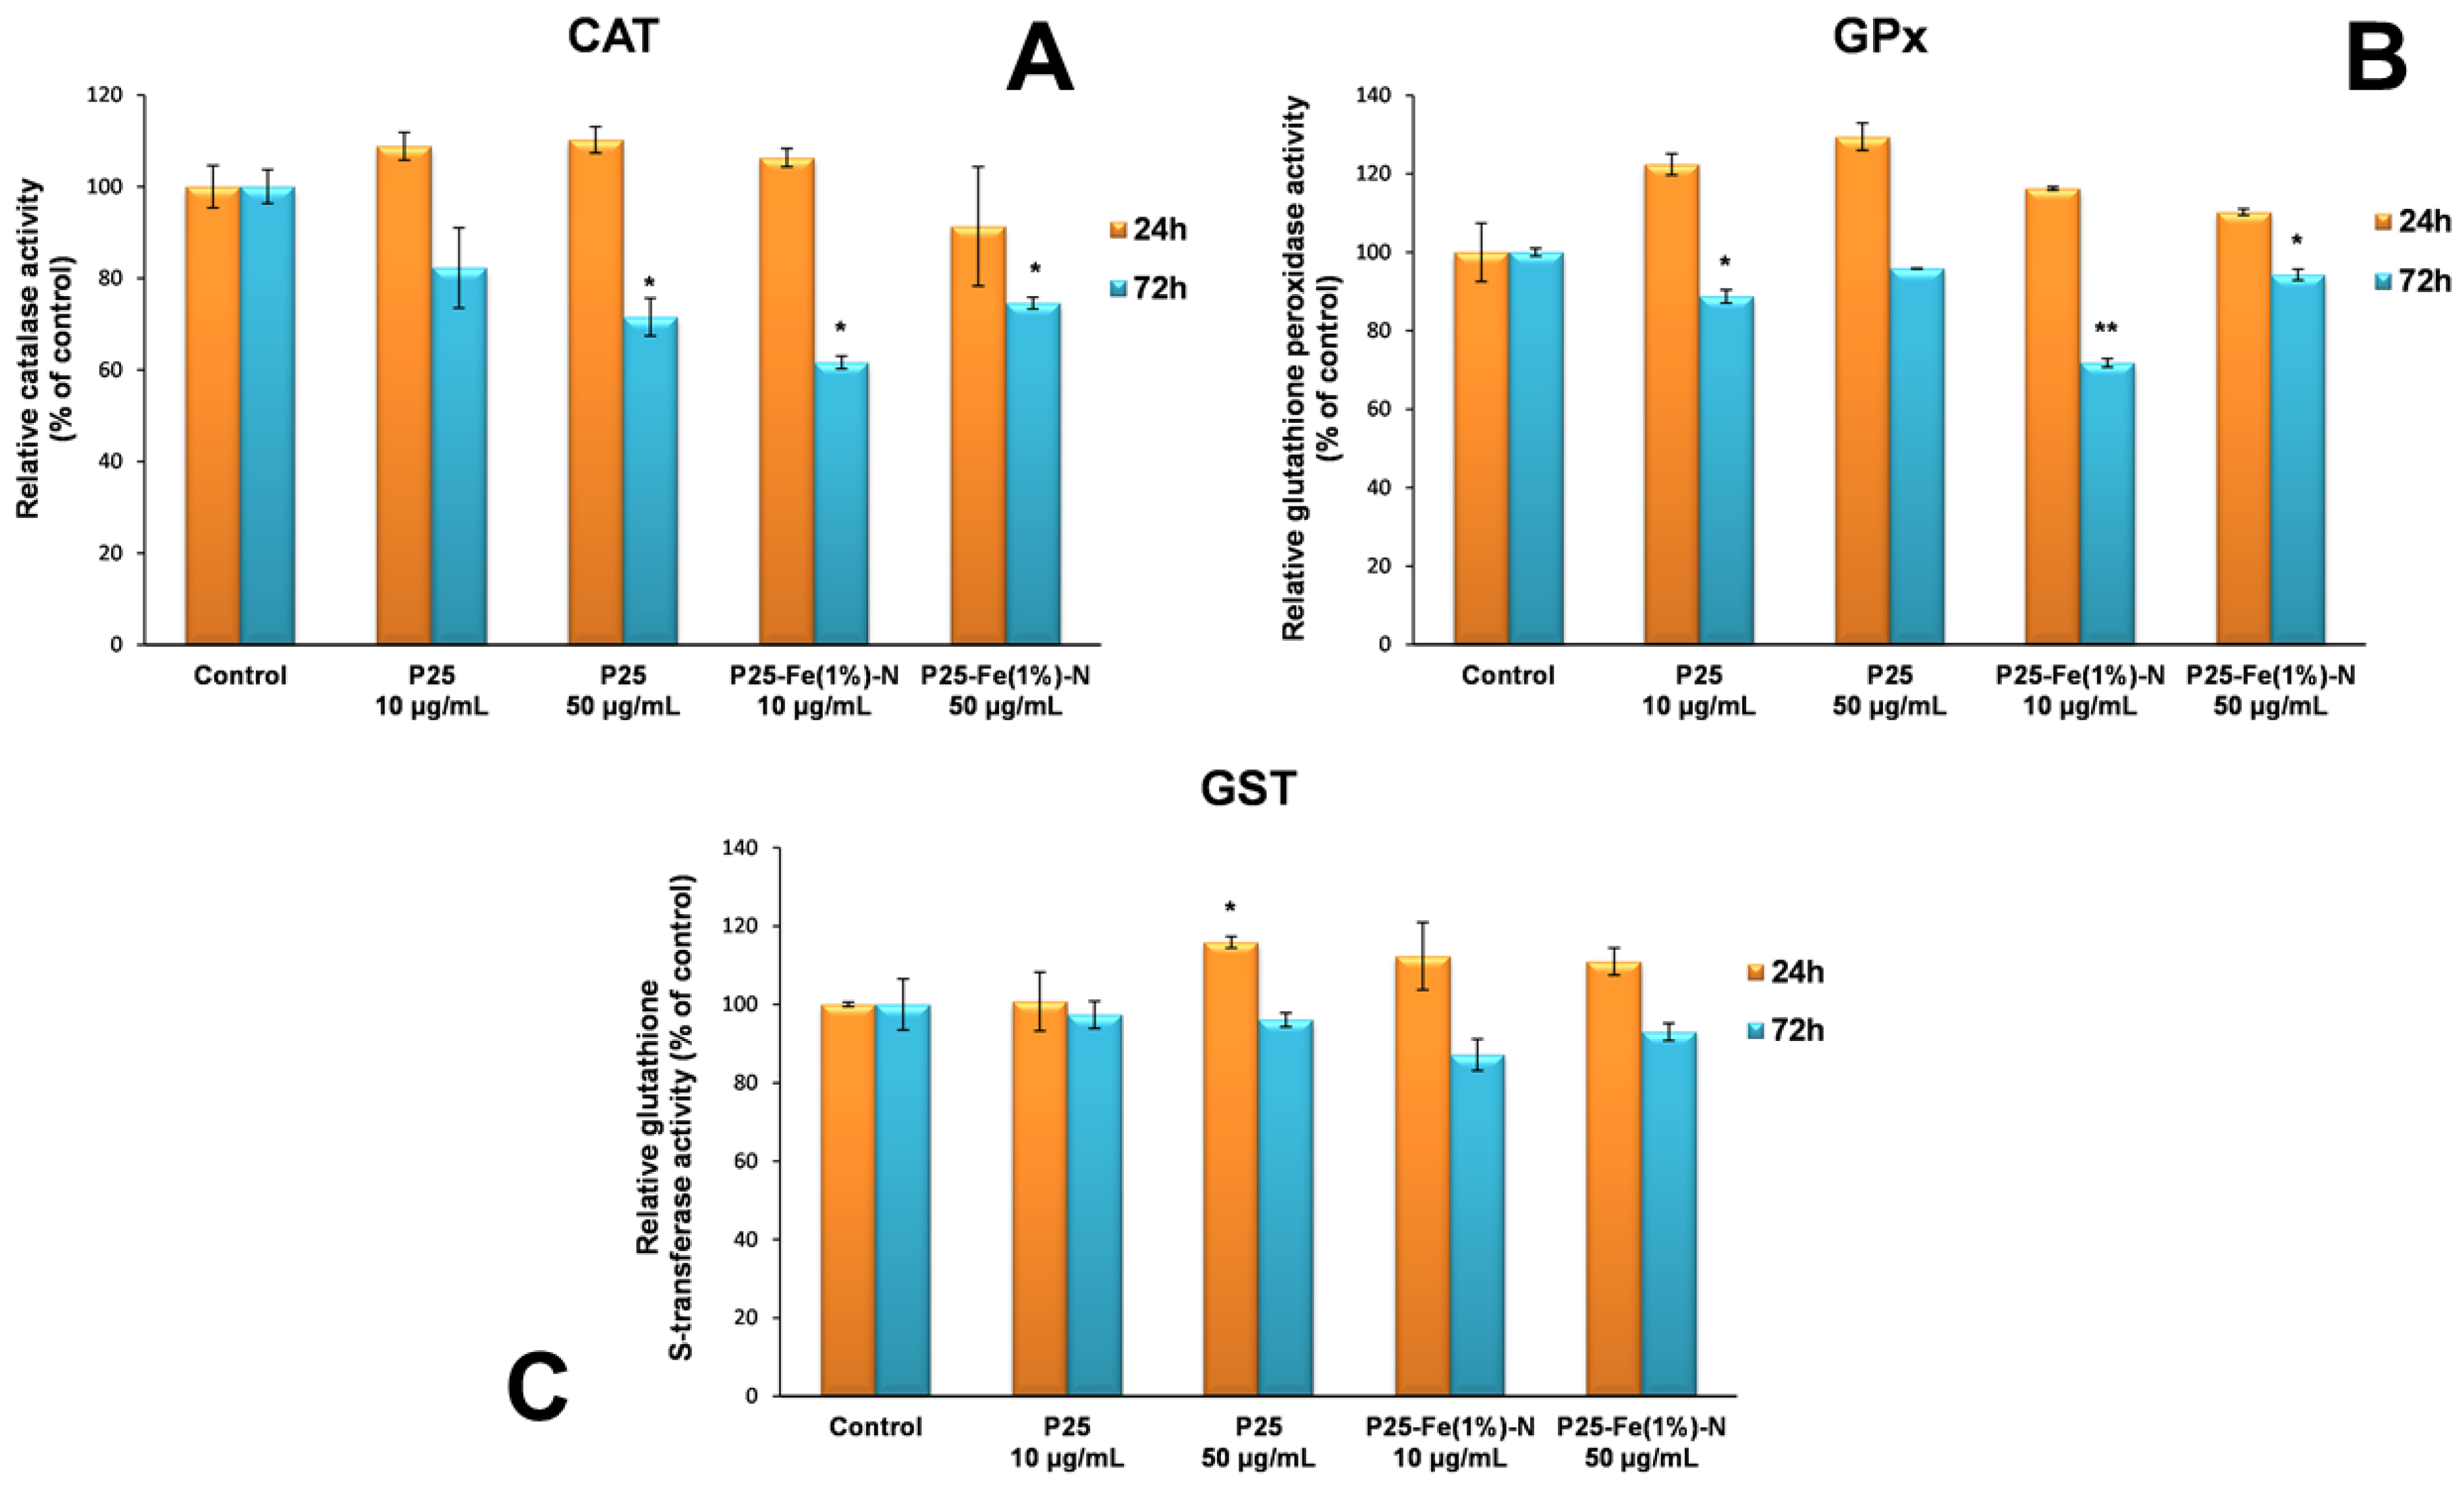
The cellular defense against oxidative damage was also assessed by measuring the enzymatic activities of CAT, GST and GPx. As it can be seen in Figure 5A, the CAT activity recorded a slight concentration-dependent increase (up to 10%) after 24 h of incubation of MRC-5 cells with TiO2 P25 NPs. In contrast, P25-Fe(1%)-N NPs induced different changes depending on the tested concentration. In the first 24 h, the presence of a lower concentration (10 µg/mL) of Fe/N-doped TiO2 NPs led to a slight 6% increase in CAT activity compared to the control, while the higher dose resulted in a decrease in enzymatic activity by almost 10%. After incubation of human lung fibroblasts for 72 h in the presence of TiO2 NPs, a decrease in CAT activity was observed both in cells exposed to TiO2 P25 NPs and P25-Fe(1%)-N NPs, but more pronounced in cells exposed to 10 µg/mL of P25-Fe(1%)-N NPs.
Regarding the activity of glutathione-dependent enzymes the same trend was observed. Specifically, the GPx activity shown in Figure 5B registered an insignificant increase (≤20%) for all samples compared to the control after the 24 h exposure interval. Instead, after 72 h, there was a diminution of GPx level up to 30% compared to the control.
Additionally, Figure 5C revealed that the GST activity did not change significantly in the first 24 h of exposure to TiO2 NPs, registering only a slight increase compared to the control (≤15%), while after 72 h a slight decrease in GST activity was observed. All these changes suggest a slight stimulation and activation of the antioxidant defense mechanism by both types of TiO2 NPs.
3.5. Effect of TiO2 NPs on Lipid Peroxidation of Cellular Membranes
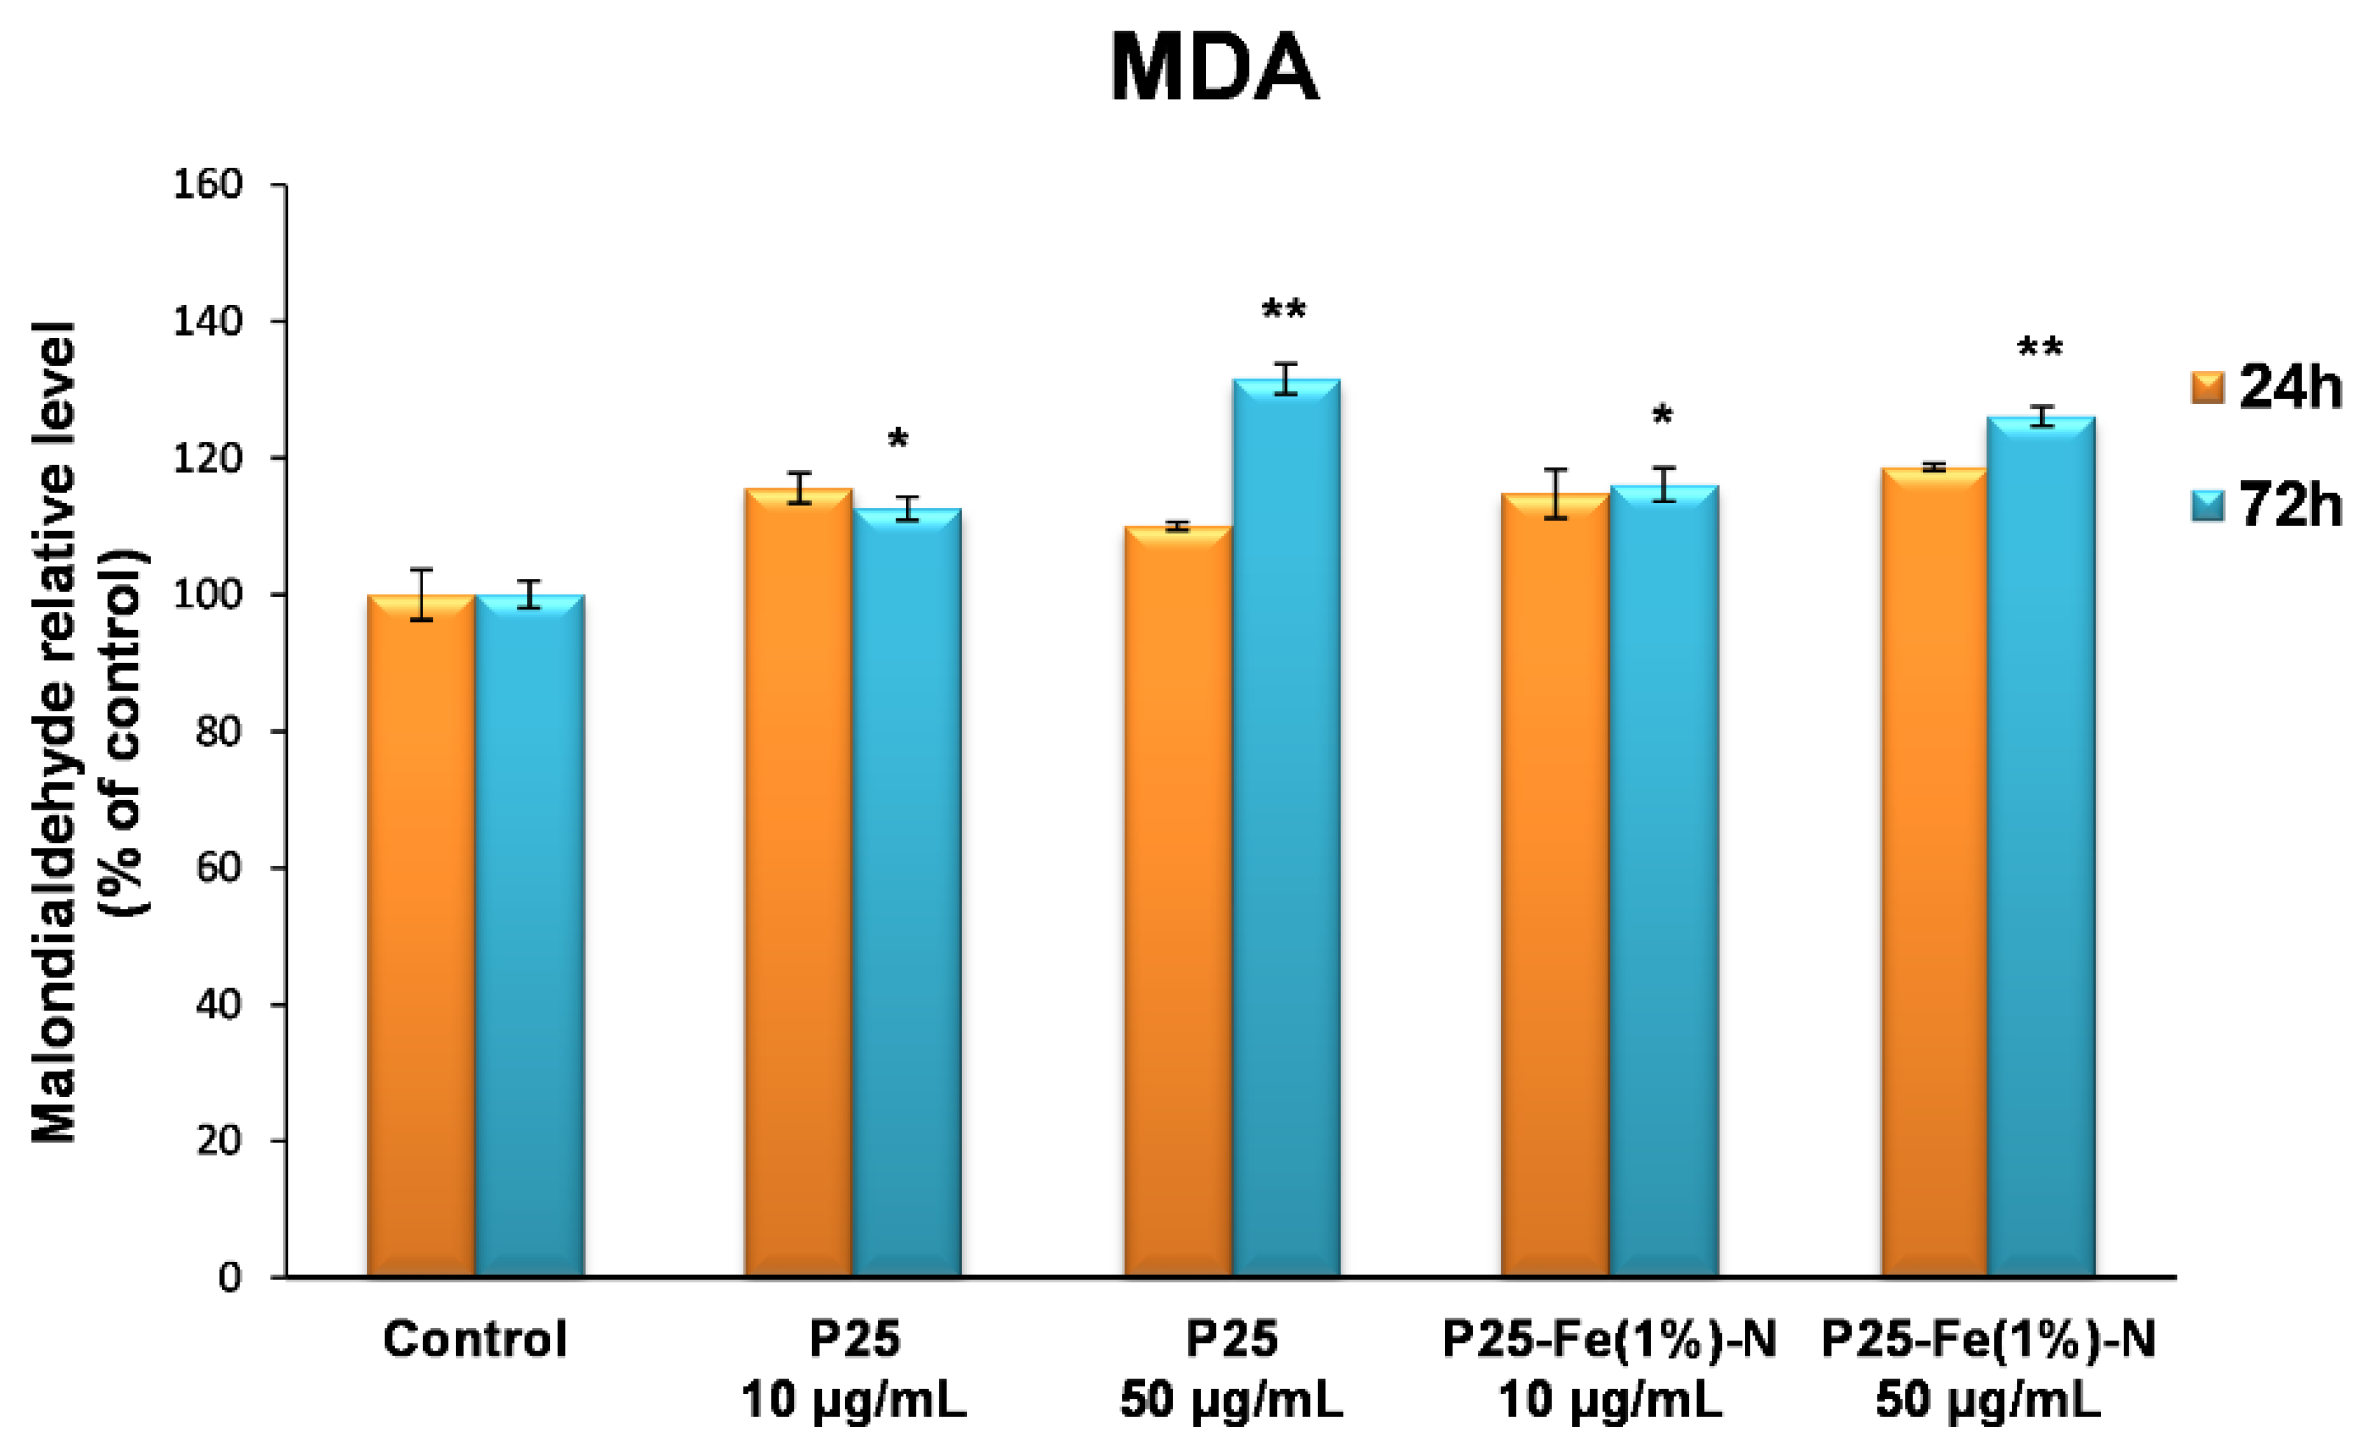
The effects of TiO2 NPs on lipid peroxidation, especially of cellular membranes of lung fibroblasts, are shown in Figure 6. The first 24 h in the presence of the nanophotocatalysts did not induce significant changes of MDA level in MRC-5 cells, but after 72 h of incubation, an elevation of MDA content by ~30% compared to the control was registered only for the higher dose (50 µg/mL) of both TiO2 P25 NPs and P25-Fe(1%)-N NPs. These observations showed that the MDA level increased in a time- and dose-manner, but no major differences were observed between the two types of nanophotocatalysts.
3.6. Autophagic Effect of TiO2 NPs on MRC-5 Cells
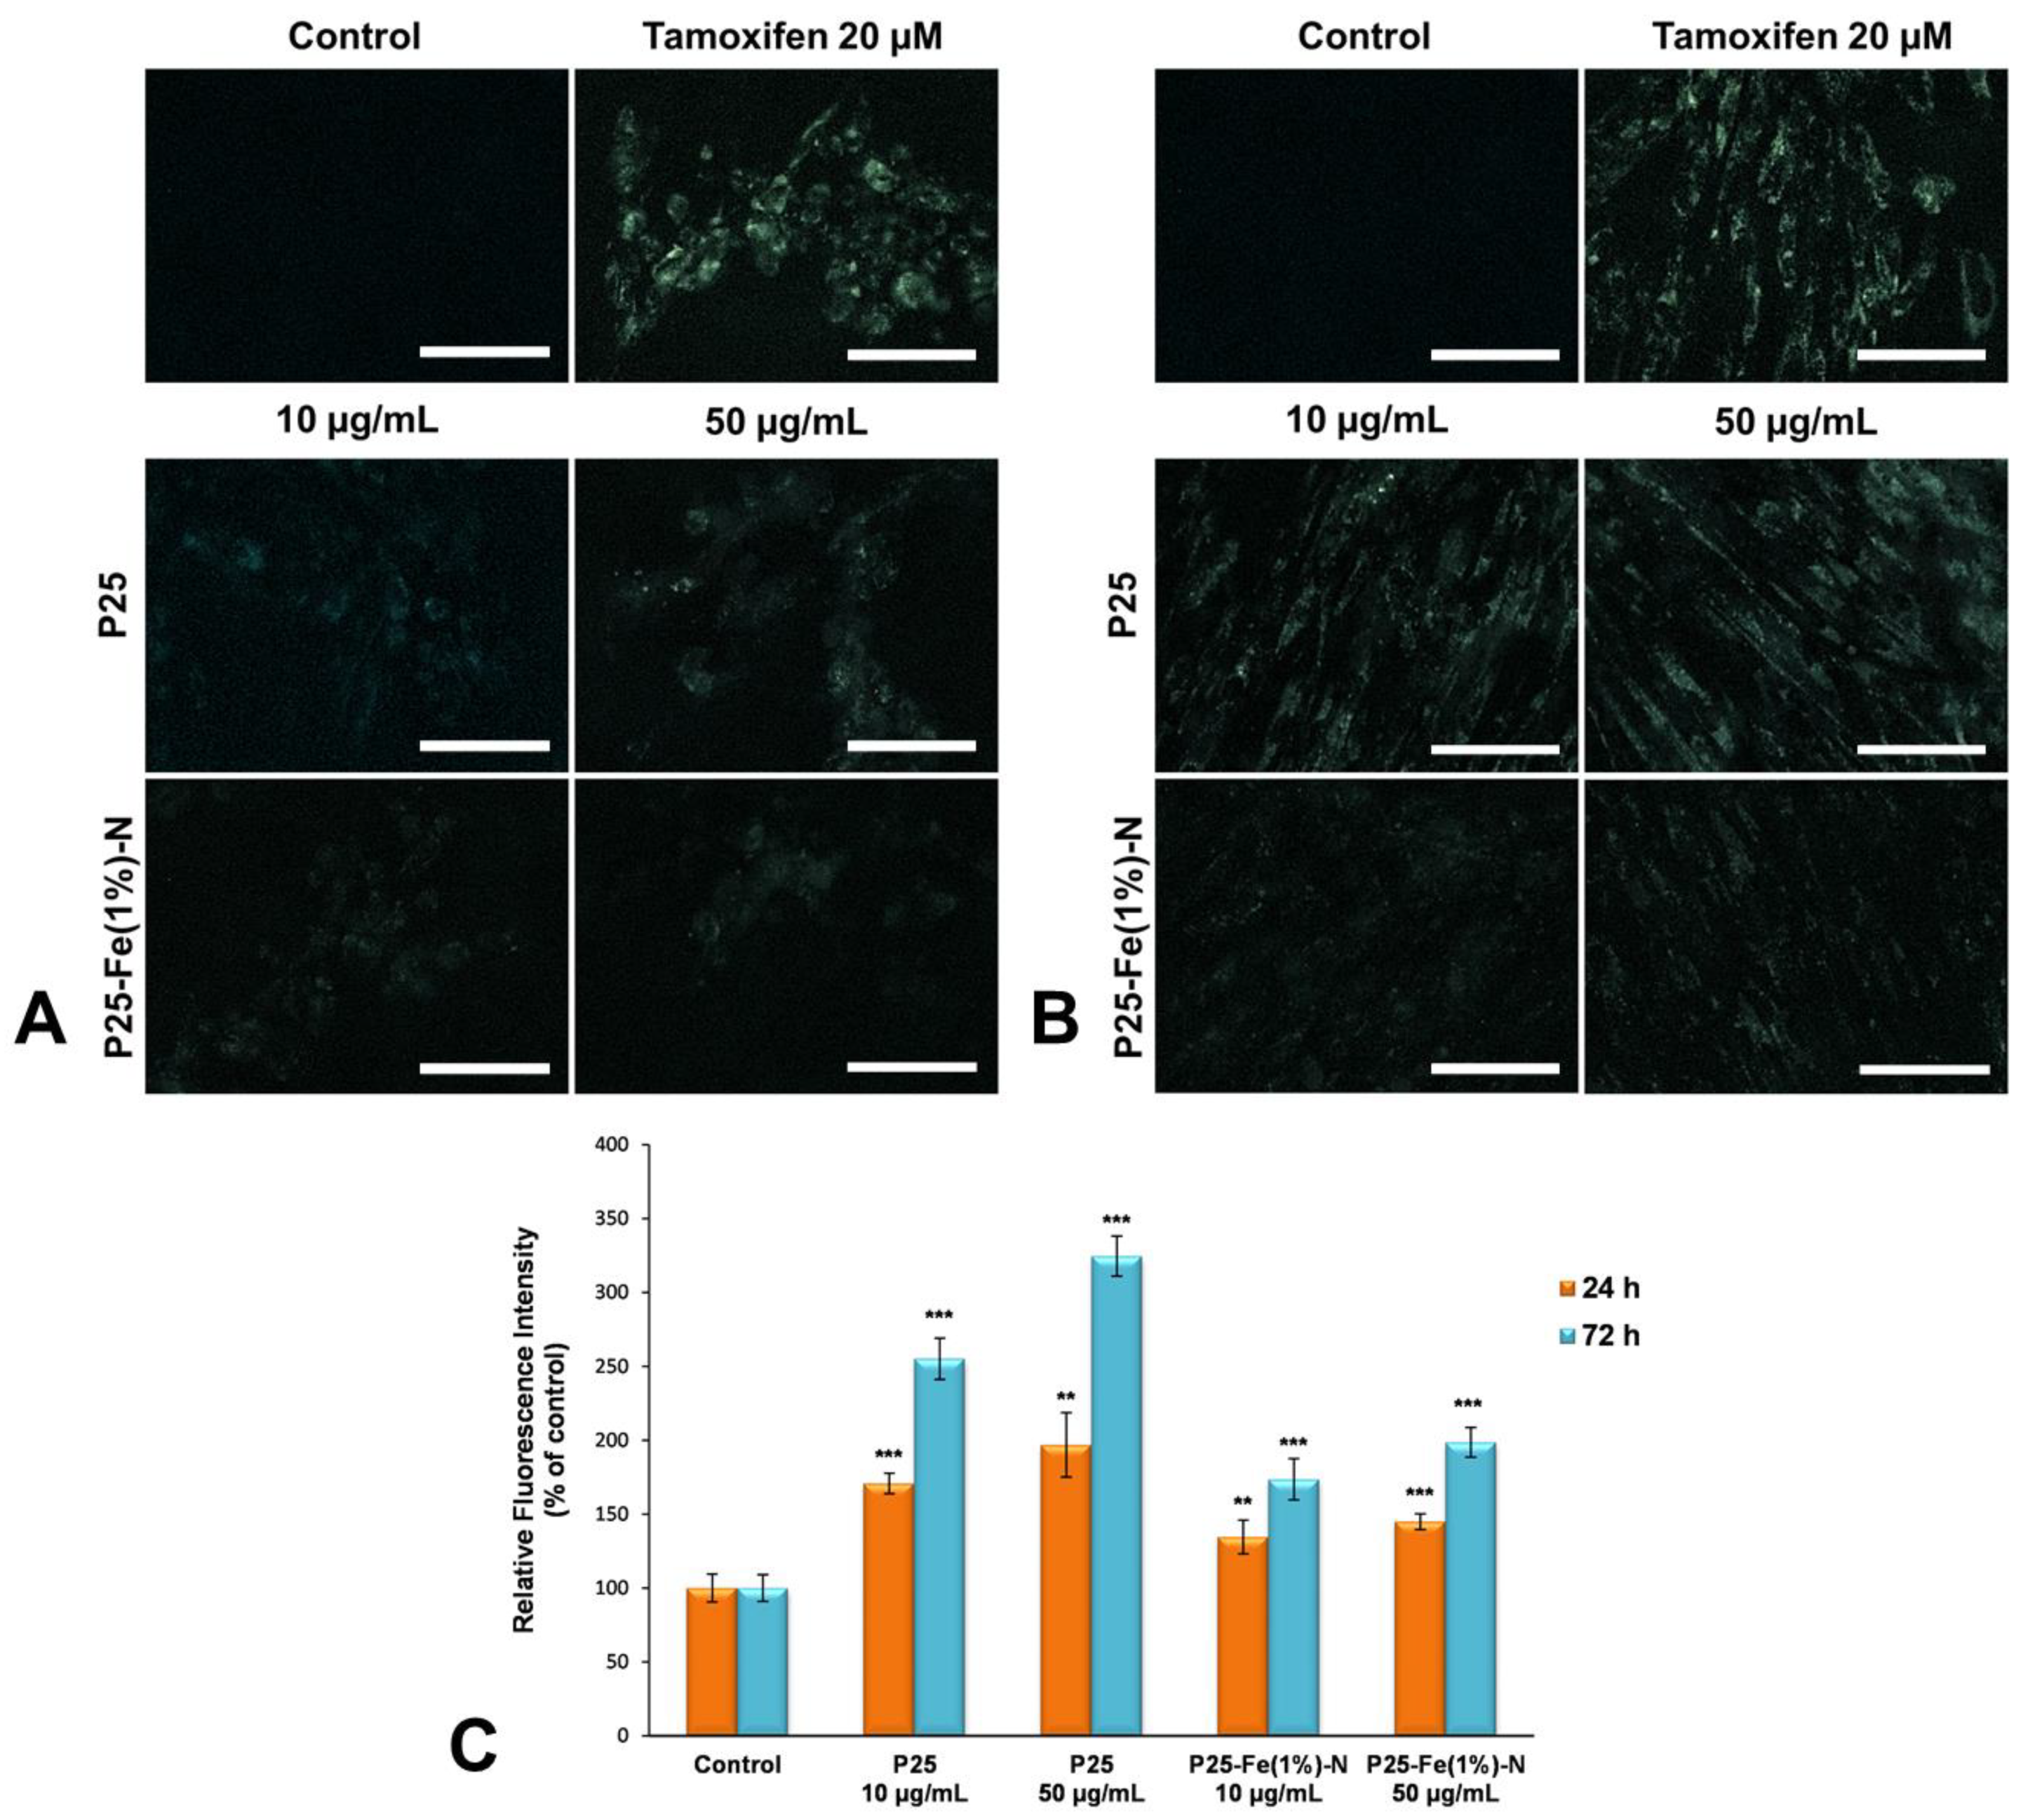
Figure 7 revealed that the fluorescence intensity of MDC staining in MRC-5 cells after exposure to TiO2 NPs increased in a dose- and time-dependent manner. Regarding the type of nanoparticles tested, significant differences were observed between pure P25 Degussa NPs and those doped with Fe and N atoms. Microscopy images showed that both doses of P25 NPs induced the activation of autophagy in MRC-5 lung cells even after the first 24 h of exposure, demonstrating once again that Fe-N doping could reduce their cytotoxic effect on human lung fibroblasts.
4. Discussion
The exponential growth of nanotechnology has led to numerous studies focusing on the risks associated with the NPs’ use. However, despite our growing exposure to different NP types, there is so much less information on nanomaterials’ safety compared to the research on nanoscaled particle applications.
The toxicity of NPs depends on many factors, including size, shape, surface area, surface charge as well as aggregation state, determined mainly by the specific parameters of each synthesis method [33]. These physicochemical properties have been shown to affect the distribution and accumulation of NPs in different tissues and organs, at the same time altering their molecular interactions with various macromolecules [34]. Therefore, there are many methods to prevent or limit the toxic effects of NPs. For example, modifying the shape, size and surface of particles can lead to NPs with the desired properties, but without toxic effects [35].
Due to the high interest generated by the photocatalytic applications of TiO2 NPs in different fields such as medicine, food industry or cosmetics, we comparatively studied the toxicity of pure TiO2 P25 NPs and the same NPs co-doped with Fe (1%) and N atoms in order to increase the photocatalytic activity in the visible light spectrum. The synergistic effect of Fe-N doping was explained by the fact that nitrogen atoms narrow of the band gap of TiO2, which allows absorption at longer wavelengths in visible light, while Fe helps to increase the efficiency of charge separation [36].
From the obtained results, it could be observed that neither TiO2 P25 Degussa NPs nor Fe-N-doped TiO2 NPs have significantly influenced the viability of MRC-5 lung fibroblasts. However, in some cases there was a very small decrease in LDH level after 72 h of exposure to nanophotocatalysts. It is known that liquid-suspended TiO2 NPs can adsorb soluble proteins such as albumin [37,38] or γ-globulin [39]. LDH is a cytosolic enzyme released in the culture medium from cells following damage to their cell membrane. Zaqout et al. showed that TiO2 NPs can interact with LDH in the Dulbecco’s Modified Eagle Medium (DMEM) culture medium [40], which could explain the lower level of the enzyme in the supernatant from NP-treated MRC-5 cells. The influence of several types of NPs, including TiO2, on the results of the LDH test was also demonstrated by the study of Holder et al. using 16HBE14o cells [41]. However, it is not clear whether this interaction with NPs affects the enzymatic activity of LDH. Additionally, the small discrepancy between the results of the two techniques (LDH and Sulforhodamine B-based assays) as well as the more pronounced toxic effects observed in the case of lower NP concentrations in some analyses could be explained by the aggregation and/or agglomeration phenomena that occur in TiO2 NPs colloidal solutions. Due to them, the interactions with cells are less harmful. Smaller and single NPs usually have a more pronounced toxic effect [42,43], but there are also exceptions to this rule [44].
The way by which NPs can enter into cells is a key factor in determining their toxicity. Endocytosis dependent cellular uptake of NPs can cause much more damage to the cell compared to NPs that get into the cell through a different route such as passive transport [45]. Several studies confirm the major role of actin cytoskeleton in the mechanism of endocytosis [46,47,48]. Thus, the reorganization of the actin cytoskeleton can be considered an indicator of the internalization of NPs. In this study, the actin cytoskeleton dynamic changes were analyzed by fluorescence microscopy in MRC-5 cells exposed to TiO2 NPs, with the most representative images being shown in Figure 3. No major differences were observed between the control and the two samples. In all experimental variants, the organization of the actin cytoskeleton was similar to that observed in the control, the actin filaments being organized in dense bundles. The images also suggested that the specific morphology of MRC-5 lung fibroblasts was not affected following exposure to TiO2 NPs. A similar result was observed after exposure of HaCaT keratinocytes to the same TiO2 concentrations used in this experiment (10 and 50 μg/mL) [49]. Moreover, Huerta-Garcia et al. showed that glial cells uptake TiO2 NPs from the culture medium through pseudopods and vesicles whose formation is dependent on the rapid and reversible reorganization of the actin cytoskeleton [50]. In the case of A549 epithelial lung cells, the internalization of TiO2 NPs had a significant effect, the architecture of the actin and tubulin cytoskeleton being severely and irreversible disturbed [51]. Taking in consideration all these results, it could be possible that P25 and P25–Fe(1%)-N NPs have not been internalized in MRC 5 fibroblasts.
In the case of metal oxide NPs, the mechanism of their toxicity is closely related to the release of metal ions in contact with cells or biological fluids [52]. In addition, the photocatalytic capacity is attributed to the generation of active oxygen species on the surface of photoexcited TiO2 [53]. Although the fundamental process of ROS production during photoexcitation involving photo-induced electrons and holes was first discovered in the early 20th century by Goodeve and Kitchener [54], the mechanism for intracellular ROS generation by NPs is still unclear. Our results showed that the ROS formation in cells exposed to TiO2 NPs was time- and dose-dependent, but a major difference could be observed between the two samples. The highest dose (50 µg/mL) of TiO2 P25 NPs had a significant stimulating effect on ROS production compared to P25-Fe(1%)-N photocatalyst. The toxicity of P25 Degussa has been reported previously and this may be due to the mixture of anatase and rutile phase in a 3:1 ratio, both phases exhibiting a synergistic effect on the UV photocatalytic activity of the TiO2 NPs [55,56]. In contrast, our present and previous studies [24] showed that P25-Fe(1%)-N NPs have a superior photocatalytic performance (both in UV and visible light) and reduced cytotoxicity. The fact that Fe-doping inhibits ROS generation has also been observed by Ghiazza et al. that performed experiments on human HaCaT keratinocytes [57]. The type of metal used for doping is very important to obtain the cytotoxicity-reducing effect. Ag-doped TiO2 NPs have been shown to increase intracellular ROS levels in HepG2, A549 and MCF-7 tumor cells, and the effect is increasingly pronounced with the amount of Ag. However, the same study showed that Ag-doped TiO2 NPs did not induce an increase in ROS levels in normal cells such as IMR-90 fibroblasts or primary rat hepatocytes [58].
TiO2 NPs may alter ROS production and thereby may cause interference in biological antioxidant defense responses. Normally, the superoxide radicals are converted into hydrogen peroxide (H2O2) under the defensive action of the antioxidant enzyme called superoxide dismutase (SOD), and then converted to water in the presence of other enzymes, CAT and GPx. However, if the number of radicals is too high in relation to cell antioxidant capacity, part of these ROS does not decompose, but enters the nucleus, causing oxidative damage of biomolecules and, subsequently, cell death [59]. In our study, oxidative stress was initiated by P25 and P25-Fe(1%)-N in a time- and dose-dependent manner, but the decrease in GSH levels only after 72 h of exposure to 50 µg/mL of Fe-N-doped P25 NPs suggests that photocatalysts were well tolerated. The lack of significant changes in catalase in the first 24 h and the decrease in its activity after 72 h of exposure to NPs also suggest that large amounts of H2O2 were not formed. Additionally, there was an increase in GPx and GST levels after 24 h of incubation with the TiO2 NPs, which probably resulted from an oxidative attack initiated by the reduction in the cellular antioxidant defense mechanisms. This increase in the activity of the two antioxidant enzymes is also well correlated with the increase in the level of lipid peroxidation in cells exposed to TiO2 NPs, indicating that they are probably involved in MDA and H2O2 detoxification [60].
An interesting observation regarding the hydrodynamic size of these NPs was that there was no correlation between the concentration tested and the Z-average of P25 NPs (Table 3). Additionally, higher values were measured after 72 h of incubation for the 10 µg/mL concentration compared to 50 µg/mL of P25-Fe(1%)–N NPs. This suggests the generation of higher aggregates in the culture medium at this time interval, and it could explain the lower activities of CAT and GPx after 72 h of incubation with 10 µg/mL compared to the values obtained for the 50 µg/mL concentration.
On the other hand, our results showed that autophagy was well correlated with increased ROS levels in MRC-5 cells treated with TiO2 NPs, especially with pure P25 Degussa. It has been shown that the connection of ROS and autophagy and the balance between them is an important indicator for cellular homeostasis in such experiments involving cells exposed to NPs [61]. ROS production appears to be the upstream modulator of autophagy and several studies revealed that the inhibition of ROS with N-acetyl-L-cysteine caused defective autophagy induced by NPs in HEK293 [62], HepG2 and human glioma cells [63,64]. It should be noted that depending on the concentration used, NPs can induce different autophagic effects. Usually, a low dose of NPs activates mTOR-mediated autophagy that plays a protective antioxidative role, whereas high dose could cause autophagic cell death [65]. However, NP-induced autophagy is rarely associated with cell survival. In our study, we showed that this programmed cell death pathway was primarily activated in lung fibroblasts exposed to P25 Degussa, demonstrating once again the efficiency of Fe-N doping in reducing their cytotoxicity.
5. Conclusions
Our results showed that the Fe-N-doping of TiO2 P25 NPs can reduce their toxic effect on human lung fibroblasts. The oxidative stress was initiated in a time- and dose-dependent manner with major differences between pure P25 and P25-Fe(1%)-N NPs. Additionally, a decreased rate of autophagic vacuoles formation was observed in cells exposed to Fe-N-doped P25 NPs compared to the pure ones, providing information that may contribute as a reference for future studies on photocatalytic applications. In conclusion, our research contributes to a better understanding of the mechanisms of interaction between functionalized TiO2 P25 NPs and in vitro biological systems and can also help to obtain more biocompatible and efficient TiO2-based nanomaterials.
Author Contributions
Conceptualization, I.C.N.; data curation, I.C.N. and L.D.; formal analysis, I.C.N. and B.A.M.; funding acquisition, I.C.N.; investigation, I.C.N., B.A.M. and L.D.; methodology, I.C.N. and B.A.M.; project administration, I.C.N.; resources, M.S.S.; software, L.D.; supervision, A.D.; validation, I.C.N., M.S.S. and A.D.; visualization, I.C.N. and M.S.S.; writing—original draft, I.C.N. and B.A.M.; writing—review and editing, M.S.S. and A.D. All authors have read and agreed to the published version of the manuscript.
Funding
This research was funded by the Research Institute of University of Bucharest (ICUB), grant for young researchers, number 20970/30.10.2020 (“Cell death mechanisms activated by functionalized TiO2 nanoparticles in lung fibroblasts”).
Institutional Review Board Statement
Not applicable.
Informed Consent Statement
Not applicable.
Data Availability Statement
Data are available on request from the corresponding author.
Conflicts of Interest
The authors declare no conflict of interest. The funders had no role in the design of the study; in the collection, analyses, or interpretation of data; in the writing of the manuscript, or in the decision to publish the results.
References
- Hakami, T.M.; Davarpanah, A.M.; Rahdar, A.; Barrett, S.D. Structural and magnetic study and cytotoxicity evaluation of tetrametallic nanoparticles of Co0.5Ni0.5CrxFe2-xO4 prepared by coprecipitation. J. Mol. Struct. 2018, 1165, 344–348. [Google Scholar] [CrossRef]
- Taimoory, M.S.; Rahdar, A.; Mousa, A.; Sadeghfar, F.; Hajinezdah, M.R.; Jahantigh, M.; Shahbazi, P.; Trant, J.F. The synthesis and characterization of a magnetite nanoparticle with potent antibacterial activity and low mammalian toxicity. J. Mol. Liq. 2018, 265, 96–104. [Google Scholar] [CrossRef]
- Mohafez, F.S.; Davarpanah, A.M.; Rahdar, A.; Beyzaei, H.; Zeybek, O.; Barrett, S.D. Structural, magnetic, and in vitro inhibitory characteristics of Ce-substituted MnFe2O4 nanoparticles. Appl. Phys. A 2021, 127, 600. [Google Scholar] [CrossRef]
- Al-Kattan, A.; Wichser, A.; Zuin, S.; Arroyo, Y.; Golanski, L.; Ulrich, A.; Nowack, B. Behavior of TiO2 released from nano-TiO2-containing paint and comparison to pristine nano-TiO2. Environ. Sci. Technol. 2014, 48, 6710–6718. [Google Scholar] [CrossRef]
- Windler, L.; Lorenz, C.; von Goetz, N.; Hungerbühler, K.; Amberg, M.; Heuberger, M.; Nowack, B. Release of titanium dioxide from textiles during washing. Environ. Sci. Technol. 2012, 46, 8181–8188. [Google Scholar] [CrossRef]
- Lu, P.J.; Huang, S.C.; Chen, Y.P.; Chiueh, L.C.; Shih, D.Y.C. Analysis of titanium dioxide and zinc oxide nanoparticles in cosmetics. J. Food Drug Anal. 2015, 23, 587–594. [Google Scholar] [CrossRef] [Green Version]
- Weir, A.; Westerhoff, P.; Fabricius, L.; Hristovski, K.; von Goetz, N. Titanium dioxide nanoparticles in food and personal care products. Environ. Sci. Technol. 2012, 46, 2242–2250. [Google Scholar] [CrossRef] [Green Version]
- Ziental, D.; Czarczynska-Goslinska, B.; Mlynarczyk, D.T.; Glowacka-Sobotta, A.; Stanisz, B.; Goslinski, T.; Sobotta, L. Titanium dioxide nanoparticles: Prospects and applications in medicine. Nanomaterials 2020, 10, 387. [Google Scholar] [CrossRef] [Green Version]
- Rodríguez-González, V.; Terashima, C.; Fujishima, A. Applications of photocatalytic titanium dioxide-based nanomaterials in sustainable agriculture. J. Photochem. Photobiol. C Photochem. Rev. 2019, 40, 49–67. [Google Scholar] [CrossRef]
- Li, W.; Elzatahry, A.; Aldhayan, D.; Zhao, D. Core–shell structured titanium dioxide nanomaterials for solar energy utilization. Chem. Soc. Rev. 2018, 47, 8203. [Google Scholar] [CrossRef]
- Ramprakash, B.; Incharoensakdi, A. Encapsulated titanium dioxide nanoparticle-Escherichia coli hybrid system improves light driven hydrogen production under aerobic condition. Bioresour. Technol. 2020, 318, 124057. [Google Scholar] [CrossRef] [PubMed]
- IARC (International Agency for Research on Cancer). Carbon Black, Titanium Dioxide, and Talc. In Monographs on the Evaluation of Carcinogenic Risks to Humans; IARC: Lyon, France, 2010; Volume 93, pp. 1–452. [Google Scholar]
- EU Directive. Regulation (EC) No 1223/2009 of the European Parliament and of the Council of 30 November 2009 on cosmetic products. Off. J. Eur. Union 2009, L342, 59–209. [Google Scholar]
- EU Directive. Commission Regulation (EU) 2019/1857 of 6 November 2019 amending Annex VI to Regulation (EC) No 1223/2009 of the European Parliament and of the Council on cosmetic products. Off. J. Eur. Union 2019, L286, 3–6. [Google Scholar]
- Gaté, L.; Disdier, C.; Cosnier, F.; Gagnaire, F.; Devoy, J.; Saba, W.; Brun, E.; Chalansonnet, M.; Mabondzo, A. Biopersistence and translocation to extrapulmonary organs of titanium dioxide nanoparticles after subacute inhalation exposure to aerosol in adult and elderly rats. Toxicol. Lett. 2017, 265, 61–69. [Google Scholar] [CrossRef] [PubMed]
- Chen, Z.; Han, S.; Zhou, S.; Feng, H.; Liu, Y.; Jia, G. Review of health safety aspects of titanium dioxide nanoparticles in food application. Nanoimpact 2020, 18, 100224. [Google Scholar] [CrossRef]
- Musial, J.; Krakowiak, R.; Mlynarczyk, D.T.; Goslinski, T.; Stanisz, B.J. Titanium Dioxide Nanoparticles in Food and Personal Care Products—What Do We Know about their Safety? Nanomaterials 2020, 10, 1110. [Google Scholar] [CrossRef]
- Song, B.; Zhou, T.; Yang, W.; Liu, J.; Shao, L. Contribution of oxidative stress to TiO2 nanoparticle-induced toxicity. Environ. Toxicol. Pharmacol. 2016, 48, 130–140. [Google Scholar] [CrossRef]
- Park, E.J.; Yi, J.; Chung, K.H.; Ryu, D.Y.; Choi, J.; Park, K. Oxidative stress and apoptosis induced by titanium dioxide nanoparticles in cultured BEAS-2B cells. Toxicol. Lett. 2008, 180, 222–229. [Google Scholar] [CrossRef]
- Yoo, K.C.; Yoon, C.H.; Kwon, D.; Hyun, K.H.; Woo, S.J.; Kim, R.K.; Lim, E.J.; Suh, Y.; Kim, M.K.; Yoon, T.H.; et al. Titanium dioxide induces apoptotic cell death through reactive oxygen species-mediated Fas upregulation and Bax activation. Int. J. Nanomed. 2012, 7, 1203–1214. [Google Scholar]
- Hussain, S.; Thomassen, L.C.; Ferecatu, I. Carbon black and titanium dioxide nanoparticles elicit distinct apoptotic pathways in bronchial epithelial cells. Part. Fibre Toxicol. 2010, 7, 10. [Google Scholar] [CrossRef] [Green Version]
- Nica, I.C.; Stan, M.S.; Popescu, R.G.; Nicula, N.; Ducu, R.; Diamandescu, L.; Dinischiotu, A. Fe-N co-doped titanium dioxide nanoparticles induce cell death in human lung fibroblasts in a p53-independent manner. Int. J. Mol. Sci. 2021, 22, 9627. [Google Scholar] [CrossRef] [PubMed]
- Zhu, Y.; Eaton, J.W.; Li, C. Titanium dioxide (TiO2) nanoparticles preferentially induce cell death in transformed cells in a Bak/Bax-independent fashion. PLoS ONE 2012, 7, e50607. [Google Scholar] [CrossRef] [PubMed]
- Diamandescu, L.; Feder, M.; Vasiliu, F.; Tanase, L.; Sobetkii, A.; Dumitrescu, I.; Teodorescu, M.; Popescu, T. Hydrothermal route to (Fe, N) codoped titania photocatalysts with increased visible light activity. Ind. Text. 2017, 68, 303–308. [Google Scholar] [CrossRef]
- Bradford, M.M. A rapid and sensitive method for the quantitation of microgram quantities of protein utilizing the principle of protein-dye binding. Anal. Biochem. 1976, 72, 248–254. [Google Scholar] [CrossRef]
- Aebi, H. Catalase. In Methods of Enzymatic Analysis; Bergmeyer, H.U., Ed.; Academic Press: New York, NY, USA, 1974; pp. 673–677. [Google Scholar]
- Beutler, E. Red Cell Metabolism. In A Manual of Biochemical Methods; Beutler, E., Ed.; Grune and Stratton: Orlando, FL, USA, 1984; pp. 68–73. [Google Scholar]
- Habig, W.H.; Pabst, M.J.; Jakoby, W.B. Glutathione S-transferases. The first enzymatic step in mercapturic acid formation. J. Biol. Chem. 1974, 249, 7130–7139. [Google Scholar] [CrossRef]
- Dinischiotu, A.; Stanca, L.; Gradinaru, D.; Petrache, S.N.; Radu, M.; Serban, A.I. Lipid peroxidation due to in vitro and in vivo exposure of biological samples to nanoparticles. Methods Mol. Biol. 2013, 1028, 155–164. [Google Scholar]
- Nica, I.C.; Stan, M.S.; Popa, M.; Chifiriuc, M.C.; Lazar, V.; Pircalabioru, G.G.; Dumitrescu, I.; Ignat, M.; Feder, M.; Tanase, L.C.; et al. Interaction of new-developed TiO2-based photocatalytic nanoparticles with pathogenic microorganisms and human dermal and pulmonary fibroblasts. Int. J. Mol. Sci. 2017, 18, 249. [Google Scholar] [CrossRef]
- Huang, S.; Chueh, P.J.; Lin, Y.W.; Shih, T.S.; Chuang, S.M. Disturbed mitotic progression and genome segregation are involved in cell transformation mediated by nano-TiO2 long-term exposure. Toxicol. Appl. Pharmacol. 2009, 241, 182–194. [Google Scholar] [CrossRef]
- Liu, S.; Xu, L.; Zhang, T.; Ren, G.; Yang, Z. Oxidative stress and apoptosis induced by nanosized titanium dioxide in PC12 cells. Toxicology 2010, 267, 172–177. [Google Scholar] [CrossRef]
- Najahi-Missaoui, W.; Arnold, R.D.; Cummings, B.S. Safe nanoparticles: Are we there yet? Int. J. Mol. Sci. 2021, 22, 385. [Google Scholar] [CrossRef]
- Hoshyar, N.; Gray, S.; Han, H.; Bao, G. The effect of nanoparticle size on in vivo pharmacokinetics and cellular interaction. Nanomedicine 2016, 11, 673–692. [Google Scholar] [CrossRef] [PubMed] [Green Version]
- Ungor, D.; Dékány, I.; Csapó, E. Reduction of tetrachloroaurate(Iii) ions with bioligands: Role of the thiol and amine functional groups on the structure and optical features of gold nanohybrid systems. Nanomaterials 2019, 9, 1229. [Google Scholar] [CrossRef] [Green Version]
- Dolat, D.; Mozia, S.; Ohtanj, B.; Morawski, A.W. Nitrogen, iron-single modified (N–TiO2, Fe–TiO2) and co-modified (Fe, N–TiO2) rutile titanium dioxide as visible-light active photocatalysts. Chem. Eng. J. 2013, 225, 358–364. [Google Scholar] [CrossRef]
- Kathiravan, A.; Renganathan, R. Interaction of colloidal TiO2 with bovine serum albumin: A fluorescence quenching study. Colloids Surf. A Physicochem. Eng. Asp. 2008, 324, 176–180. [Google Scholar] [CrossRef]
- Ranjan, S.; Dasgupta, N.; Srivastava, P.; Ramalingam, C. A spectroscopic study on interaction between bovine serum albumin and titanium dioxide nanoparticle synthesized from microwave-assisted hybrid chemical approach. J. Photochem. Photobiol. B Biol. 2016, 161, 472–481. [Google Scholar] [CrossRef] [PubMed]
- Zaqout, M.S.K.; Sumizawa, T.; Igisu, H.; Higashi, T.; Myojo, T. Binding of human serum proteins to titanium dioxide particles in vitro. J. Occup. Health 2011, 53, 75–83. [Google Scholar] [CrossRef] [Green Version]
- Zaqout, M.S.K.; Sumizawa, T.; Igisu, H.; Wilson, D.; Myojo, T.; Ueno, S. Binding of titanium dioxide nanoparticles to lactate dehydrogenase. Environ. Health Prev. Med. 2012, 17, 341–345. [Google Scholar] [CrossRef] [Green Version]
- Holder, A.L.; Goth-Goldstein, R.; Lucas, D.; Koshland, C.P. Particle-induced artifacts in the MTT and LDH viability assays. Chem. Res. Toxicol. 2012, 25, 1885–1892. [Google Scholar] [CrossRef] [Green Version]
- Lankoff, A.; Sandberg, W.J.; Wegierek-Ciuk, A.; Lisowska, H.; Refsnes, M.; Sartowska, B.; Schwarze, P.E.; Meczynska-Wielgosz, S.; Wojewodzka, M.; Kruszewski, M. The effect of agglomeration state of silver and titanium dioxide nanoparticles on cellular response of HepG2, A549 and THP-1 cells. Toxicol. Lett. 2012, 208, 197–213. [Google Scholar] [CrossRef]
- Lin, X.; Li, J.; Ma, S.; Liu, G.; Yang, K.; Tong, M.; Lin, D. Toxicity of TiO2 nanoparticles to Escherichia coli: Effects of particle size, crystal phase and water chemistry. PLoS ONE 2014, 9, e110247. [Google Scholar]
- Murugadoss, S.; Brassinne, F.; Sebaihi, N.; Petry, J.; Cokic, S.M.; van Landuyt, K.L.; Godderis, L.; Mast, J.; Lison, D.; Hoet, P.H.; et al. Agglomeration of titanium dioxide nanoparticles increases toxicological responses in vitro and in vivo. Part. Fibre Toxicol. 2020, 17, 10. [Google Scholar] [CrossRef] [PubMed]
- Foroozandeh, P.; Aziz, A.A. Insight into cellular uptake and intracellular trafficking of nanoparticles. Nanoscale Res. Lett. 2018, 13, 339. [Google Scholar] [CrossRef] [PubMed]
- Lamaze, C.; Fujimoto, L.M.; Yin, H.L.; Schmid, S.L. The actin cytoskeleton is required for receptor-mediated endocytosis in mammalian cells. J. Biol. Chem. 1997, 272, 20332–20335. [Google Scholar] [CrossRef] [PubMed] [Green Version]
- Qualmann, B.; Kessels, M.M.; Kelly, R.B. Molecular links between endocytosis and the actin cytoskeleton. J. Cell Biol. 2000, 150, 111–116. [Google Scholar] [CrossRef] [Green Version]
- Collins, A.; Warrington, A.; Taylor, K.A.; Svitkina, T. Structural organization of the actin cytoskeleton at sites of clathrin-mediated endocytosis. Curr. Biol. 2011, 21, 1167–1175. [Google Scholar] [CrossRef] [Green Version]
- Chan, J.; Ying, T.; Guang, Y.F.; Lin, L.X.; Kai, T.; Fang, Z.Y.; Ting, Y.X.; Xing, L.F.; Ji, Y.Y. In Vitro toxicity evaluation of 25-nm anatase TiO2 nanoparticles in immortalized keratinocyte cells. Biol. Trace Elem. Res. 2011, 144, 183–196. [Google Scholar] [CrossRef]
- Huerta-García, E.; Márquez-Ramírez, S.G.; Ramos-Godinez, M.P.; López-Saavedra, A.; Herrera, L.A.; Parra, A.; Alfaro-Moreno, E.; Gómez, E.O.; López-Marure, R. Internalization of titanium dioxide nanoparticles by glial cells is given at short times and is mainly mediated by actin reorganization-dependent endocytosis. NeuroToxicology 2015, 51, 27–37. [Google Scholar] [CrossRef]
- Déciga-Alcaraz, A.; Delgado-Buenrostro, N.L.; Ispanixtlahuatl-Meráz, O.; Freyre-Fonseca, V.; Flores-Flores, J.O.; Ganem-Rondero, A.; Vaca-Paniagua, F.; Ramos-Godinez, M.P.; Morales-Barcenas, R.; Sánchez-Pérez, Y.; et al. Irreversible disruption of the cytoskeleton as induced by non-cytotoxic exposure to titanium dioxide nanoparticles in lung epithelial cells. Chem. Biol. Interact. 2020, 323, 109063. [Google Scholar] [CrossRef]
- Długosz, O.; Szostak, K.; Staroń, A.; Pulit-Prociak, J.; Banach, M. Methods for reducing the toxicity of metal and metal oxide NPs as biomedicine. Materials 2020, 13, 279. [Google Scholar] [CrossRef] [Green Version]
- Li, M.; Yin, J.J.; Wamer, W.G.; Lo, Y.M. Mechanistic characterization of titanium dioxide nanoparticle-induced toxicity using electron spin resonance. J. Food Drug Anal. 2014, 22, 76–85. [Google Scholar] [CrossRef] [Green Version]
- Goodeve, C.F.; Kitchener, J.A. The mechanism of photosensitisation by solids. Trans. Faraday Soc. 1938, 34, 902–908. [Google Scholar] [CrossRef]
- Xue, C.; Luo, W.; Yang, X.L. A mechanism for nano-titanium dioxide-induced cytotoxicity in HaCaT cells under UVA irradiation. Biosci. Biotechnol. Biochem. 2015, 79, 1384–1390. [Google Scholar] [CrossRef] [PubMed]
- Roy, B.; Chandrasekaran, H.; Palamadai Krishnan, S.; Chandrasekaran, N.; Mukherjee, A. UVA pre-irradiation to P25 titanium dioxide nanoparticles enhanced its toxicity towards freshwater algae Scenedesmus obliquus. Environ. Sci. Pollut. Res. 2018, 25, 16729–16742. [Google Scholar] [CrossRef] [PubMed]
- Ghiazza, M.; Alloa, E.; Oliaro-Bosso, S.; Viola, F.; Livraghi, S.; Rembges, D.; Capomaccio, R.; Rossi, F.; Ponti, J.; Fenoglio, I. Inhibition of the ROS-mediated cytotoxicity and genotoxicity of nano-TiO2 toward human keratinocyte cells by iron doping. J. Nanopart. Res. 2014, 16, 2263. [Google Scholar] [CrossRef]
- Ahamed, M.; Khan, M.A.M.; Akhtar, M.J.; Alhadlaq, H.A.; Alshamsan, A. Ag-doping regulates the cytotoxicity of TiO2 nanoparticles via oxidative stress in human cancer cells. Sci. Rep. 2017, 7, 17662. [Google Scholar] [CrossRef]
- Manke, A.; Wang, L.; Rojanasakul, Y. Mechanisms of nanoparticle-induced oxidative stress and toxicity. BioMed Res. Int. 2013, 2013, 942916. [Google Scholar] [CrossRef] [Green Version]
- Hasanuzzaman, M.; Bhuyan, M.H.M.B.; Zulfiqar, F.; Raza, A.; Mohsin, S.M.; Mahmud, J.A.; Fujita, M.; Fotopoulos, V. Reactive oxygen species and antioxidant defense in plants under abiotic stress: Revisiting the crucial role of a universal defense regulator. Antioxidants 2020, 9, 681. [Google Scholar] [CrossRef]
- Jia, L.; Hao, S.L.; Yang, W.X. Nanoparticles induce autophagy via mTOR pathway inhibition and reactive oxygen species generation. Nanomedicine 2020, 15, 1419–1435. [Google Scholar] [CrossRef]
- Liu, Y.; Yu, H.; Zhang, X.; Wang, Y.; Song, Z.; Zhao, J.; Shi, H.; Li, R.; Wang, Y.; Zhang, L.W. The protective role of autophagy in nephrotoxicity induced by bismuth nanoparticles through AMPK/mTOR pathway. Nanotoxicology 2018, 12, 586–601. [Google Scholar] [CrossRef]
- Hamasaki, M.; Furuta, N.; Matsuda, A.; Nezu, A.; Yamamoto, A.; Fujita, N.; Oomori, H.; Noda, T.; Haraguchi, T.; Hiraoka, Y.; et al. Autophagosomes form at ER-mitochondria contact sites. Nature 2013, 495, 389–393. [Google Scholar] [CrossRef]
- Li, Y.; Wang, S.; Wang, Z.; Qian, X.; Fan, J.; Zeng, X.; Sun, Y.; Song, P.; Feng, M.; Ju, D. Cationic poly(amidoamine) dendrimers induced cyto-protective autophagy in hepatocellular carcinoma cells. Nanotechnology 2014, 25, 365101. [Google Scholar] [CrossRef] [PubMed]
- Lin, Y.X.; Wang, Y.; Qiao, S.L.; An, H.W.; Zhang, R.X.; Qiao, Z.Y.; Rajapaksha, R.P.; Wang, L.; Wang, H. pH-sensitive polymeric nanoparticles modulate autophagic effect via lysosome impairment. Small 2016, 12, 2921–2931. [Google Scholar] [CrossRef] [PubMed]
Figure 1.
Physicochemical characteristics of TiO2 NPs. (A) X-ray diffraction (XRD) patterns and phase assignment. (B) The X-ray photoelectron spectroscopy (XPS) spectra of the P25 and P25–Fe(1%)-N NPs samples.
Figure 1.
Physicochemical characteristics of TiO2 NPs. (A) X-ray diffraction (XRD) patterns and phase assignment. (B) The X-ray photoelectron spectroscopy (XPS) spectra of the P25 and P25–Fe(1%)-N NPs samples.

Figure 2.
Transmission electron microscopy (TEM) images and particle distribution diagrams of the P25 and P25–Fe(1%)-N NPs samples.
Figure 2.
Transmission electron microscopy (TEM) images and particle distribution diagrams of the P25 and P25–Fe(1%)-N NPs samples.

Figure 3.
Biocompatibility of different concentrations (10 and 50 μg/mL) of the two TiO2 NPs samples: P25 Degussa and P25-Fe(1%)-N, as shown by cell viability (A) and LDH release (B) after 24 and 72 h of exposure on normal lung fibroblasts. Results are expressed as means ± standard deviation (SD) (n = 3) and represented relative to the untreated cells (control). * p < 0.05 and ** p < 0.01 compared to control. Actin cytoskeleton organization of lung fibroblasts after 24 (C) and 72 h (D) of incubation with different concentrations (10 and 50 μg/mL) of the two TiO2 NPs samples: P25 Degussa and P25-Fe(1%)-N. F-actin (green) was labeled with phalloidin-fluorescein isothiocyanate (FITC). Scale bar: 100 μm.

Figure 4.
ROS (A) and GSH (B) levels in normal lung fibroblasts after 24 and 72 h of exposure to different concentrations (10 and 50 μg/mL) of the two TiO2 NPs samples: P25 Degussa and P25-Fe(1%)-N. Results are expressed as means ± standard deviation (SD) (n = 3) and represented relative to the untreated cells (control). * p < 0.05 and ** p < 0.01 compared to control.

Figure 5.
Relative levels of catalase (A) and glutathione-dependent enzymes (glutathione peroxidase and glutathione S-transferase) (B,C) specific activities in normal lung fibroblasts exposed to different concentrations (10 and 50 μg/mL) of the two TiO2 NPs samples: P25 Degussa and P25-Fe(1%)-N for 24 h and 72 h. Results are expressed as means ± standard deviation (SD) (n = 3) and represented relative to the untreated cells (control). * p < 0.05 and ** p < 0.01 compared to control.

Figure 6.
Malondialdehyde (MDA) levels in normal lung fibroblasts exposed to different concentrations (10 and 50 μg/mL) of the two TiO2 NPs samples: P25 Degussa and P25-Fe(1%)-N for 24 h and 72 h. Results are expressed as means ± standard deviation (SD) (n = 3) and represented relative to the untreated cells (control). * p < 0.05 and ** p < 0.01 compared to control.

Figure 7.
Autophagy induced in MRC-5 cells by TiO2 NPs. Representative images of fluorescence microscopy showing the autophagic vacuoles induced in normal lung fibroblasts after exposure to different concentrations (10 and 50 μg/mL) of the two TiO2 NPs samples: P25 Degussa and P25-Fe(1%)-N for 24 (A) and 72 h (B). Scale bar: 100 µm; (C) Quantification of MDC fluorescence intensity by Image J software (National Institutes of Health, Bethesda, MD, USA); Results are expressed as means ± standard deviation (SD) (n = 3) and represented relative to the untreated cells (control). ** p < 0.01 and *** p < 0.001 compared to control.


Table 1.
Lattice parameters, crystallite size, phase assignment and relative abundance of the P25 and P25–Fe(1%)-N NPs samples.
Table 1.
Lattice parameters, crystallite size, phase assignment and relative abundance of the P25 and P25–Fe(1%)-N NPs samples.
| Sample | Lattice Parameters (Å) | Crystallite Size (nm) | Phase Assignment/ Abundance (wt%) | ||
|---|---|---|---|---|---|
| a | b | c | |||
| P25 | 3.7891 | - | 9.5165 | 32.8 | Anatase (83.1) |
| 4.5977 | - | 2.9598 | 71.0 | Rutile (16.9) | |
| P25-Fe(1%)-N | 3.7876 | - | 9.5139 | 28.6 | Anatase (83.0) |
| 4.5942 | - | 2.9632 | 36.4 | Rutile (17.0) | |
| Errors | ±0.0005 | - | ±0.0005 | ±1.5 | ±1.4 |
Table 2.
The binding energy values extracted from the deconvolutions of the X-ray photoelectron spectroscopy (XPS) spectra of the P25 and P25–Fe(1%)-N NPs samples.
Table 2.
The binding energy values extracted from the deconvolutions of the X-ray photoelectron spectroscopy (XPS) spectra of the P25 and P25–Fe(1%)-N NPs samples.
| Sample | Ti 2p3/2 | O 1s | Fe 2p3/2 | N 1s |
|---|---|---|---|---|
| Binding Energy (eV) | ||||
| P25 | 458.65 | 529.98 | - | - |
| 459.63 | 531.03 | - | - | |
| - | 532.16 | - | - | |
| P25-Fe(1%)-N | 458.08 | 529.42 | 399.62 | |
| 459.30 | 530.75 | 710.40 | 401.19 | |
| 460.27 | 531.81 | - | - | |
Table 3.
Hydrodynamic diameter and zeta potential values measured for TiO2 NPs dispersed in PBS or culture medium (MEM + 10% FBS) for different periods of time. Results are represented as means ± standard deviation (SD) (n = 3).
Table 3.
Hydrodynamic diameter and zeta potential values measured for TiO2 NPs dispersed in PBS or culture medium (MEM + 10% FBS) for different periods of time. Results are represented as means ± standard deviation (SD) (n = 3).
| Condition | Samples | Z-Average (d.nm) | Zeta Potential (mV) |
|---|---|---|---|
| 5 min PBS | P25 NPs 10 µg/mL P25 NPs 50 µg/mL P25-Fe(1%)–N NPs 10 µg/mL P25-Fe(1%)–N NPs 50 µg/mL | 3327 ± 319.6 2539 ± 387.5 3582 ± 654.8 2333 ± 139.0 | −23.60 ± 0.42 −25.30 ± 1.20 −22.00 ± 2.05 −22.20 ± 2.40 |
| 5 min MEM + 10% FBS | P25 NPs 10 µg/mL P25 NPs 50 µg/mL P25-Fe(1%)–N NPs 10 µg/mL P25-Fe(1%)–N NPs 50 µg/mL | 683 ± 6.5 1490 ± 53.7 261 ± 204.8 766 ± 183.0 | −9.55 ± 0.31 −9.55 ± 0.62 −9.46 ± 0.07 −9.64 ± 0.50 |
| 24 h MEM + 10% FBS | P25 NPs 10 µg/mL P25 NPs 50 µg/mL P25-Fe(1%)–N NPs 10 µg/mL P25-Fe(1%)–N NPs 50 µg/mL | 2416 ± 1199.0 1479 ± 14.8 677 ± 253.0 1006 ± 108.3 | −9.38 ± 1.02 −10.40 ± 1.53 −9.85 ± 1.63 −10.20 ± 0.00 |
| 72 h MEM + 10% FBS | P25 NPs 10 µg/mL P25 NPs 50 µg/mL P25-Fe(1%)–N NPs 10 µg/mL P25-Fe(1%)–N NPs 50 µg/mL | 3971 ± 360.6 2445 ± 451.6 2978 ± 1063.0 1938 ± 14.8 | −11.60 ± 0.85 −11.40 ± 0.63 −8.14 ± 0.94 −10.70 ± 1.46 |
Publisher’s Note: MDPI stays neutral with regard to jurisdictional claims in published maps and institutional affiliations. |
© 2022 by the authors. Licensee MDPI, Basel, Switzerland. This article is an open access article distributed under the terms and conditions of the Creative Commons Attribution (CC BY) license (https://creativecommons.org/licenses/by/4.0/).
Share and Cite
MDPI and ACS Style
Nica, I.C.; Miu, B.A.; Stan, M.S.; Diamandescu, L.; Dinischiotu, A. Could Iron-Nitrogen Doping Modulate the Cytotoxicity of TiO2 Nanoparticles? Nanomaterials 2022, 12, 770. https://doi.org/10.3390/nano12050770
AMA Style
Nica IC, Miu BA, Stan MS, Diamandescu L, Dinischiotu A. Could Iron-Nitrogen Doping Modulate the Cytotoxicity of TiO2 Nanoparticles? Nanomaterials. 2022; 12(5):770. https://doi.org/10.3390/nano12050770
Chicago/Turabian StyleNica, Ionela Cristina, Bogdan Andrei Miu, Miruna S. Stan, Lucian Diamandescu, and Anca Dinischiotu. 2022. "Could Iron-Nitrogen Doping Modulate the Cytotoxicity of TiO2 Nanoparticles?" Nanomaterials 12, no. 5: 770. https://doi.org/10.3390/nano12050770
Note that from the first issue of 2016, this journal uses article numbers instead of page numbers. See further details here.