
Reductive Treatment of Pt Supported on Ti0.8Sn0.2O2-C Composite: A Route for Modulating the Sn–Pt Interactions
 , , , and
Abstract
:
1. Introduction
2. Materials and Methods
2.1. Materials
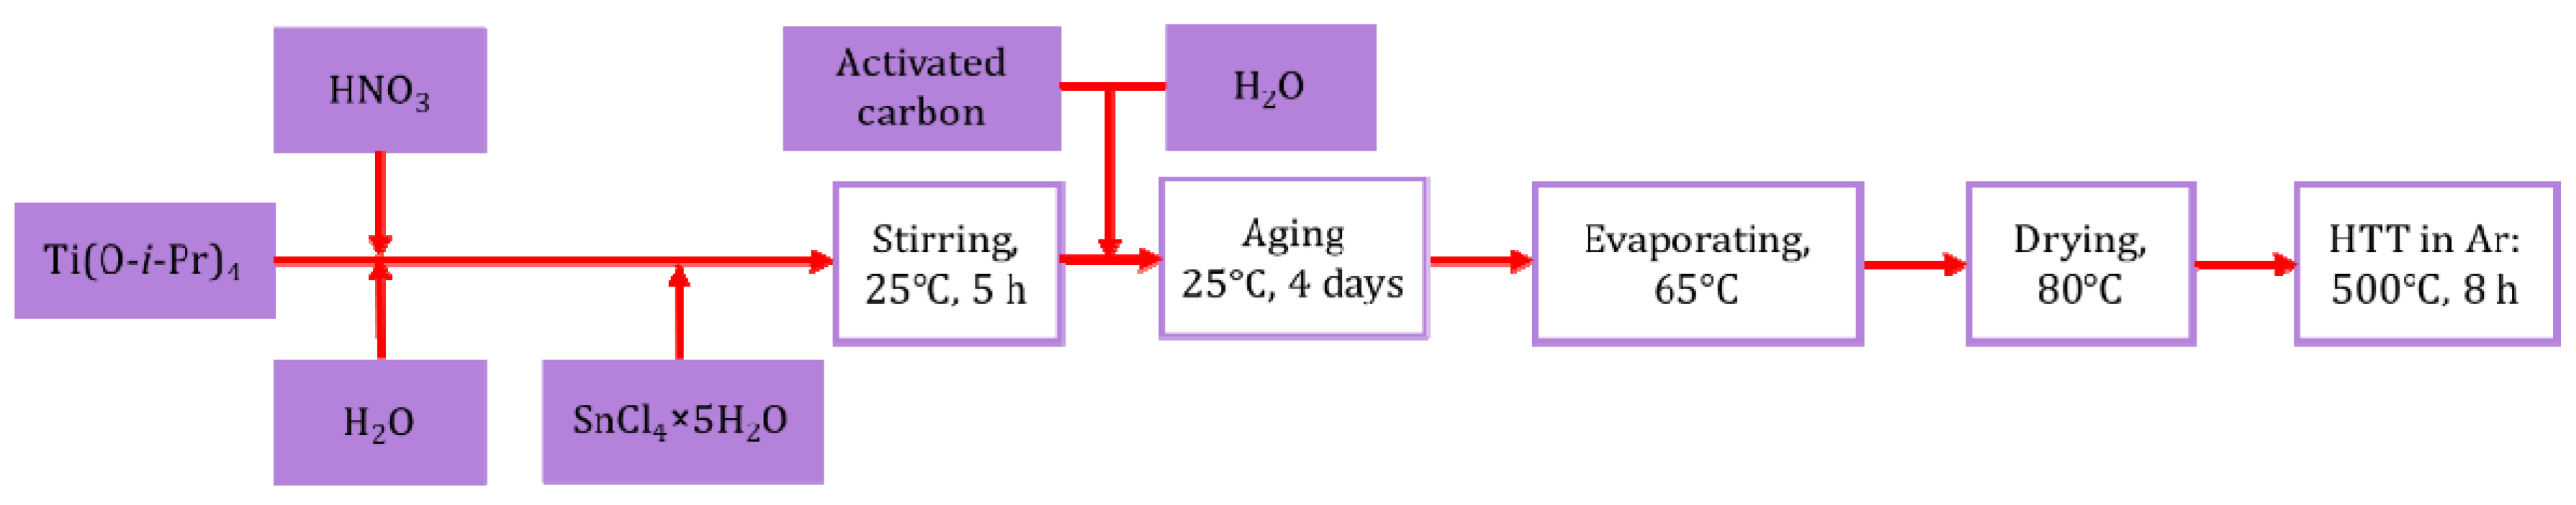
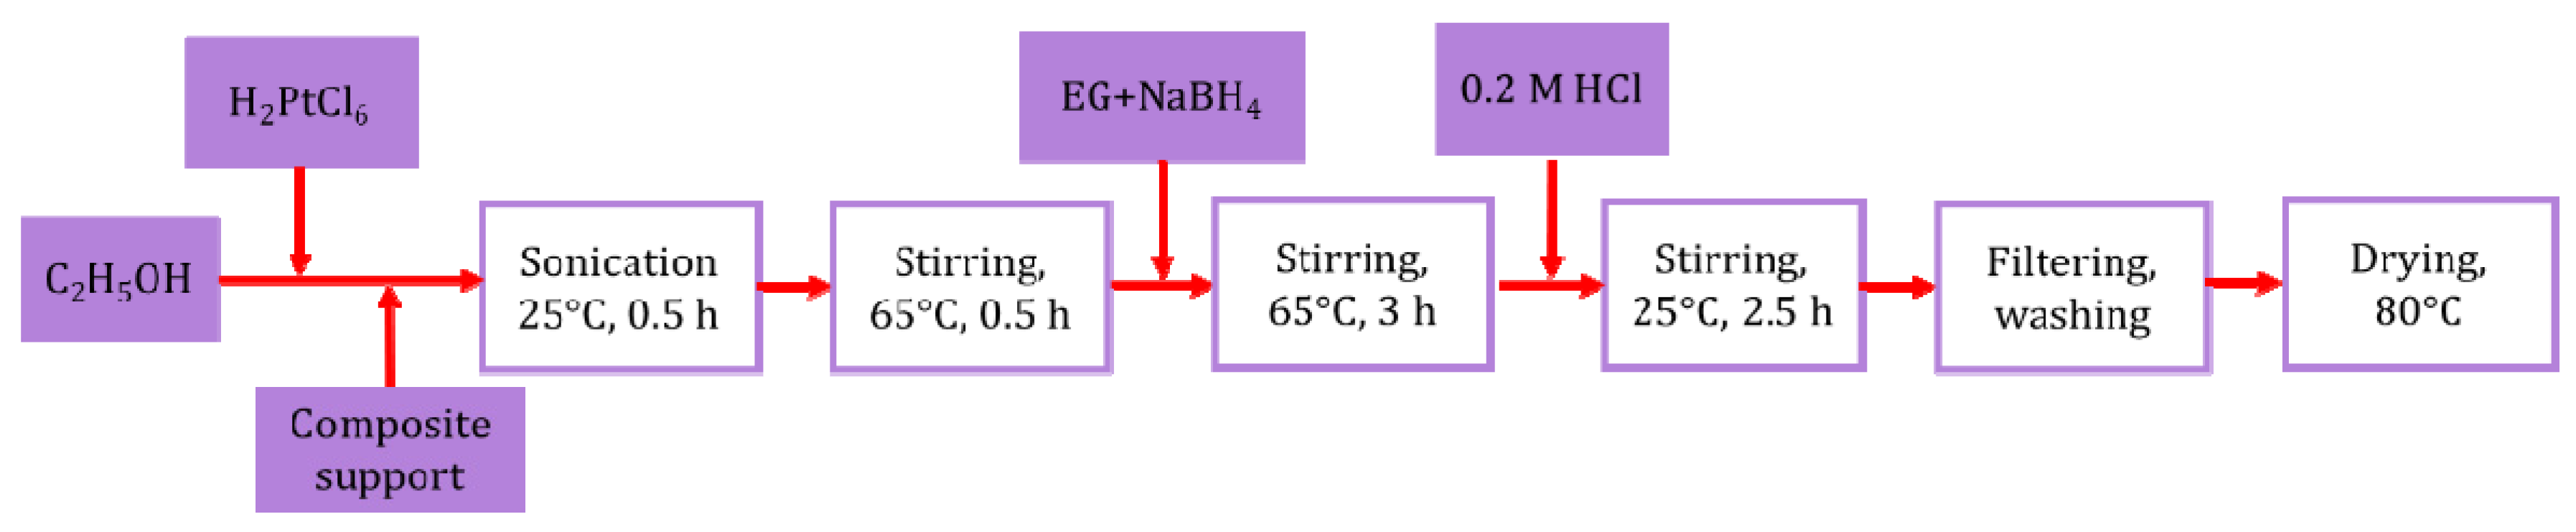
2.2. Preparation of the Pt/Ti0.8Sn0.2O2-C Composite-Supported Electrocatalysts
2.3. Reductive Pre-Treatment
2.4. Phase Composition and Morphology
2.5. Surface Chemical Characterization
2.6. Electrochemical Characterization
3. Results and Discussion
3.1. Structural Characteristics of the as Prepared and Reduced Pt/Ti0.8Sn0.2O2-C Catalysts
3.2. Surface Chemistry of the as Prepared and Reduced Pt/Ti0.8Sn0.2O2-C Catalysts
3.2.1. Surface Composition and Chemical States of the as Prepared and Reduced Catalysts
3.2.2. In Situ Reductive Treatment of the Electrocatalyst Samples
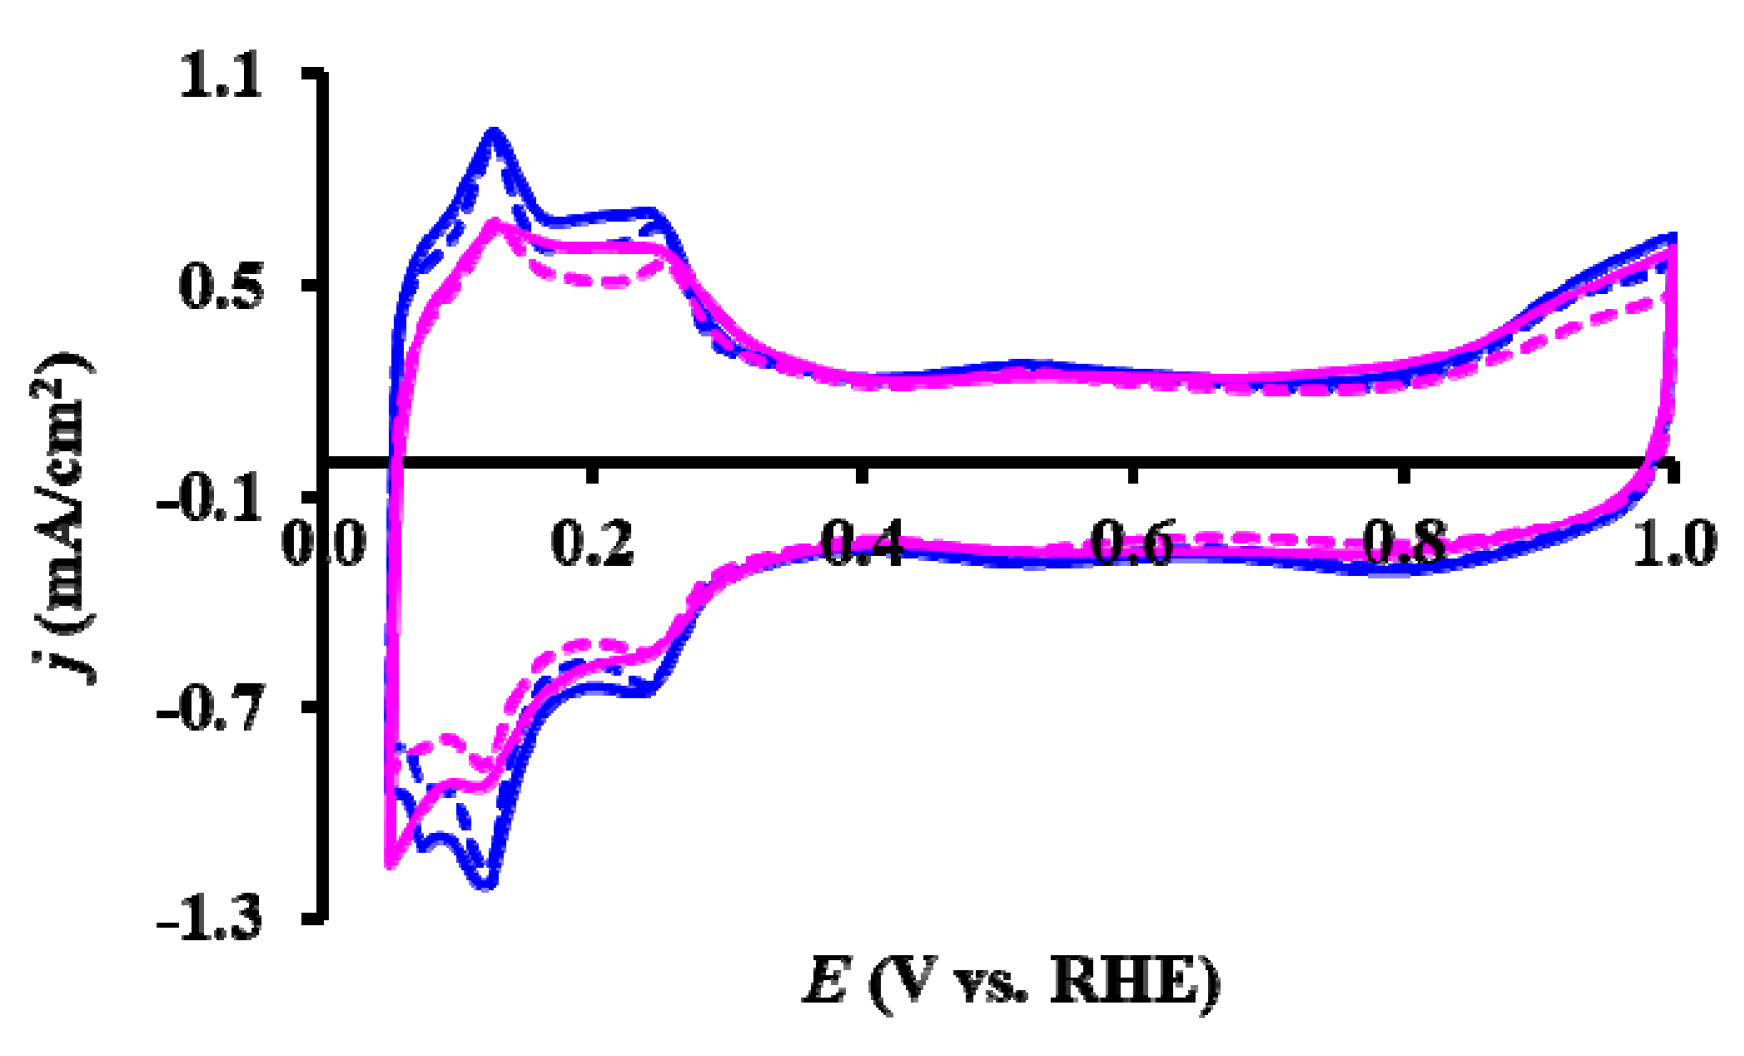
3.3. Electrocatalytic Properties of the As Prepared and Reduced Pt/Ti0.8Sn0.2O2-C Catalysts
4. Conclusions
Supplementary Materials
Author Contributions
Funding
Data Availability Statement
Conflicts of Interest
References
- Zhang, J. PEM Fuel Cell Electrocatalysts and Catalyst Layers: Fundamentals and Applications; Springer: London, UK, 2008; ISBN 9781848009356. [Google Scholar]
- Meier, J.C.; Galeano, C.; Katsounaros, I.; Topalov, A.A.; Kostka, A.; Schüth, F.; Mayrhofer, K.J.J. Degradation Mechanisms of Pt/C Fuel Cell Catalysts under Simulated Start-Stop Conditions. ACS Catal. 2012, 2, 832–843. [Google Scholar] [CrossRef]
- Pollet, B.G.; Kocha, S.S.; Staffell, I. Current Status of Automotive Fuel Cells for Sustainable Transport. Curr. Opin. Electrochem. 2019, 16, 90–95. [Google Scholar] [CrossRef]
- Prokop, M.; Drakselova, M.; Bouzek, K. Review of the Experimental Study and Prediction of Pt-Based Catalyst Degradation during PEM Fuel Cell Operation. Curr. Opin. Electrochem. 2020, 20, 20–27. [Google Scholar] [CrossRef]
- Wang, Y.J.; Zhao, N.; Fang, B.; Li, H.; Bi, X.T.; Wang, H. Carbon-Supported Pt-Based Alloy Electrocatalysts for the Oxygen Reduction Reaction in Polymer Electrolyte Membrane Fuel Cells: Particle Size, Shape, and Composition Manipulation and Their Impact to Activity. Chem. Rev. 2015, 115, 3433–3467. [Google Scholar] [CrossRef] [Green Version]
- Antolini, E.; Salgado, J.R.C.; Gonzalez, E.R. The Stability of Pt-M (M = First Row Transition Metal) Alloy Catalysts and Its Effect on the Activity in Low Temperature Fuel Cells. A Literature Review and Tests on a Pt-Co Catalyst. J. Power Sources 2006, 160, 957–968. [Google Scholar] [CrossRef]
- Lee, S.-A.; Park, K.-W.; Choi, J.-H.; Kwon, B.-K.; Sung, Y.-E. Nanoparticle Synthesis and Electrocatalytic Activity of Pt Alloys for Direct Methanol Fuel Cells. J. Electrochem. Soc. 2002, 149, A1299. [Google Scholar] [CrossRef]
- Alshammari, A.; Kalevaru, V.N.; Martin, A. Bimetallic Catalysts Containing Gold and Palladium for Environmentally Important Reactions. Catalysts 2016, 6, 97. [Google Scholar] [CrossRef] [Green Version]
- Śmiechowicz, I.; Kocemba, I.; Rogowski, J.; Czupryn, K. CO Oxidation over Pt/SnO2 Catalysts. React. Kinet. Mech. Catal. 2018, 124, 633–649. [Google Scholar] [CrossRef] [Green Version]
- Samjeské, G.; Nagamatsu, S.I.; Takao, S.; Nagasawa, K.; Imaizumi, Y.; Sekizawa, O.; Yamamoto, T.; Uemura, Y.; Uruga, T.; Iwasawa, Y. Performance and Characterization of a Pt-Sn(Oxidized)/C Cathode Catalyst with a SnO2-Decorated Pt3Sn Nanostructure for Oxygen Reduction Reaction in a Polymer Electrolyte Fuel Cell. Phys. Chem. Chem. Phys. 2013, 15, 17208–17218. [Google Scholar] [CrossRef]
- Borbáth, I.; Bakos, I.; Pászti, Z.; Szijjártó, G.P.; Tompos, A. Design of SnPt/C Cathode Electrocatalysts with Optimized Sn/Pt Surface Composition for Potential Use in Polymer Electrolyte Membrane Fuel Cells. Catal. Today 2021, 366, 20–30. [Google Scholar] [CrossRef]
- Gojković, S.L.; Vidaković, T.R.; Durović, D.R. Kinetic Study of Methanol Oxidation on Carbon-Supported PtRu Electrocatalyst. Electrochim. Acta 2003, 48, 3607–3614. [Google Scholar] [CrossRef]
- Wu, G.; Li, L.; Xu, B.Q. Effect of Electrochemical Polarization of PtRu/C Catalysts on Methanol Electrooxidation. Electrochim. Acta 2004, 50, 1–10. [Google Scholar] [CrossRef]
- García-Rodríguez, S.; Somodi, F.; Borbáth, I.; Margitfalvi, J.L.; Peña, M.A.; Fierro, J.L.G.; Rojas, S. Controlled Synthesis of Pt-Sn/C Fuel Cell Catalysts with Exclusive Sn-Pt Interaction: Application in CO and Ethanol Electrooxidation Reactions. Appl. Catal. B Environ. 2009, 91, 83–91. [Google Scholar] [CrossRef]
- Colmati, F.; Antolini, E.; Gonzalez, E.R. Ethanol Oxidation on a Carbon-Supported Pt75Sn25 Electrocatalyst Prepared by Reduction with Formic Acid: Effect of Thermal Treatment. Appl. Catal. B Environ. 2007, 73, 106–115. [Google Scholar] [CrossRef]
- Herranz, T.; García, S.; Martínez-Huerta, M.V.; Peña, M.A.; Fierro, J.L.G.; Somodi, F.; Borbáth, I.; Majrik, K.; Tompos, A.; Rojas, S. Electrooxidation of CO and Methanol on Well-Characterized Carbon Supported PtxSn Electrodes. Effect of Crystal Structure. Int. J. Hydrogen Energy 2012, 37, 7109–7118. [Google Scholar] [CrossRef]
- Borbáth, I.; Gubán, D.; Pászti, Z.; Sajó, I.E.; Drotár, E.; De La Fuente, J.L.G.; Herranz, T.; Rojas, S.; Tompos, A. Controlled Synthesis of Pt3Sn/C Electrocatalysts with Exclusive Sn-Pt Interaction Designed for Use in Direct Methanol Fuel Cells. Top. Catal. 2013, 56, 1033–1046. [Google Scholar] [CrossRef] [Green Version]
- Arenz, M.; Stamenkovic, V.; Blizanac, B.B.; Mayrhofer, K.J.; Markovic, N.M.; Ross, P.N. Carbon-Supported Pt-Sn Electrocatalysts for the Anodic Oxidation of H2, CO, and H2/CO Mixtures.: Part II: The Structure-Activity Relationship. J. Catal. 2005, 232, 402–410. [Google Scholar] [CrossRef]
- Borbáth, I.; Gubán, D.; Bakos, I.; Pászti, Z.; Gajdos, G.; Sajó, I.E.; Vass, Á.; Tompos, A. Exclusive Formation of Alloy Phases via Anchoring Technique—From Bimetallic Catalysts to Electrocatalysis. Catal. Today 2018, 306, 58–70. [Google Scholar] [CrossRef] [Green Version]
- Kou, R.; Shao, Y.; Mei, D.; Nie, Z.; Wang, D.; Wang, C.; Viswanathan, V.V.; Park, S.; Aksay, I.A.; Lin, Y.; et al. Stabilization of Electrocatalytic Metal Nanoparticles at Metal-Metal Oxide-Graphene Triple Junction Points. J. Am. Chem. Soc. 2011, 133, 2541–2547. [Google Scholar] [CrossRef]
- Qu, Y.; Gao, Y.; Kong, F.; Zhang, S.; Du, L.; Yin, G. Pt-RGO-TiO2 Nanocomposite by UV-Photoreduction Method as Promising Electrocatalyst for Methanol Oxidation. Int. J. Hydrogen Energy 2013, 38, 12310–12317. [Google Scholar] [CrossRef]
- Subban, C.V.; Zhou, Q.; Hu, A.; Moylan, T.E.; Wagner, F.T.; Disalvo, F.J. Sol-Gel Synthesis, Electrochemical Characterization, and Stability Testing of Ti0.7W0.3O2 Nanoparticles for Catalyst Support Applications in Proton-Exchange Membrane Fuel Cells. J. Am. Chem. Soc. 2010, 132, 17531–17536. [Google Scholar] [CrossRef] [PubMed]
- Nguyen, T.T.; Ho, V.T.T.; Pan, C.J.; Liu, J.Y.; Chou, H.L.; Rick, J.; Su, W.N.; Hwang, B.J. Synthesis of Ti0.7Mo0.3O2 Supported-Pt Nanodendrites and Their Catalytic Activity and Stability for Oxygen Reduction Reaction. Appl. Catal. B Environ 2014, 154–155, 183–189. [Google Scholar] [CrossRef]
- Huang, S.Y.; Ganesan, P.; Popov, B.N. Electrocatalytic Activity and Stability of Niobium-Doped Titanium Oxide Supported Platinum Catalyst for Polymer Electrolyte Membrane Fuel Cells. Appl. Catal. B Environ. 2010, 96, 224–231. [Google Scholar] [CrossRef]
- Gao, Y.; Hou, M.; Shao, Z.; Zhang, C.; Qin, X.; Yi, B. Preparation and Characterization of Ti0.7Sn0.3O2 as Catalyst Support for Oxygen Reduction Reaction. J. Energy Chem. 2014, 23, 331–337. [Google Scholar] [CrossRef]
- Gubán, D.; Borbáth, I.; Pászti, Z.; Sajó, I.; Drotár, E.; Hegedüs, M.; Tompos, A. Preparation and Characterization of Novel Ti0.7W0.3O2-C Composite Materials for Pt-Based Anode Electrocatalysts with Enhanced CO Tolerance. Appl. Catal. B Environ. 2015, 174–175, 455–470. [Google Scholar] [CrossRef] [Green Version]
- Borbáth, I.; Tálas, E.; Pászti, Z.; Zelenka, K.; Ayyubov, I.; Salmanzade, K.; Sajó, I.E.; Sáfrán, G.; Tompos, A. Investigation of Ti-Mo Mixed Oxide-Carbon Composite Supported Pt Electrocatalysts: Effect of the Type of Carbonaceous Materials. Appl. Catal. A Gen. 2021, 620, 118155. [Google Scholar] [CrossRef]
- Gubán, D.; Tompos, A.; Bakos, I.; Vass, Á.; Pászti, Z.; Szabó, E.G.; Sajó, I.E.; Borbáth, I. Preparation of CO-Tolerant Anode Electrocatalysts for Polymer Electrolyte Membrane Fuel Cells. Int. J. Hydrogen Energy 2017, 42, 13741–13753. [Google Scholar] [CrossRef] [Green Version]
- Yazici, M.S.; Dursun, S.; Borbáth, I.; Tompos, A. Reformate Gas Composition and Pressure Effect on CO Tolerant Pt/Ti0.8Mo0.2O2–C Electrocatalyst for PEM Fuel Cells. Int. J. Hydrogen Energy 2021, 46, 13524–13533. [Google Scholar] [CrossRef]
- Diczházi, D.; Borbáth, I.; Bakos, I.; Szijjártó, G.P.; Tompos, A.; Pászti, Z. Design of Mo-Doped Mixed Oxide–Carbon Composite Supports for Pt-Based Electrocatalysts: The Nature of the Mo-Pt Interaction. Catal. Today 2021, 366, 31–40. [Google Scholar] [CrossRef]
- Mayrhofer, K.J.J.; Hartl, K.; Juhart, V.; Arenz, M. Degradation of Carbon-Supported Pt Bimetallic Nanoparticles by Surface Segregation. J. Am. Chem. Soc. 2009, 131, 16348–16349. [Google Scholar] [CrossRef]
- Masao, A.; Noda, S.; Takasaki, F.; Ito, K.; Sasaki, K. Carbon-Free Pt Electrocatalysts Supported on SnO2 for Polymer Electrolyte Fuel Cells. Electrochem. Solid-State Lett. 2009, 12, 126–129. [Google Scholar] [CrossRef]
- Daio, T.; Staykov, A.; Guo, L.; Liu, J.; Tanaka, M.; Matthew Lyth, S.; Sasaki, K. Lattice Strain Mapping of Platinum Nanoparticles on Carbon and SnO2 Supports. Sci. Rep. 2015, 5, 13126. [Google Scholar] [CrossRef] [PubMed] [Green Version]
- Fu, Q.; Wagner, T. Interaction of Nanostructured Metal Overlayers with Oxide Surfaces. Surf. Sci. Rep. 2007, 62, 431–498. [Google Scholar] [CrossRef]
- Reyes, P.; Aguirre, M.C.; Melián-Cabrera, I.; López Granados, M.; Fierro, J.L.G. Interfacial Properties of an Ir/TiO2 System and Their Relevance in Crotonaldehyde Hydrogenation. J. Catal. 2002, 208, 229–237. [Google Scholar] [CrossRef]
- Pan, C.J.; Tsai, M.C.; Su, W.N.; Rick, J.; Akalework, N.G.; Agegnehu, A.K.; Cheng, S.Y.; Hwang, B.J. Tuning/Exploiting Strong Metal-Support Interaction (SMSI) in Heterogeneous Catalysis. J. Taiwan Inst. Chem. Eng. 2017, 74, 154–186. [Google Scholar] [CrossRef]
- Chen, J.Z.; Gao, J.; Probus, P.R.; Liu, W.; Wu, X.; Wegener, E.C.; Kropf, A.J.; Zemlyanov, D.; Zhang, G.; Yang, X.; et al. The Effect of Strong Metal-Support Interaction (SMSI) on Pt-Ti/SiO2 and Pt-Nb/SiO2 Catalysts for Propane Dehydrogenation. Catal. Sci. Technol. 2020, 10, 5973–5982. [Google Scholar] [CrossRef]
- Chen, M.; Rao, P.; Miao, Z.; Luo, J.; Li, J.; Deng, P.; Huang, W.; Tian, X. Strong Metal-Support Interaction of Pt-Based Electrocatalysts with Transition Metal Oxides/Nitrides/Carbides for Oxygen Reduction. Microstructures 2023, 3, 25. [Google Scholar] [CrossRef]
- Hsieh, B.J.; Tsai, M.C.; Pan, C.J.; Su, W.N.; Rick, J.; Chou, H.L.; Lee, J.F.; Hwang, B.J. Tuning Metal Support Interactions Enhances the Activity and Durability of TiO2-Supported Pt Nanocatalysts. Electrochim. Acta 2017, 224, 452–459. [Google Scholar] [CrossRef]
- Otor, H.O.; Steiner, J.B.; García-Sancho, C.; Alba-Rubio, A.C. Encapsulation Methods for Control of Catalyst Deactivation: A Review. ACS Catal. 2020, 10, 7630–7656. [Google Scholar] [CrossRef]
- Cao, X.Q.; Zhou, J.; Li, S.; Qin, G.W. Ultra-Stable Metal Nano-Catalyst Synthesis Strategy: A Perspective. Rare Met. 2020, 39, 113–130. [Google Scholar] [CrossRef] [Green Version]
- Jiménez-Morales, I.; Cavaliere, S.; Jones, D.; Rozière, J. Strong Metal-Support Interaction Improves Activity and Stability of Pt Electrocatalysts on Doped Metal Oxides. Phys. Chem. Chem. Phys. 2018, 20, 8765–8772. [Google Scholar] [CrossRef] [PubMed]
- Matsubu, J.C.; Zhang, S.; DeRita, L.; Marinkovic, N.S.; Chen, J.G.; Graham, G.W.; Pan, X.; Christopher, P. Adsorbate-Mediated Strong Metal-Support Interactions in Oxide-Supported Rh Catalysts. Nat. Chem. 2017, 9, 120–127. [Google Scholar] [CrossRef] [PubMed]
- Zhang, J.; Ma, J.; Choksi, T.S.; Zhou, D.; Han, S.; Liao, Y.F.; Yang, H.B.; Liu, D.; Zeng, Z.; Liu, W.; et al. Strong Metal-Support Interaction Boosts Activity, Selectivity, and Stability in Electrosynthesis of H2O2. J. Am. Chem. Soc. 2022, 144, 2255–2263. [Google Scholar] [CrossRef]
- Silva, C.; Borbáth, I.; Zelenka, K.; Sajó, I.E.; Sáfrán, G.; Tompos, A.; Pászti, Z. Effect of the Reductive Treatment on the State and Electrocatalytic Behavior of Pt in Catalysts Supported on Ti0.8Mo0.2O2-C Composite. React. Kinet. Mech. Catal. 2022, 135, 29–47. [Google Scholar] [CrossRef]
- Matsui, T.; Okanishi, T.; Fujiwara, K.; Tsutsui, K.; Kikuchi, R.; Takeguchi, T.; Eguchi, K. Effect of Reduction-Oxidation Treatment on the Catalytic Activity over Tin Oxide Supported Platinum Catalysts. Sci. Technol. Adv. Mater. 2006, 7, 524–530. [Google Scholar] [CrossRef]
- Okanishi, T.; Matsui, T.; Takeguchi, T.; Kikuchi, R.; Eguchi, K. Chemical Interaction between Pt and SnO2 and Influence on Adsorptive Properties of Carbon Monoxide. Appl. Catal. A Gen. 2006, 298, 181–187. [Google Scholar] [CrossRef]
- Salmanzade, K. Preparation of Novel Composite Support Materials for CO Tolerant and Stable Anode Electrocatalysts, Budapest University of Technology and Economics. 2022. Available online: http://www.ttk.hu/palyazatok/cataleast (accessed on 9 July 2023).
- Vass, Á.; Borbáth, I.; Pászti, Z.; Bakos, I.; Sajó, I.E.; Németh, P.; Tompos, A. Effect of Mo Incorporation on the Electrocatalytic Performance of Ti–Mo Mixed Oxide–Carbon Composite Supported Pt Electrocatalysts. React. Kinet. Mech. Catal. 2017, 121, 141–160. [Google Scholar] [CrossRef] [Green Version]
- Rasband, W.S. ImageJ, Version 1.53t. Available online: https://imagej.nih.gov/ij/ (accessed on 9 July 2023).
- Fairley, N. CasaXPS: Spectrum Processing Software for XPS, AES and SIMS; Version 2.3.12; Teignmouth: Devon, UK, 2006; Available online: http://www.casaxps.com (accessed on 9 July 2023).
- Mohai, M. XPS MultiQuant: Multimodel XPS Quantification Software. Surf. Interface Anal. 2004, 36, 828–832. [Google Scholar] [CrossRef]
- Mohai, M. XPS MultiQuant: Multi-Model X-Ray Photoelectron Spectroscopy Quantification Program, Version 7.00.92; Budapest, Hungary. 2011. Available online: http://aki.ttk.hu/XMQpages/XMQhome.php (accessed on 9 July 2023).
- Werner, W.S.M. Electron Transport in Solids for Quantitative Surface Analysis. Surf. Interface Anal. 2001, 31, 141–176. [Google Scholar] [CrossRef]
- Bard, A.J.; Zoski, C.G. Electroanalytical Chemistry: A Series of Advances; Dekker, M., Ed.; CRC Press: New York, NY, USA; Basel, Switzerland, 1976; Volume 9. [Google Scholar]
- Vegard, L. Die Konstitution Der Mischkristalle Und Die Raumfüllung Der Atome. Z. Phys. 1921, 5, 17–26. [Google Scholar] [CrossRef]
- Peters, E.M.-B.H. Ueberein Nieder Valentes Titan-Wolfram Oxid: Ti0.54W0.46O2. Available online: http://www.crystallography.net/cod/2002761.html (accessed on 9 July 2023).
- Liu, Y.; Li, D.; Stamenkovic, V.R.; Soled, S.; Henao, J.D.; Sun, S. Synthesis of Pt3Sn Alloy Nanoparticles and Their Catalysis for Electro-Oxidation of Co and Methanol. ACS Catal. 2011, 1, 1719–1723. [Google Scholar] [CrossRef]
- Oropeza, F.E.; Davies, B.; Palgrave, R.G.; Egdell, R.G. Electronic Basis of Visible Region Activity in High Area Sn-Doped Rutile TiO2 Photocatalysts. Phys. Chem. Chem. Phys. 2011, 13, 7882–7891. [Google Scholar] [CrossRef] [PubMed]
- Boppana, V.B.R.; Lobo, R.F. Photocatalytic Degradation of Organic Molecules on Mesoporous Visible-Light-Active Sn(II)-Doped Titania. J. Catal. 2011, 281, 156–168. [Google Scholar] [CrossRef]
- Zhao, Y.; Liu, J.; Shi, L.; Yuan, S.; Fang, J.; Wang, Z.; Zhang, M. Surfactant-Free Synthesis Uniform Ti1-xSnxO2 Nanocrystal Colloids and Their Photocatalytic Performance. Appl. Catal. B Environ. 2010, 100, 68–76. [Google Scholar] [CrossRef]
- Bett, J.A.; Kinoshita, K.; Stonehart, P. Crystallite Growth of Platinum Dispersed on Graphitized Carbon Black. J. Catal. 1976, 41, 124–133. [Google Scholar] [CrossRef]
- Vleeming, J.H.; Kuster, B.F.M.; Marin, G.B. Effect of Platinum Particle Size and Catalyst Support on the Platinum Catalyzed Selective Oxidation of Carbohydrates. Catal. Lett. 1997, 46, 187–194. [Google Scholar] [CrossRef]
- Han, K.S.; Moon, Y.S.; Han, O.H.; Hwang, K.J.; Kim, I.; Kim, H. Heat Treatment and Potential Cycling Effects on Surface Morphology, Particle Size, and Catalytic Activity of Pt/C Catalysts Studied by 13C NMR, TEM, XRD and CV. Electrochem. Commun. 2007, 9, 317–324. [Google Scholar] [CrossRef]
- Alexeev, O.S.; Chin, S.Y.; Engelhard, M.H.; Ortiz-Soto, L.; Amiridis, M.D. Effects of Reduction Temperature and Metal-Support Interactions on the Catalytic Activity of Pt/γ-Al2O2 and Pt/TiO2 for the Oxidation of CO in the Presence and Absence of H2. J. Phys. Chem. B 2005, 109, 23430–23443. [Google Scholar] [CrossRef]
- An, K.; Zhang, Q.; Alayoglu, S.; Musselwhite, N.; Shin, J.Y.; Somorjai, G.A. High-Temperature Catalytic Reforming of n-Hexane over Supported and Core-Shell Pt Nanoparticle Catalysts: Role of Oxide-Metal Interface and Thermal Stability. Nano Lett. 2014, 14, 4907–4912. [Google Scholar] [CrossRef]
- Behafarid, F.; Roldan Cuenya, B. Coarsening Phenomena of Metal Nanoparticles and the Influence of the Support Pre-Treatment: Pt/TiO2(110). Surf. Sci. 2012, 606, 908–918. [Google Scholar] [CrossRef]
- Majrik, K.; Pászti, Z.; Korecz, L.; Trif, L.; Domján, A.; Bonura, G.; Cannilla, C.; Frusteri, F.; Tompos, A.; Tálas, E. Study of PtOx/TiO2 Photocatalysts in the Photocatalytic Reforming of Glycerol: The Role of Co-Catalyst Formation. Materials 2018, 11, 1927. [Google Scholar] [CrossRef] [Green Version]
- Naumkin, A.V.; Kraut-Vass, A.; Gaarenstroom, S.W.; Powell, C.J. NIST X-ray Photoelectron Spectroscopy Database, Version 4.1. Available online: http://srdata.nist.gov/xps/ (accessed on 9 July 2023).
- Hilaire, L.; Guerrero, G.D.; Légaré, P.; Maire, G.; Krill, G. Photoemission Study of the Oxidation of Platinum in Pt-Based Alloys: Pt-Pd, Pt-Ru, Pt-Ir. Surf. Sci. 1984, 146, 569–582. [Google Scholar] [CrossRef]
- Jerdev, D.I.; Koel, B.E. Oxidation of Ordered Pt-Sn Surface Alloys by O2. Surf. Sci. 2001, 492, 106–114. [Google Scholar] [CrossRef]
- Batzill, M.; Kim, J.; Beck, D.E.; Koel, B.E. Epitaxial Growth of Tin Oxide on Pt(111): Structure and Properties of Wetting Layers and SnO2 Crystallites. Phys. Rev. B Condens. Matter Mater. Phys. 2004, 69, 165403. [Google Scholar] [CrossRef]
- Kraya, L.Y.; Liu, G.F.; He, X.; Koel, B.E. Structures and Reactivities of Tin Oxide on Pt(111) Studied by Ambient Pressure X-ray Photoelectron Spectroscopy (APXPS). Top. Catal. 2016, 59, 497–505. [Google Scholar] [CrossRef]
- Paál, Z.; Wootsch, A.; Teschner, D.; Lázár, K.; Sajó, I.E.; Györffy, N.; Weinberg, G.; Knop-Gericke, A.; Schlögl, R. Structural Properties of an Unsupported Model Pt-Sn Catalyst and Its Catalytic Properties in Cyclohexene Transformation. Appl. Catal. A Gen. 2011, 391, 377–385. [Google Scholar] [CrossRef]
- Virnovskaia, A.; Jørgensen, S.; Hafizovic, J.; Prytz, Ø.; Kleimenov, E.; Hävecker, M.; Bluhm, H.; Knop-Gericke, A.; Schlögl, R.; Olsbye, U. In Situ XPS Investigation of Pt(Sn)/Mg(Al)O Catalysts during Ethane Dehydrogenation Experiments. Surf. Sci. 2007, 601, 30–43. [Google Scholar] [CrossRef] [Green Version]
- Margitfalvi, J.L.; Borbáth, I.; Lázár, K.; Tfirst, E.; Szegedi, A.; Hegedüs, M.; Gőbölös, S. In Situ Characterization of Sn-Pt/SiO2 Catalysts Used in Low Temperature Oxidation of CO. J. Catal. 2001, 203, 94–103. [Google Scholar] [CrossRef]
- Margitfalvi, J.L.; Borbáth, I.; Hegedüs, M.; Tfirst, E.; Gőbölös, S.; Lázár, K. Low-Temperature CO Oxidation over New Types of Sn-Pt/SiO2 Catalysts. J. Catal. 2000, 196, 200–204. [Google Scholar] [CrossRef]
- Bocanegra, S.A.; De Miguel, S.R.; Borbath, I.; Margitfalvi, J.L.; Scelza, O.A. Behavior of Bimetallic PtSn/Al2O3 Catalysts Prepared by Controlled Surface Reactions in the Selective Dehydrogenation of Butane. J. Mol. Catal. A Chem. 2009, 301, 52–60. [Google Scholar] [CrossRef]
- Gubán, D.; Tompos, A.; Bakos, I.; Pászti, Z.; Gajdos, G.; Sajó, I.; Borbáth, I. CO Oxidation and Oxygen Reduction Activity of Bimetallic Sn–Pt Electrocatalysts on Carbon: Effect of the Microstructure and the Exclusive Formation of the Pt3Sn Alloy. React. Kinet. Mech. Catal. 2017, 121, 43–67. [Google Scholar] [CrossRef] [Green Version]
- Uemura, Y.; Inada, Y.; Bando, K.K.; Sasaki, T.; Kamiuchi, N.; Eguchi, K.; Yagishita, A.; Nomura, M.; Tada, M.; Iwasawa, Y. Core-Shell Phase Separation and Structural Transformation of Pt3Sn Alloy Nanoparticles Supported on γ-Al2O3 in the Reduction and Oxidation Processes Characterized by in Situ Time-Resolved XAFS. J. Phys. Chem. C 2011, 115, 5823–5833. [Google Scholar] [CrossRef]
- Michalak, W.D.; Krier, J.M.; Alayoglu, S.; Shin, J.Y.; An, K.; Komvopoulos, K.; Liu, Z.; Somorjai, G.A. CO Oxidation on PtSn Nanoparticle Catalysts Occurs at the Interface of Pt and Sn Oxide Domains Formed under Reaction Conditions. J. Catal. 2014, 312, 17–25. [Google Scholar] [CrossRef]
- Cui, S.; Lynn, M.; Napolitano, R.E. Experimental Investigation and Thermodynamic Modeling of the Binary Pt–Sn System. J. Alloys Compd. 2021, 854, 157064. [Google Scholar] [CrossRef]
- Batzill, M.; Diebold, U. The Surface and Materials Science of Tin Oxide. Prog. Surf. Sci. 2005, 79, 47–154. [Google Scholar] [CrossRef]
- Kim, J.S.; Seol, D.; Lee, B.J. Critical Assessment of Pt Surface Energy—An Atomistic Study. Surf. Sci. 2018, 670, 8–12. [Google Scholar] [CrossRef]
- Wang, J.; Chang, X.; Chen, S.; Sun, G.; Zhou, X.; Vovk, E.; Yang, Y.; Deng, W.; Zhao, Z.J.; Mu, R.; et al. On the Role of Sn Segregation of Pt-Sn Catalysts for Propane Dehydrogenation. ACS Catal. 2021, 11, 4401–4410. [Google Scholar] [CrossRef]
- Subramanian, N.P.; Kumaraguru, S.P.; Colon-Mercado, H.; Kim, H.; Popov, B.N.; Black, T.; Chen, D.A. Studies on Co-Based Catalysts Supported on Modified Carbon Substrates for PEMFC Cathodes. J. Power Sources 2006, 157, 56–63. [Google Scholar] [CrossRef]
- Wang, H.; Côté, R.; Faubert, G.; Guay, D.; Dodelet, J.P. Effect of the Pretreatment of Carbon Black Supports on the Activity of Fe-based Electrocatalysts for the Reduction of Oxygen. J. Phys. Chem. B 1999, 103, 2042–2049. [Google Scholar] [CrossRef]
- Ke, K.; Waki, K. Fabrication and Characterization of Multiwalled Carbon Nanotubes-Supported Pt∕SnOx Nanocomposites as Catalysts for Electro-Oxidation of Methanol. J. Electrochem. Soc. 2007, 154, A207. [Google Scholar] [CrossRef]
- Ayyubov, I.; Borbáth, I.; Pászti, Z.; Sebestyén, Z.; Mihály, J.; Szabó, T.; Illés, E.; Domján, A.; Florea, M.; Radu, D.; et al. Synthesis and Characterization of Graphite Oxide Derived TiO2-Carbon Composites as Potential Electrocatalyst Supports. Top. Catal. 2021. [Google Scholar] [CrossRef]
- Haner, A.N.; Ross, P.N. Electrochemical Oxidation of Methanol on Tin-Modified Platinum Single-Crystal Surfaces. J. Phys. Chem. 1991, 95, 3740–3746. [Google Scholar] [CrossRef] [Green Version]
- Hayden, B.E.; Rendall, M.E.; South, O. Electro-Oxidation of Carbon Monoxide on Well-Ordered Pt(111)/Sn Surface Alloys. J. Am. Chem. Soc. 2003, 125, 7738–7742. [Google Scholar] [CrossRef] [PubMed]
- Li, Y.; Liu, C.; Liu, Y.; Feng, B.; Li, L.; Pan, H.; Kellogg, W.; Higgins, D.; Wu, G. Sn-Doped TiO2 Modified Carbon to Support Pt Anode Catalysts for Direct Methanol Fuel Cells. J. Power Sources 2015, 286, 354–361. [Google Scholar] [CrossRef]
- Hsieh, C.T.; Liu, Y.Y.; Chen, W.Y.; Hsieh, Y.H. Electrochemical Activity and Durability of Pt-Sn Alloys on Carbon-Based Electrodes Prepared by Microwave-Assisted Synthesis. Int. J. Hydrogen Energy 2011, 36, 15766–15774. [Google Scholar] [CrossRef]
- Somacescu, S.; Osiceanu, P.; Calderon Moreno, J.M.; Culita, D.C.; Neațu, F.; Trandafir, M.M.; Neațu, Ș.; Kuncser, A.; Szijjártó, G.P.; Tálas, E.; et al. Design of Electrocatalysts with Reduced Pt Content Supported on Mesoporous NiWO4 and NiWO4-Graphene Nanoplatelets Composite for Oxygen Reduction and Hydrogen Oxidation in Acidic Medium. Int. J. Hydrogen Energy 2023, 48, 6317–6335. [Google Scholar] [CrossRef]
- Luo, F.; Liao, S.; Dang, D.; Zheng, Y.; Xu, D.; Nan, H.; Shu, T.; Fu, Z. Tin and Silicon Binary Oxide on the Carbon Support of a Pt Electrocatalyst with Enhanced Activity and Durability. ACS Catal. 2015, 5, 2242–2249. [Google Scholar] [CrossRef]
- Schulenburg, H.; Durst, J.; Müller, E.; Wokaun, A.; Scherer, G.G. Real Surface Area Measurements of Pt3Co/C Catalysts. J. Electroanal. Chem. 2010, 642, 52–60. [Google Scholar] [CrossRef]
- Mayrhofer, K.J.J.; Strmcnik, D.; Blizanac, B.B.; Stamenkovic, V.; Arenz, M.; Markovic, N.M. Measurement of Oxygen Reduction Activities via the Rotating Disc Electrode Method: From Pt Model Surfaces to Carbon-Supported High Surface Area Catalysts. Electrochim. Acta 2008, 53, 3181–3188. [Google Scholar] [CrossRef]
- Liu, P.; Logadottir, A.; Nørskov, J.K. Modeling the Electro-Oxidation of CO and H2/CO on Pt, Ru, PtRu and Pt3Sn. Electrochim. Acta 2003, 48, 3731–3742. [Google Scholar] [CrossRef]
- Koper, M.T.M. Electrocatalysis on Bimetallic and Alloy Surfaces. Surf. Sci. 2004, 548, 1–3. [Google Scholar] [CrossRef]
- Jiang, L.; Colmenares, L.; Jusys, Z.; Sun, G.Q.; Behm, R.J. Ethanol Electrooxidation on Novel Carbon Supported Pt/SnOx/C Catalysts with Varied Pt:Sn Ratio. Electrochim. Acta 2007, 53, 377–389. [Google Scholar] [CrossRef]
- Manzo-Robledo, A.; Boucher, A.-C.; Pastor, E.; Alonso-Vante, N. Electro-Oxidation of Carbon Monoxide and Methanol on Carbon-Supported Pt–Sn Nanoparticles: A DEMS Study. Fuel Cells 2002, 2, 109–116. [Google Scholar] [CrossRef]
- Maillard, F.; Schreier, S.; Hanzlik, M.; Savinova, E.R.; Weinkauf, S.; Stimming, U. Influence of Particle Agglomeration on the Catalytic Activity of Carbon-Supported Pt Nanoparticles in CO Monolayer Oxidation. Phys. Chem. Chem. Phys. 2005, 7, 375–383. [Google Scholar] [CrossRef]


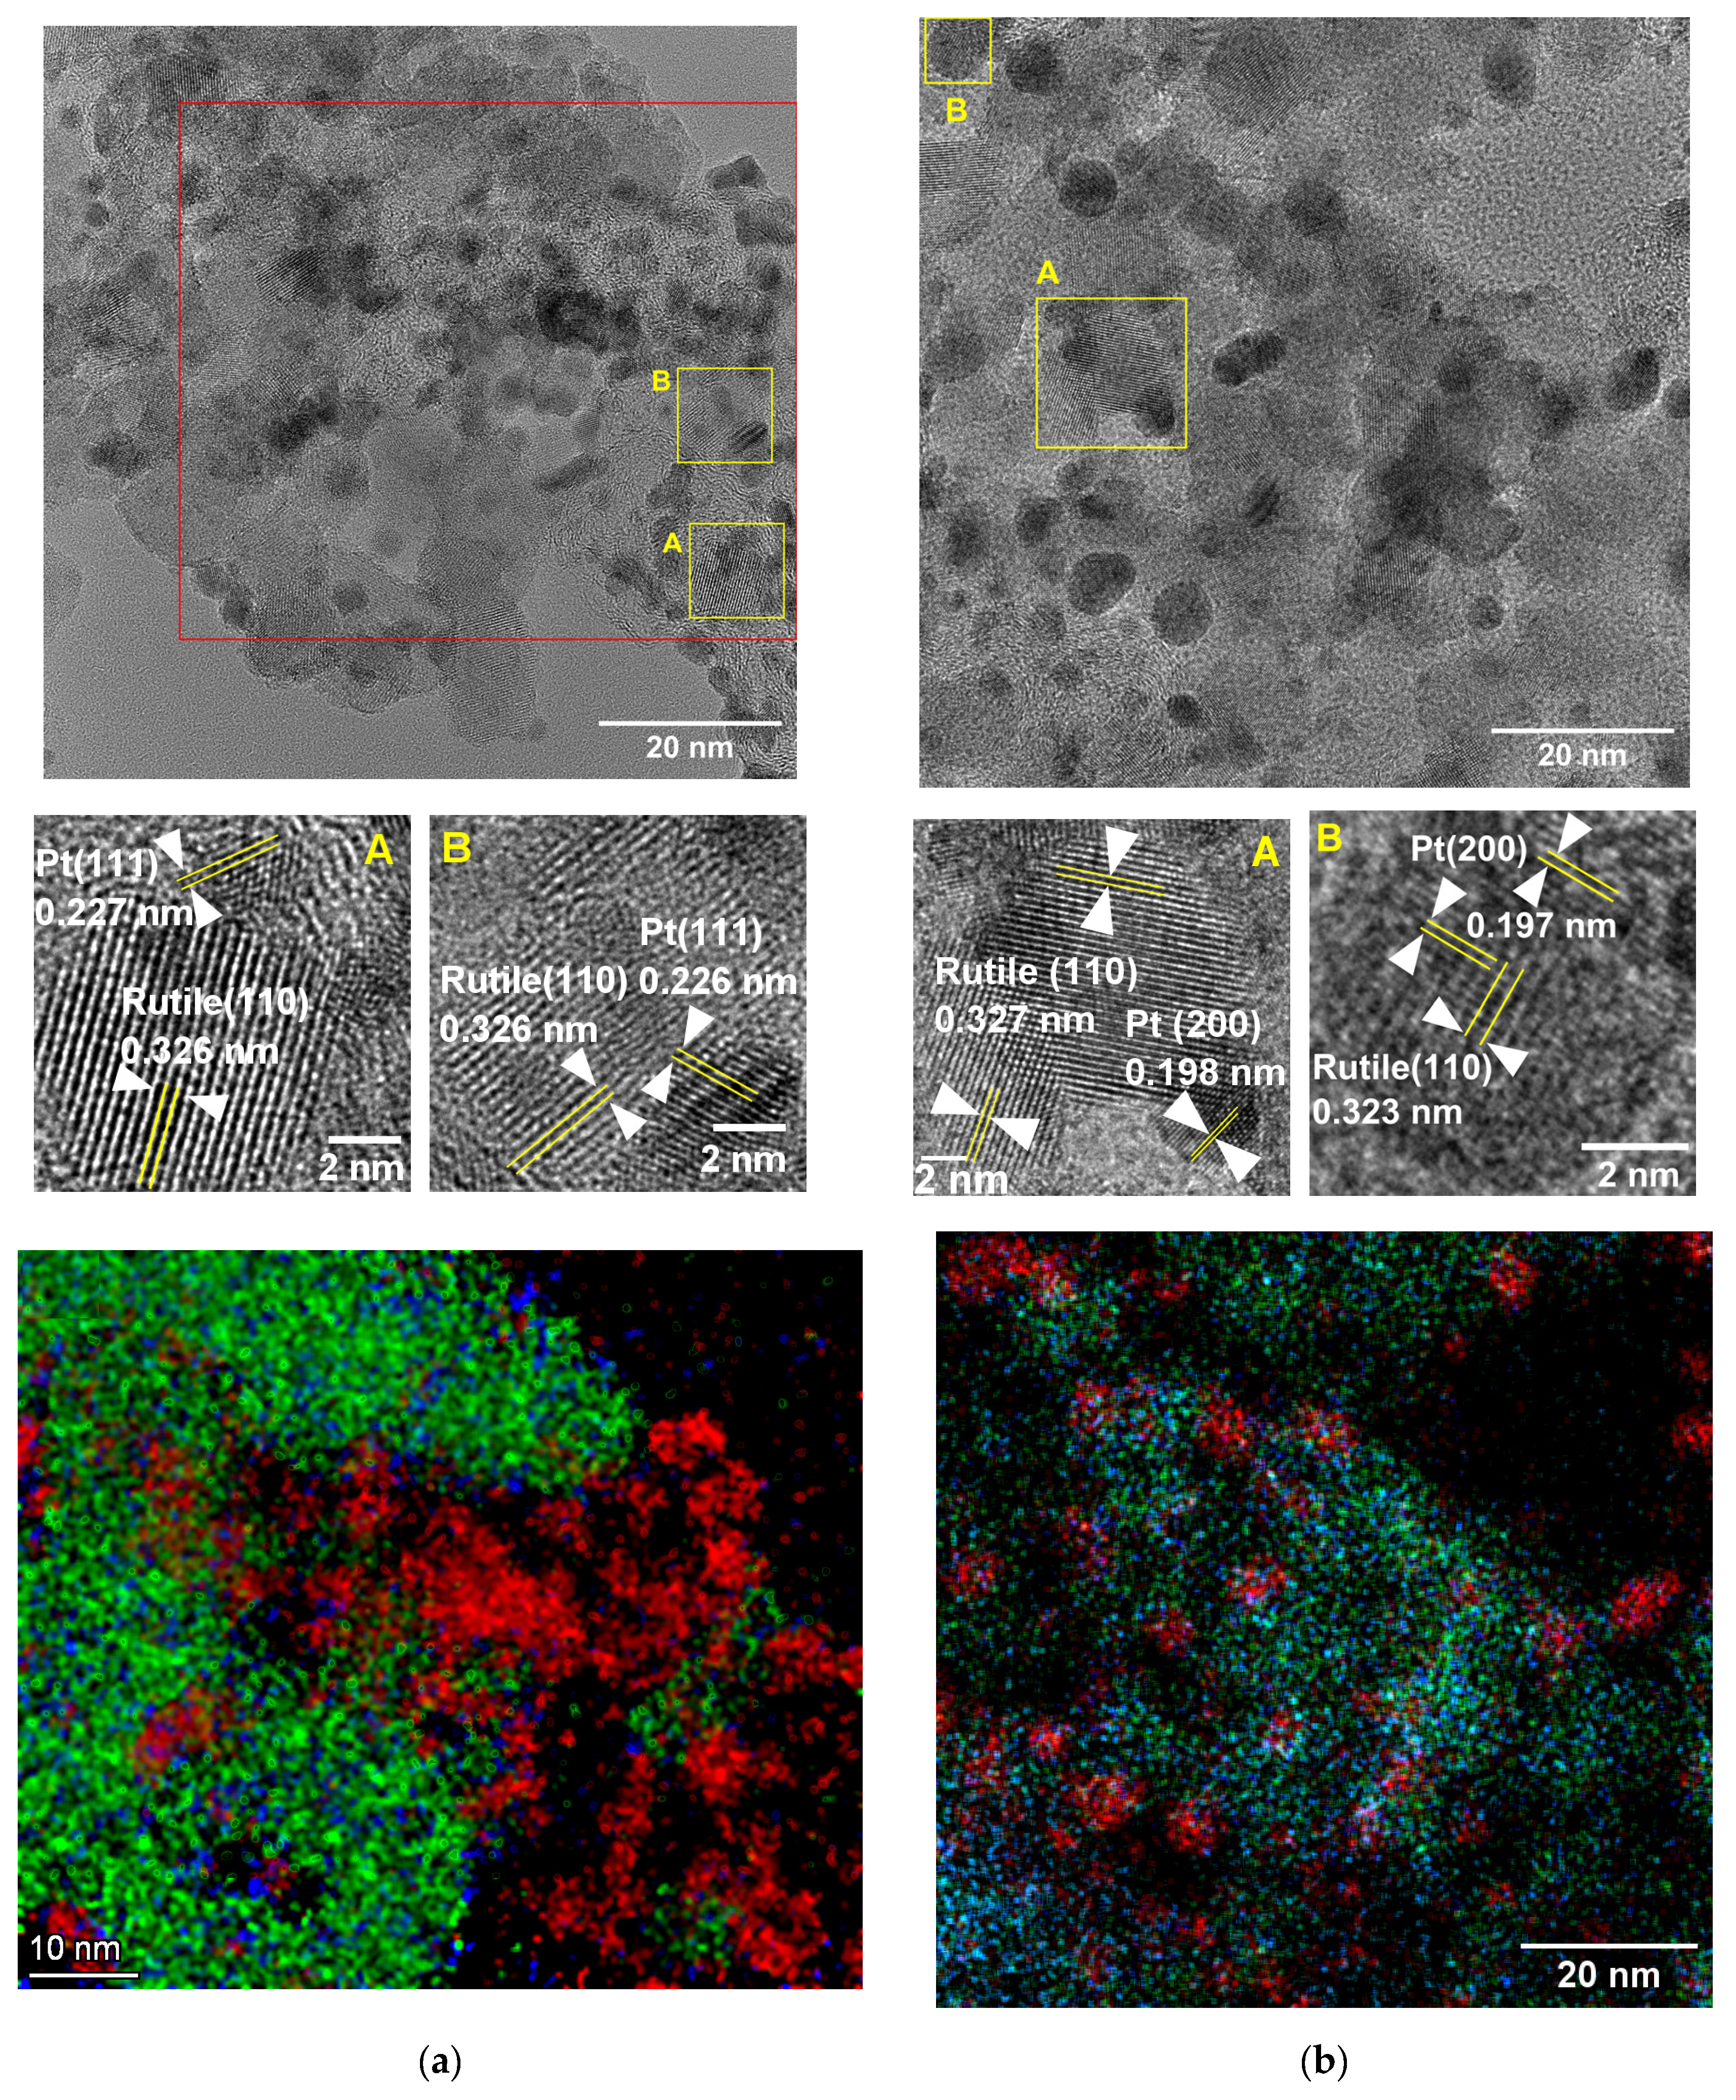
 ): Sn4+ and (
 ): metallic or quasi-metallic Sn contribution.
): Sn4+ and (): metallic or quasi-metallic Sn contribution.
): metallic or quasi-metallic Sn contribution.
): Sn4+ and (): metallic or quasi-metallic Sn contribution.

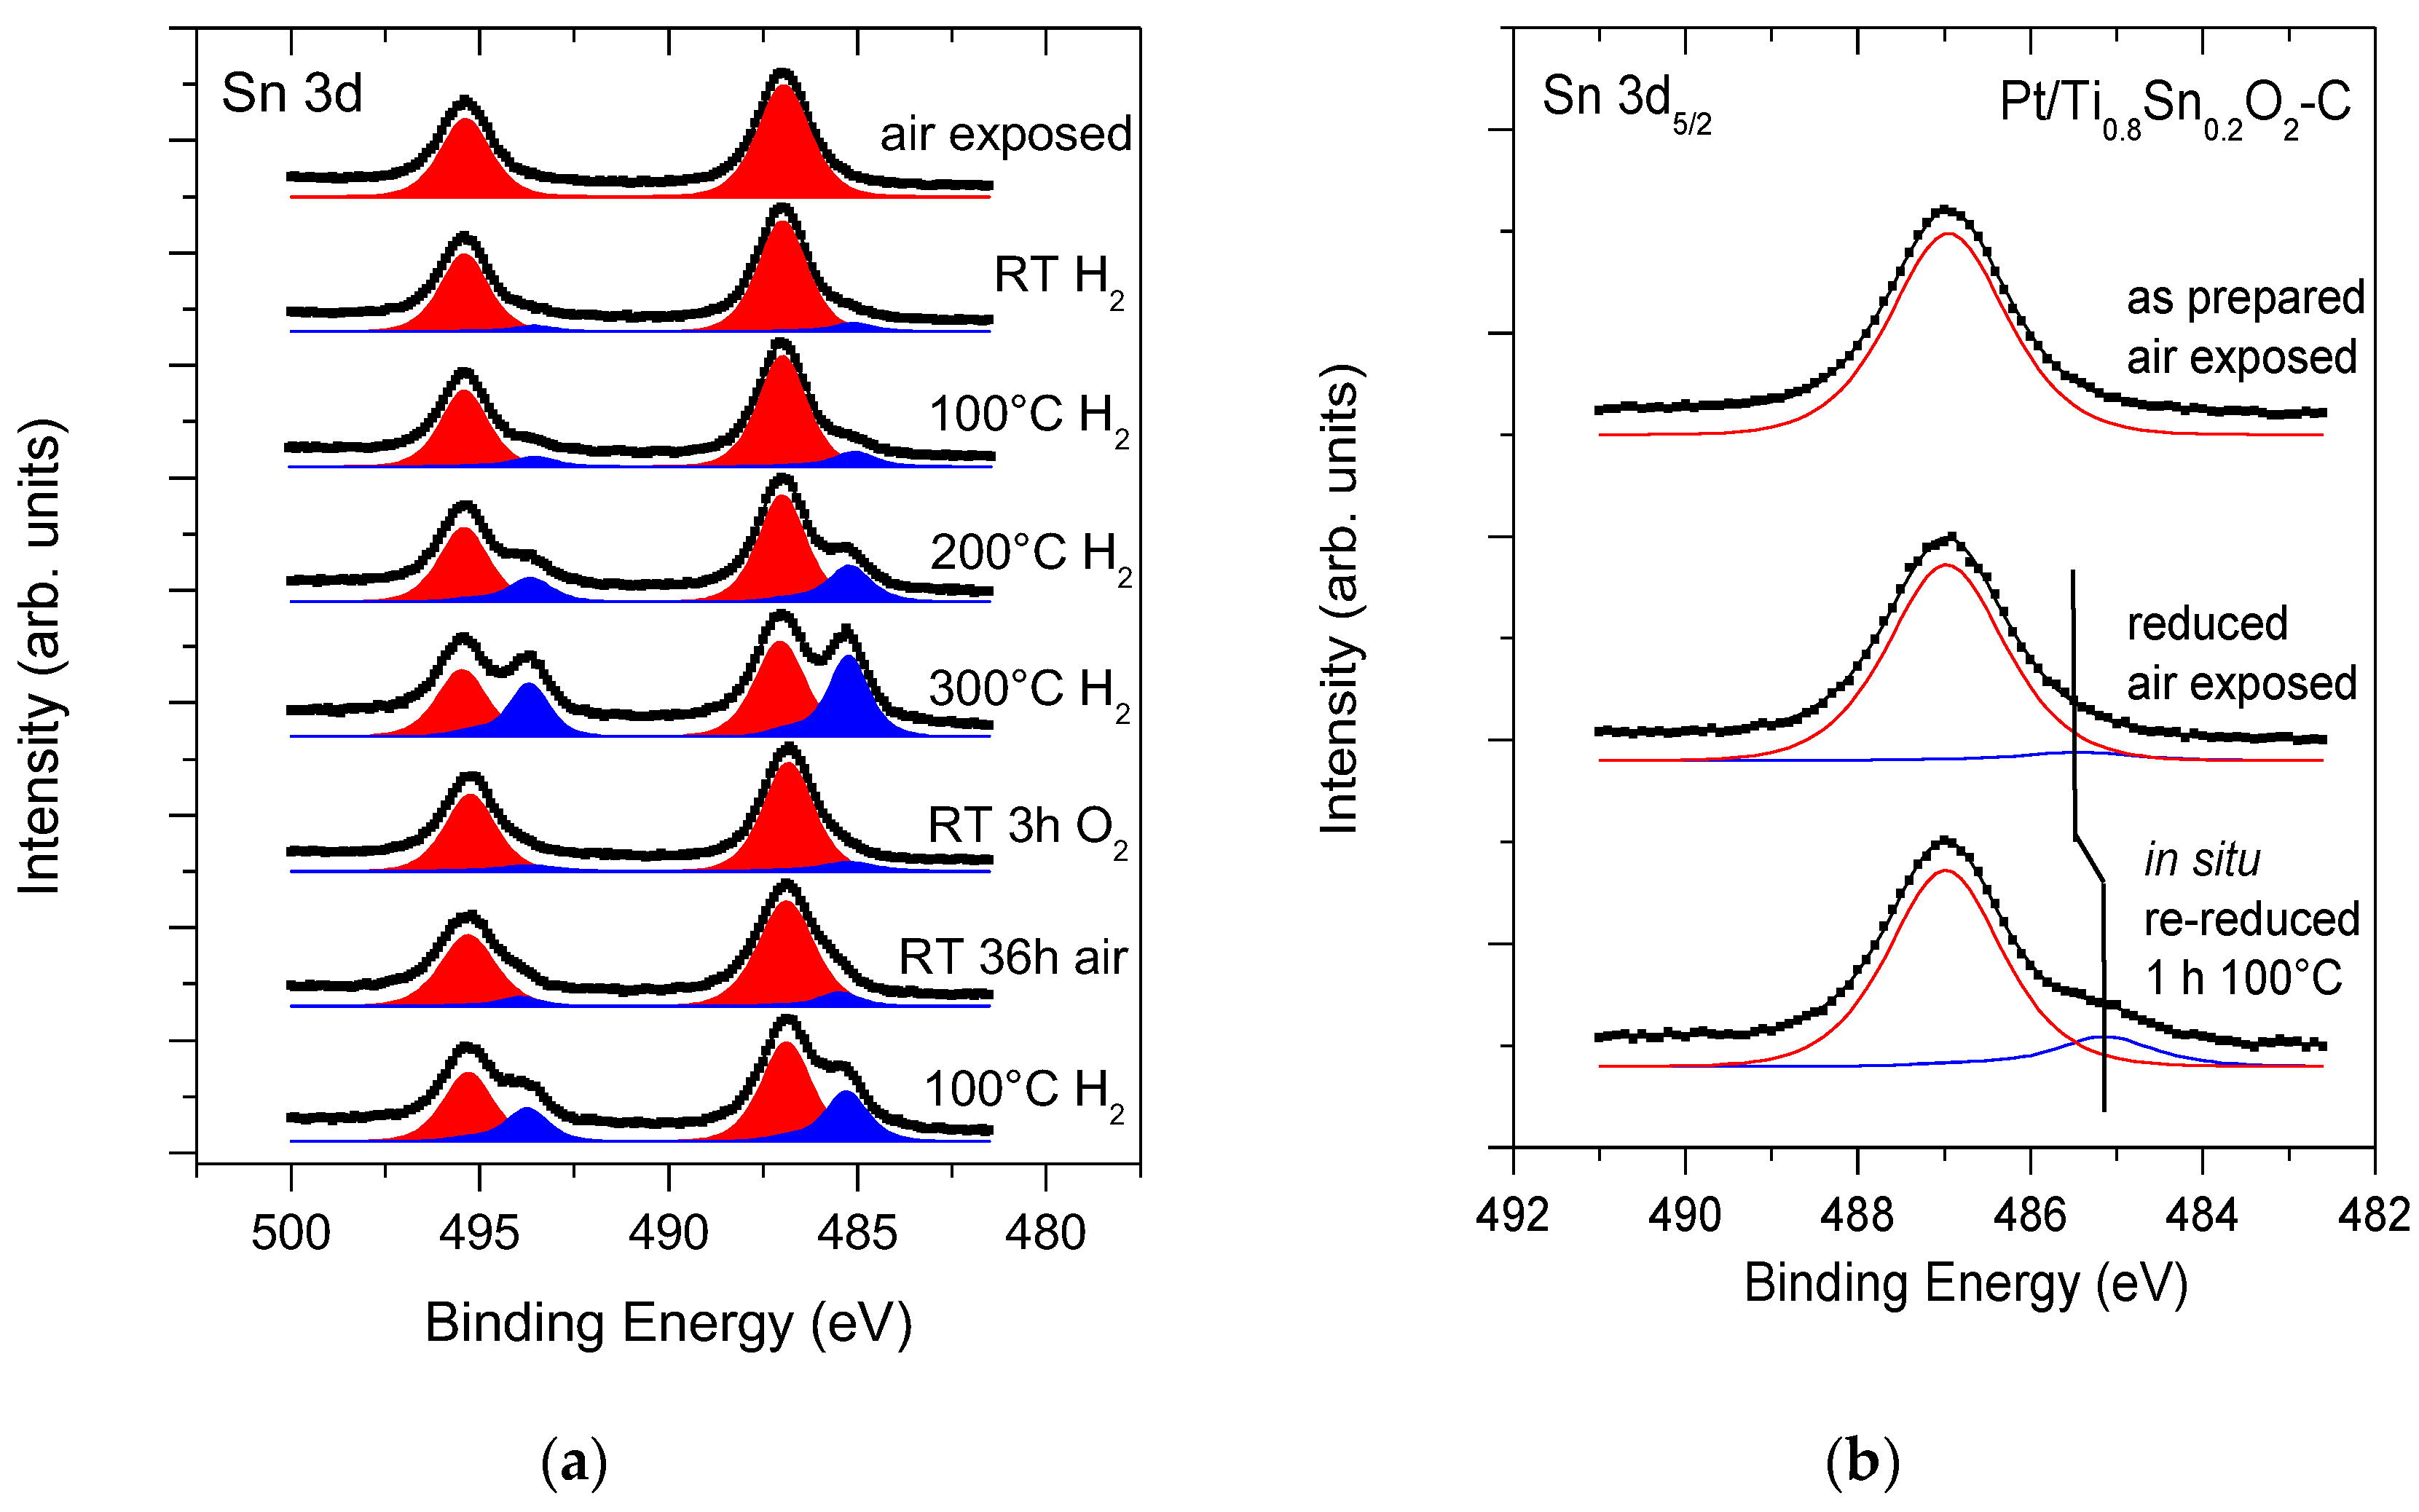
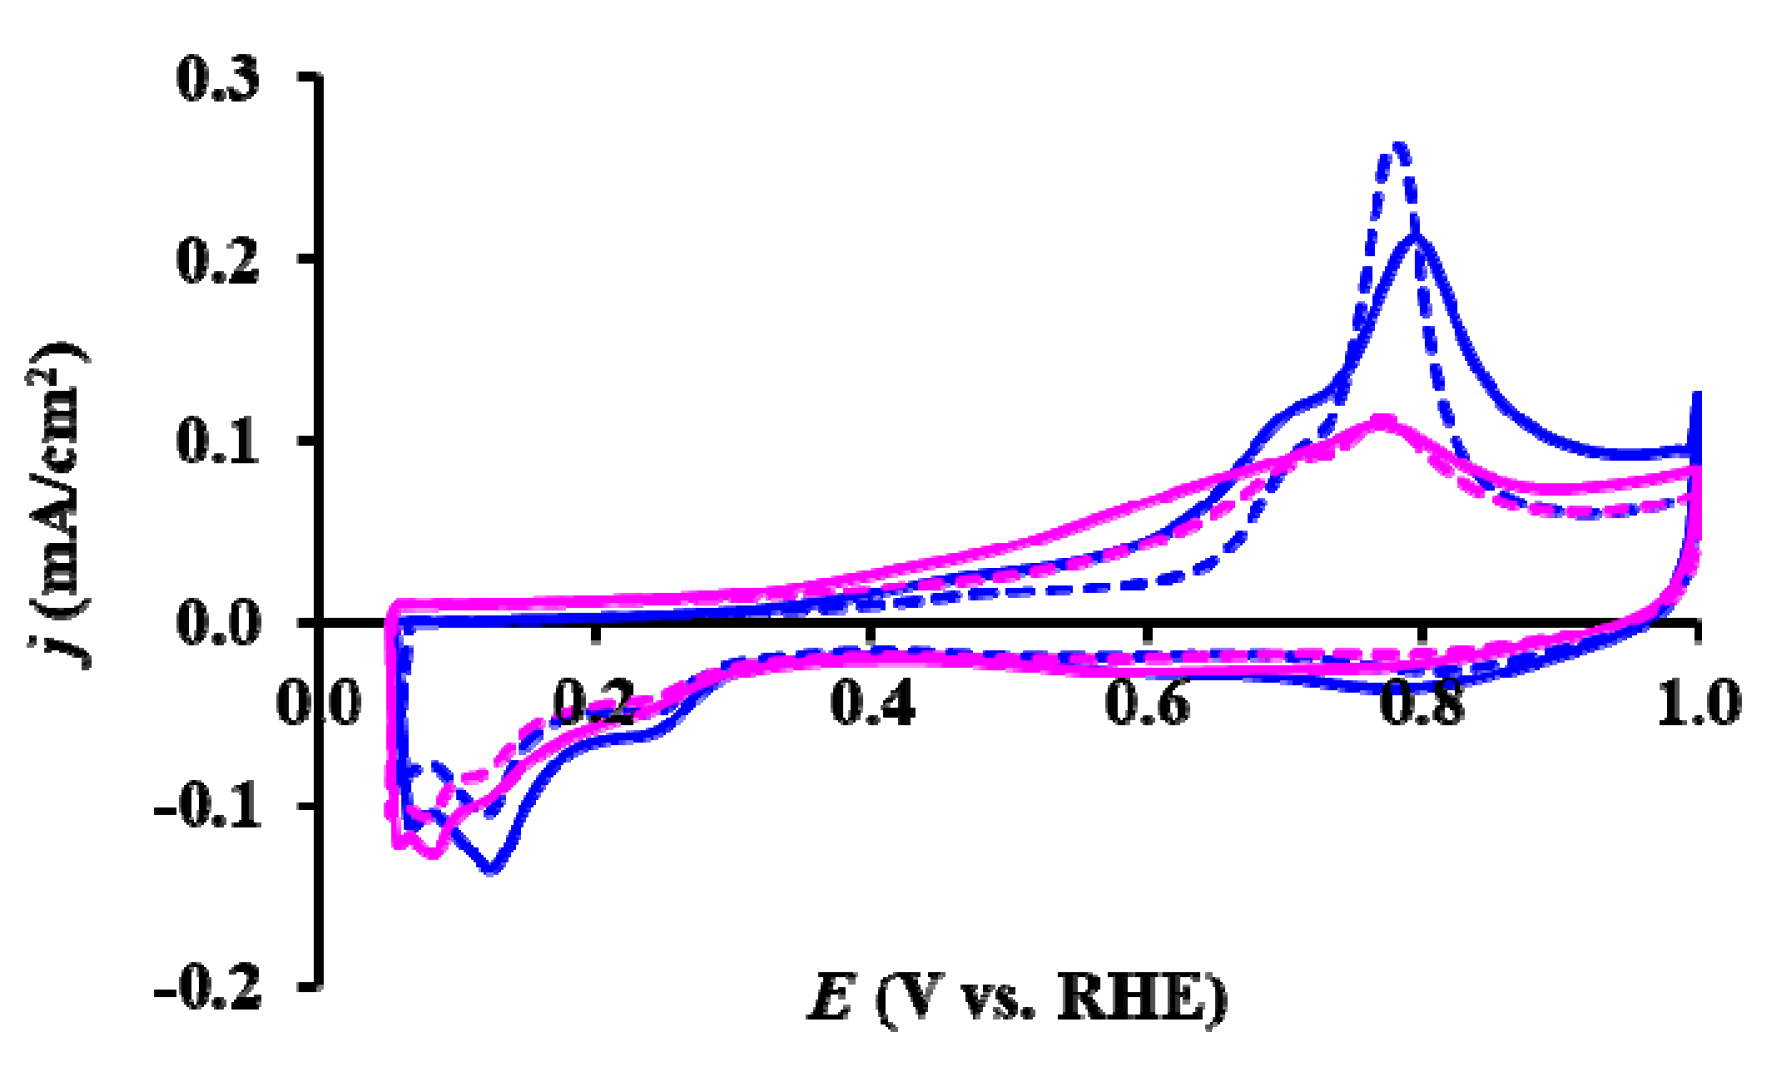
 ), reduced catalyst: (
 ).
), reduced catalyst: ().
).
), reduced catalyst: ().
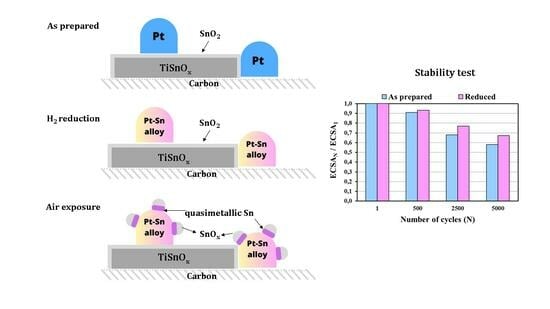
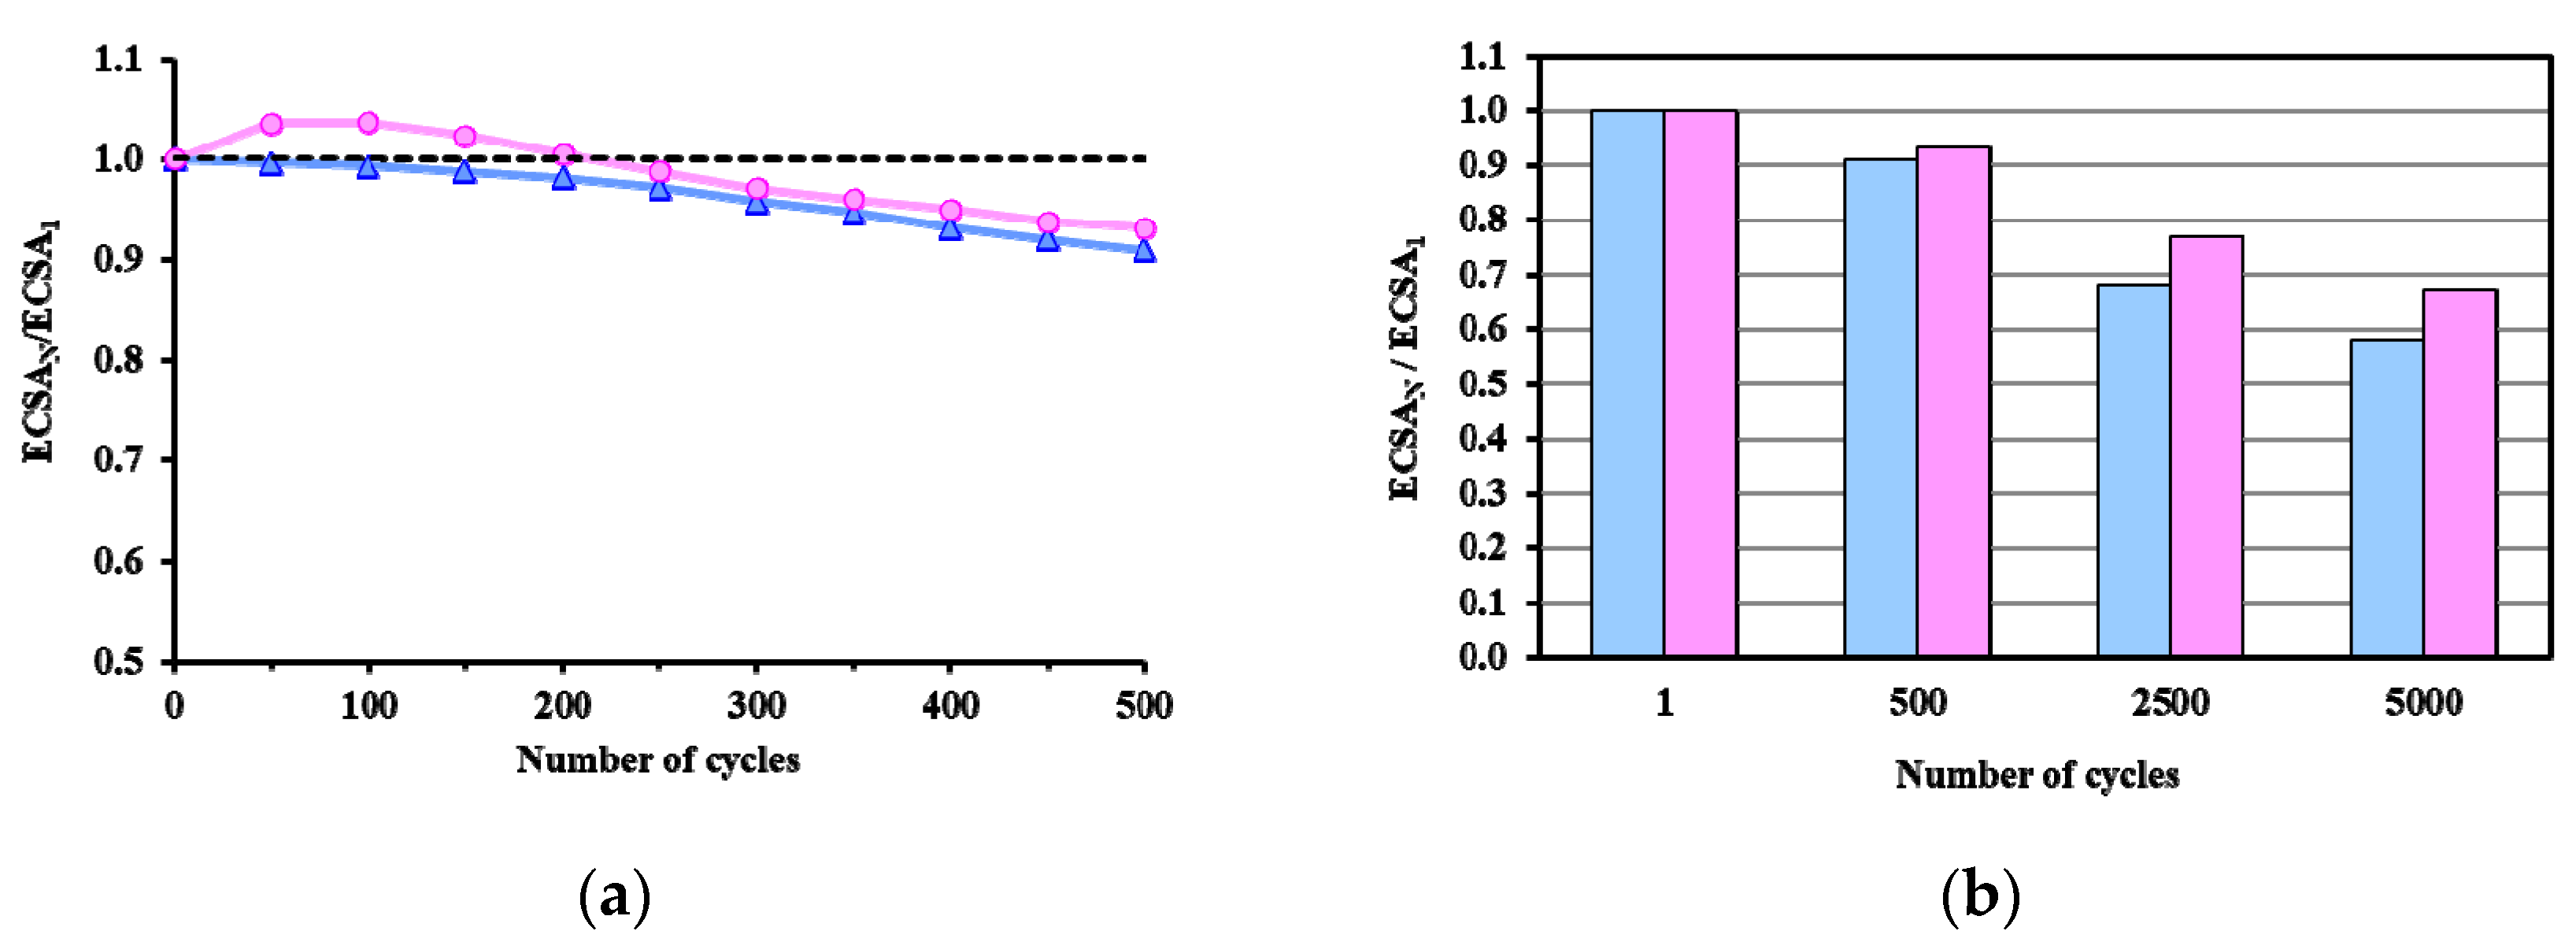
 ) and reduced (
 ) Pt/Ti0.8Sn0.2O2-C electrocatalysts. ECSAN/ECSA1: comparison of the ECSA measured after N cycles normalized to the ECSA measured in the first cycle of both the as prepared and H2-reduced catalyst as a function of the number of cycles (N).
) and reduced () Pt/Ti0.8Sn0.2O2-C electrocatalysts. ECSAN/ECSA1: comparison of the ECSA measured after N cycles normalized to the ECSA measured in the first cycle of both the as prepared and H2-reduced catalyst as a function of the number of cycles (N).
) Pt/Ti0.8Sn0.2O2-C electrocatalysts. ECSAN/ECSA1: comparison of the ECSA measured after N cycles normalized to the ECSA measured in the first cycle of both the as prepared and H2-reduced catalyst as a function of the number of cycles (N).
) and reduced () Pt/Ti0.8Sn0.2O2-C electrocatalysts. ECSAN/ECSA1: comparison of the ECSA measured after N cycles normalized to the ECSA measured in the first cycle of both the as prepared and H2-reduced catalyst as a function of the number of cycles (N).
 ), reduced catalyst: (
 ).
), reduced catalyst: ().
).
), reduced catalyst: ().

| Sample ID | Crystallite Sizes (nm) a | Lattice Parameters, Å b | Sn Substitution, % c | |
|---|---|---|---|---|
| Rutile | Pt | |||
| Ti0.8Sn0.2O2-C composite | 12 | n/a | a = 4.61, c = 2.98 | ~10 |
| Pt/Ti0.8Sn0.2O2-C as prepared | 10 | 3.3 | a = 4.61, c = 2.98 | ~10 |
| Pt/Ti0.8Sn0.2O2-C reduced | 8–9 | 4.1 | a = 4.62, c = 2.99 | ~10–20 |
| Core Level | As Prepared | Reduced | Assignment |
|---|---|---|---|
| Binding Energy (eV) a | |||
| Pt 4f7/2 | 71.3 (93%) | 71.3 (89%) | metallic Pt [69] |
| 72.6 (4%) | 72.6 (9%) | Pt2+: PtO, Pt(OH)2 [70] | |
| 75.1 (3%) | 75.1 (2%) | Pt4+: PtO2 [70] | |
| Sn 3d5/2 | 487.0 (100%) | 485.4 (5%) | (quasi)metallic Sn |
| 486.9 (96%) | Sn4+: SnO2 [69] | ||
| Ti 2p3/2 | 459.1 | 459.0 | Ti4+: TiO2 [69] |
| Sample ID | ECO,onset, a mV | ECO,max, b mV | ECSA1, c m2/gPt | ΔECSA500, % d | ΔECSA5000, % d |
|---|---|---|---|---|---|
| As Prepared Pt/Ti0.8Sn0.2O2-C | ~200 | 795 (sh: 695) | 53.2 | 9.1 | 41.9 |
| 775 (sh: 695) * | |||||
| Reduced Pt/Ti0.8Sn0.2O2-C | ~200 | 765 (sh: 695) | 39.7 | 6.8 | 32.9 |
| 765 (sh: 695) * |
Disclaimer/Publisher’s Note: The statements, opinions and data contained in all publications are solely those of the individual author(s) and contributor(s) and not of MDPI and/or the editor(s). MDPI and/or the editor(s) disclaim responsibility for any injury to people or property resulting from any ideas, methods, instructions or products referred to in the content. |
© 2023 by the authors. Licensee MDPI, Basel, Switzerland. This article is an open access article distributed under the terms and conditions of the Creative Commons Attribution (CC BY) license (https://creativecommons.org/licenses/by/4.0/).
Share and Cite
Silva, C.; Salmanzade, K.; Borbáth, I.; Dódony, E.; Olasz, D.; Sáfrán, G.; Kuncser, A.; Pászti-Gere, E.; Tompos, A.; Pászti, Z. Reductive Treatment of Pt Supported on Ti0.8Sn0.2O2-C Composite: A Route for Modulating the Sn–Pt Interactions. Nanomaterials 2023, 13, 2245. https://doi.org/10.3390/nano13152245
Silva C, Salmanzade K, Borbáth I, Dódony E, Olasz D, Sáfrán G, Kuncser A, Pászti-Gere E, Tompos A, Pászti Z. Reductive Treatment of Pt Supported on Ti0.8Sn0.2O2-C Composite: A Route for Modulating the Sn–Pt Interactions. Nanomaterials. 2023; 13(15):2245. https://doi.org/10.3390/nano13152245
Chicago/Turabian StyleSilva, Cristina, Khirdakhanim Salmanzade, Irina Borbáth, Erzsébet Dódony, Dániel Olasz, György Sáfrán, Andrei Kuncser, Erzsébet Pászti-Gere, András Tompos, and Zoltán Pászti. 2023. "Reductive Treatment of Pt Supported on Ti0.8Sn0.2O2-C Composite: A Route for Modulating the Sn–Pt Interactions" Nanomaterials 13, no. 15: 2245. https://doi.org/10.3390/nano13152245