
Thermodynamic and Kinetic Simulations Used for the Study of the Influence of Precipitates on Thermophysical Properties in NiTiCu Alloys Obtained by Spark Plasma Sintering
 , , and
Abstract
:1. Introduction
2. Materials and Methods
2.1. Materials
2.2. Methods
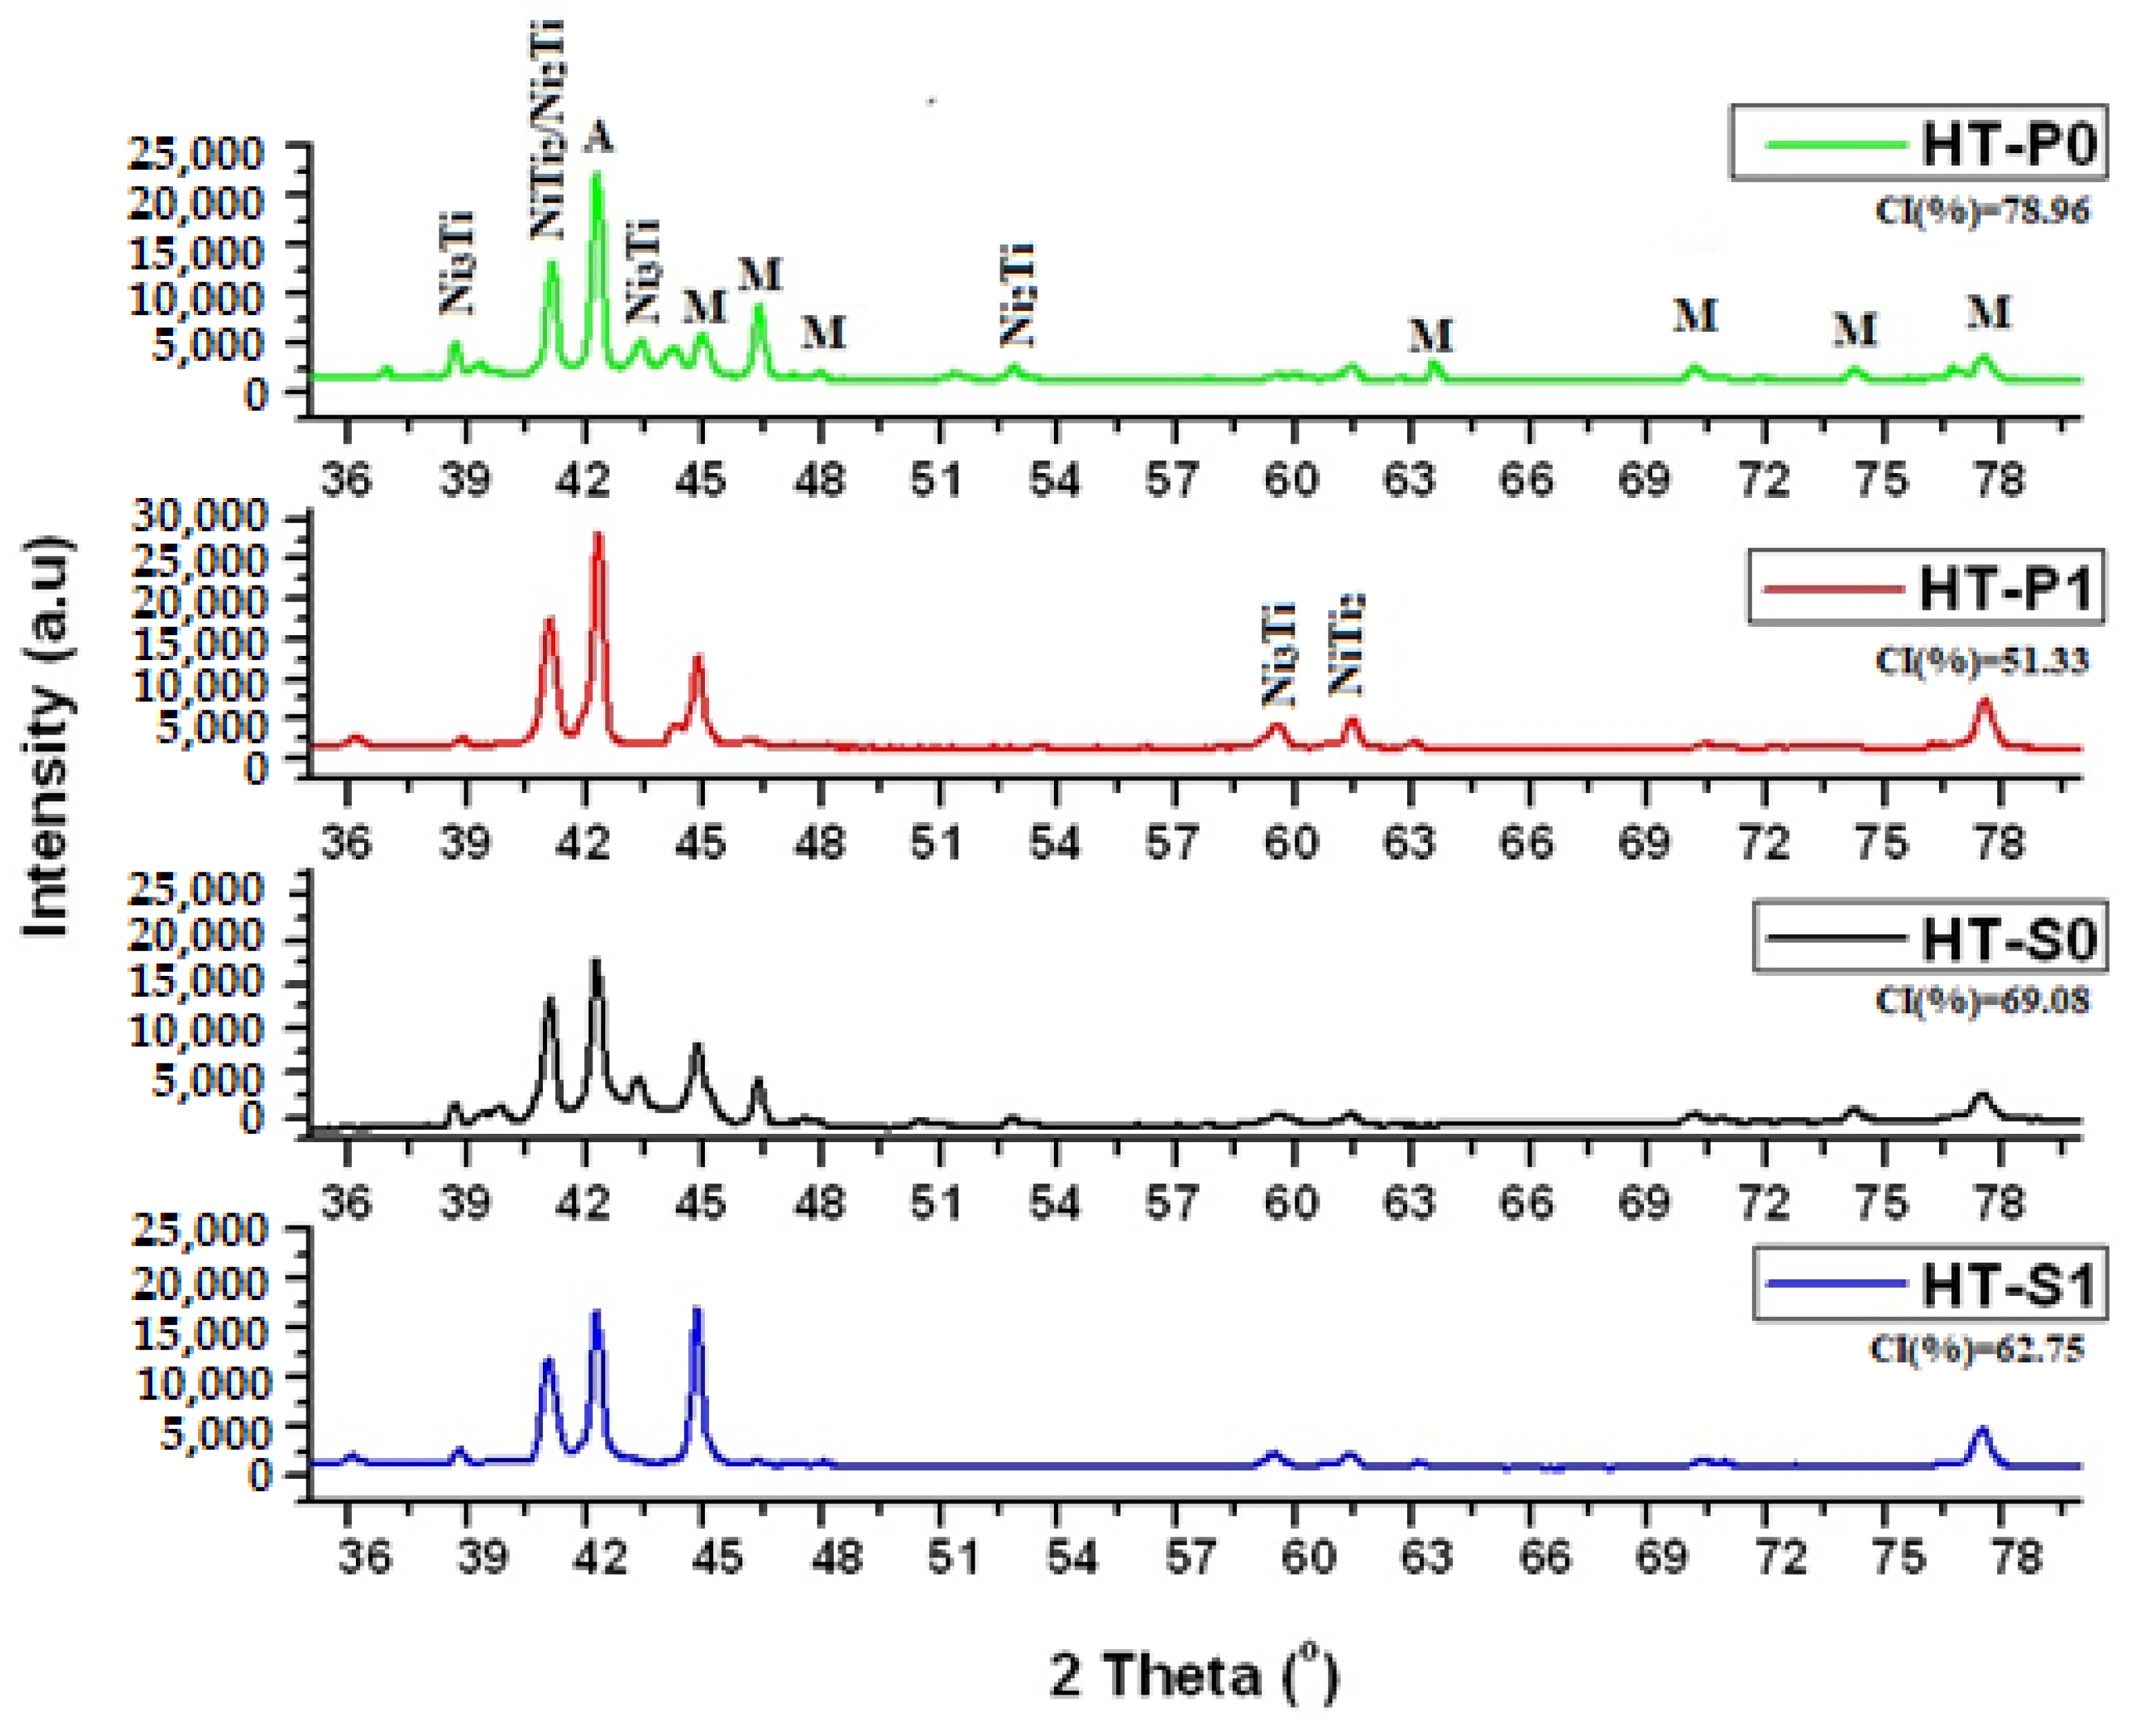
2.2.1. Microstructural Investigation by XRD
2.2.2. Computational Methods
Thermodynamic Model for the Ni-Ti-Cu Based B2 Phase
Thermokinetic Model for the Ni-Ti-Cu System
2.2.3. Thermophysical Investigations
DSC Measurements
LFA Measurements
3. Results
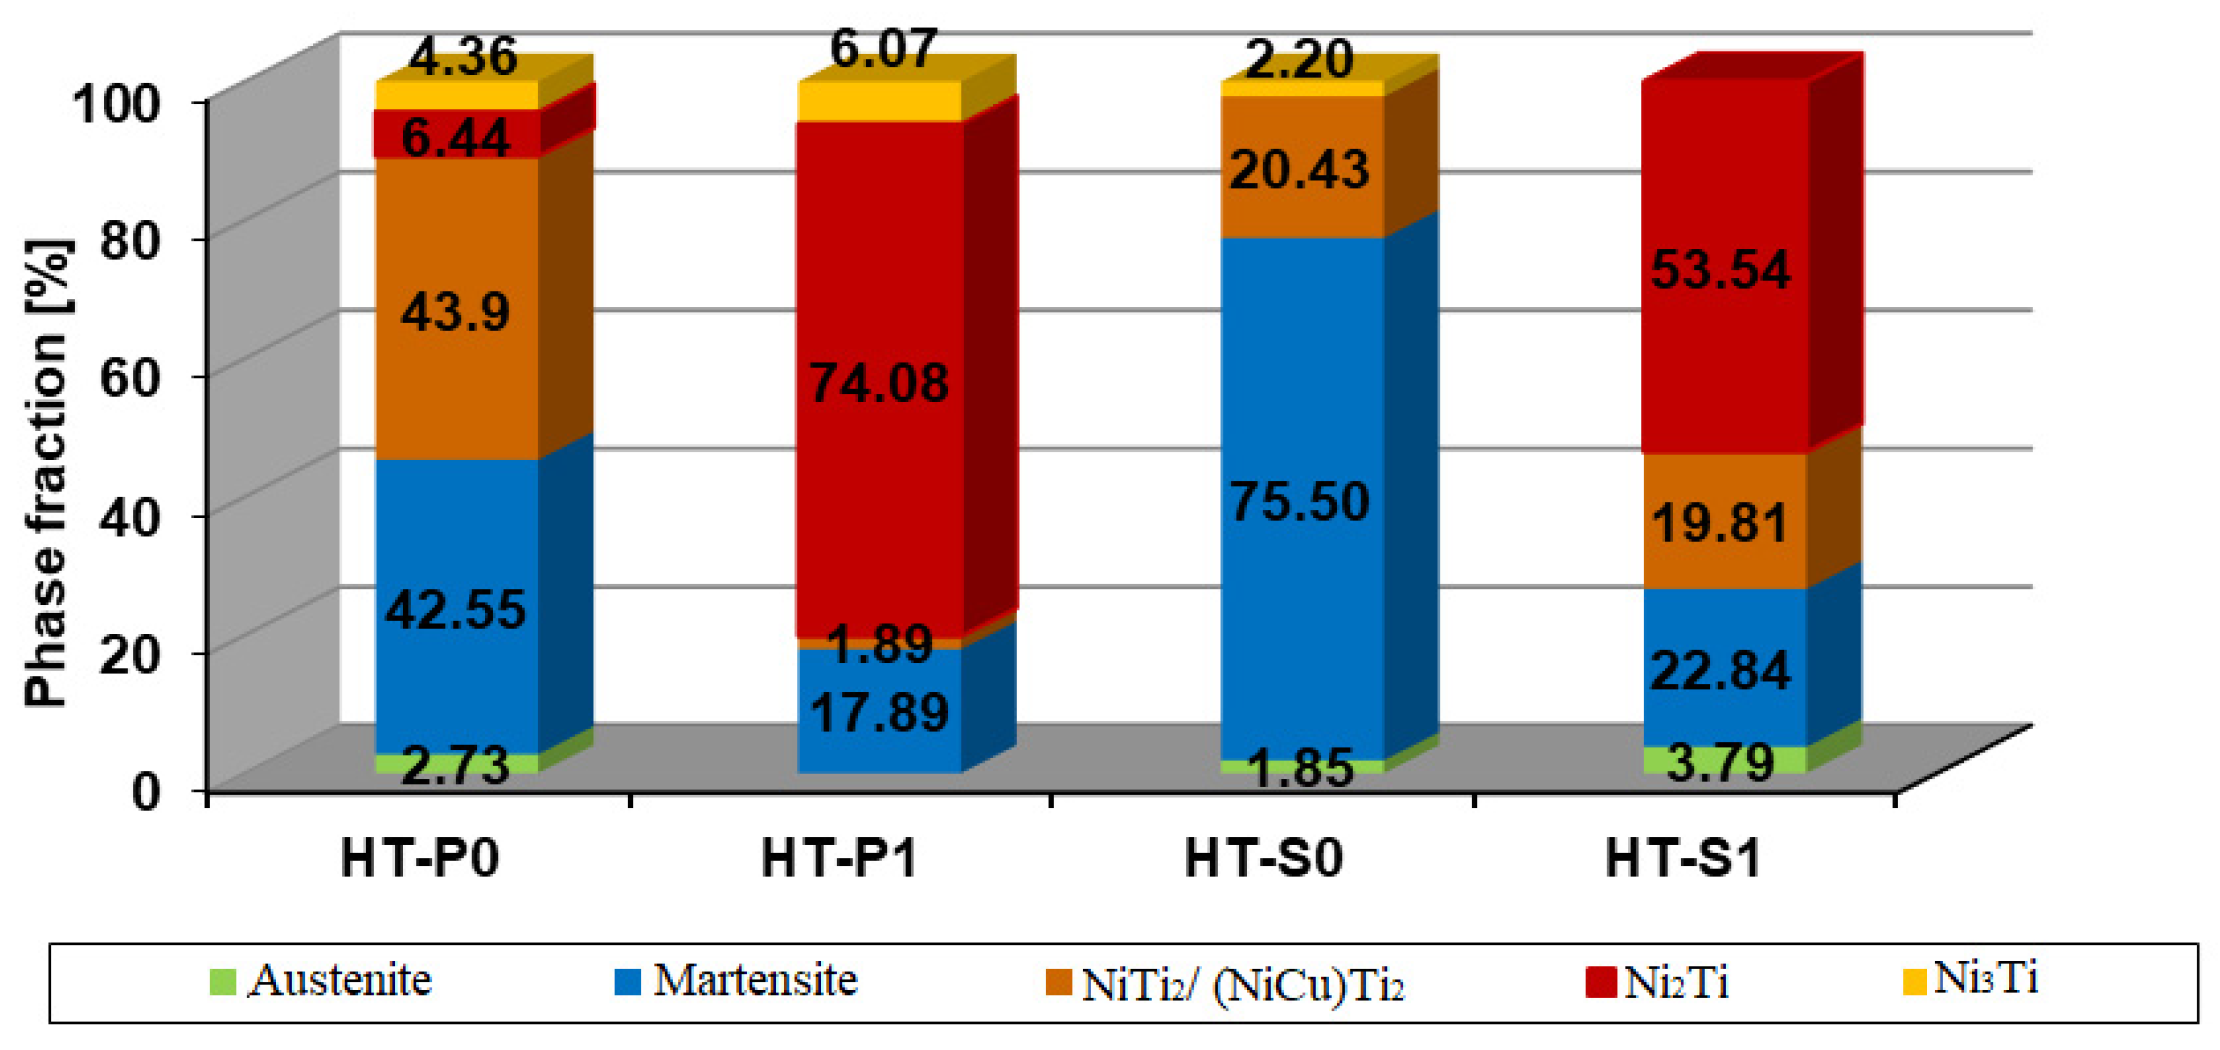
3.1. XRD Investigation of Microstructure and Phase Stabilities
3.2. Thermodynamics and Thermokinetic Analysis Validated by Experiments
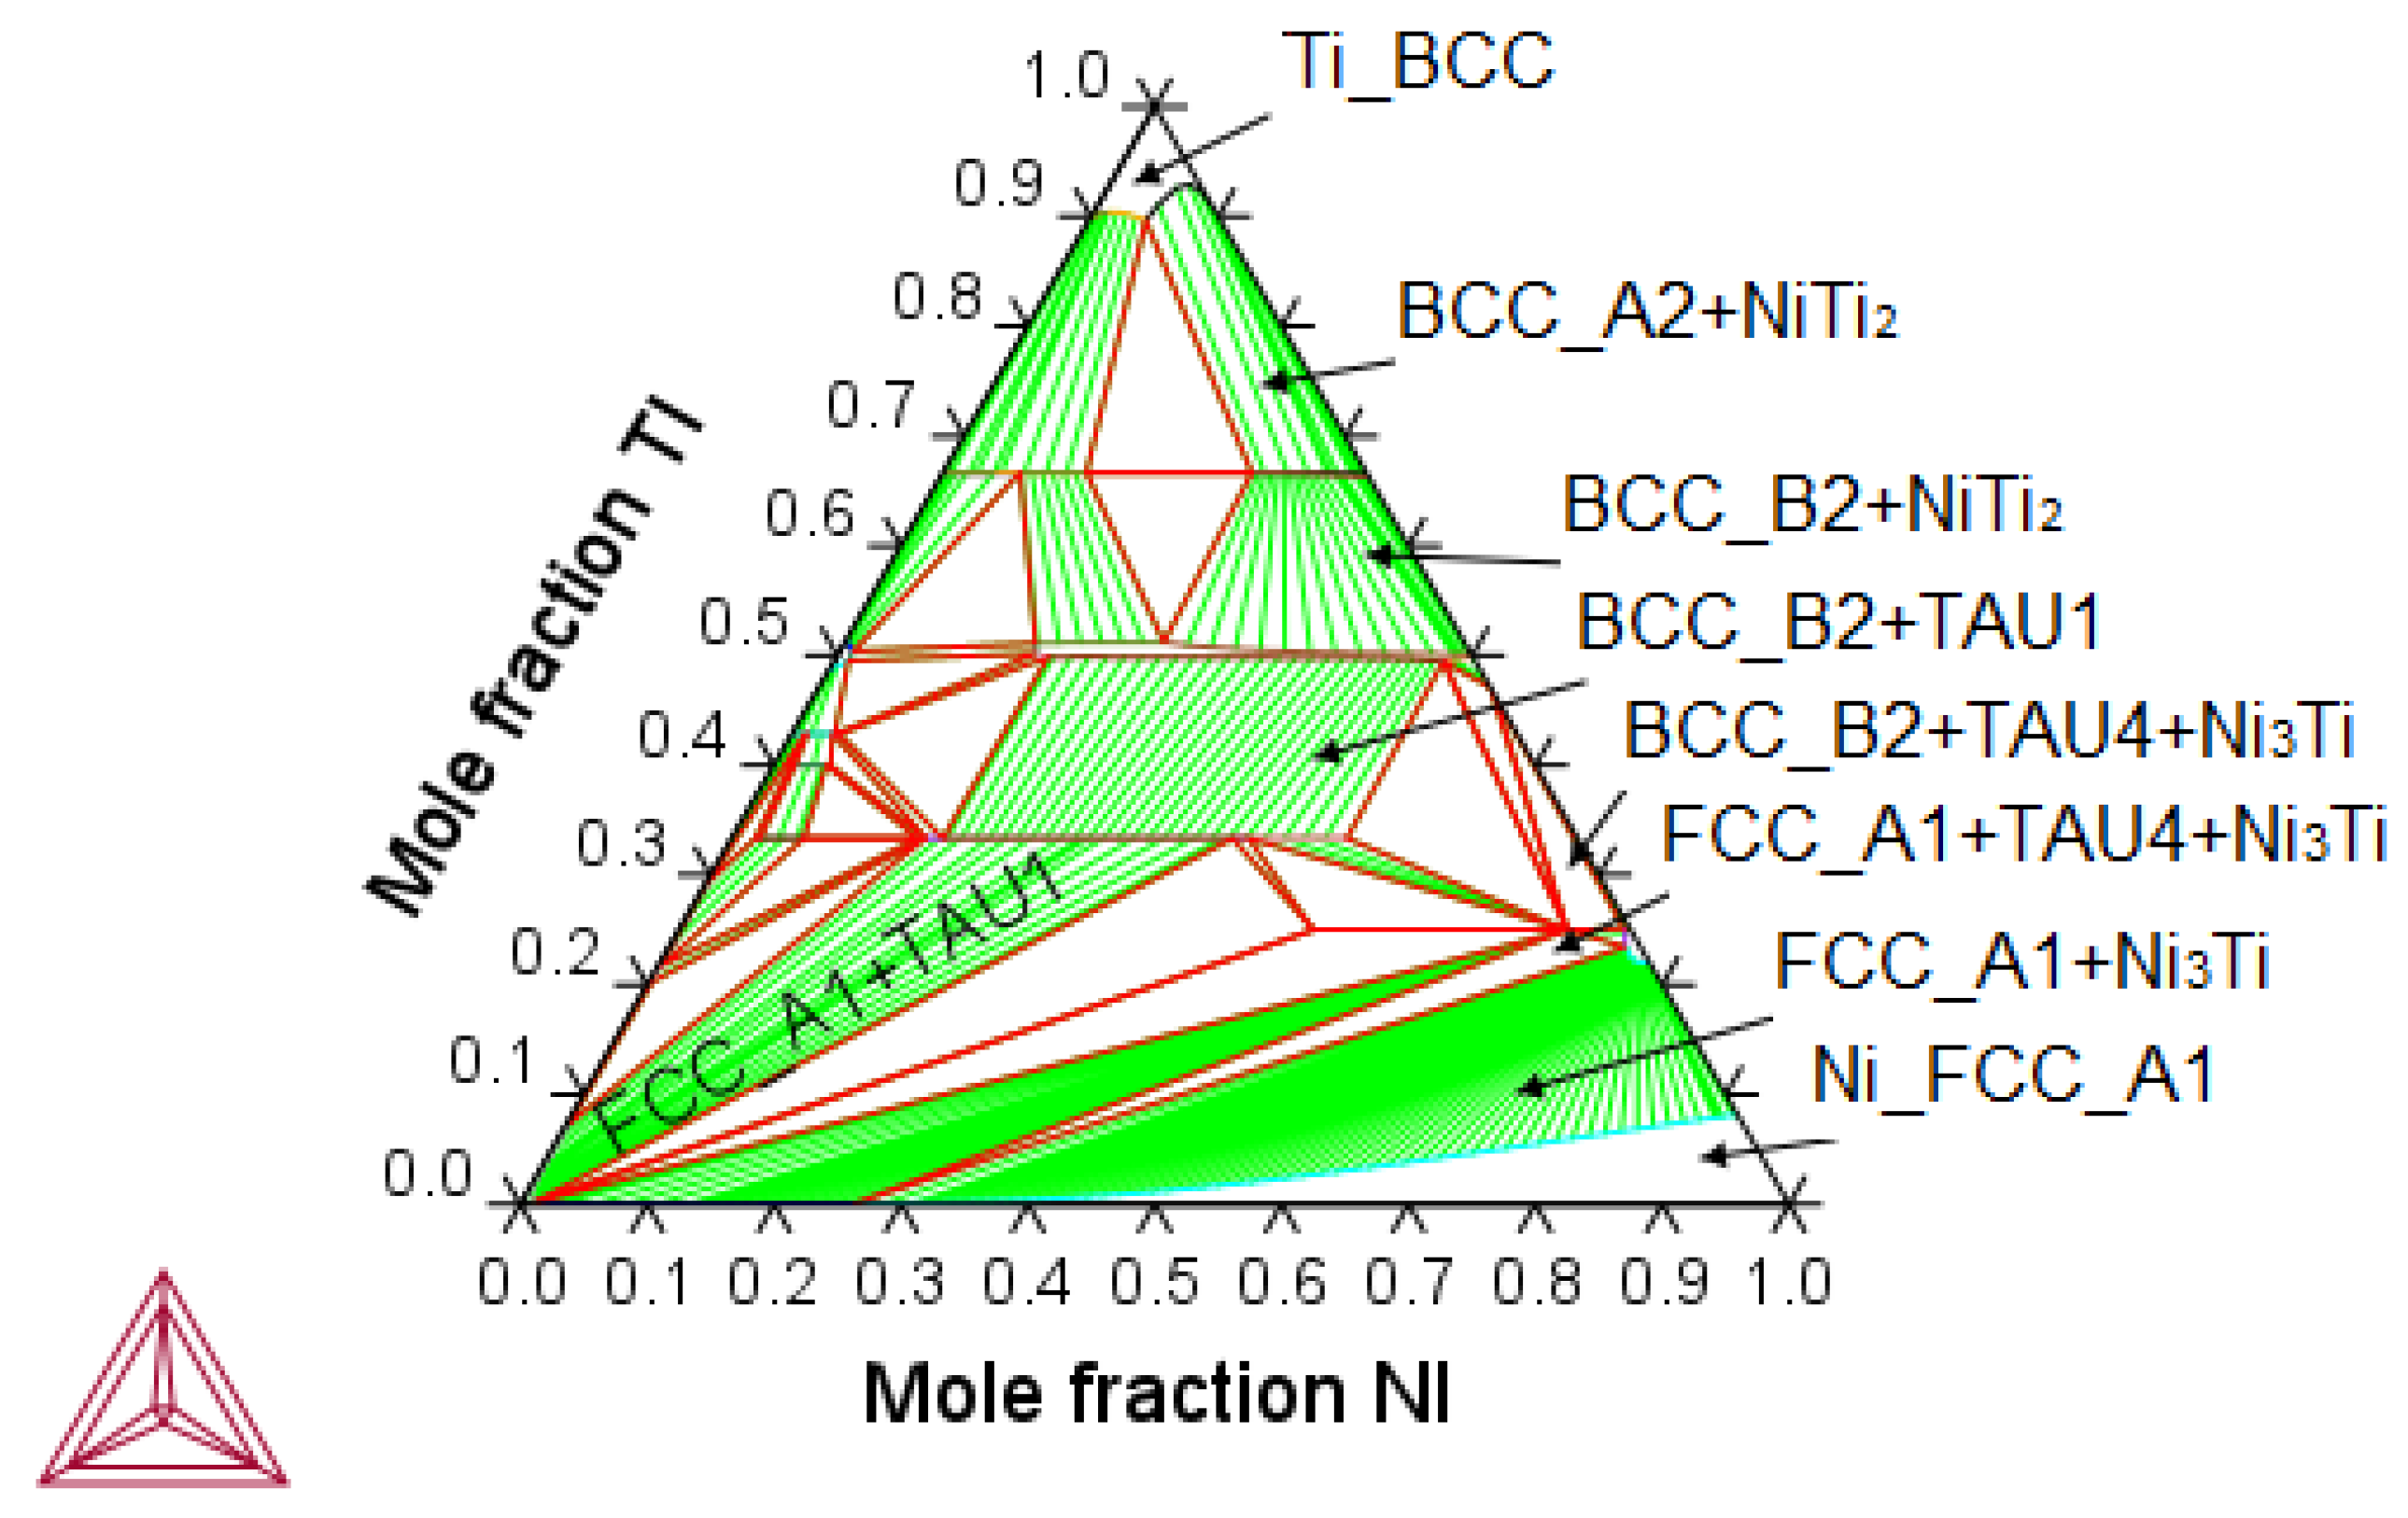
3.2.1. Thermodynamic Equilibrium Computation of Ni-Ti-Cu System
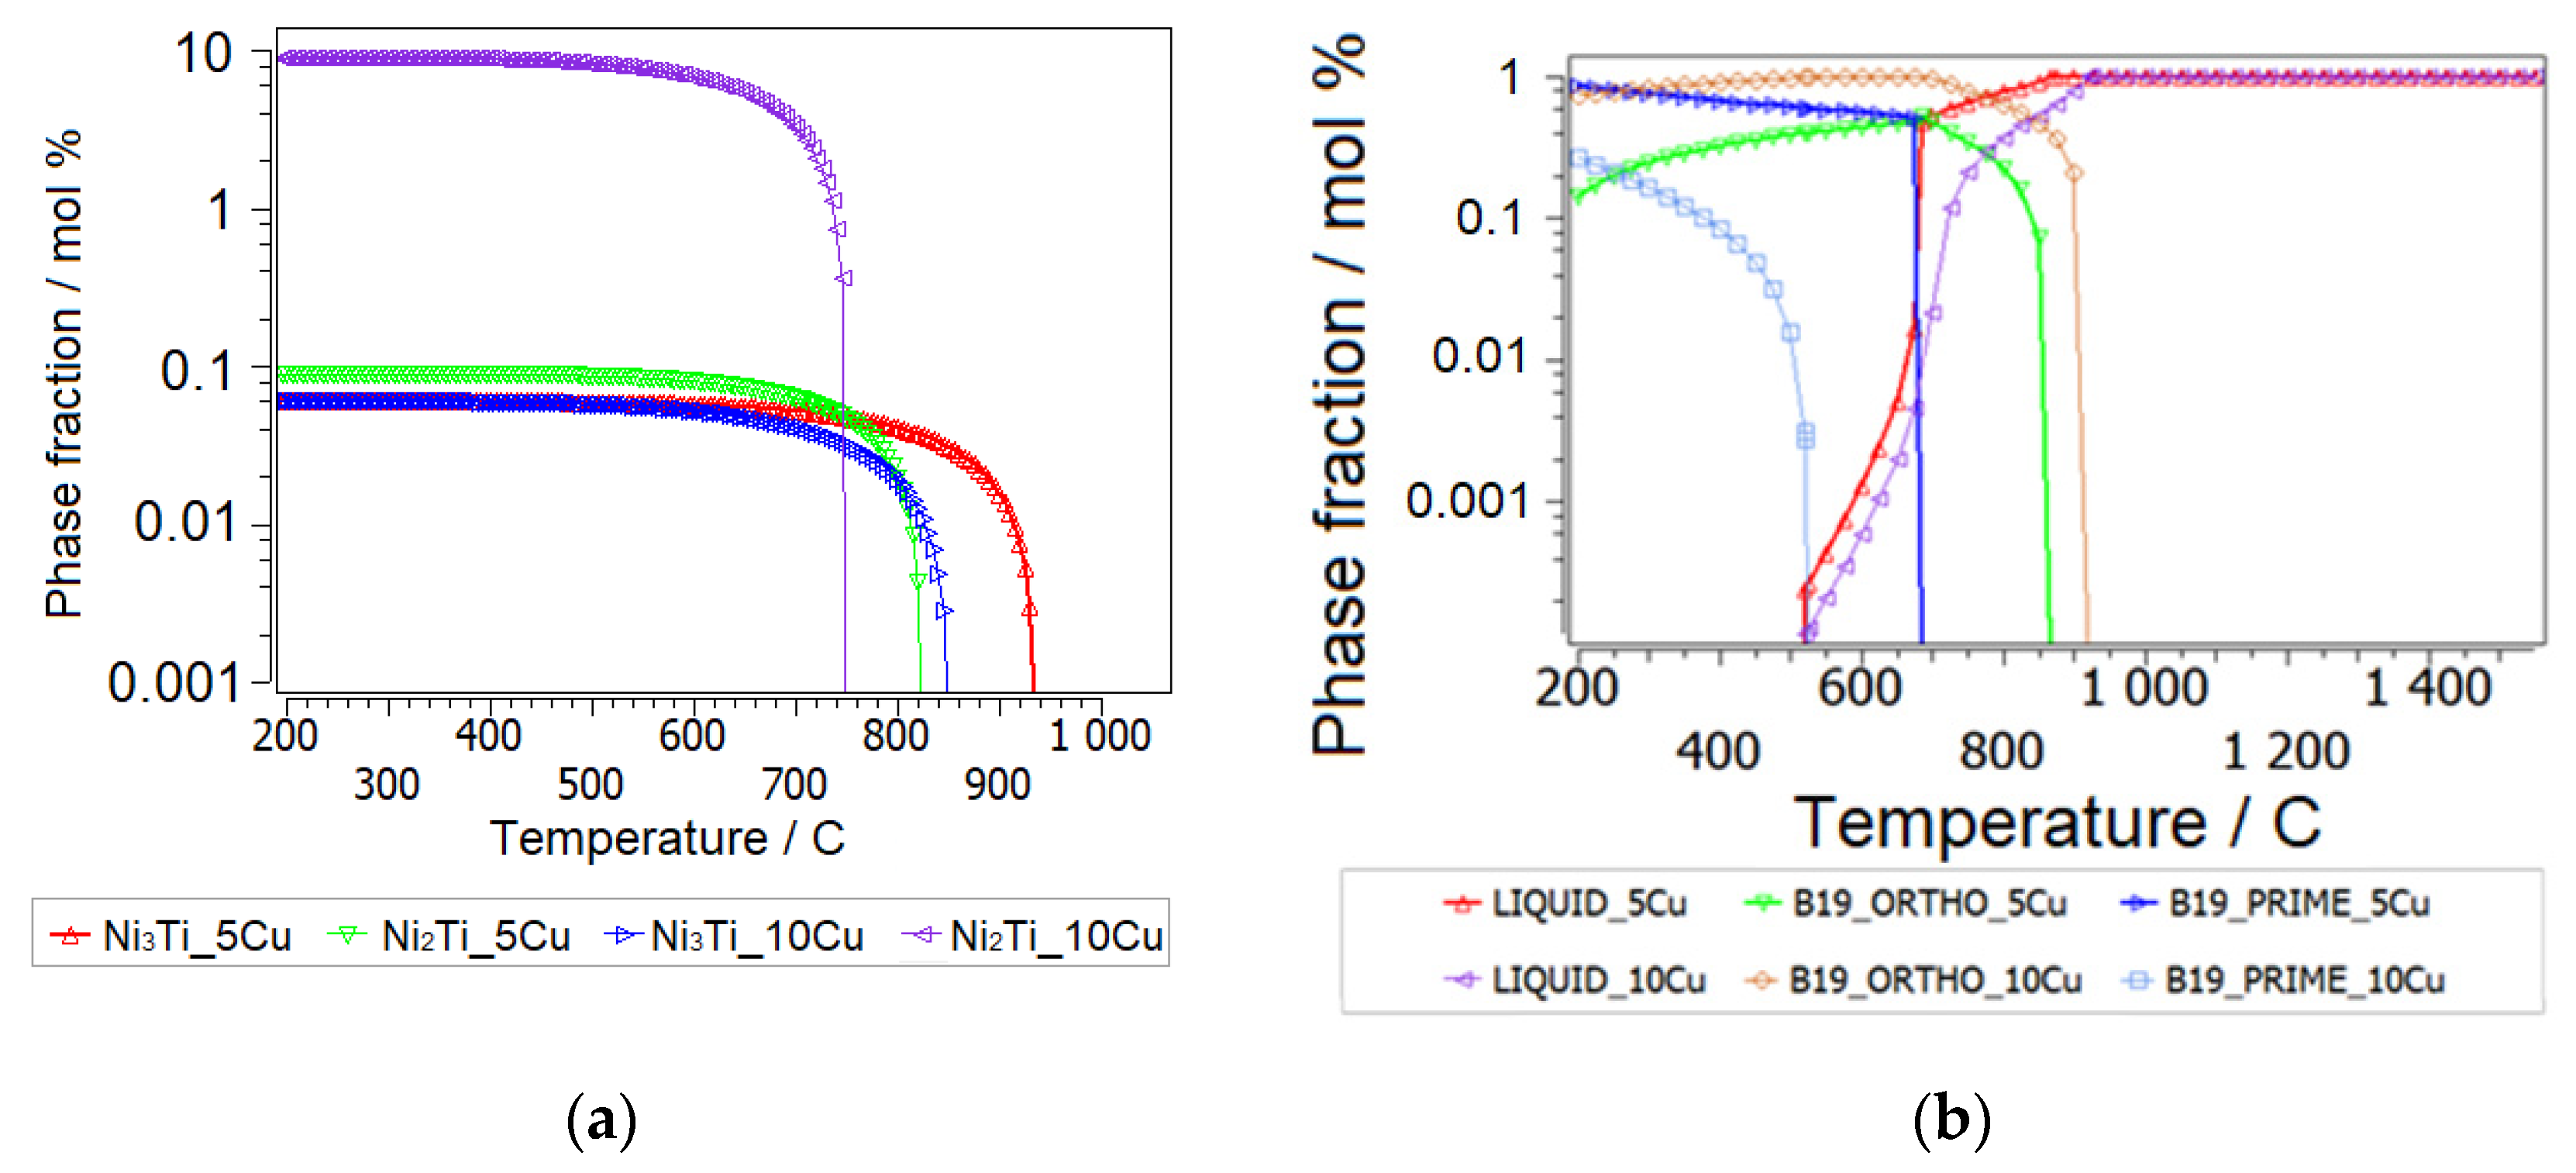
- Metastability of Ni-Ti-Cu Base Intermetallics
- Metastability of Ni-Ti-Cu Base Martensite Phases
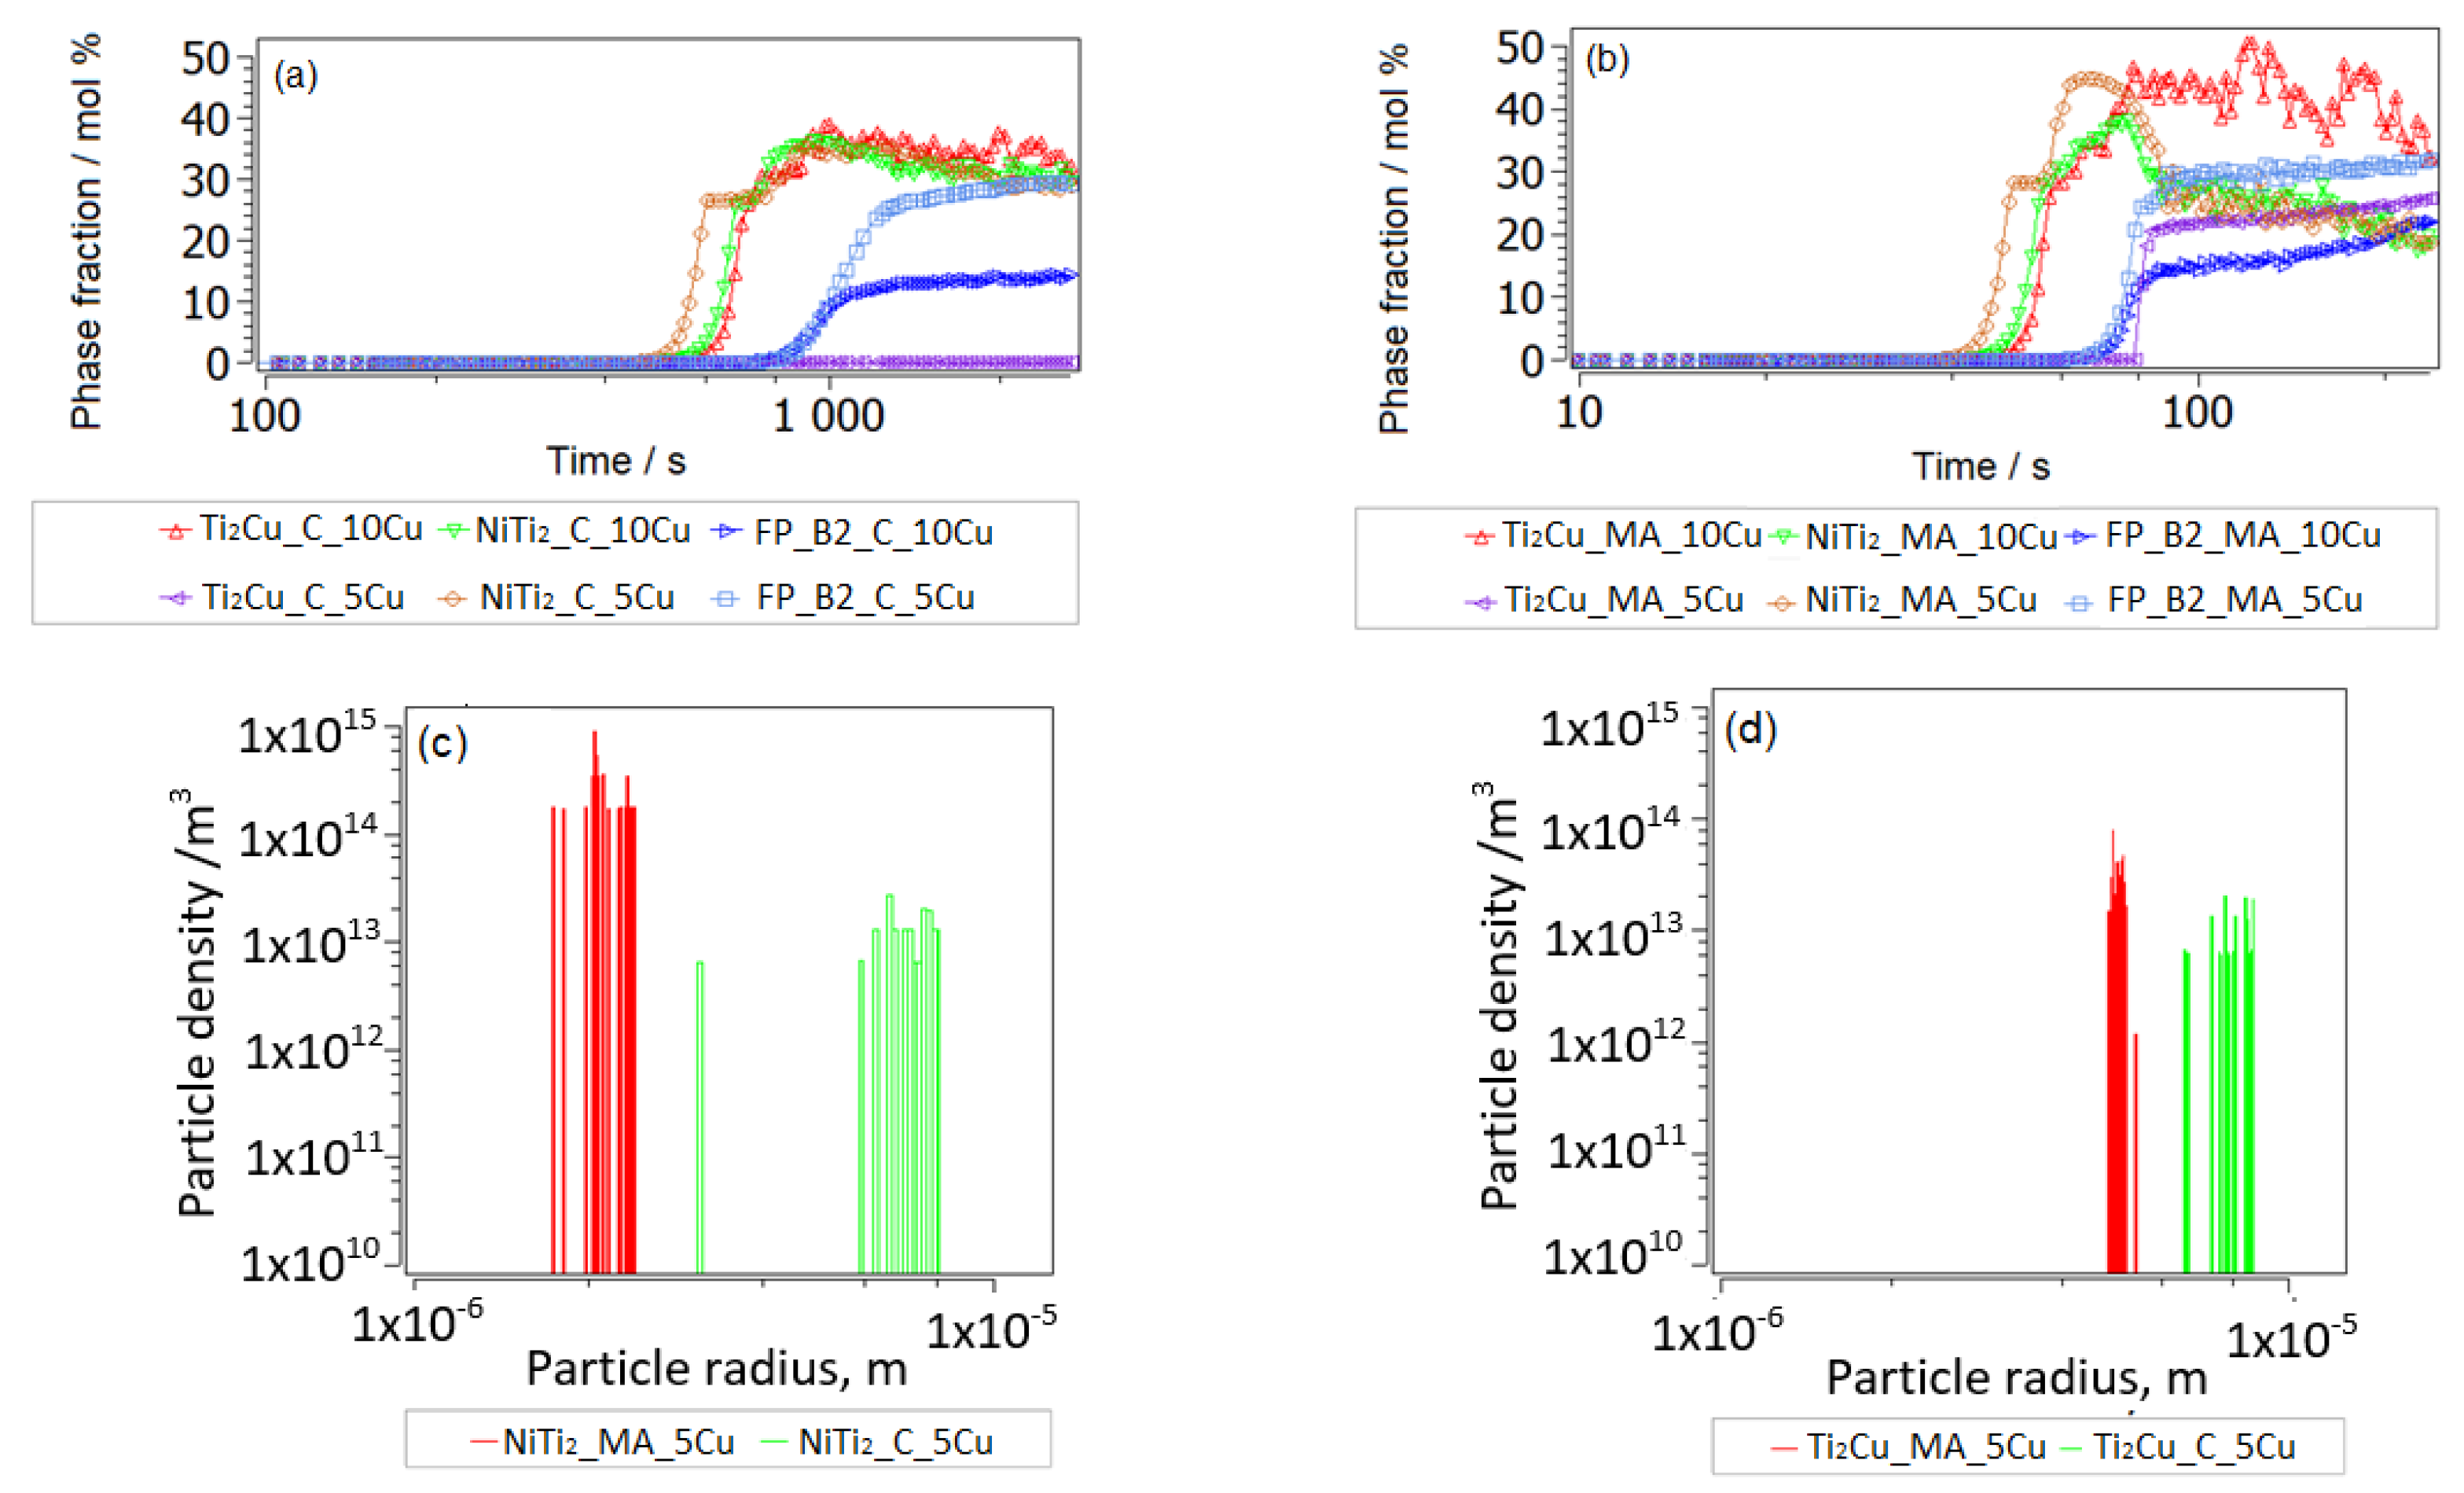
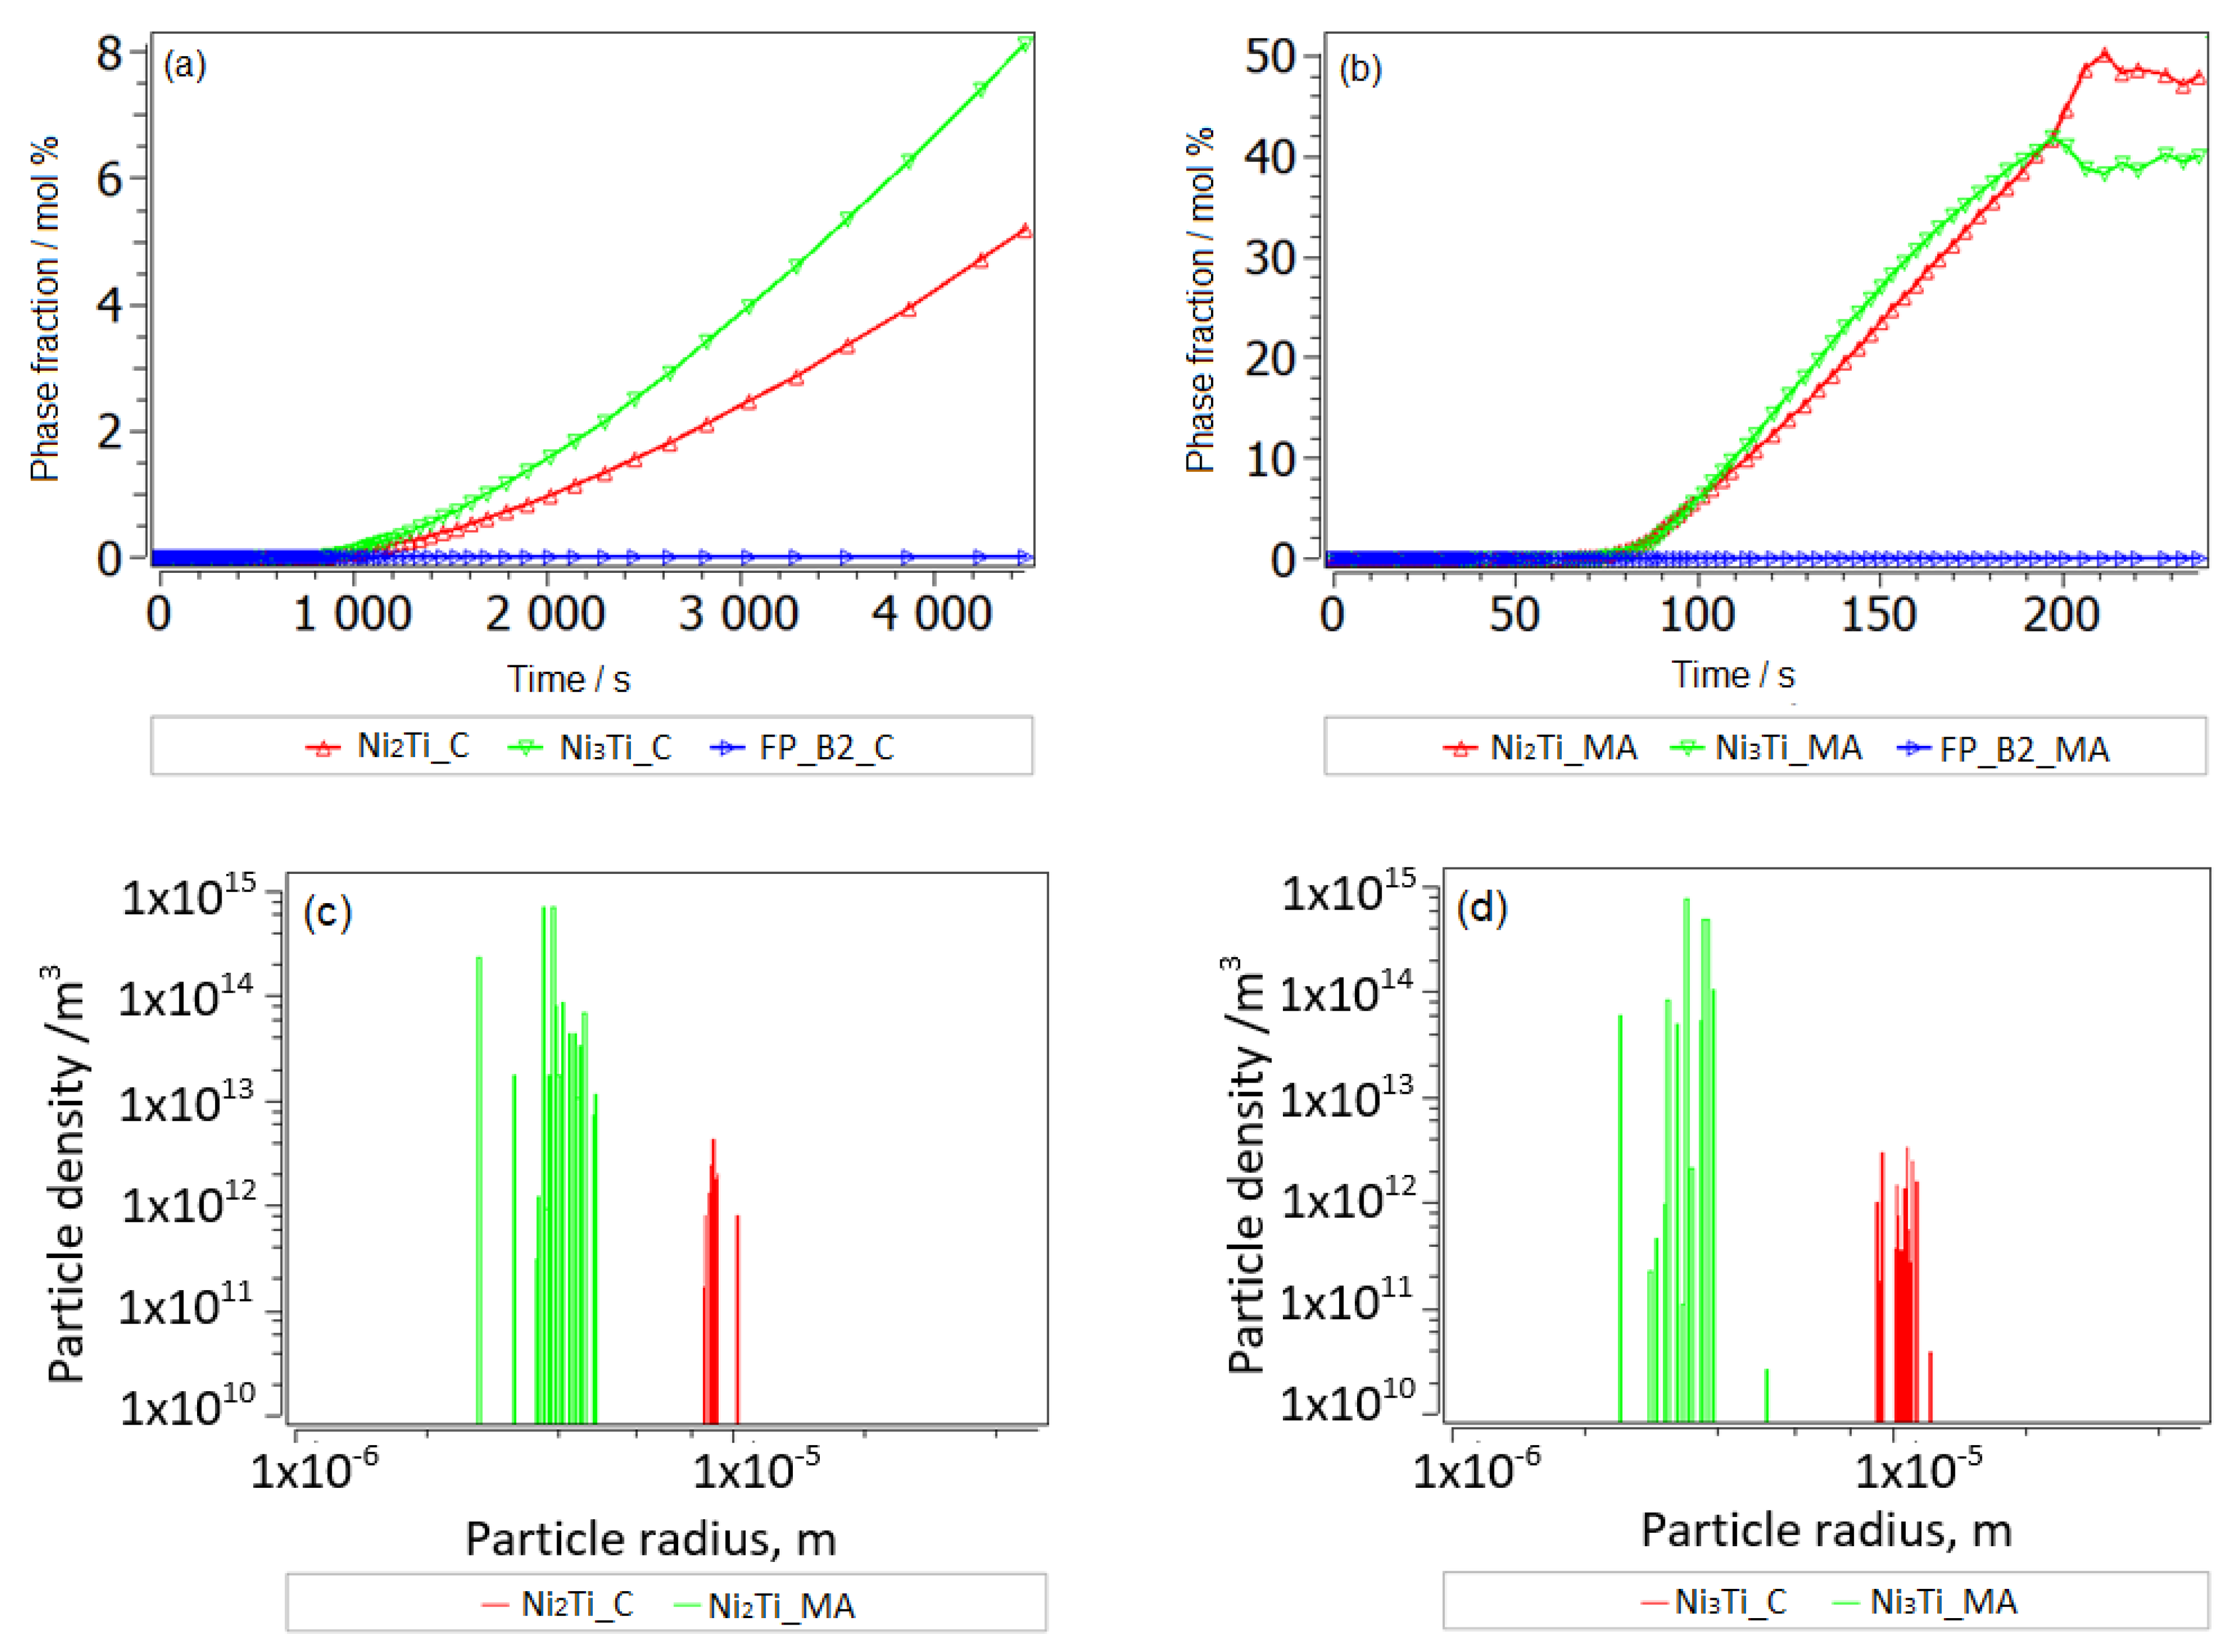
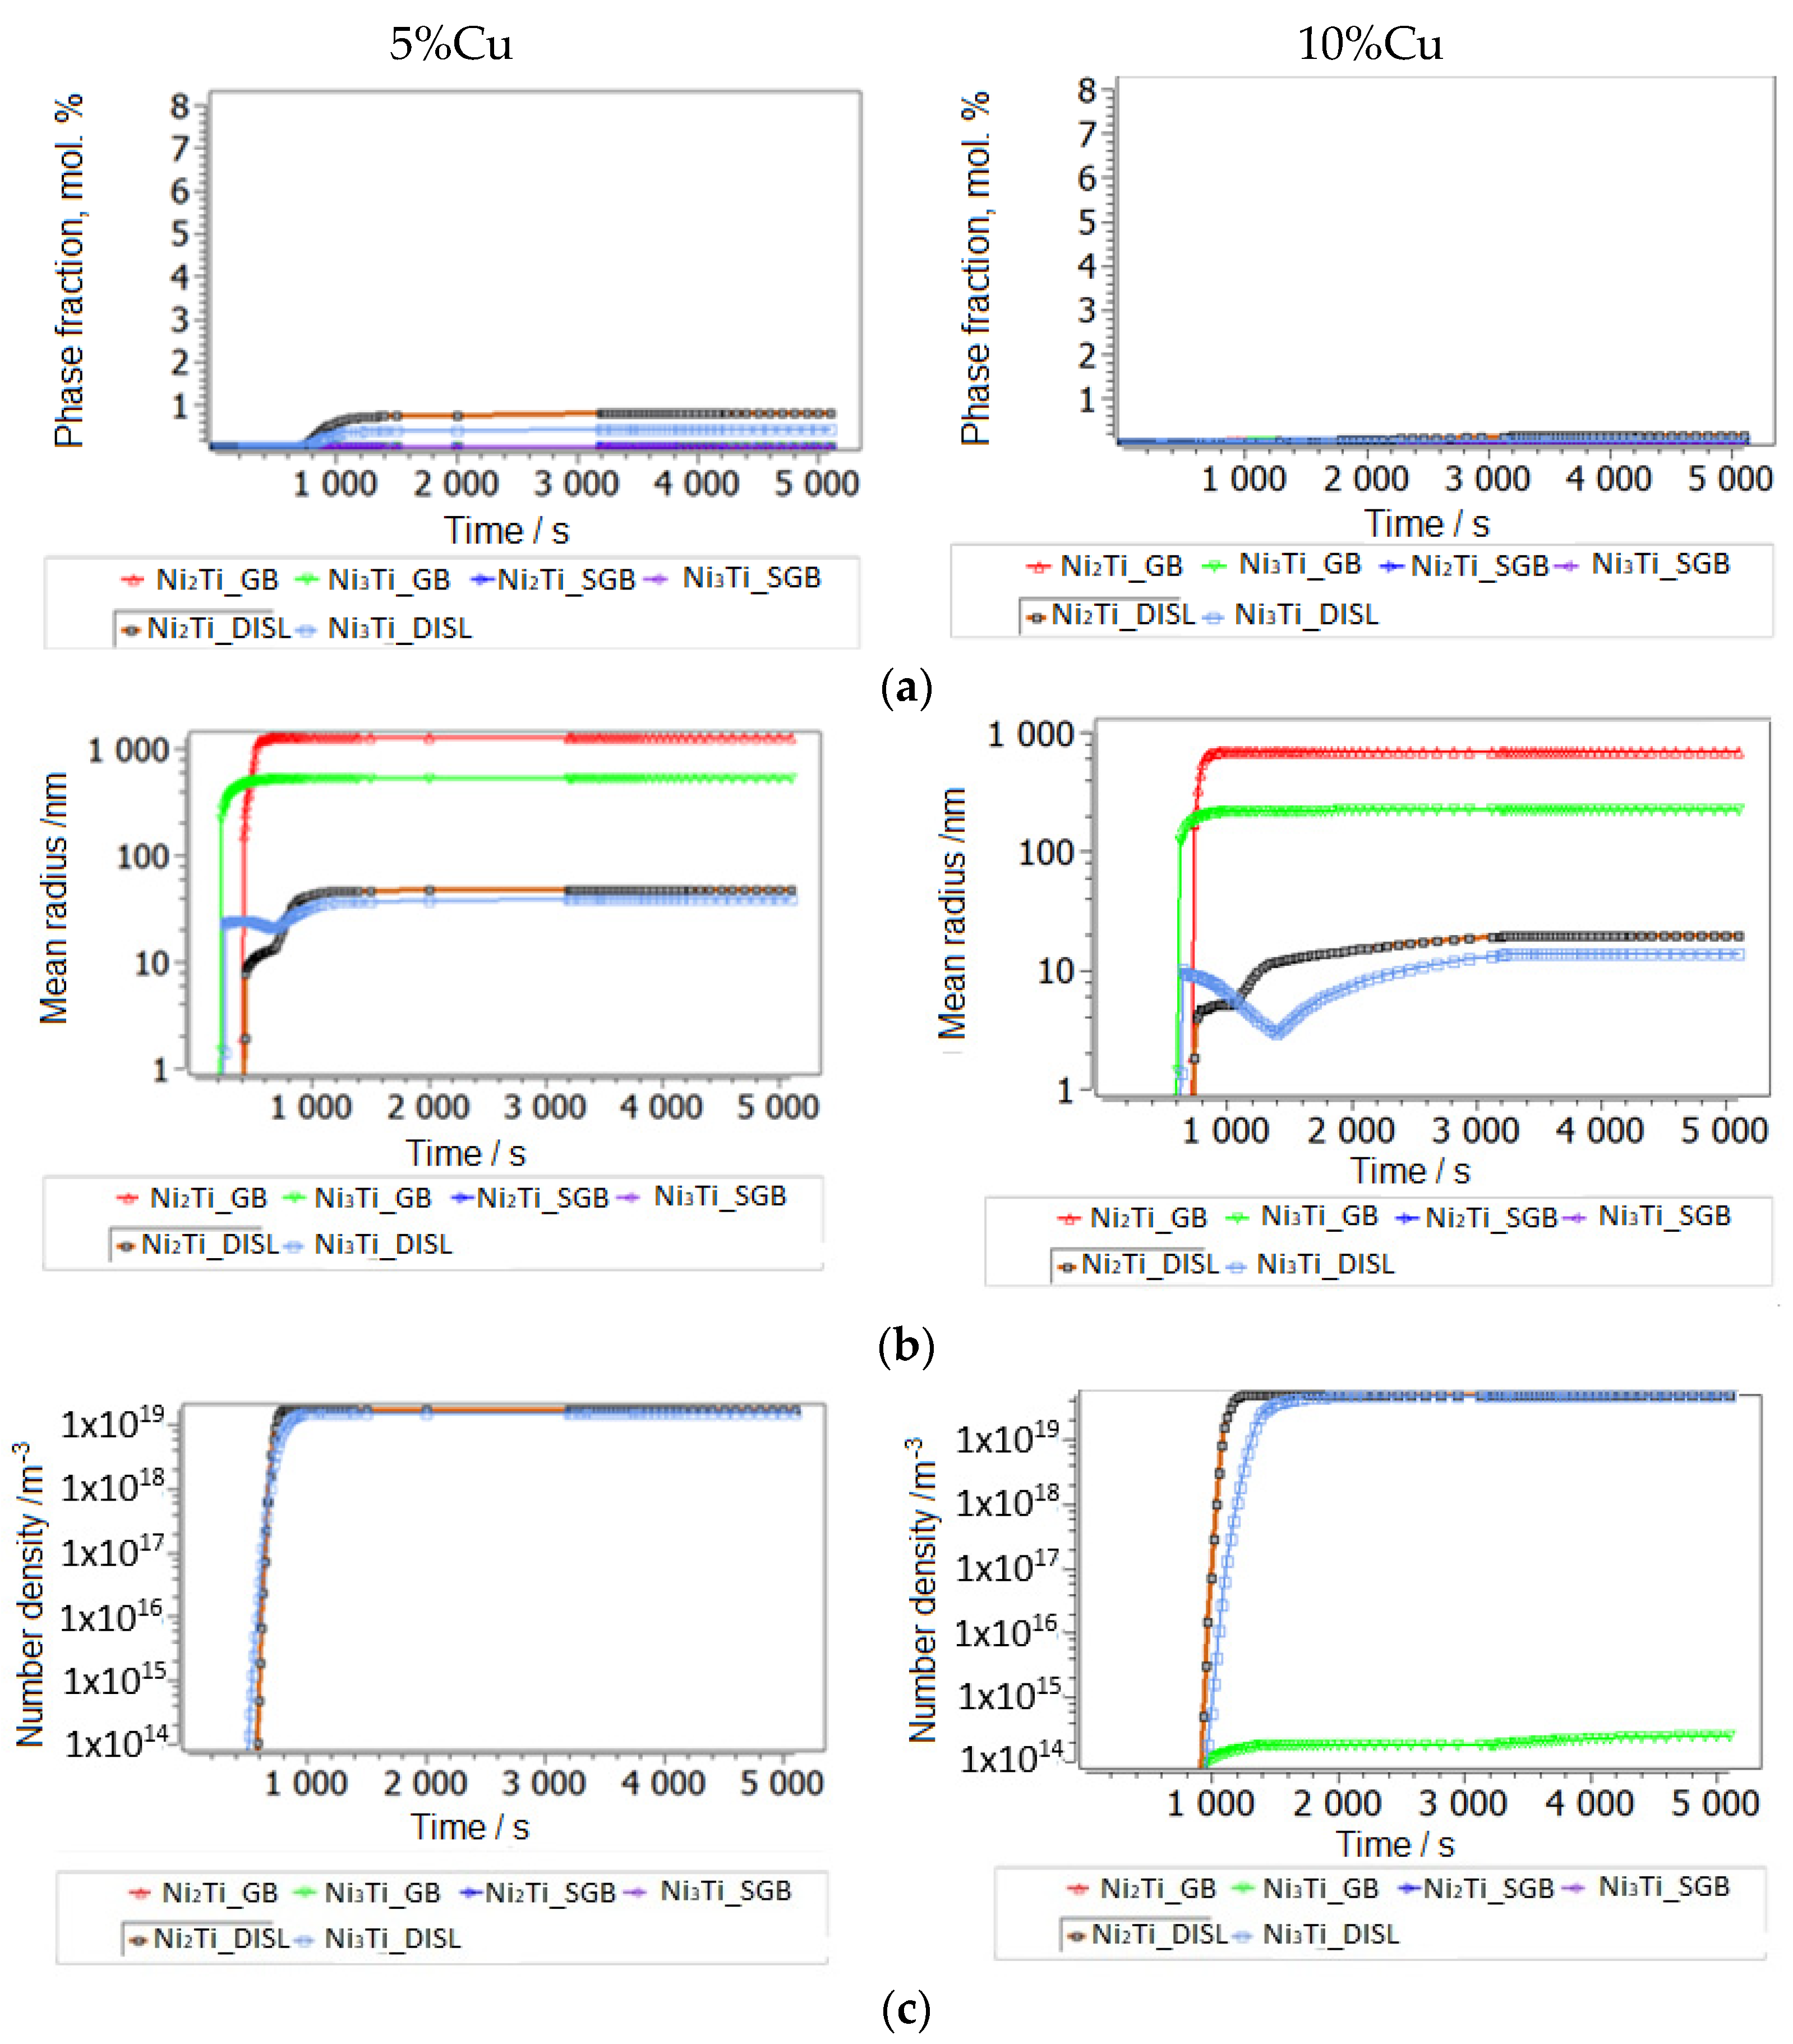
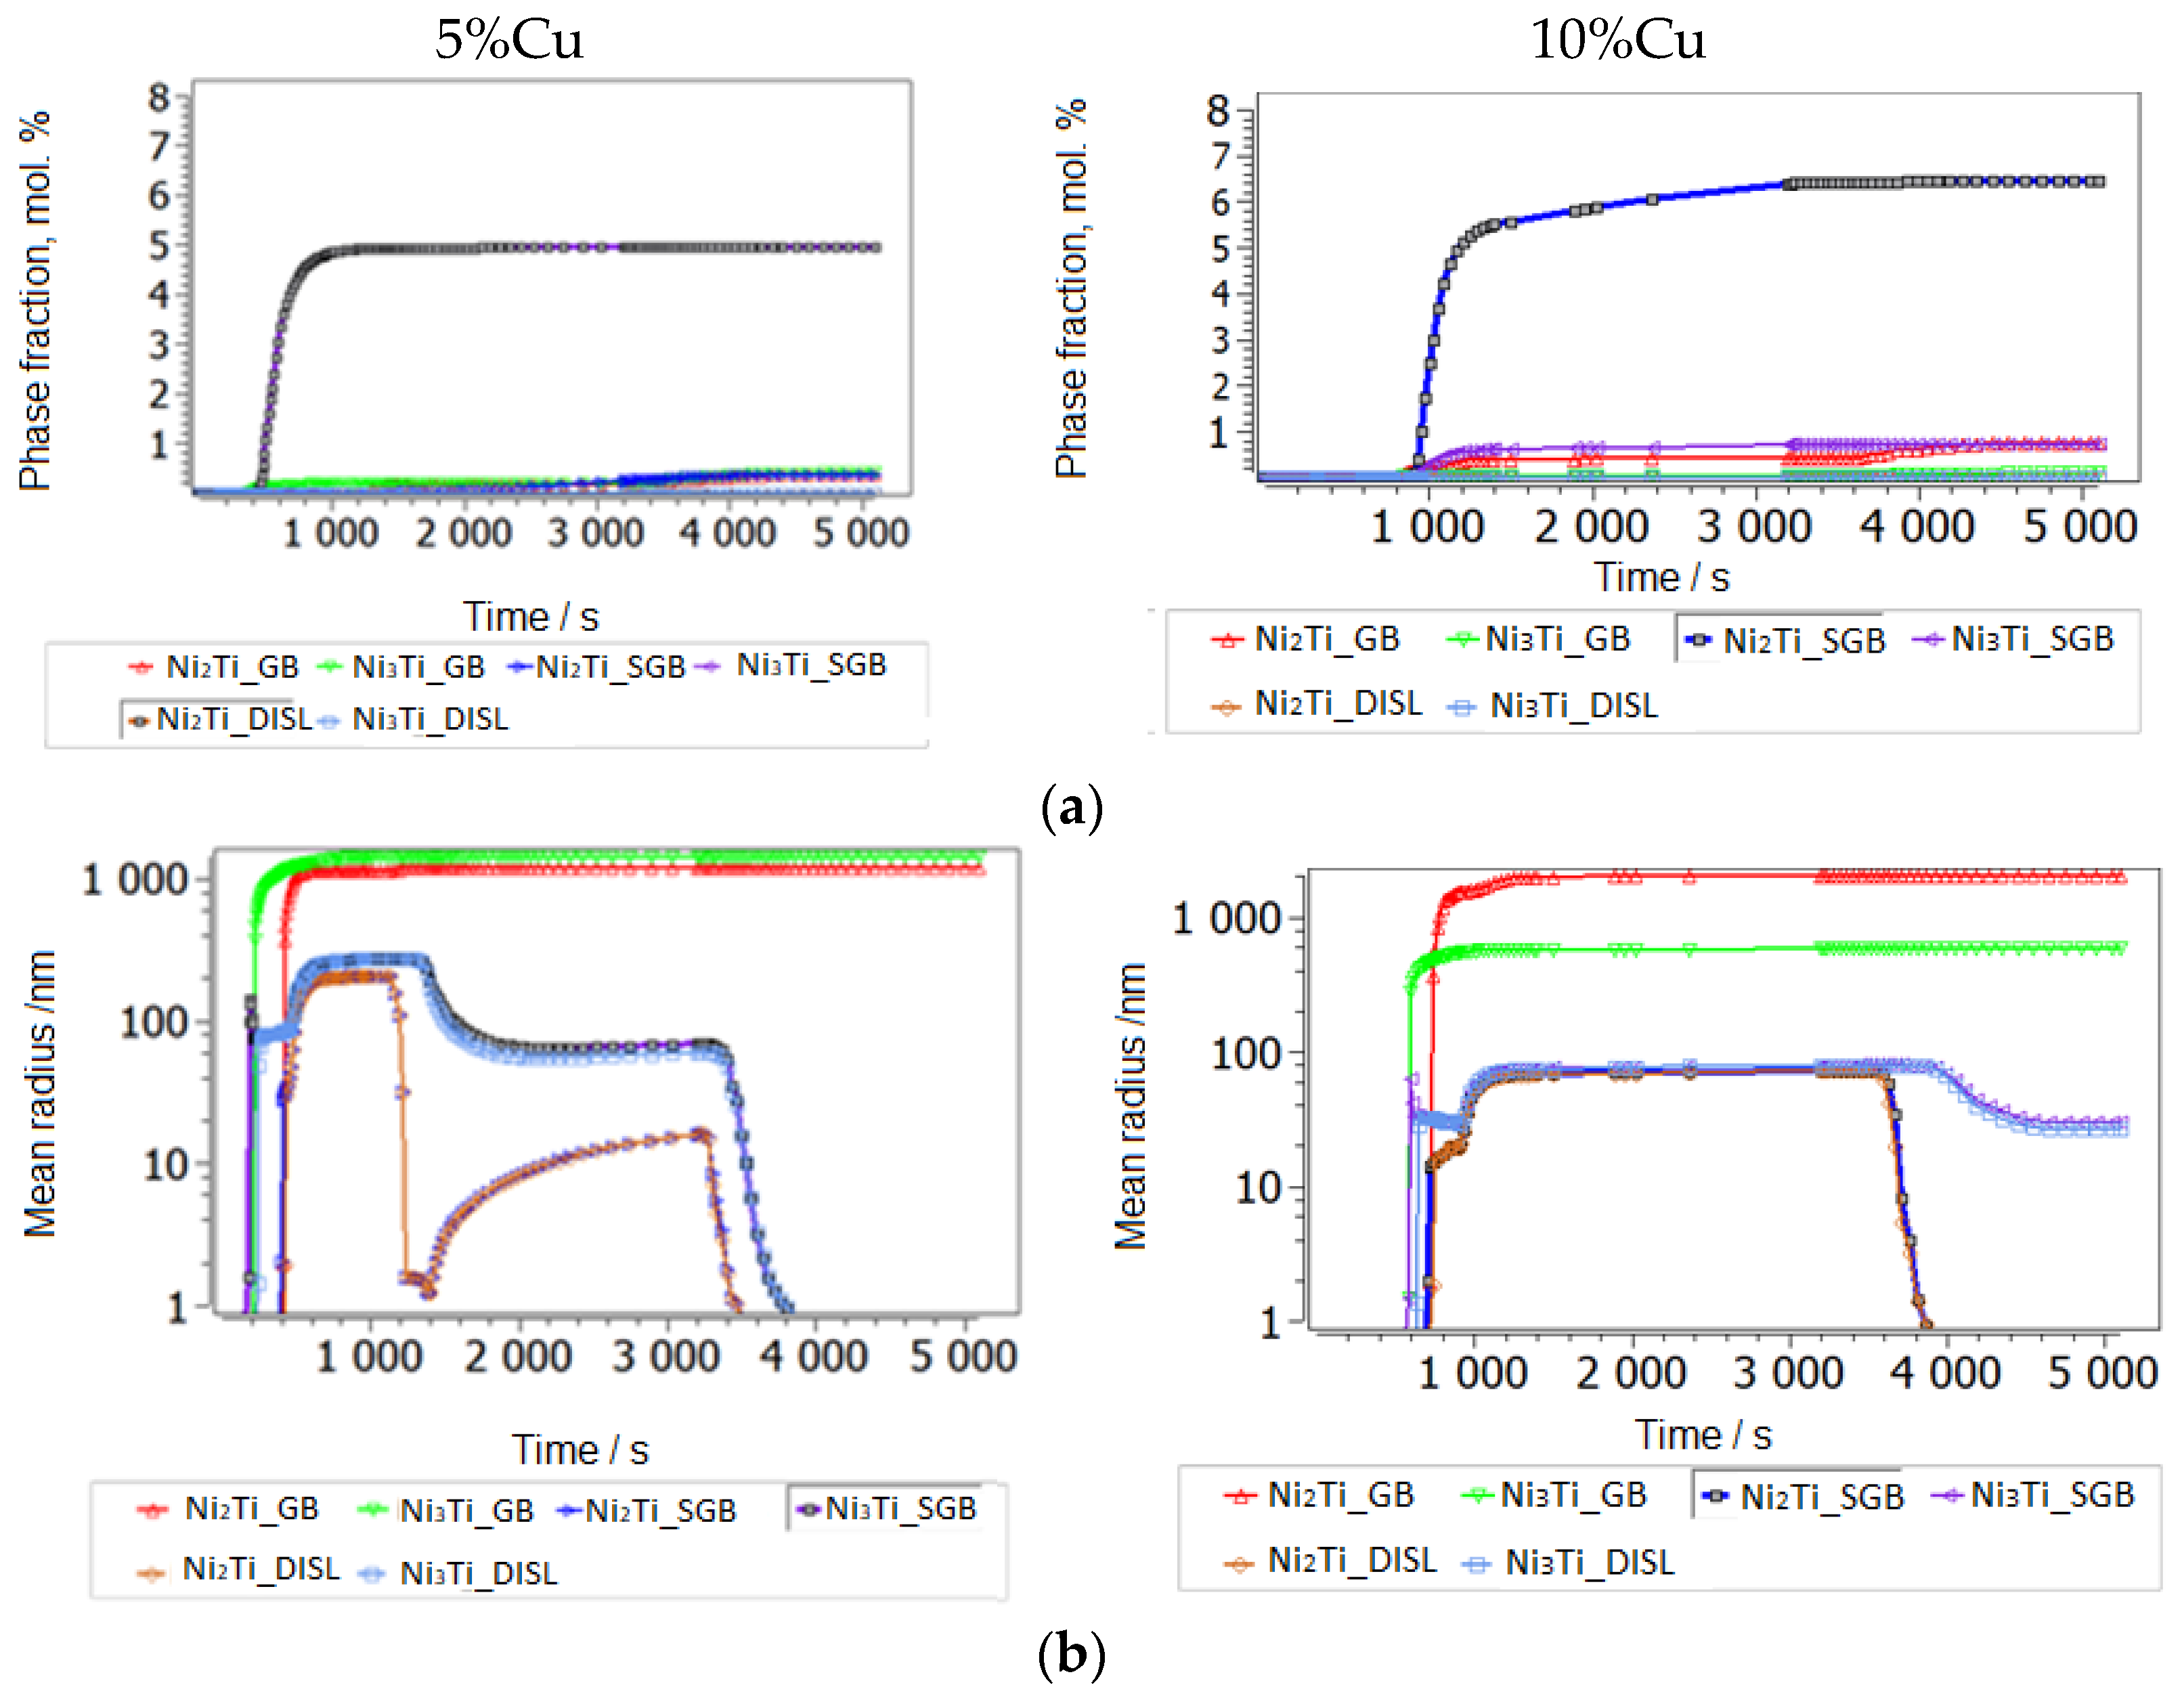
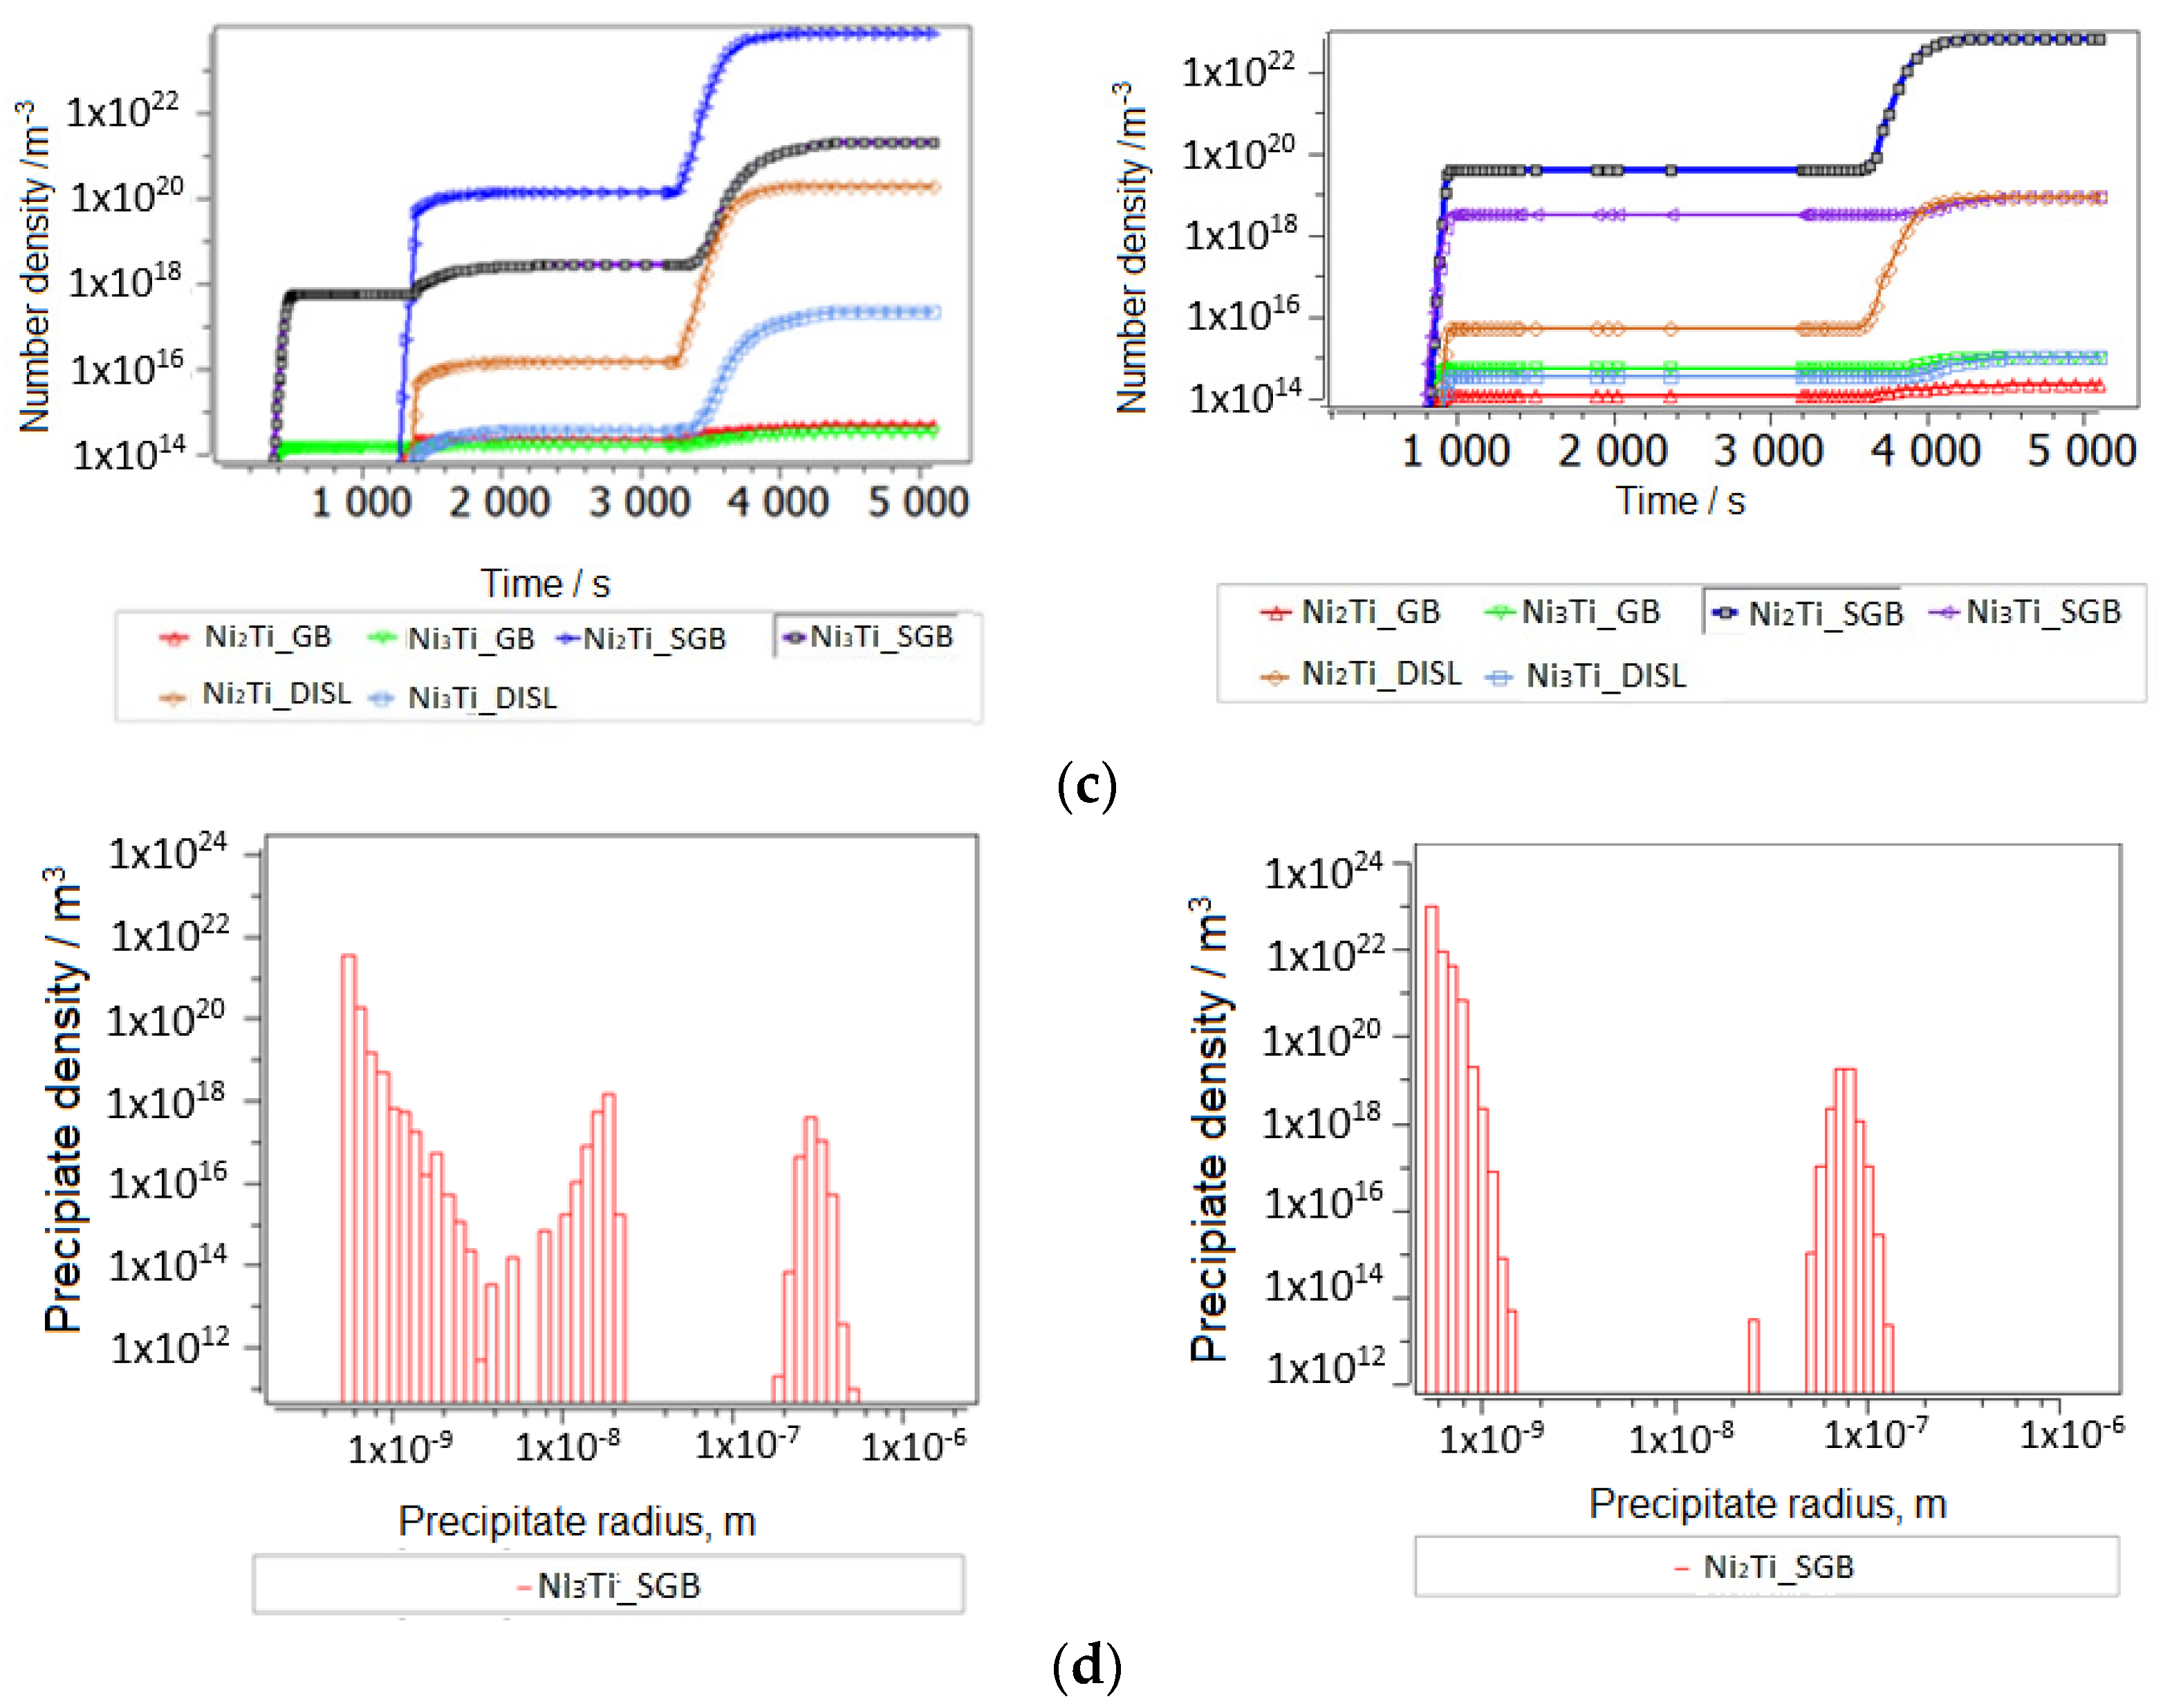
3.2.2. Thermokinetic Precipitation and Phase Transformation Simulation
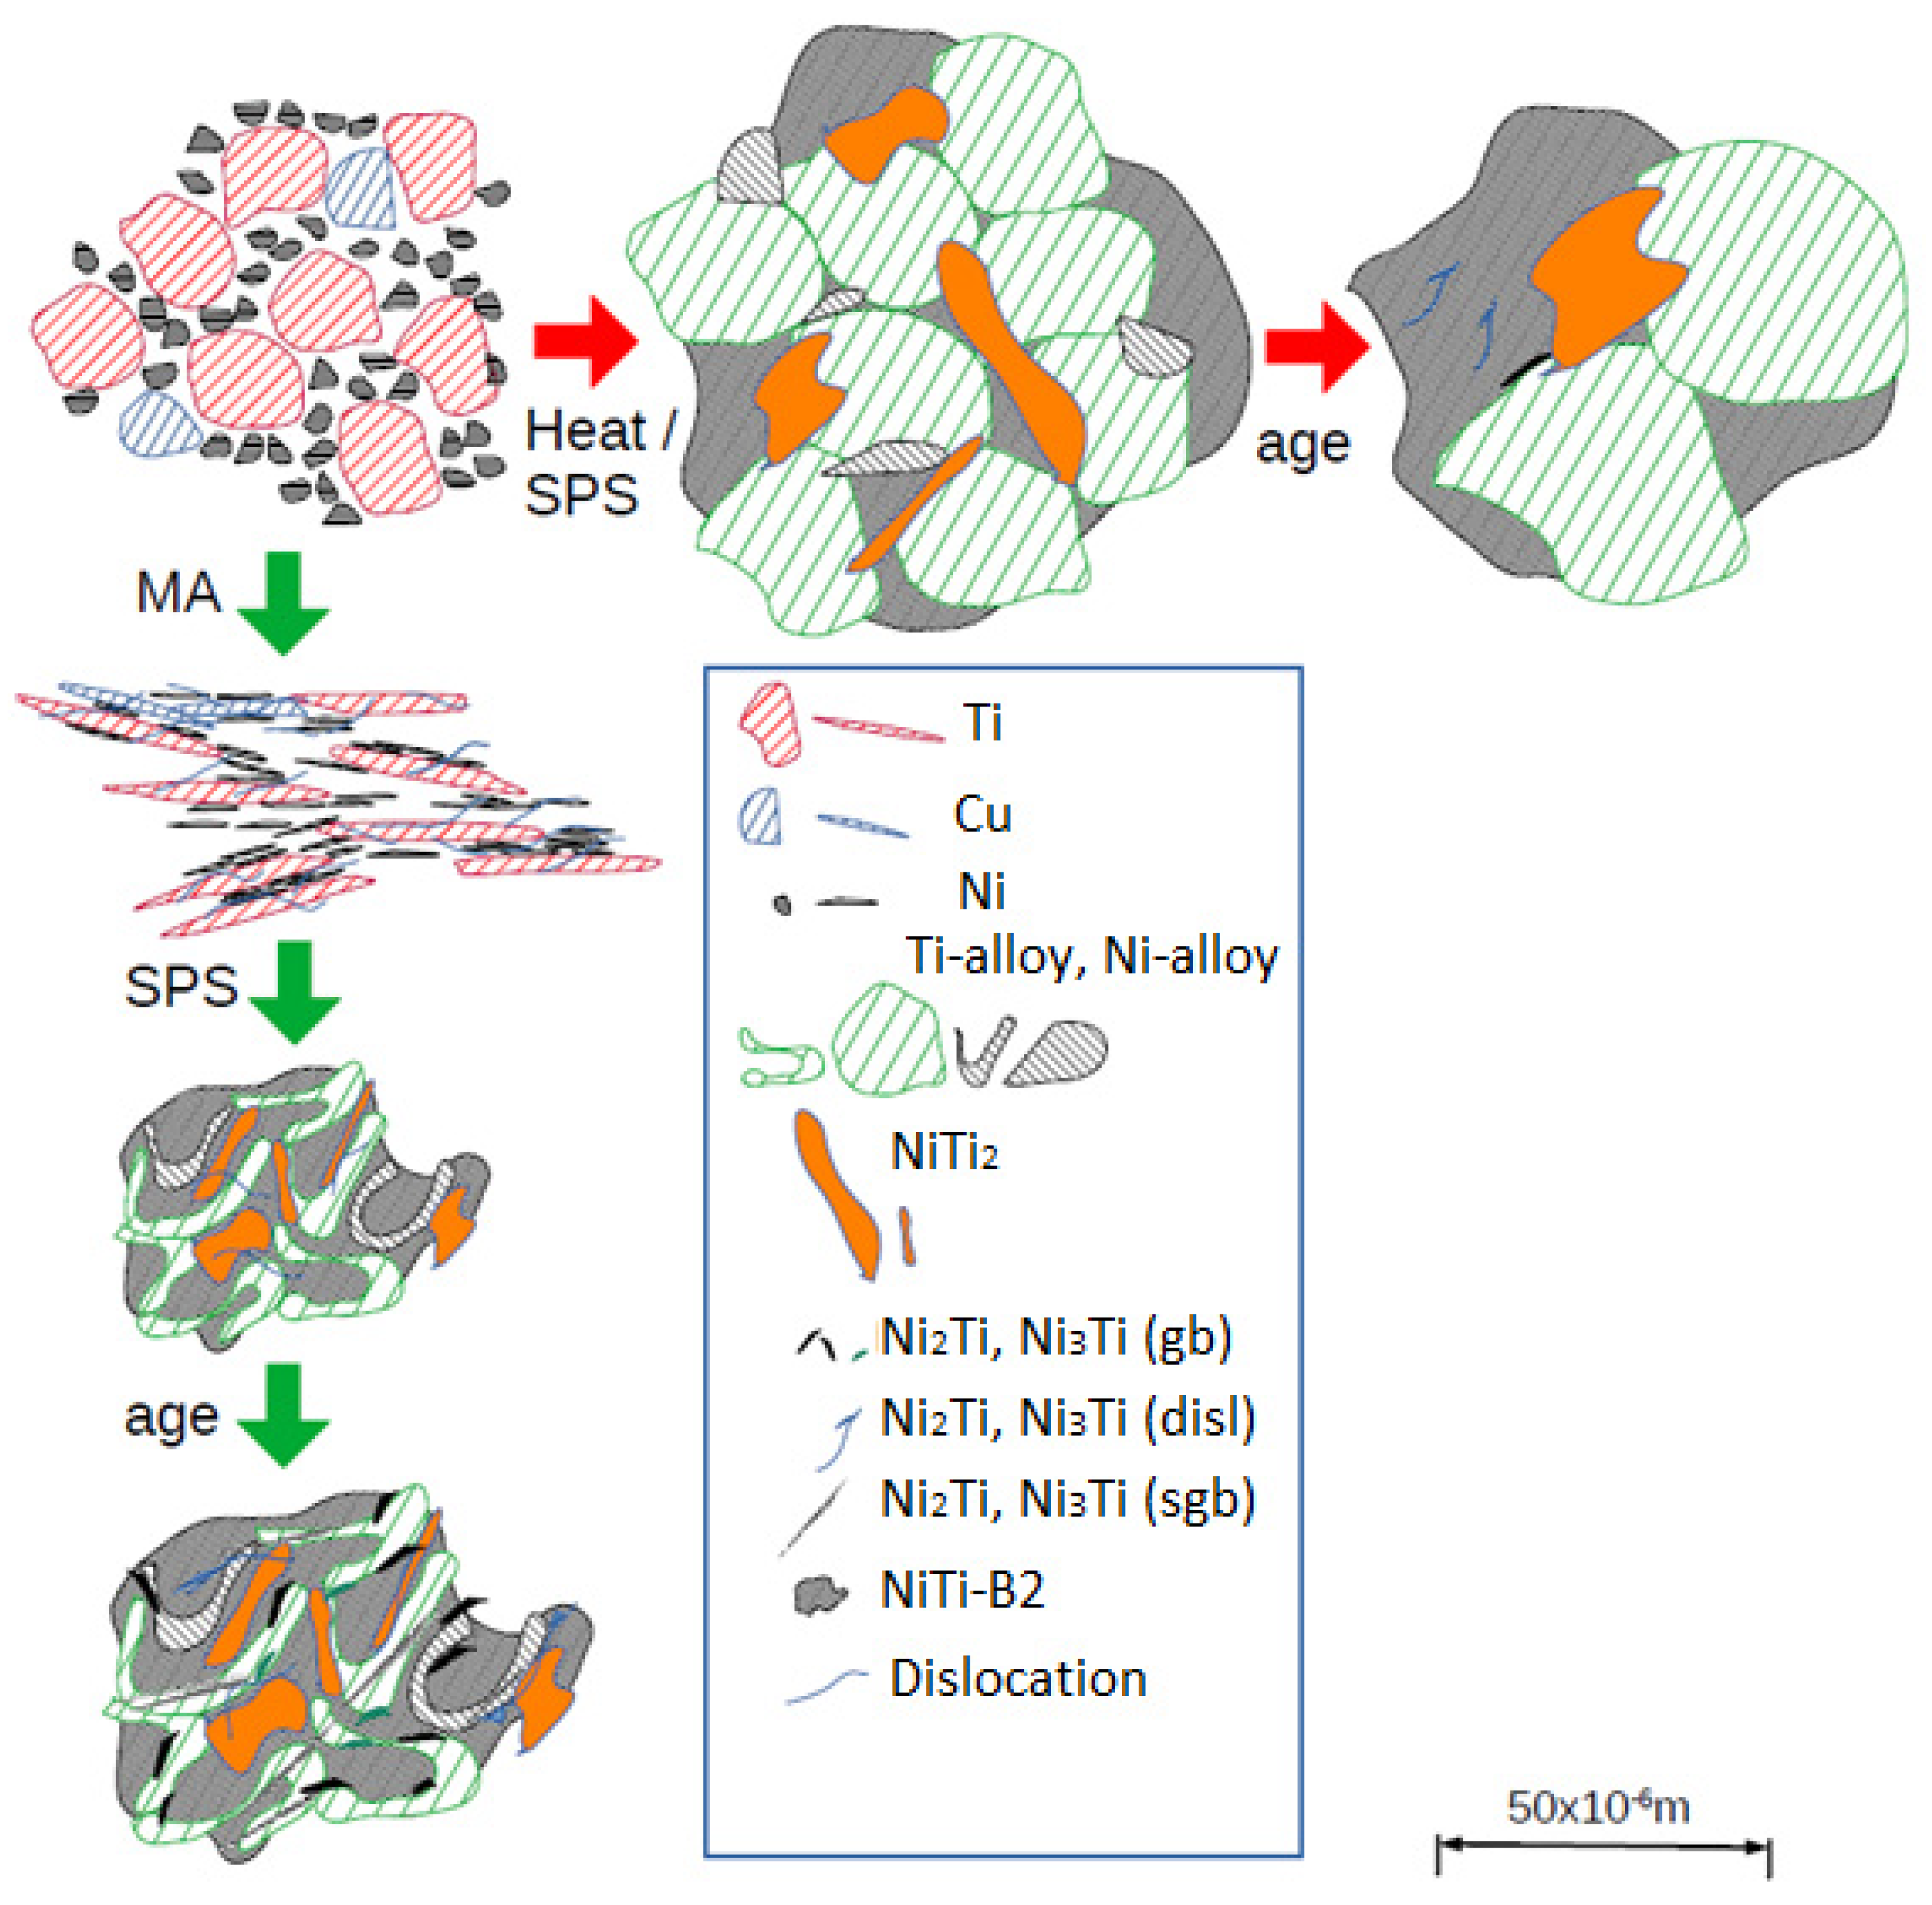
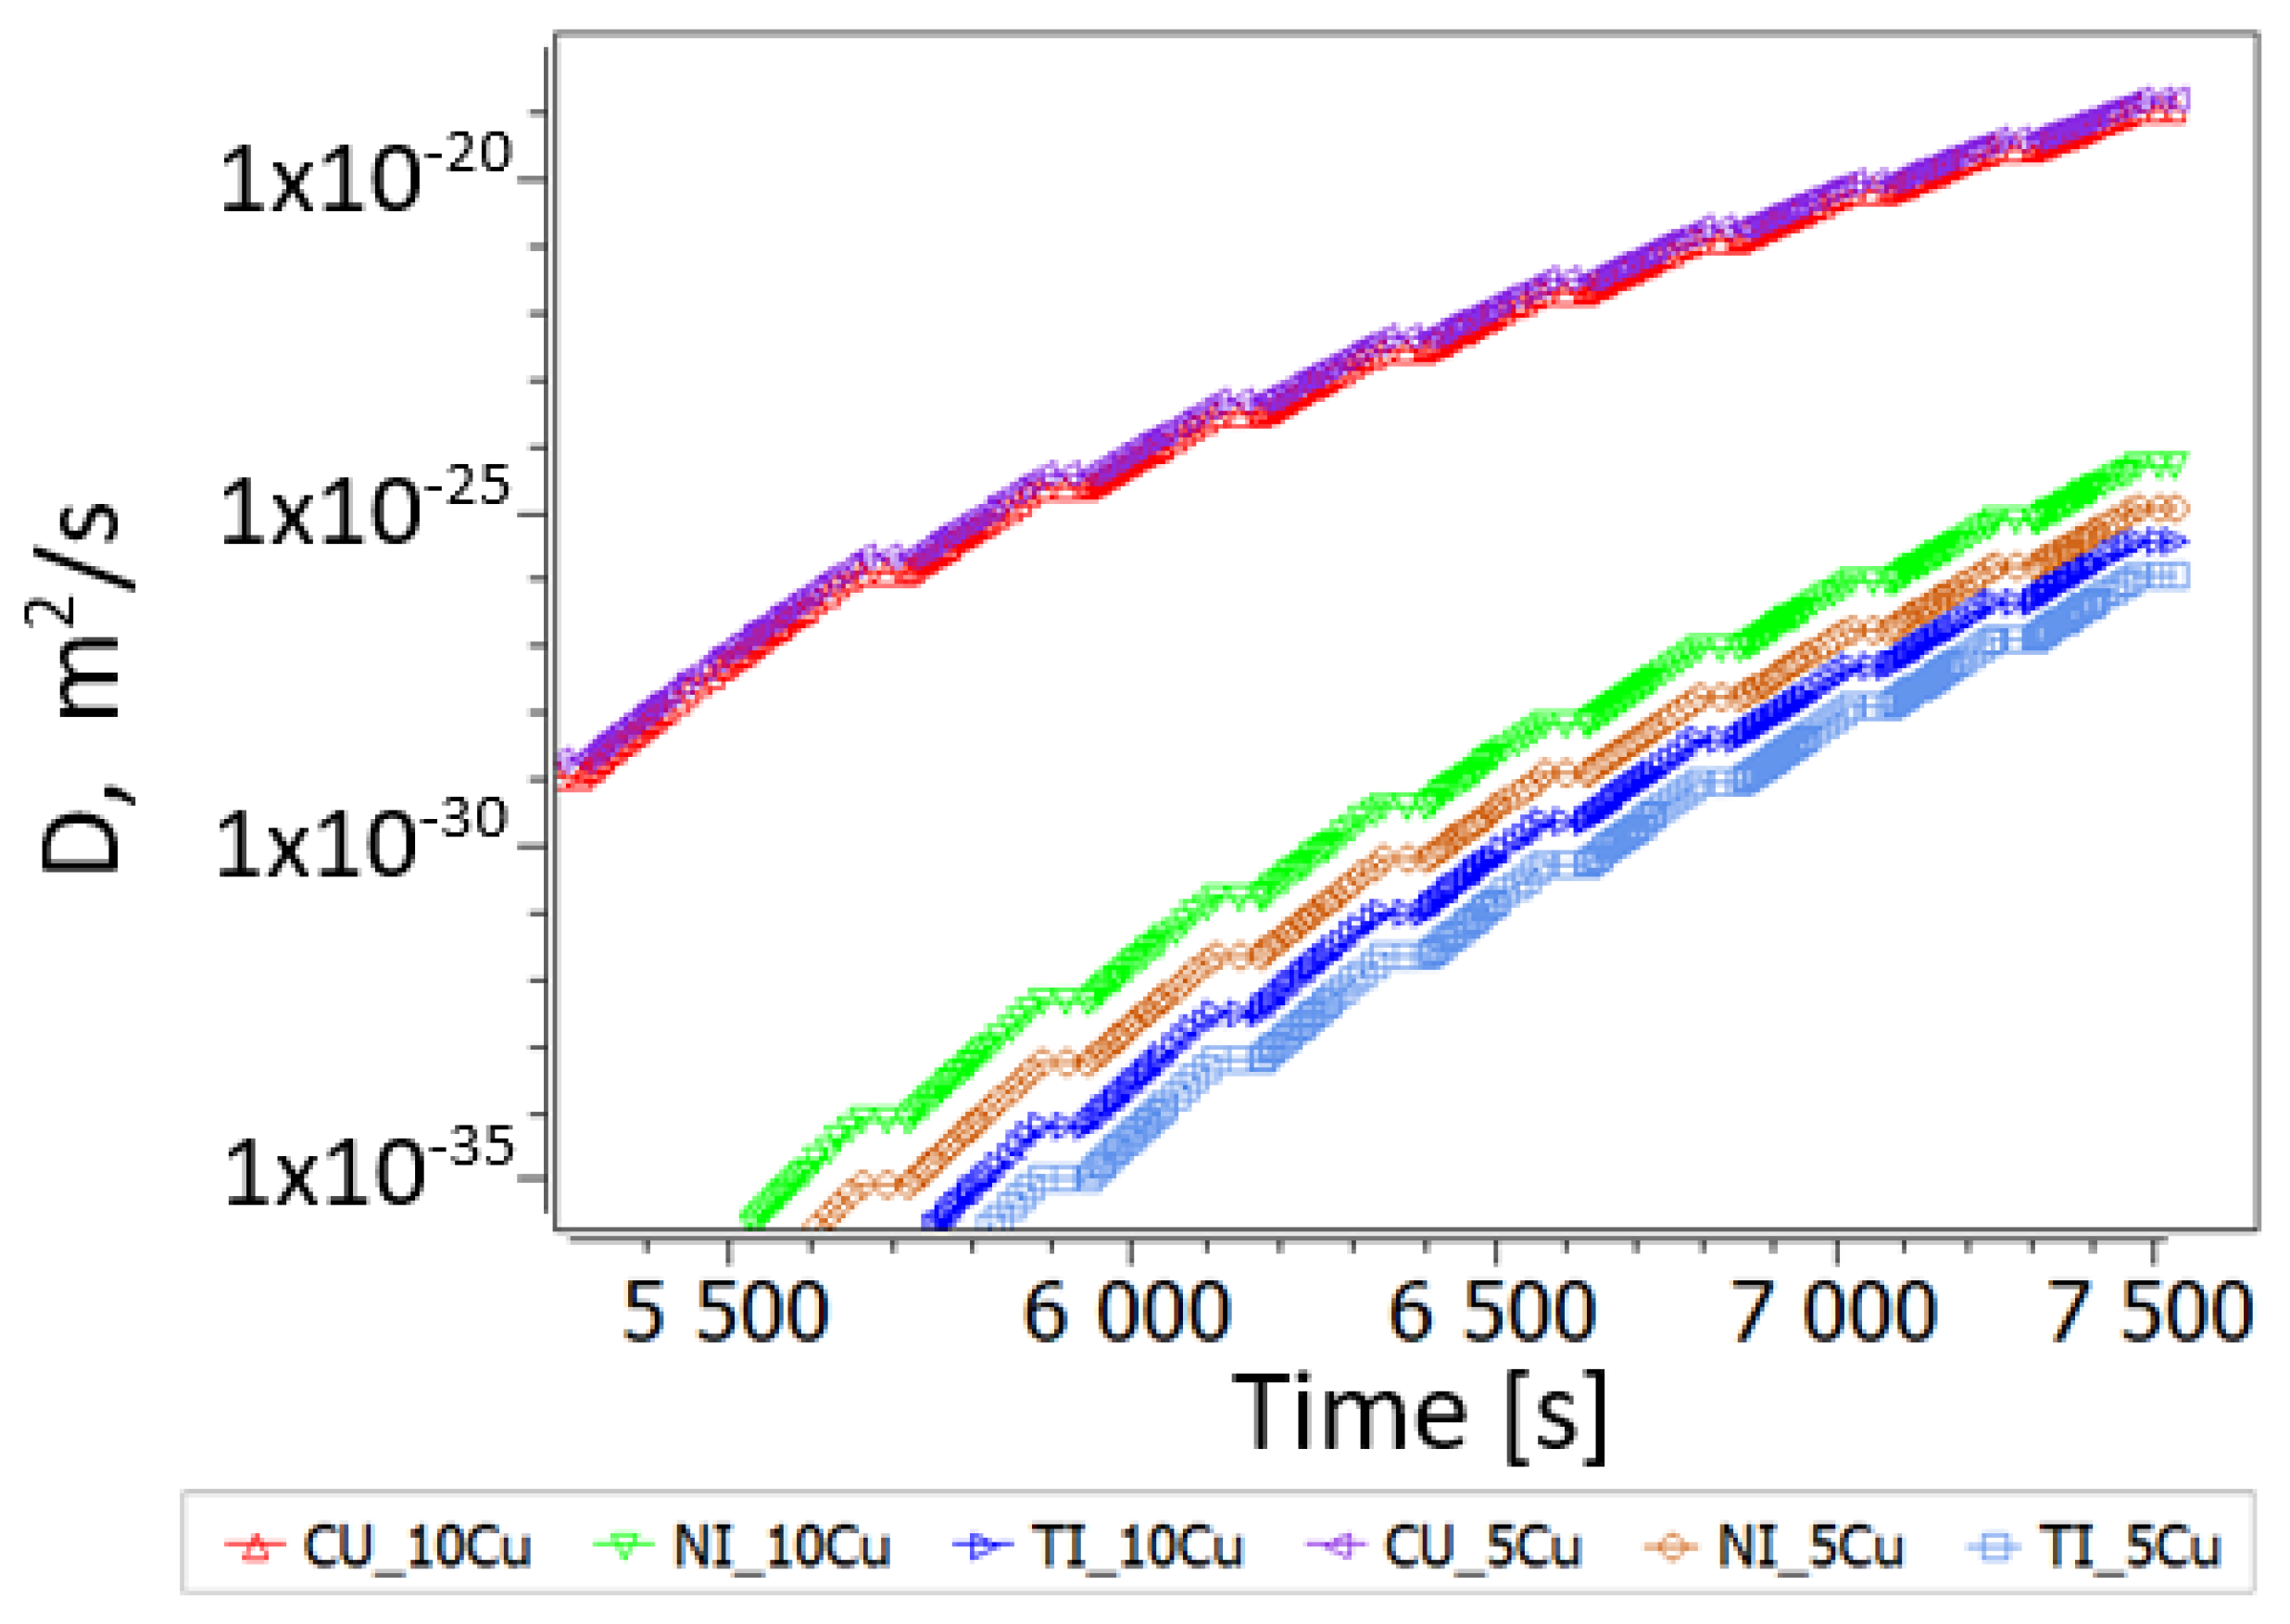
- Sintering
- Aging
3.3. Thermophysical Properties Results
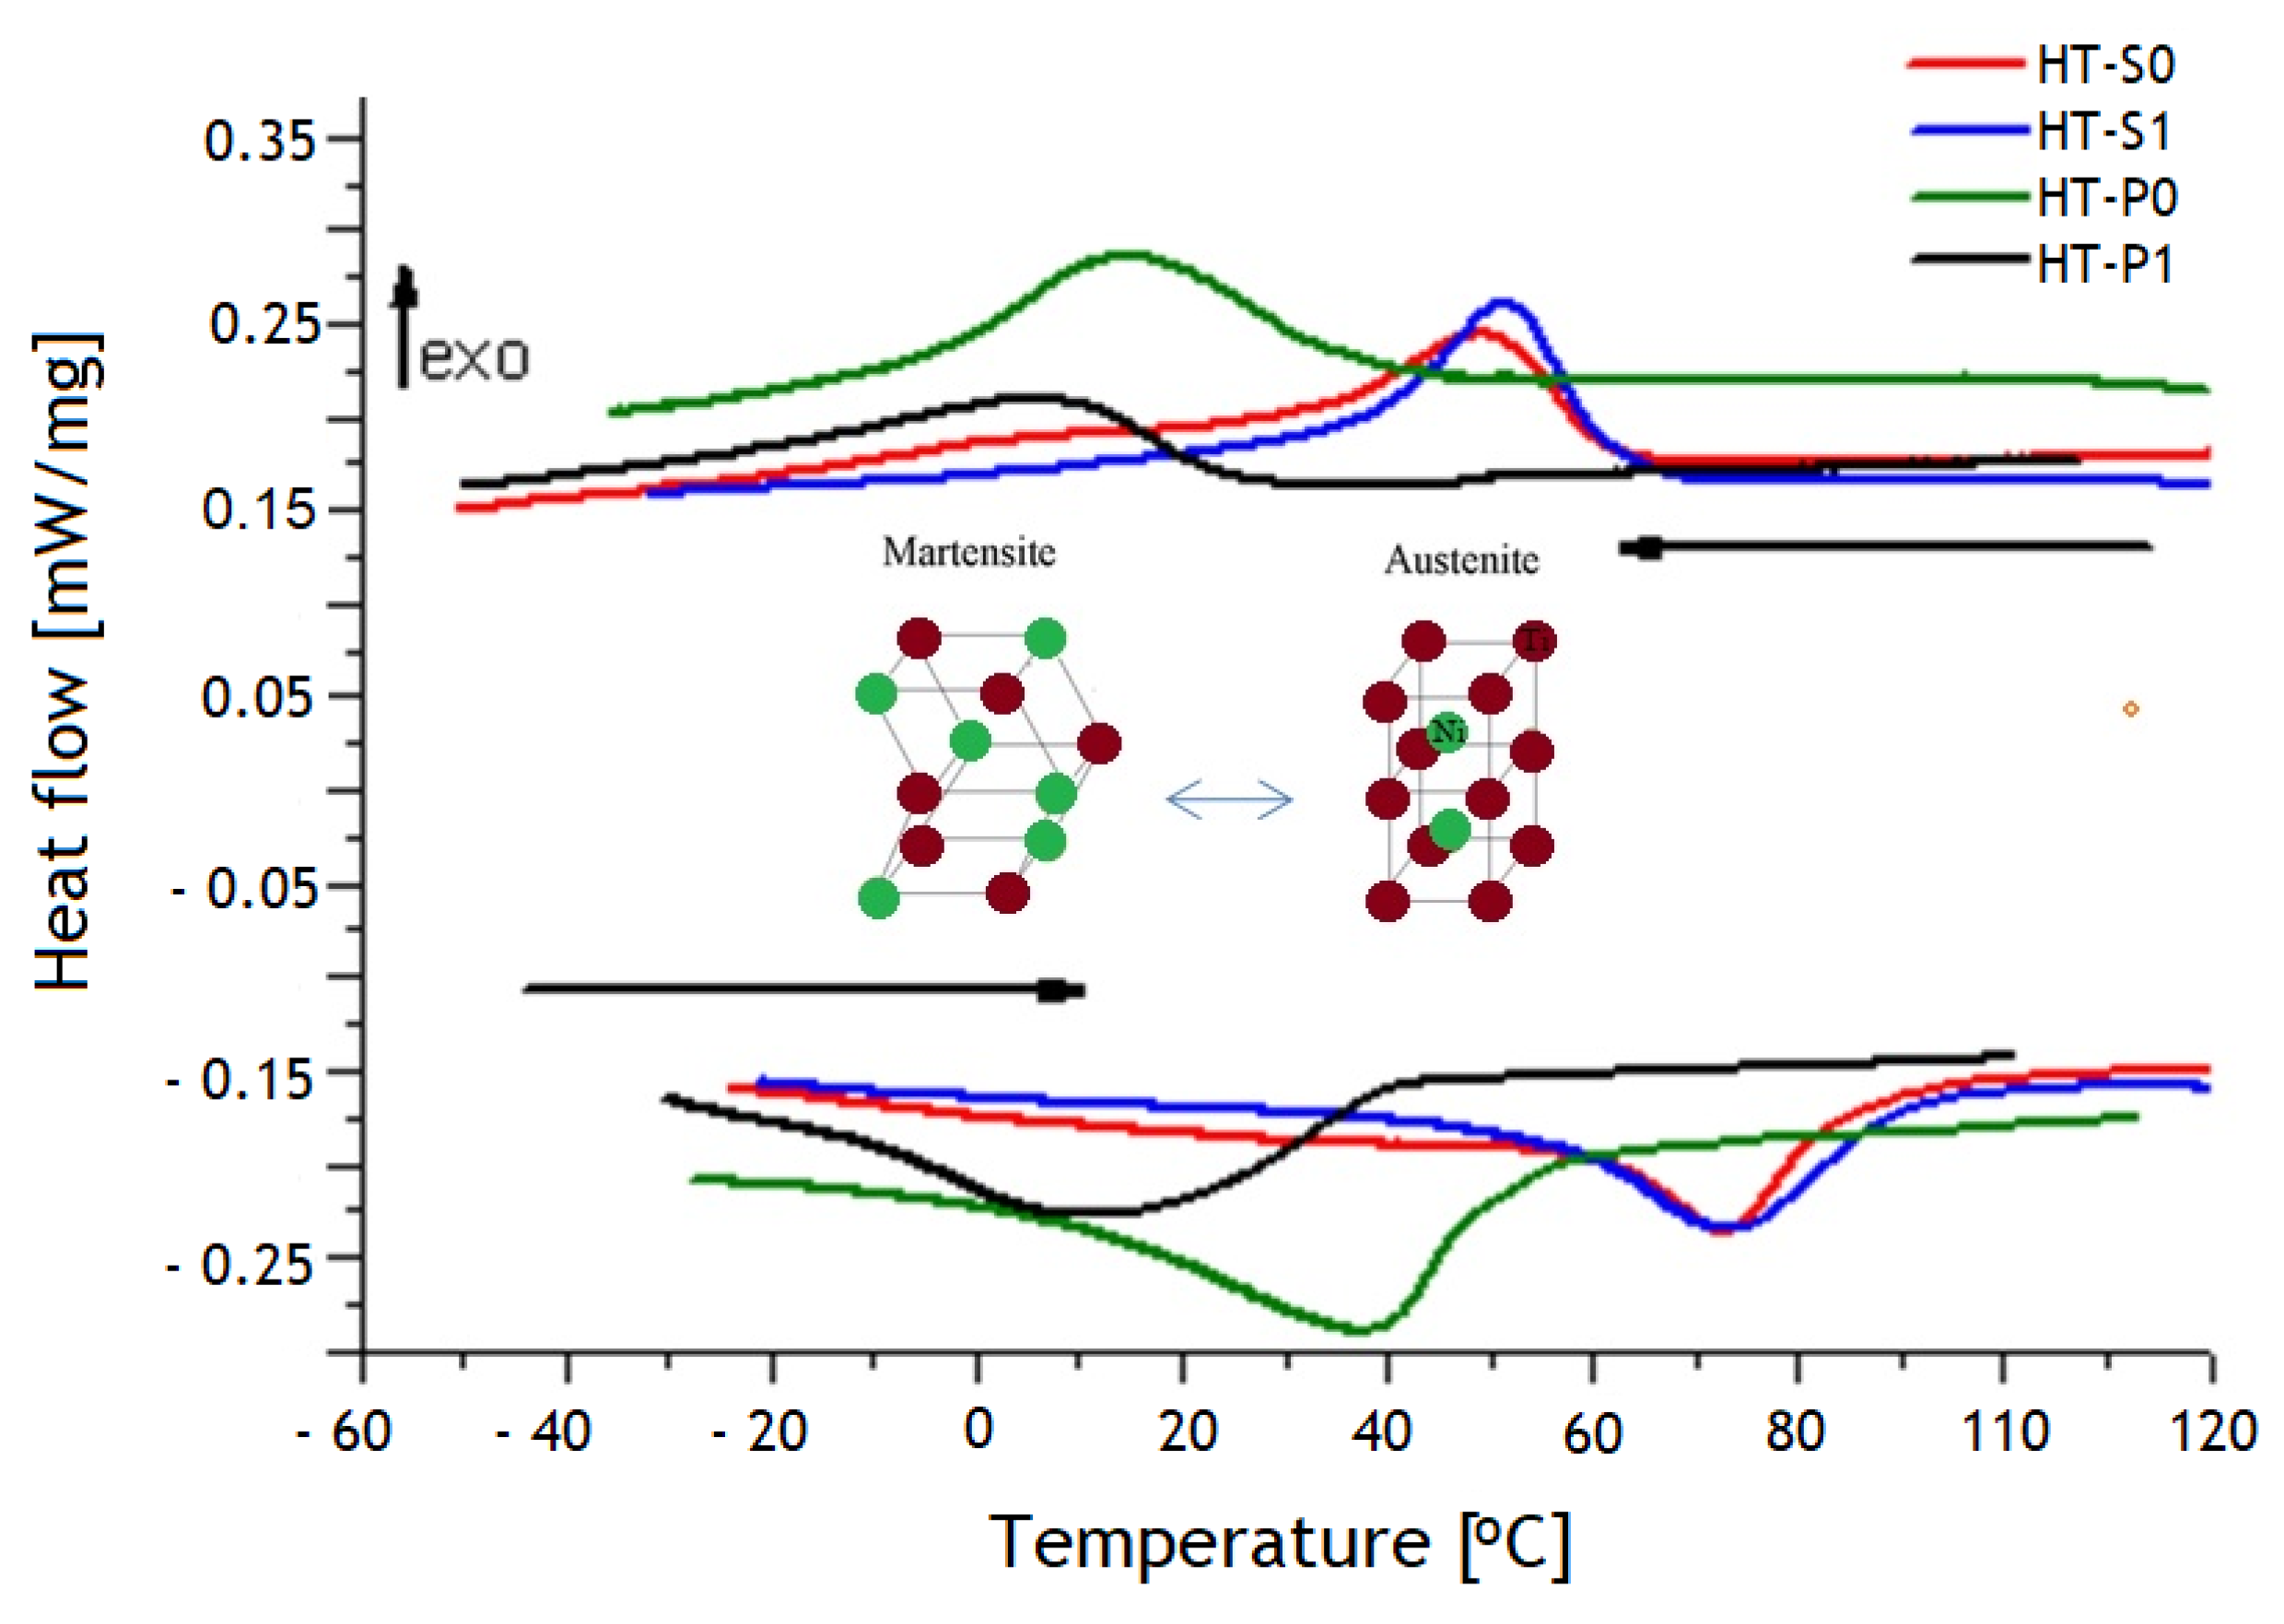
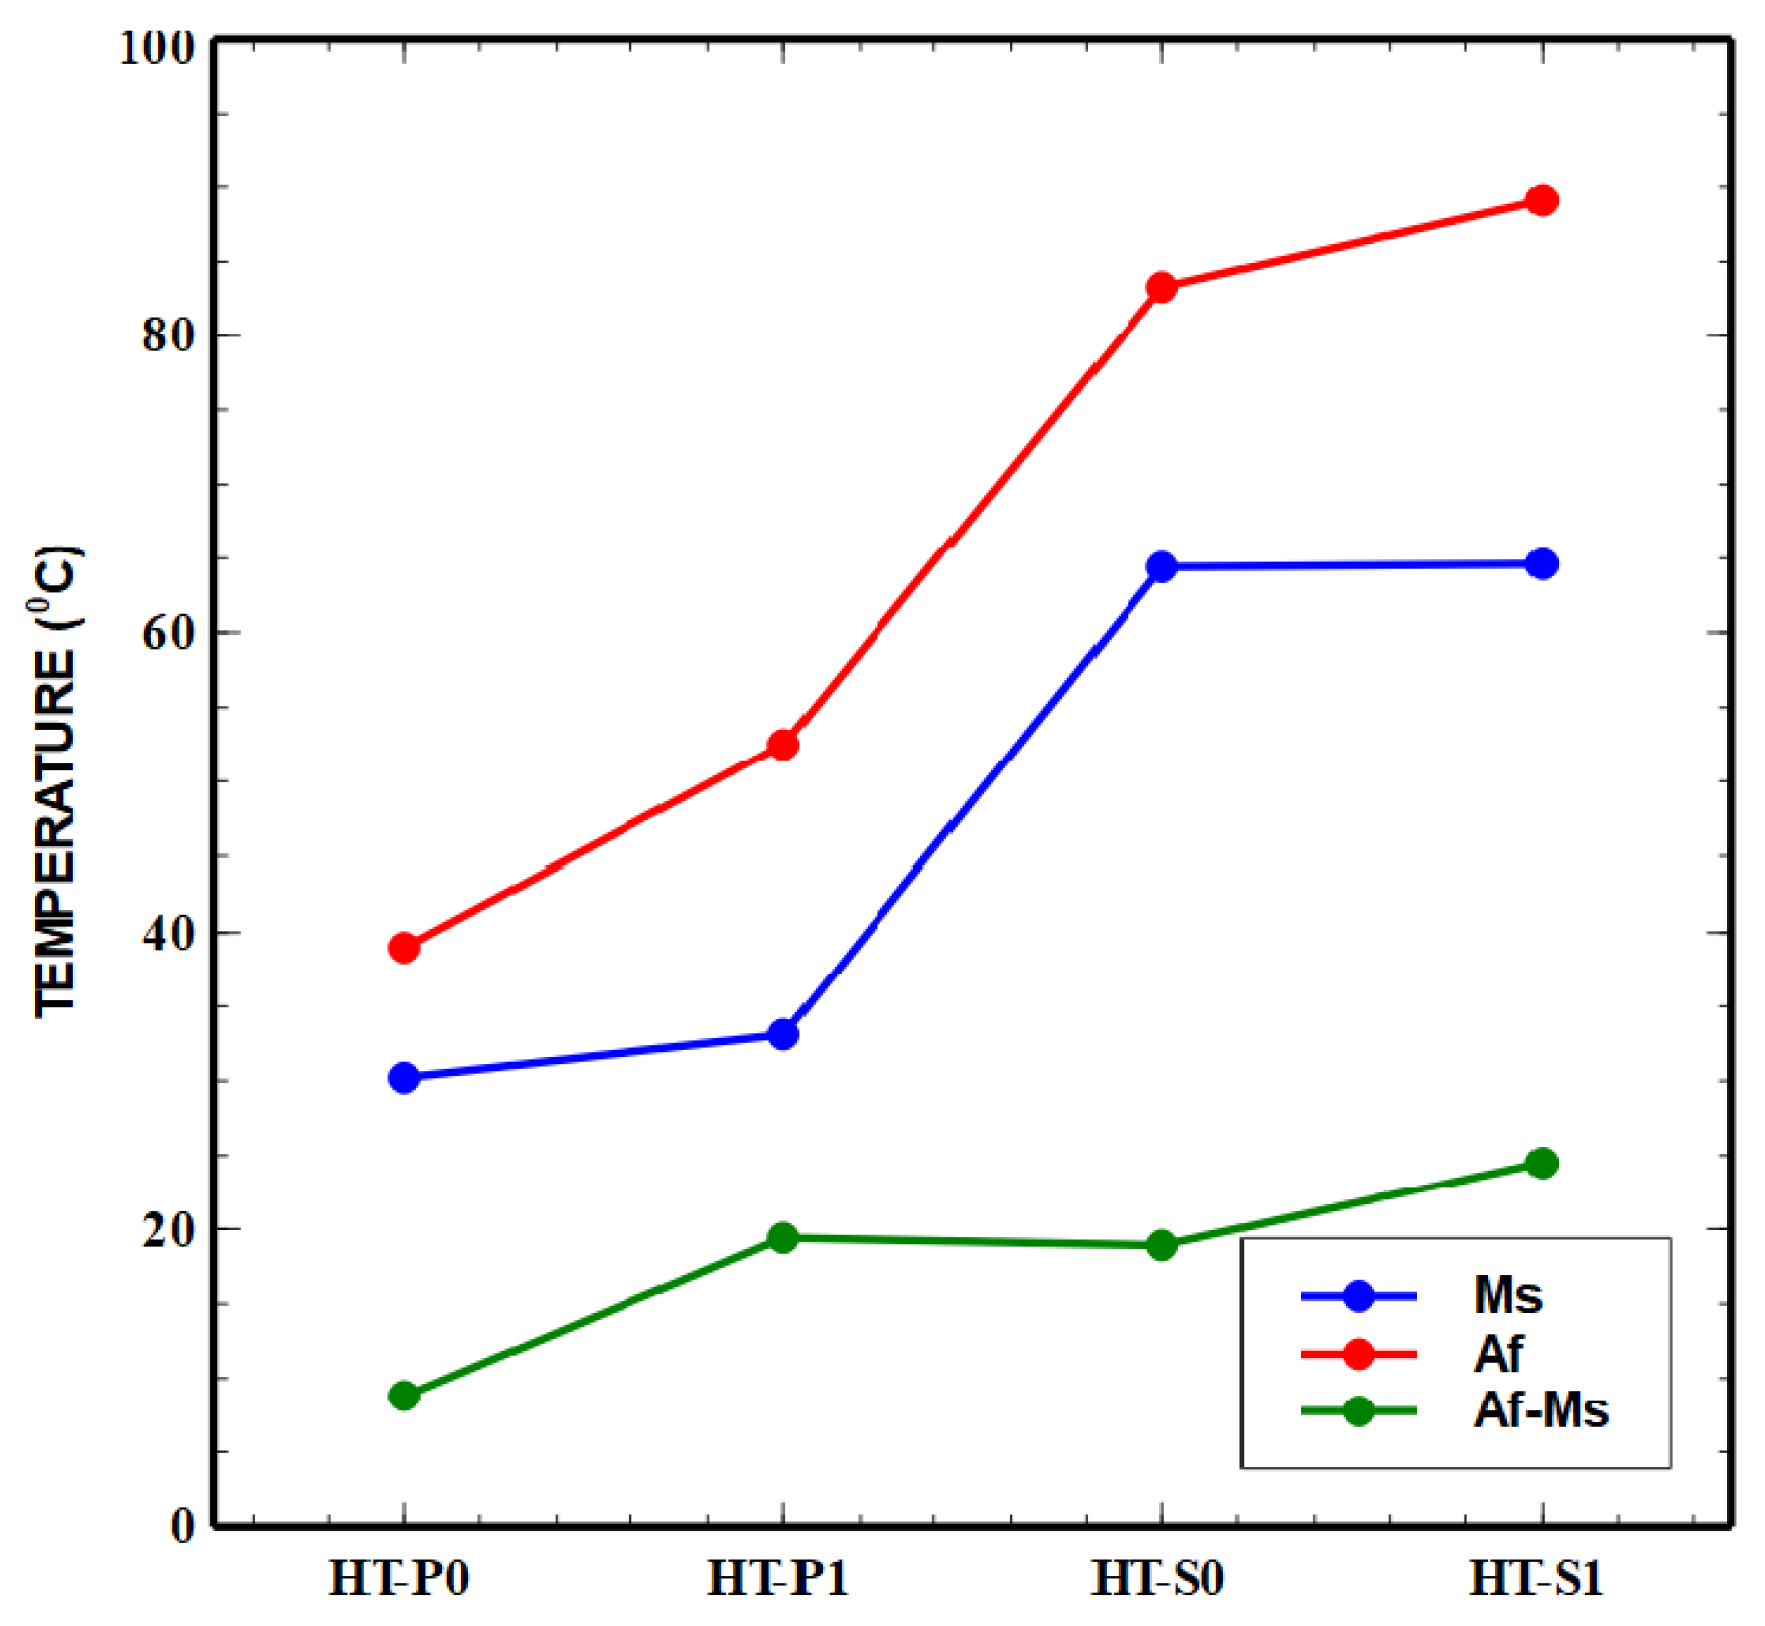
3.3.1. DSC Results and Interpretations of Transformation Characteristics
3.3.2. LFA Results
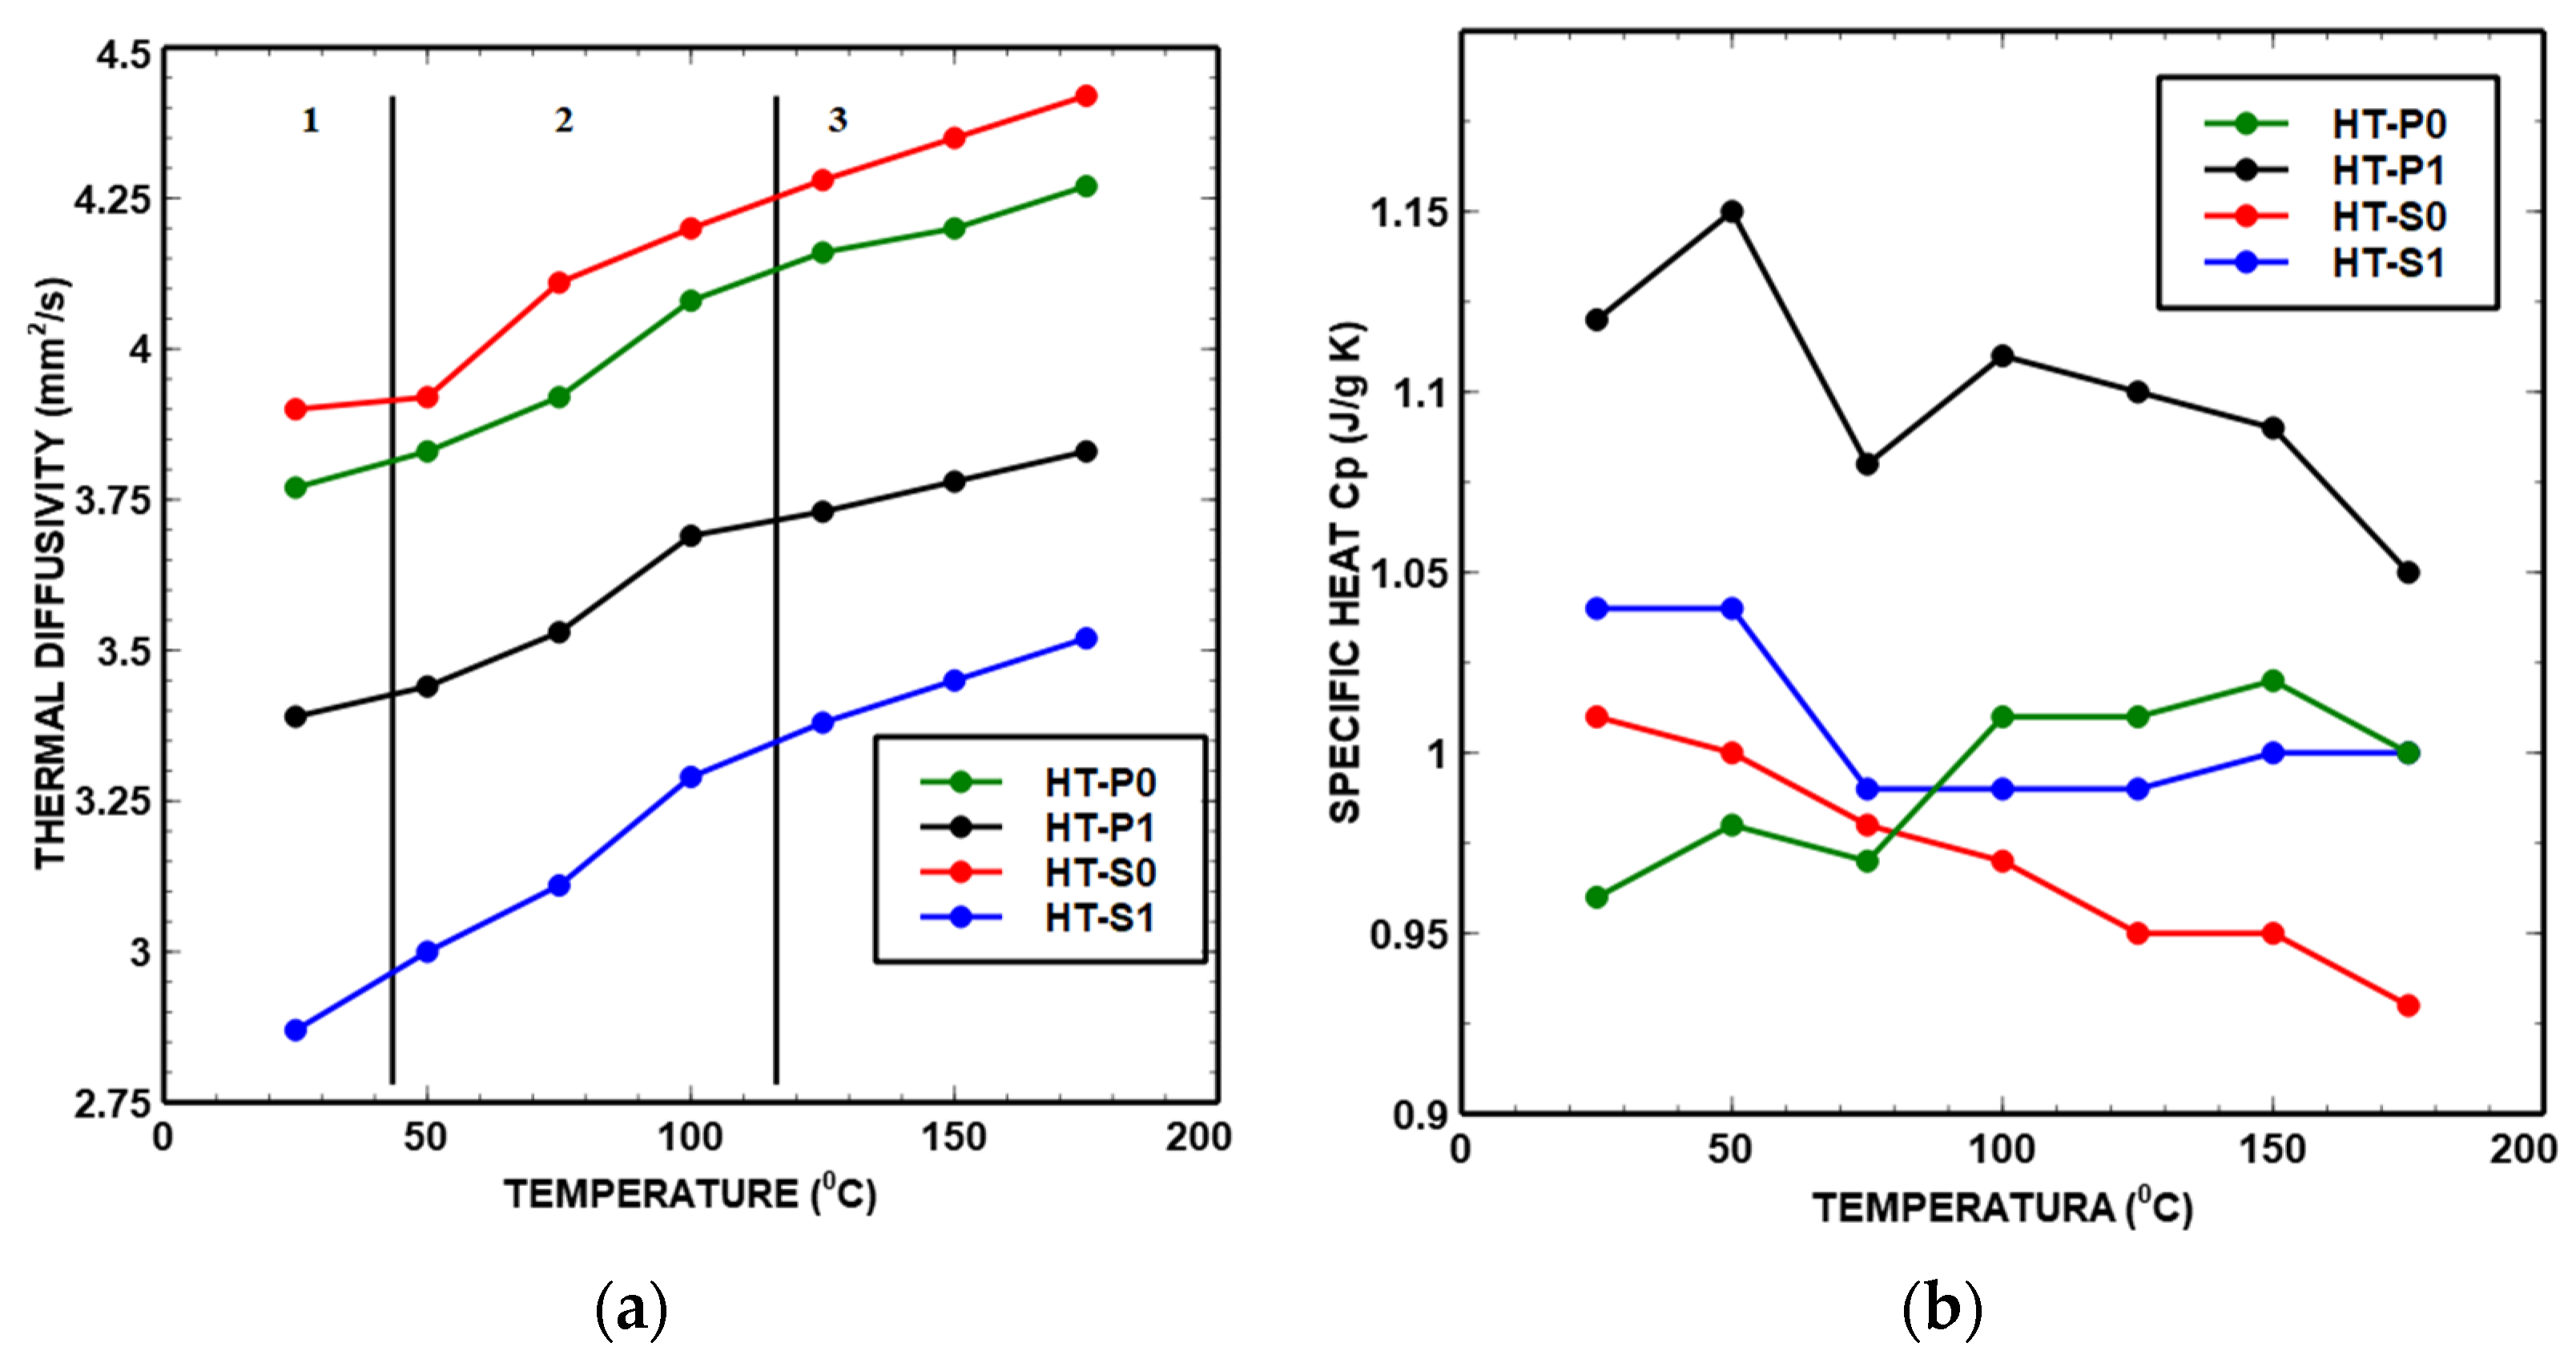
- Thermal diffusivity
- Specific heat
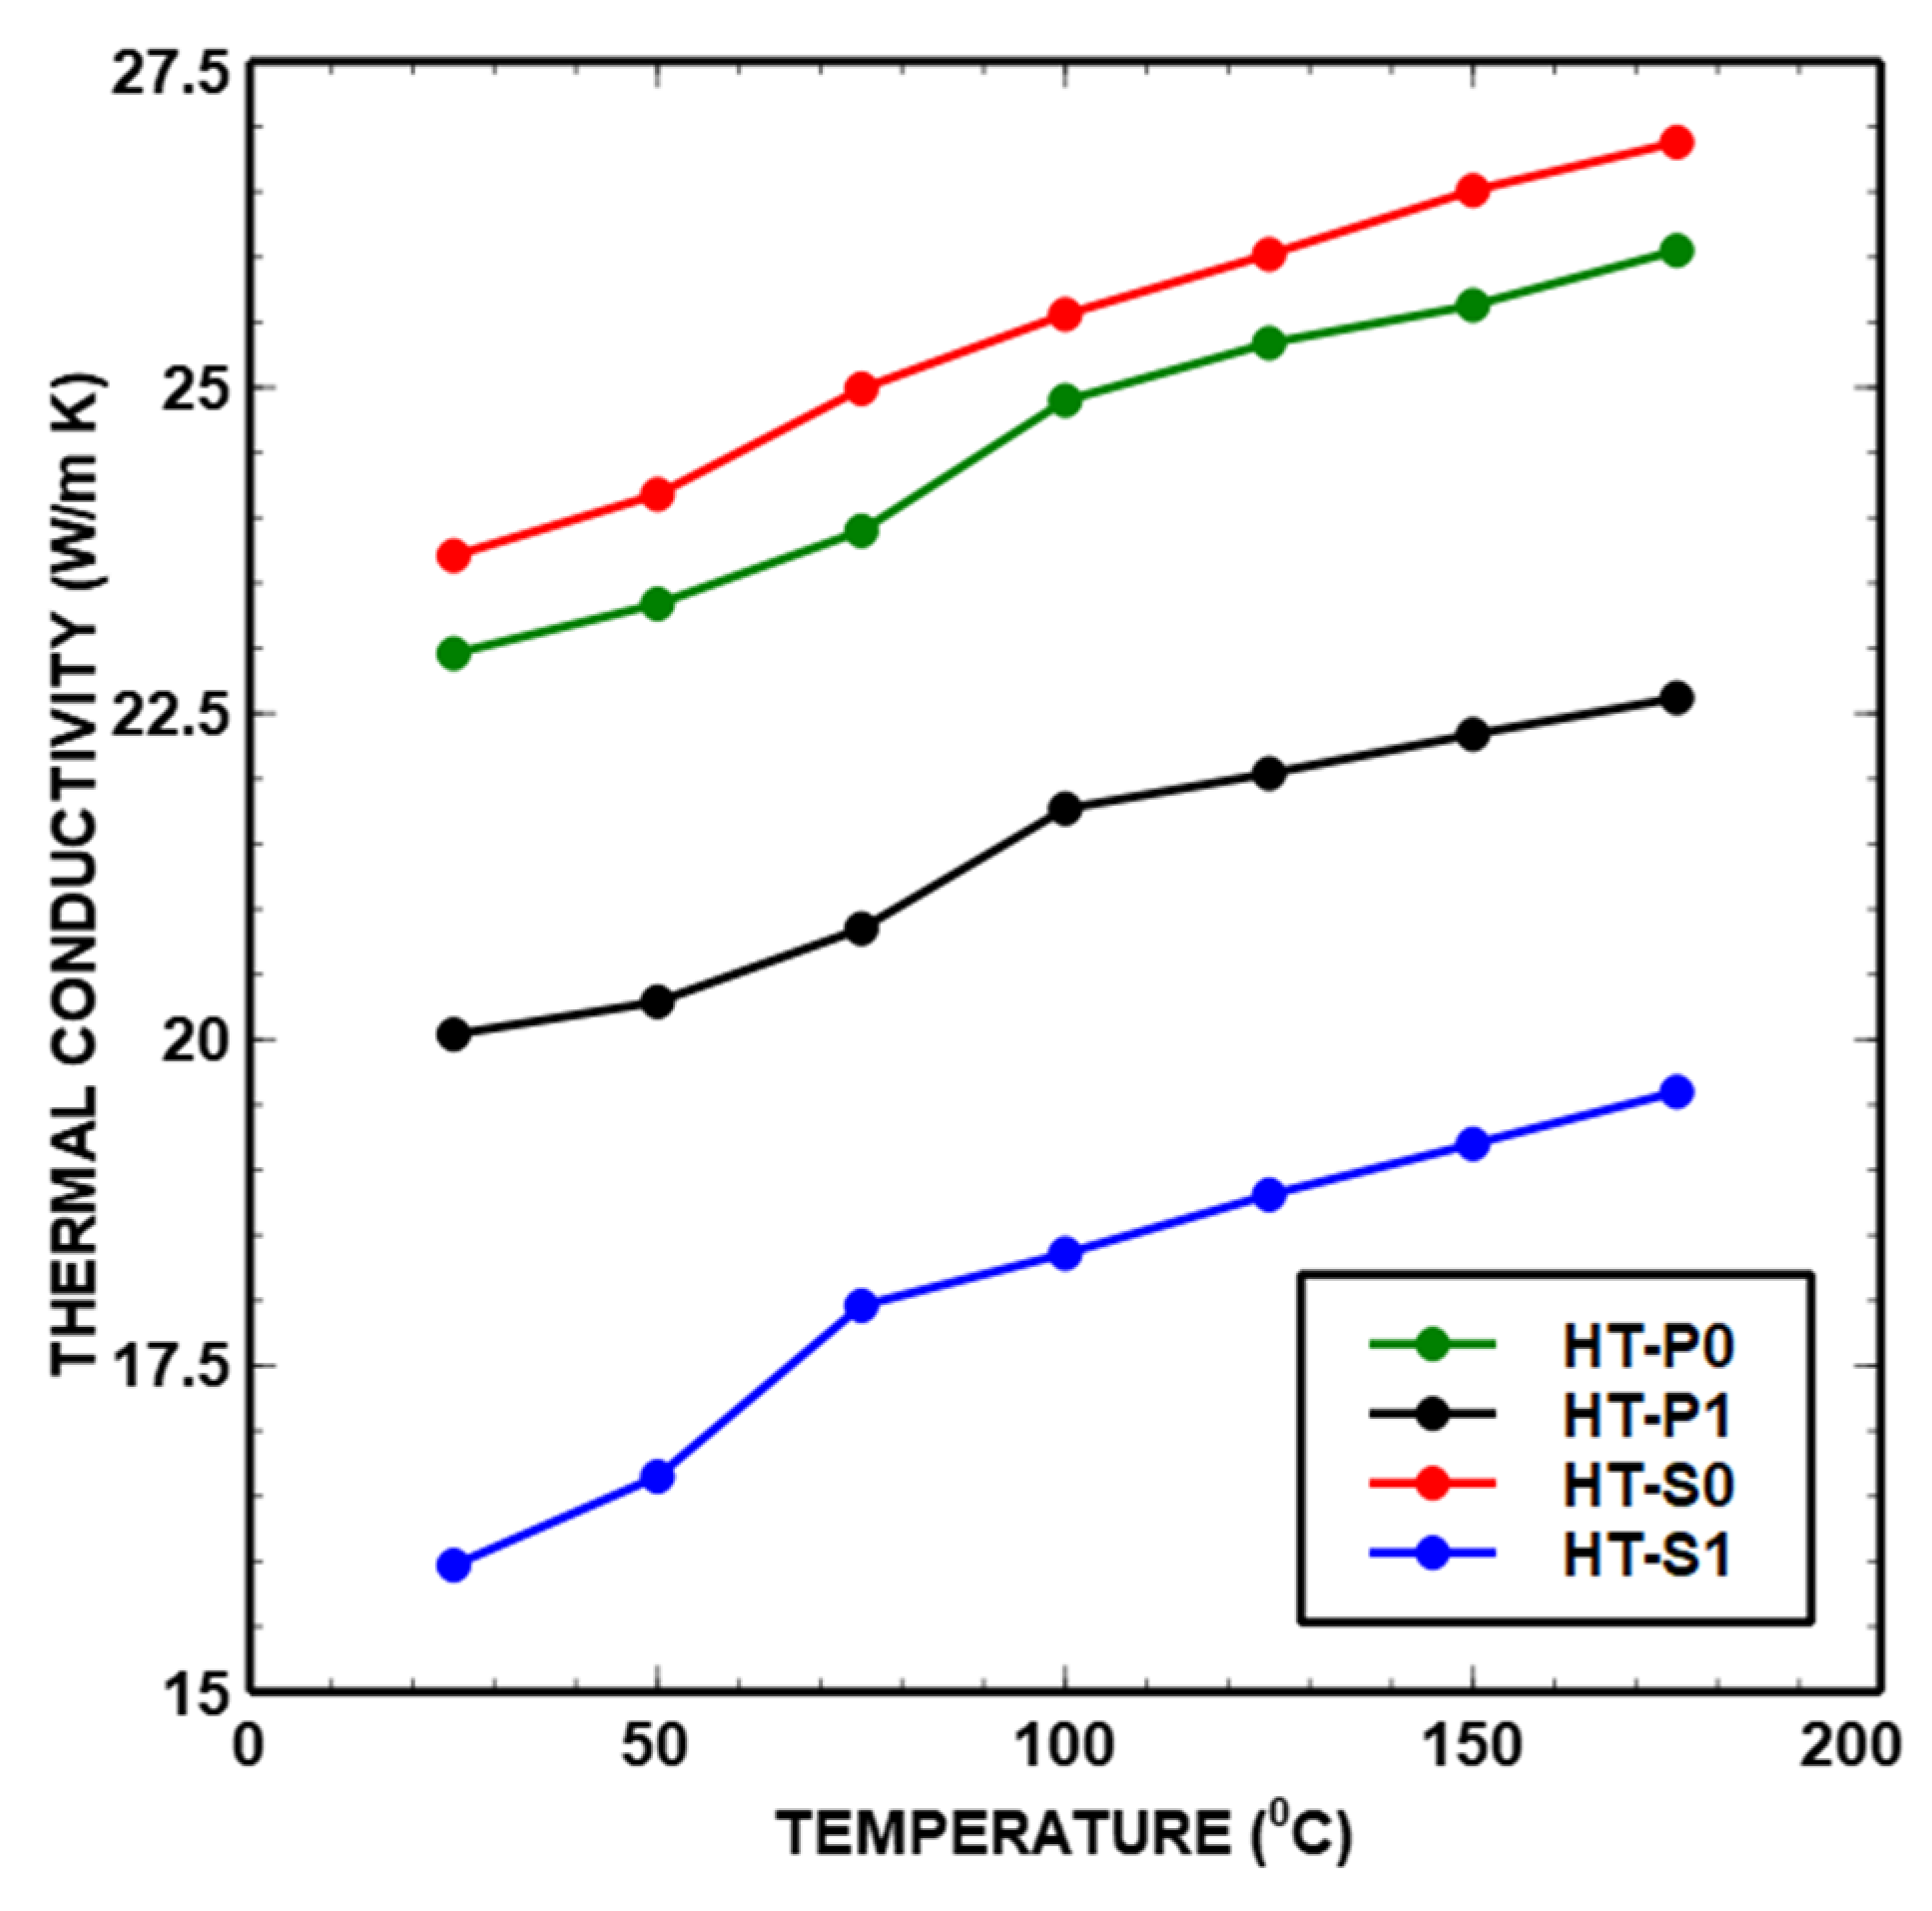
- Thermal conductivity
4. Discussion
4.1. Interrelation between Thermal Properties and Precipitation
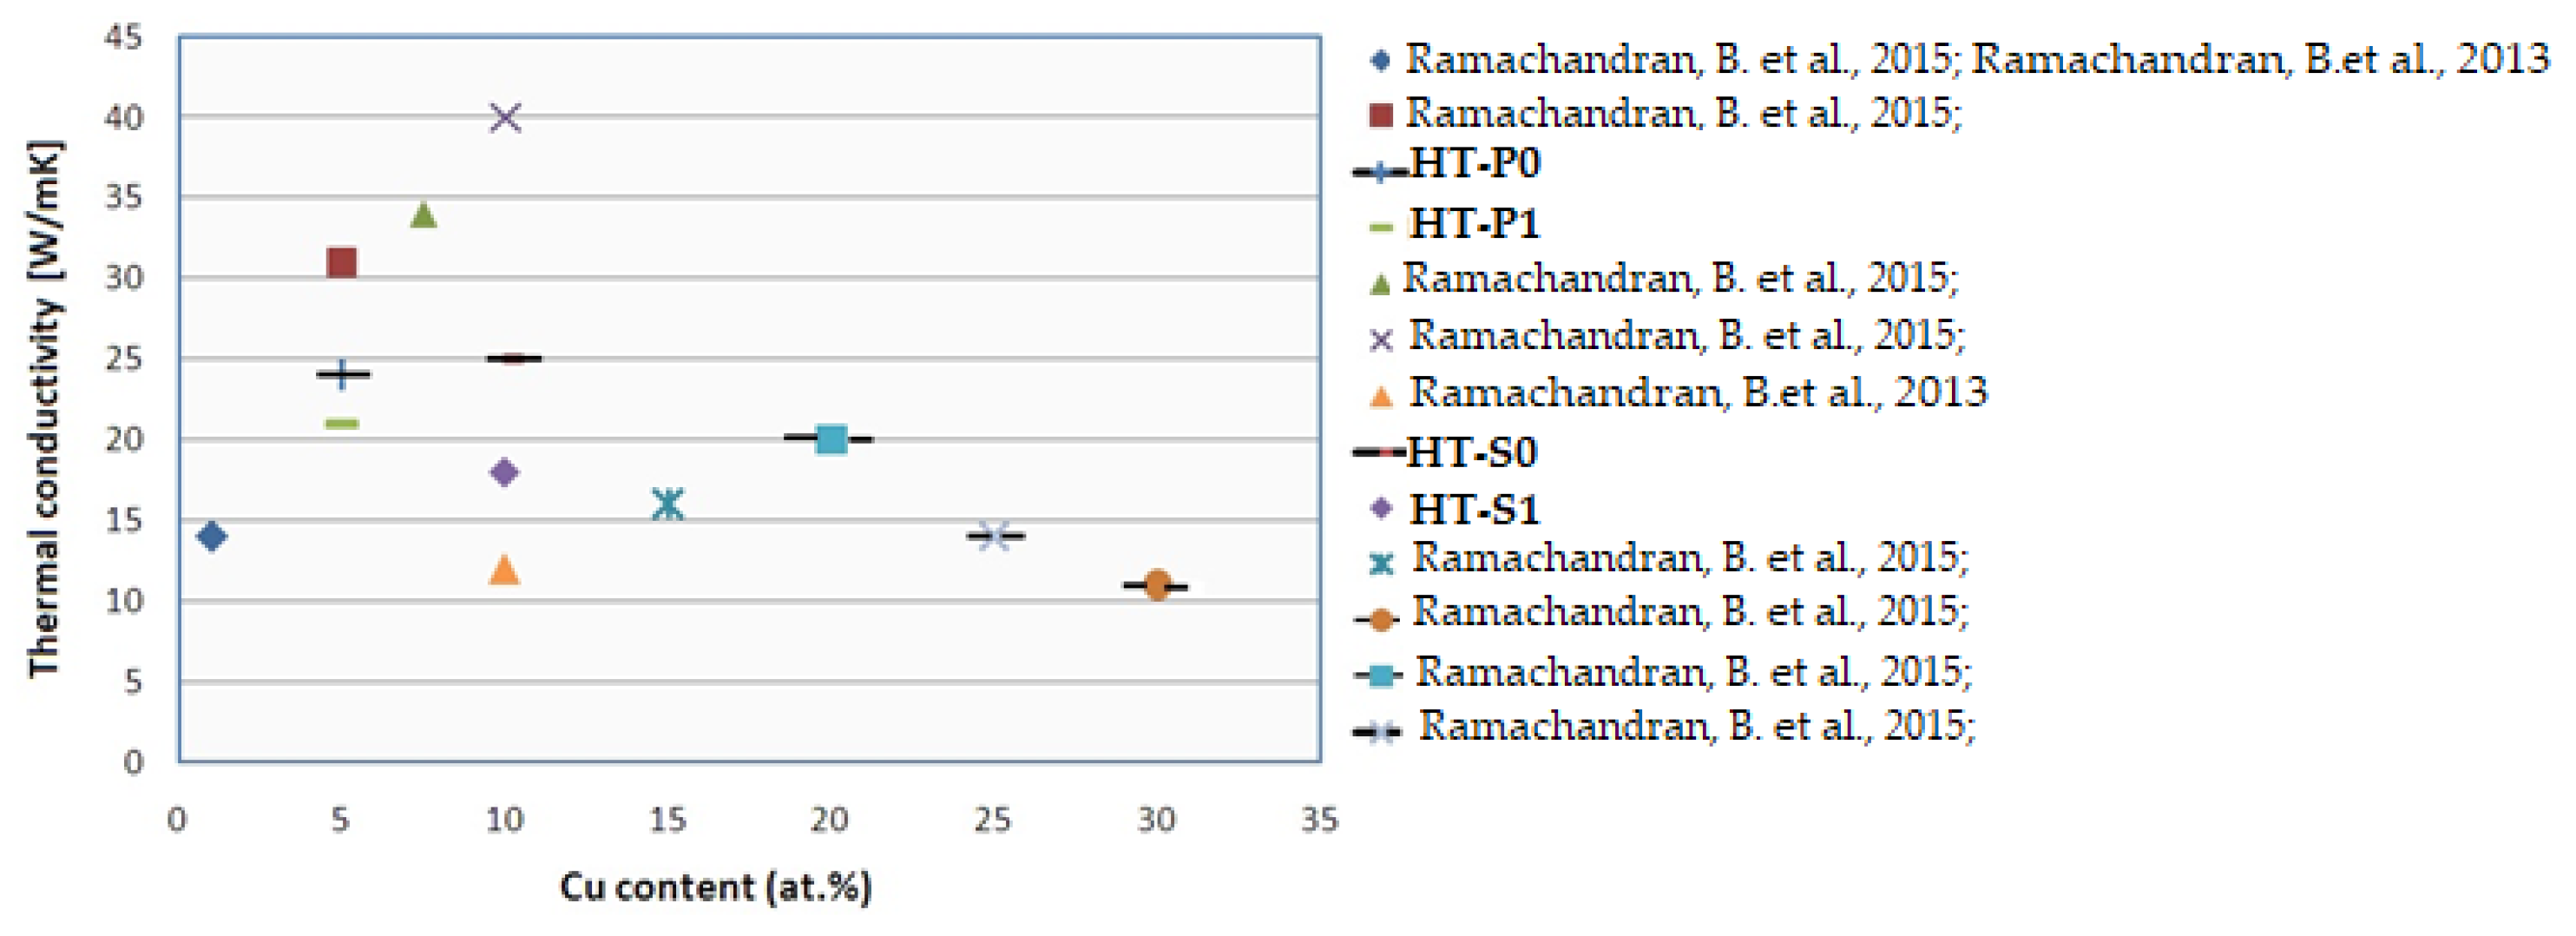
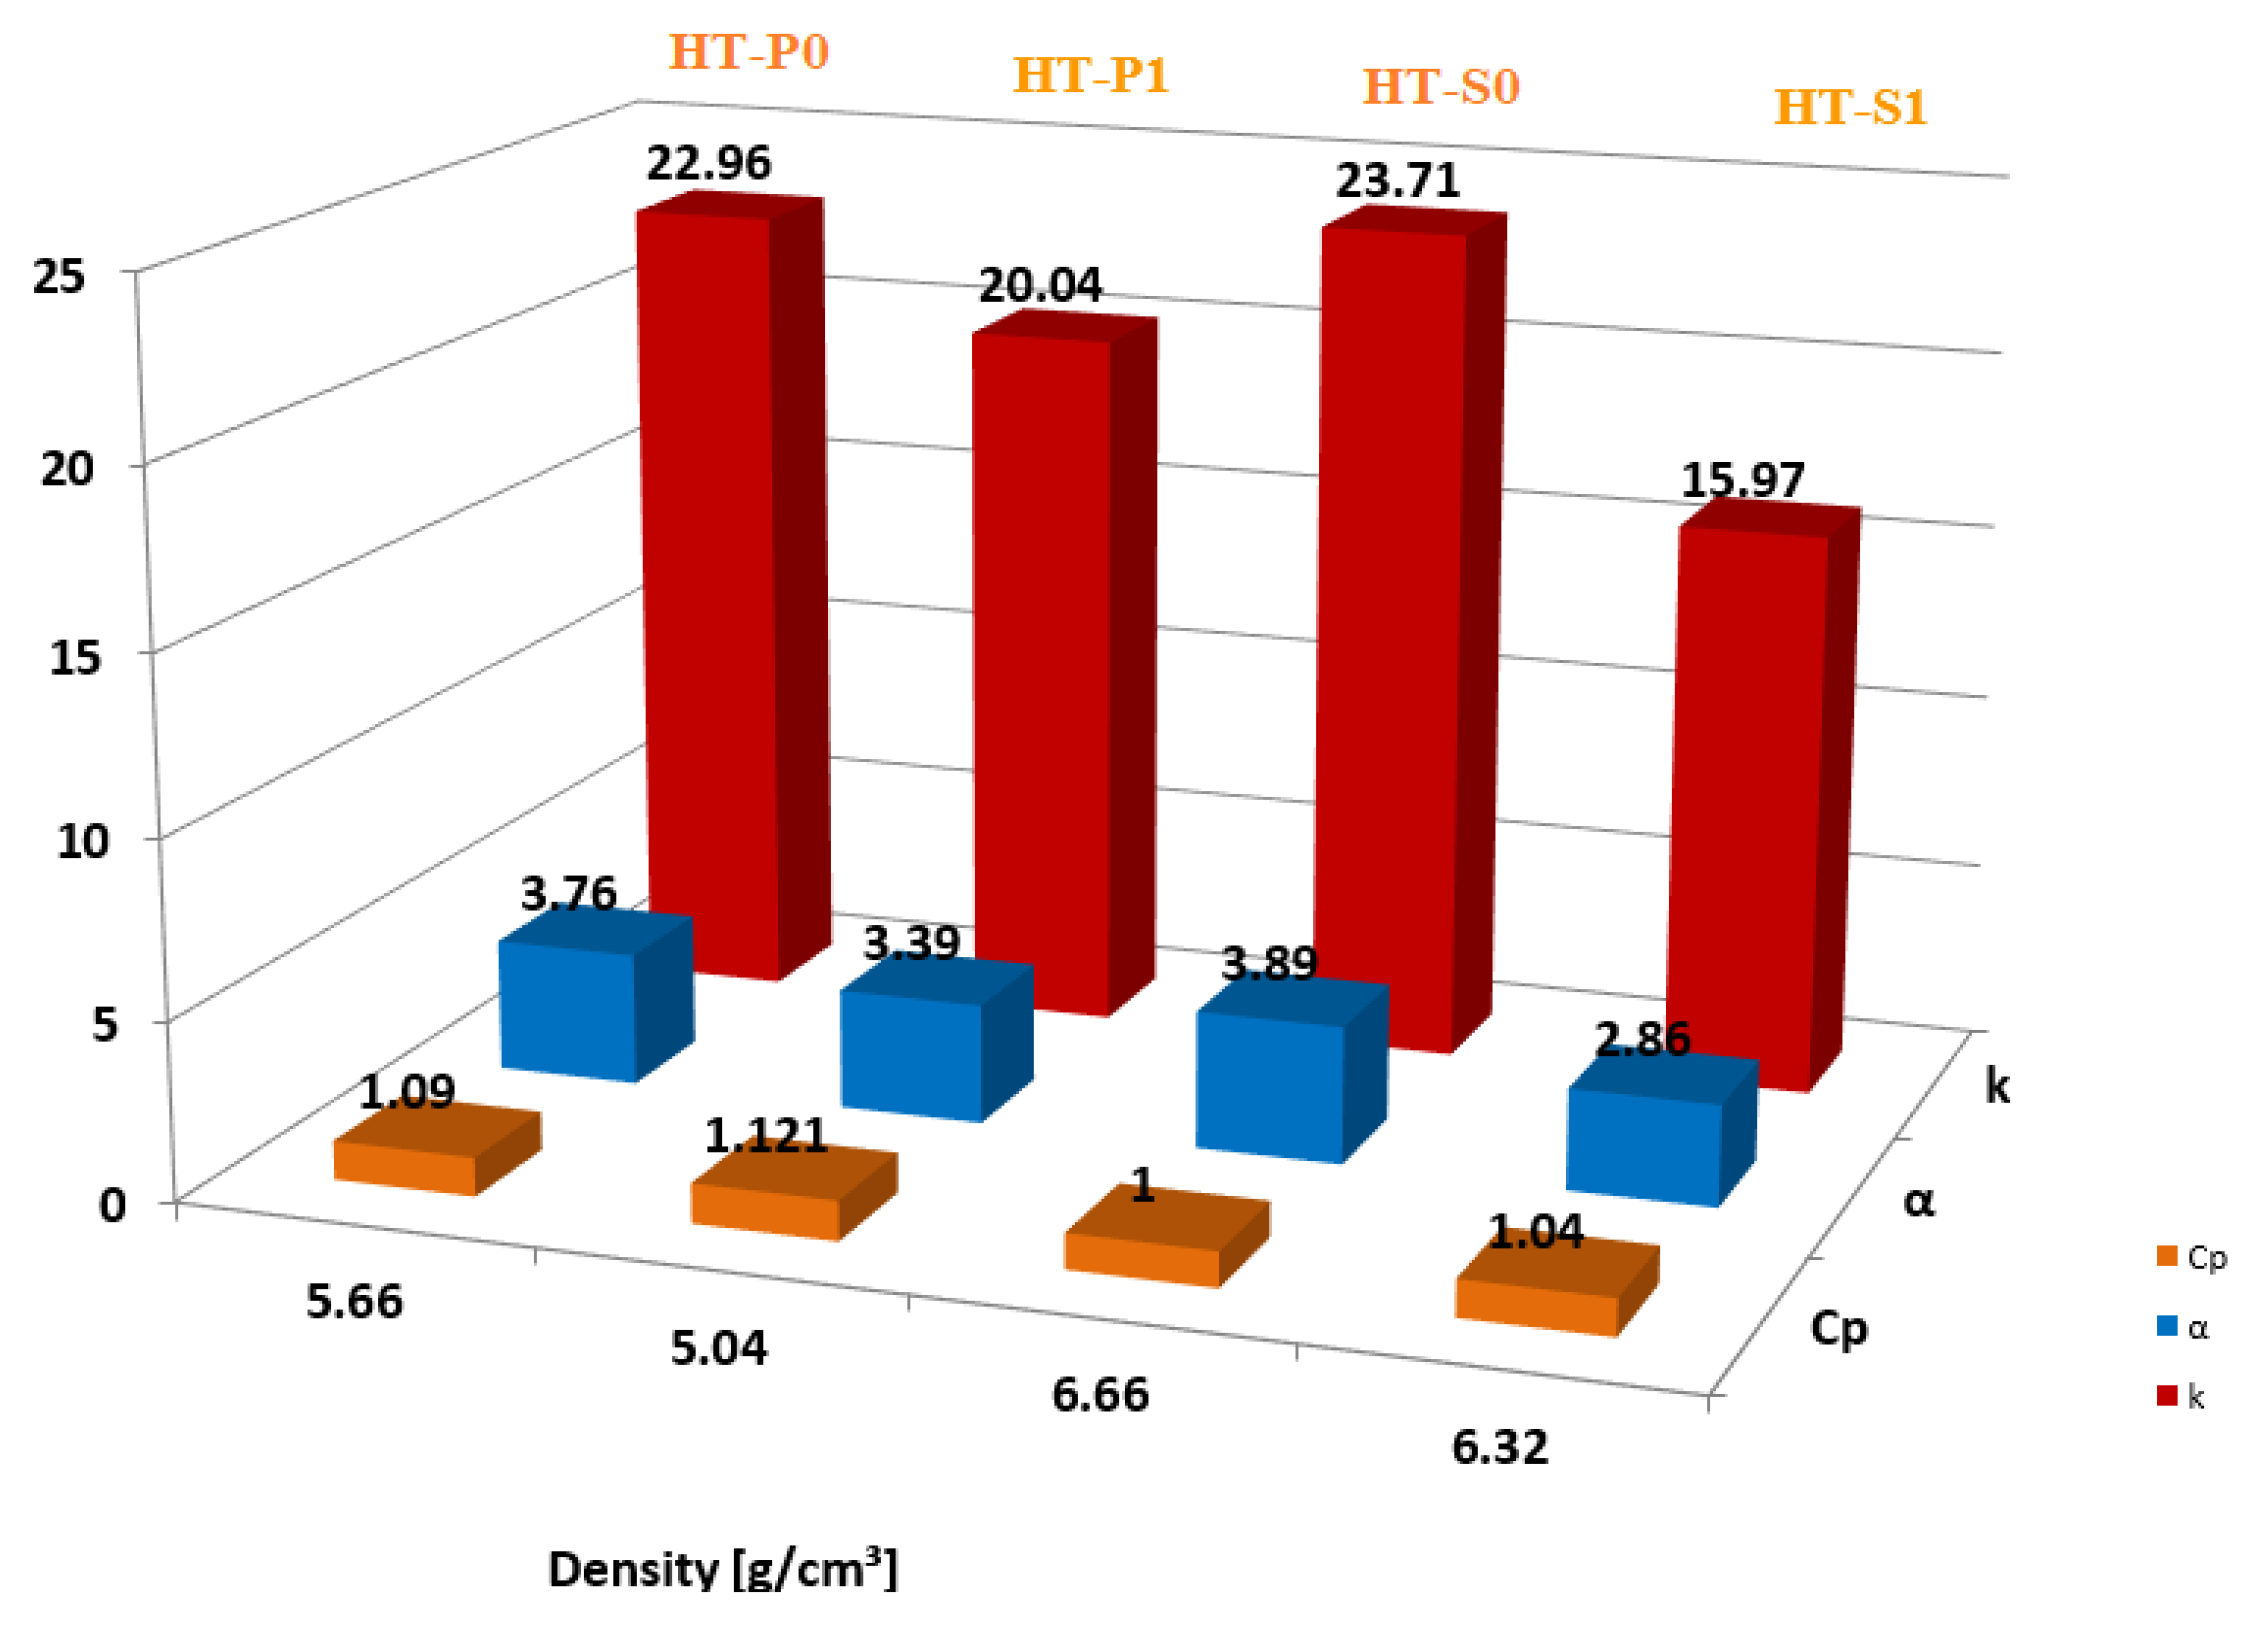
4.2. Interrelation between Thermal Properties and Density
5. Conclusions
Author Contributions
Funding
Data Availability Statement
Acknowledgments
Conflicts of Interest
References
- Cirstea, C.D.; Cirstea, V.; Marinescu, V.; Patroi, D.; Tiganescu, T.V. The Microstructure Influence on Mechanical Properties of Ti50Ni50-XCux Materials Achieved by Spark Plasma Sintering at 800 °C–900 °C. Rom. J. Phys. 2023, 68, 615. [Google Scholar]
- Orru, R.; Licheri, R.; Locci, A.M.; Cincotti, A.; Cao, G. Consolidation/synthesis of materials by electric current activated/assisted sintering. Mat. Sci. Eng. R 2009, 63, 127–287. [Google Scholar] [CrossRef]
- Cirstea, D.; Lungu, M.; Balagurov, A.; Marinescu, V.; Culicov, O.; Sbarcea, G.; Cirstea, V. Shape Memory NiTi and NiTiCu Alloys Obtained by Spark Plasma Sintering Process. Adv. Eng. Forum 2015, 13, 83–90. [Google Scholar] [CrossRef]
- Dong, D.; Cao, Z.; Han, G.; Dong, C. Dual-cluster model of Ti–Cu binary eutectic and composition interpretation of relevant amorphous alloys. AIP Adv. 2021, 11, 035140. [Google Scholar] [CrossRef]
- Yang, X.; Ma, L.; Shang, J. Martensitic transformation of Ti50(Ni50−xCux) and Ni50(Ti50−xZrx) shape-memory alloys. Sci. Rep. 2019, 9, 3221. [Google Scholar] [CrossRef] [PubMed]
- Cirstea, C.D.; Mihai, M.; Cirstea, V.; Patroi, D.; Chivu, H.; Radulescu, F.; Tsakiris, V.; Culicov, O.; Balagurov, A.M. Phase relation in the NiTiCu shape memory materials used in medicine applications. Rev. Roum. Chim. 2017, 62, 539–544. [Google Scholar]
- Samal, S.; Molnárová, O.; Pruša, F.; Kopecek, J.; Heller, L.; Šittner, P.; Škodová, M.; Abate, L.; Blanco, I. Net-Shape NiTi Shape Memory Alloy by Spark Plasma Sintering Method. Appl. Sci. 2021, 11, 1802. [Google Scholar] [CrossRef]
- Copaci, D.; Blanco, D.; Moreno, L.E. Flexible Shape-Memory Alloy-Based Actuator: Mechanical Design Optimization According to Application. Actuators 2019, 8, 63. [Google Scholar] [CrossRef]
- Goryczka, T.; Vanhumbeeck, J. NiTiCu shape memory alloy produced by powder technology. J. Alloys Compd. 2008, 456, 194–200. [Google Scholar] [CrossRef]
- Li, Y.H.; Rong, L.J.; Wang, Z.T.; Qi, G.X.; Wang, C.Z. Temperature memory effect of Ti50Ni30Cu20 (at.%) alloy. J. Alloys Compd. 2005, 400, 112–115. [Google Scholar] [CrossRef]
- Otsuka, K.; Ren, X. Physical metallurgy of Ti-Ni-based shape memory alloys. Prog. Mater. Sci. 2005, 50, 511–678. [Google Scholar] [CrossRef]
- Oshida, Y.; Tominaga, T. Fabrication, synthesis, and product forms. In Biomedical Application; Walter de Gruyter GmbH & Co. KG: Berlin, Germany, 2020. [Google Scholar] [CrossRef]
- Novák, P.; Moravec, H.; Vojtìch, V.; Knaislová, A.; Skoláková, A.; Kubatík, T.F.; Kopecek, J. Powder-metallurgy preparation of NiTi shape-memory alloy using mechanical alloying and spark-plasma sintering. Mater. Tehnol. 2017, 51, 141–144. [Google Scholar] [CrossRef]
- Meng, X.L.; Sato, M.; Ishida, A. Structure of martensite in sputter-deposited (Ni,Cu)-rich Ti–Ni–Cu thin films containing Ti(Ni,Cu)2 precipitates. Acta Mater. 2009, 57, 1525–1535. [Google Scholar] [CrossRef]
- Nam, T.H.; Hur, S.G.; Ahn, I.S. Phase transformation behaviours of Ti-Ni-Cu shape memory alloy powders fabricated by mechanical alloying. Met. Mater. Int. 1998, 4, 61–66. [Google Scholar] [CrossRef]
- Munir, Z.A.; Anselmi-Tamburini, U. The effect of electric field and pressure on the synthesis and consolidation of materials: A review of the spark plasma sintering method. J. Mat. Sci. 2006, 41, 763–777. [Google Scholar] [CrossRef]
- Povoden-Karadeniz, E.; Cirstea, D.C.; Kozeschnik, E. Prediction of precipitate evolution and martensite transformation in Ti-Ni-Cu shape memory alloys by computational thermodynamics. IOP Conf. Ser. Mater. Sci. Eng. 2016, 123, 012038. [Google Scholar] [CrossRef]
- Warczok, P. MatCalc Engineering. Available online: https://www.matcalc-engineering.com/images/external/PDF-Files/nucleation-sites.pdf (accessed on 1 January 2023).
- Ye, L.L.; Liu, Z.G.; Raviprasad, K.; Quan, M.X.; Umemoto, M.; Hu, Z.Q. Consolidation of MA amorphous NiTi powders by spark plasma sintering. Mat. Sci. Eng. A 1998, 241, 290–293. [Google Scholar] [CrossRef]
- Ramachandran, B.; Chen, C.H.; Chang, P.C.; Kuo, Y.K.; Chien, C.; Wu, S.K. Thermal and transport properties of as-grown Ni-rich NiTi shape memory alloys. Intermetallics 2015, 60, 79–85. [Google Scholar] [CrossRef]
- Ramachandran, B.; Tang, R.C.; Chang, P.C.; Kuo, Y.K.; Chien, C.; Wu, S.K. Cu-substitution effect on thermoelectric properties of the NiTi-based shape memory alloys. J. Appl. Phys. 2013, 113, 203702. [Google Scholar] [CrossRef]
- Parker, W.J.; Jenkins, R.J.; Butler, C.P.; Abbott, G.L. A flash method of determining thermal diffusivity, heat capacity, and thermal conductivity. J. Appl. Phys. 1961, 32, 9. [Google Scholar] [CrossRef]
- Min, S.; Blumm, J.; Lindemann, A. A new laser flash system for measurement of the thermophysical properties. Thermochim. Acta 2007, 455, 46–49. [Google Scholar] [CrossRef]
- Percent Crystallinity by the XRD Integration Method. Available online: https://mcl.mse.utah.edu/xrd-crystallinity-by-integration/ (accessed on 1 December 2023).
- Lang, L.; Payne, A.; Valencia-Jaime, I.; Verstraete, M.J.; Bautista-Hernandez, A.; Romero, A.H. Assessing Nickel Titanium Binary Systems Using Structural Search Methods and Ab Initio Calculations. J. Phys. Chem. C 2021, 125, 1578–1591. [Google Scholar] [CrossRef]
- Povoden-Karadeniz, E.; Cirstea, D.C.; Lang, P.; Kozeschnik, E. Thermodynamics of Ti–Ni shape memory alloys. Calphad 2013, 41, 128–139. [Google Scholar] [CrossRef]
- Zhang, H.; Yang, H.; Yang, F.; Liu, H.; Jin, Z. Thermodynamic Assessment of Cu-Ni-Ti Ternary System Assisted with Key Measurements. Thermochim. Acta 2013, 574, 121–132. [Google Scholar] [CrossRef]
- Zhang, J.-L.; Cann, J.L.; Maisel, S.B.; Qu, K.; Plancher, E.; Springer, H.; Povoden-Karadeniz, E.; Gao, P.; Ren, Y.; Grabowski, B.; et al. Design of a V–Ti–Ni alloy with superelastic nano-precipitates. Acta Mater. 2020, 196, 710–722. [Google Scholar] [CrossRef]
- Available online: https://www.matcalc.at/index.php/databases/special-databases (accessed on 1 December 2023).
- Kozeschnik, E. Mean-Field Microstructure Kinetics Modeling. Encycl. Mater. Met. Alloy. 2022, 4, 521–526. [Google Scholar]
- Helander, T.; Agren, J. Diffusion in the B2-b.c.c. phase of the Al–Fe–Ni system—Application of a phenomenological model. Acta Mater. 1999, 47, 3291–3300. [Google Scholar] [CrossRef]
- Sonderegger, B.; Kozeschnik, E. Generalized nearest-neighbor broken-bond analysis of randomly oriented coherent interfaces in multicomponent fcc and bcc structures. Metall. Mater. Trans. 2009, 40, 499–510. [Google Scholar] [CrossRef]
- Turnbull, D.; Fisher, J.C. Rate of Nucleation in Condensed Systems. J. Chem. Phys. 1949, 17, 71–73. [Google Scholar] [CrossRef]
- Ke, C.B.; Cao, S.S.; Zhang, X.P. Phase field simulation of coherent precipitation of Ni4Ti3 particles during stress-assisted aging of a porous NiTi alloy. Model. Simul. Mater. Sci. Eng. 2015, 23, 055008. [Google Scholar] [CrossRef]
- Liu, D.; Peterlechner, M.; Fiebig, J.; Trubel, S.; Wegner, M.; Du, Y.; Jin, Z.; Wilde, G.; Divinski, S.V. Grain boundary diffusion and precipitates in B2 Ti50.2 at.% Ni alloy. Intermetallics 2015, 61, 30–37. [Google Scholar] [CrossRef]
- Bain, E.C.; Rutherford, J.J.B.; Aborn, R.H. The relation between the grain areas on a plane section and the grain size of a metal. Met. Alloys 1937, 8, 345–348. [Google Scholar]
- Gladman, T. On the Theory of the Effect of Precipitate Particles on Grain Growth in Metals. Proc. R. Soc. London. Ser. A Math. Phys. Sci. 1966, 294, 298–309. [Google Scholar]
- ASTM Standard 2004-03; Standard Test Method for Transformation Temperature Measurement of Nickel–Titanium Shape Memory Alloys by Thermal Analysis. ASTM International: West Conshohocken, PA, USA, 2003.
- ASTM E 1461-13; Standard Test Method for Thermal Diffusivity by the Flash Method. R&B Inc.: Seoul, Republic of Korea, 2013.
- Zhu, W.J.; Duarte, L.I.; Leinenbach, C. Experimental study and thermodynamic assessment of the Cu–Ni–Ti system. Calphad 2014, 47, 9–22. [Google Scholar] [CrossRef]
- Tang, W.; Sundman, B.; Sandström, R.; Qiu, C. New modelling of the B2 phase and its associated martensitic transformation in the Ti–Ni system. Acta Mater. 1999, 47, 3457–3468. [Google Scholar] [CrossRef]
- Wang, J.; Hu, K. Phase transformation of NiTi alloys during vacuum sintering. IOP Conf. Ser. Mater. Sci. Eng. 2017, 204, 012023. [Google Scholar] [CrossRef]
- Salvetr, P.; Dlouhý, J.; Školáková, A.; Pruša, F.; Novák, P.; Karlík, M.; Haušild, P. Influence of Heat Treatment on Microstructure and Properties of NiTi46 Alloy Consolidated by Spark Plasma Sintering. Materials 2019, 12, 4075. [Google Scholar] [CrossRef]
- Benjamin, J.S.; Volin, T.E. The mechanism of mechanical alloying, Mechanical alloying and milling. Metall. Trans. 1974, 5, 1929–1934. [Google Scholar] [CrossRef]
- Suryanarayana, C. Mechanical alloying and milling. Prog. Mater. Sci. 2001, 46, 1–184. [Google Scholar] [CrossRef]
- Farvizi, M. Challenges of Using Elemental Nickel and Titanium Powders for the Fabrication of Monolithic NiTi Parts. Arch. Metall. Mater. 2017, 62, 1075–1079. [Google Scholar] [CrossRef]
- Abdulmenova, E.V.; Kulkov, S.N. A structure formation in Ti-Ni powder after high-energy mechanical treatment. IOP Conf. Ser. Mater. Sci. Eng. 2020, 848, 012001. [Google Scholar] [CrossRef]
- Révész, Á.; Ungár, T.; Borbély, A.; Lendvai, J. Dislocations and grain size in ball-milled iron powder. Nanostructured Mater. 1966, 7, 779–788. [Google Scholar] [CrossRef]
- Kang, S.H.; Hur, S.G.; Lee, H.W.; Nam, T.H. Microstructures and transformation behavior of Ti-Ni-Cu shape memory alloy powders fabricated by ball alloyed method. Met. Mater. Int. 2000, 6, 381–387. [Google Scholar] [CrossRef]
- Goryczka, T.; Ochin, P. Microstructure, texture and shape memory effect in Ni25Ti50Cu25 ribbons and strips. Mater. Sci. Eng. A 2006, 438–440, 714–718. [Google Scholar] [CrossRef]
- Turchi, P.E.A. Thermodynamic, Kinetic, and Physical Properties of Ag-Al-Cu-Ni-Si-Zn Alloys; Lawrence Livermore National Security, LLC: Oak Ridge, TN, USA, 2018. [Google Scholar]
- Nam, T.H.; Saburi, T.; Shimizu, K. Cu-content dependence of shape memory characteristics in Ti-Ni-Cu alloys. Mater. Trans. JIM 1990, 31, 959–967. [Google Scholar] [CrossRef]
- Xiong, D.-B.; Okamoto, N.L.; Inui, H. Reduced thermal conductivity in nanolamellar composite comprising half-Heusler and NiAs-type phases. Scripta Mater. 2013, 69, 557–560. [Google Scholar] [CrossRef]
- Garcia-Pastor, F.A.; Montelongo-Vega, J.B.; Tovar-Padilla, M.V.; Cardona-Castro, M.A.; Alvarez-Quintana, J. Robust metallic nanolaminates having phonon-glass thermal conductivity. Materials 2020, 13, 4954. [Google Scholar] [CrossRef]
- Cantor, B. Diffusion in amorphous alloys. Rapidly Quenched Met. 1985, 595–602. [Google Scholar] [CrossRef]
- Fukuda, T.; Saburi, T.; Chihara, T.; Tsuzuki, Y. Mechanism of B2-B19-B19′ transformation in shape memory Ti-Ni-Cu alloys. Mater. Trans. JIM 1995, 36, 1244–1248. [Google Scholar] [CrossRef]
- Zanotti, C.; Giuliani, P.; Chrysanthou, A. Martensitic–Austenitic phase transformation of Ni–Ti SMAs: Thermal properties. Intermetallics 2012, 24, 106–114. [Google Scholar] [CrossRef]
- Sharar, D.J.; Donovan, B.F.; Warzoha, R.J.; Wilson, A.A.; Leff, A.C.; Hanrahan, B.M. Solid-state thermal energy storage using reversible martensitic transformation. Appl. Phys. Lett. 2019, 114, 143902. [Google Scholar] [CrossRef]


| Dislocations, m/m3 | Diffusion Factor | Grain Size, m | Sgb and Size (m) | |
|---|---|---|---|---|
| Aging without MA after SPS | 1 × 10¹² | 1 | 50 × 10−6 | none |
| Aging after MA and SPS | 5 × 10¹² | 10 | 10 × 10−6 | 0.1 × 10⁻⁶ |
| Sample | Ms [°C] | Mf [°C] | As [°C] | Af [°C] | T0 = (Ms + Af)/2 [°C] | Thermal Hysteresis (Af − Ms) [°C] | HVIT [6] |
|---|---|---|---|---|---|---|---|
| HT-P0 | 30.2 | −40.1 | −30.3 | 39 | 34.6 | 8.8 | 396 |
| HT-P1 | 33.1 | −2.7 | −12.2 | 52.5 | 42.8 | 19.4 | 646 |
| HT-S0 | 64.4 | 40.8 | 60.2 | 83.3 | 73.85 | 18.9 | 326 |
| HT-S1 | 64.6 | 38.3 | 58.4 | 89.1 | 76.85 | 24.5 | 545 |
| Type | Temperature [°C] | |||||||
|---|---|---|---|---|---|---|---|---|
| 25 | 50 | 75 | 100 | 125 | 150 | 175 | ||
| Density: 5.66 g/cm3 [6] Porosity: 9.19% [6] | 22.96 ± 0.13 | 23.34 ± 0.15 | 23.90 ± 0.19 | 24.90 ± 0.04 | 25.34 ± 0.08 | 25.63 ± 0.13 | 26.05 ± 0.11 | k [W/m K] |
| 3.77 ± 0.02 | 3.83 ± 0.02 | 3.92 ± 0.03 | 4.08 ± 0.01 | 4.16 ± 0.01 | 4.20 ± 0.02 | 4.27 ± 0.02 | α [mm2/s] | |
| 1.09 ± 0.01 | 1.08 ± 0.01 | 1.18 ± 0.24 | 1.05 ± 0.01 | 1.03 ± 0.01 | 1.01 ± 0.01 | 1.21 ± 0.01 | cp [J/g K] | |
| Type | Temperature [°C] | |||||||
|---|---|---|---|---|---|---|---|---|
| 25 | 50 | 75 | 100 | 125 | 150 | 175 | ||
| Density: 5.04 g/cm3 [6] Porosity: 18.73% [6] | 20.04 ± 0.05 | 20.29 ± 0.11 | 20.85 ± 0.09 | 21.77 ± 0.07 | 22.04 ± 0.02 | 22.34 ± 0.07 | 22.62 ± 0.07 | k [W/m K] |
| 3.39 ± 0.01 | 3.44 ± 0.01 | 3.53 ± 0.01 | 3.69 ± 0.01 | 3.73 ± 0.01 | 3.78 ± 0.01 | 3.83 ± 0.01 | α [mm2/s] | |
| 1.12 ± 0.01 | 1.15 ± 0.07 | 1.08 ± 0.07 | 1.11 ± 0.01 | 1.10 ± 0.01 | 1.09 ± 0.01 | 1.05 ± 0.02 | cp [J/g K] | |
| Type | Temperature [°C] | |||||||
|---|---|---|---|---|---|---|---|---|
| 25 | 50 | 75 | 100 | 125 | 150 | 175 | ||
| Density: 6.66 g/cm3 [6] Porosity: 3.29% [6] | 23.71 ± 0.33 | 24.18 ± 0.12 | 24.99 ± 0.01 | 25.56 ± 0.15 | 26.02 ± 0.14 | 26.51 ± 0.10 | 26.88 ± 0.09 | k [W/m K] |
| 3.90 ± 0.05 | 3.92 ± 0.01 | 4.11 ± 0.01 | 4.20 ± 0.02 | 4.28 ± 0.02 | 4.35 ± 0.01 | 4.42 ± 0.01 | α [mm2/s] | |
| 1.01 ± 0.02 | 1.00 ± 0.01 | 0.98 ± 0.03 | 0.97 ± 0.01 | 0.95 ± 0.02 | 0.95 ± 0.01 | 0.93 ± 0.01 | cp [J/g K] | |
| Type | Temperature [°C] | |||||||
|---|---|---|---|---|---|---|---|---|
| 25 | 50 | 75 | 100 | 125 | 150 | 175 | ||
| Density: 6.32 g/cm3 [6] Porosity: 2.72% [6] | 15.97 ± 0.02 | 16.65 ± 0.10 | 17.96 ± 0.01 | 18.36 ± 0.07 | 18.81 ± 0.06 | 19.20 ± 0.07 | 19.60 ± 0.06 | k [W/m K] |
| 2.87 ± 0.01 | 3.00 ± 0.01 | 3.11 ± 0.01 | 3.29 ± 0.01 | 3.38 ± 0.01 | 3.45 ± 0.01 | 3.52 ± 0.01 | α [mm2/s] | |
| 1.04 ± 0.02 | 1.04 ± 0.01 | 0.99 ± 0.01 | 0.99 ± 0.01 | 0.99 ± 0.02 | 1.00 ± 0.01 | 1.00 ± 0.02 | cp [J/g K] | |
Disclaimer/Publisher’s Note: The statements, opinions and data contained in all publications are solely those of the individual author(s) and contributor(s) and not of MDPI and/or the editor(s). MDPI and/or the editor(s) disclaim responsibility for any injury to people or property resulting from any ideas, methods, instructions or products referred to in the content. |
© 2024 by the authors. Licensee MDPI, Basel, Switzerland. This article is an open access article distributed under the terms and conditions of the Creative Commons Attribution (CC BY) license (https://creativecommons.org/licenses/by/4.0/).
Share and Cite
Cirstea, C.D.; Povoden-Karadeniz, E.; Cirstea, V.; Tolea, F.; Kozeschnik, E. Thermodynamic and Kinetic Simulations Used for the Study of the Influence of Precipitates on Thermophysical Properties in NiTiCu Alloys Obtained by Spark Plasma Sintering. Nanomaterials 2024, 14, 461. https://doi.org/10.3390/nano14050461
Cirstea CD, Povoden-Karadeniz E, Cirstea V, Tolea F, Kozeschnik E. Thermodynamic and Kinetic Simulations Used for the Study of the Influence of Precipitates on Thermophysical Properties in NiTiCu Alloys Obtained by Spark Plasma Sintering. Nanomaterials. 2024; 14(5):461. https://doi.org/10.3390/nano14050461
Chicago/Turabian StyleCirstea, Cristiana Diana, Erwin Povoden-Karadeniz, Vasile Cirstea, Felicia Tolea, and Ernst Kozeschnik. 2024. "Thermodynamic and Kinetic Simulations Used for the Study of the Influence of Precipitates on Thermophysical Properties in NiTiCu Alloys Obtained by Spark Plasma Sintering" Nanomaterials 14, no. 5: 461. https://doi.org/10.3390/nano14050461