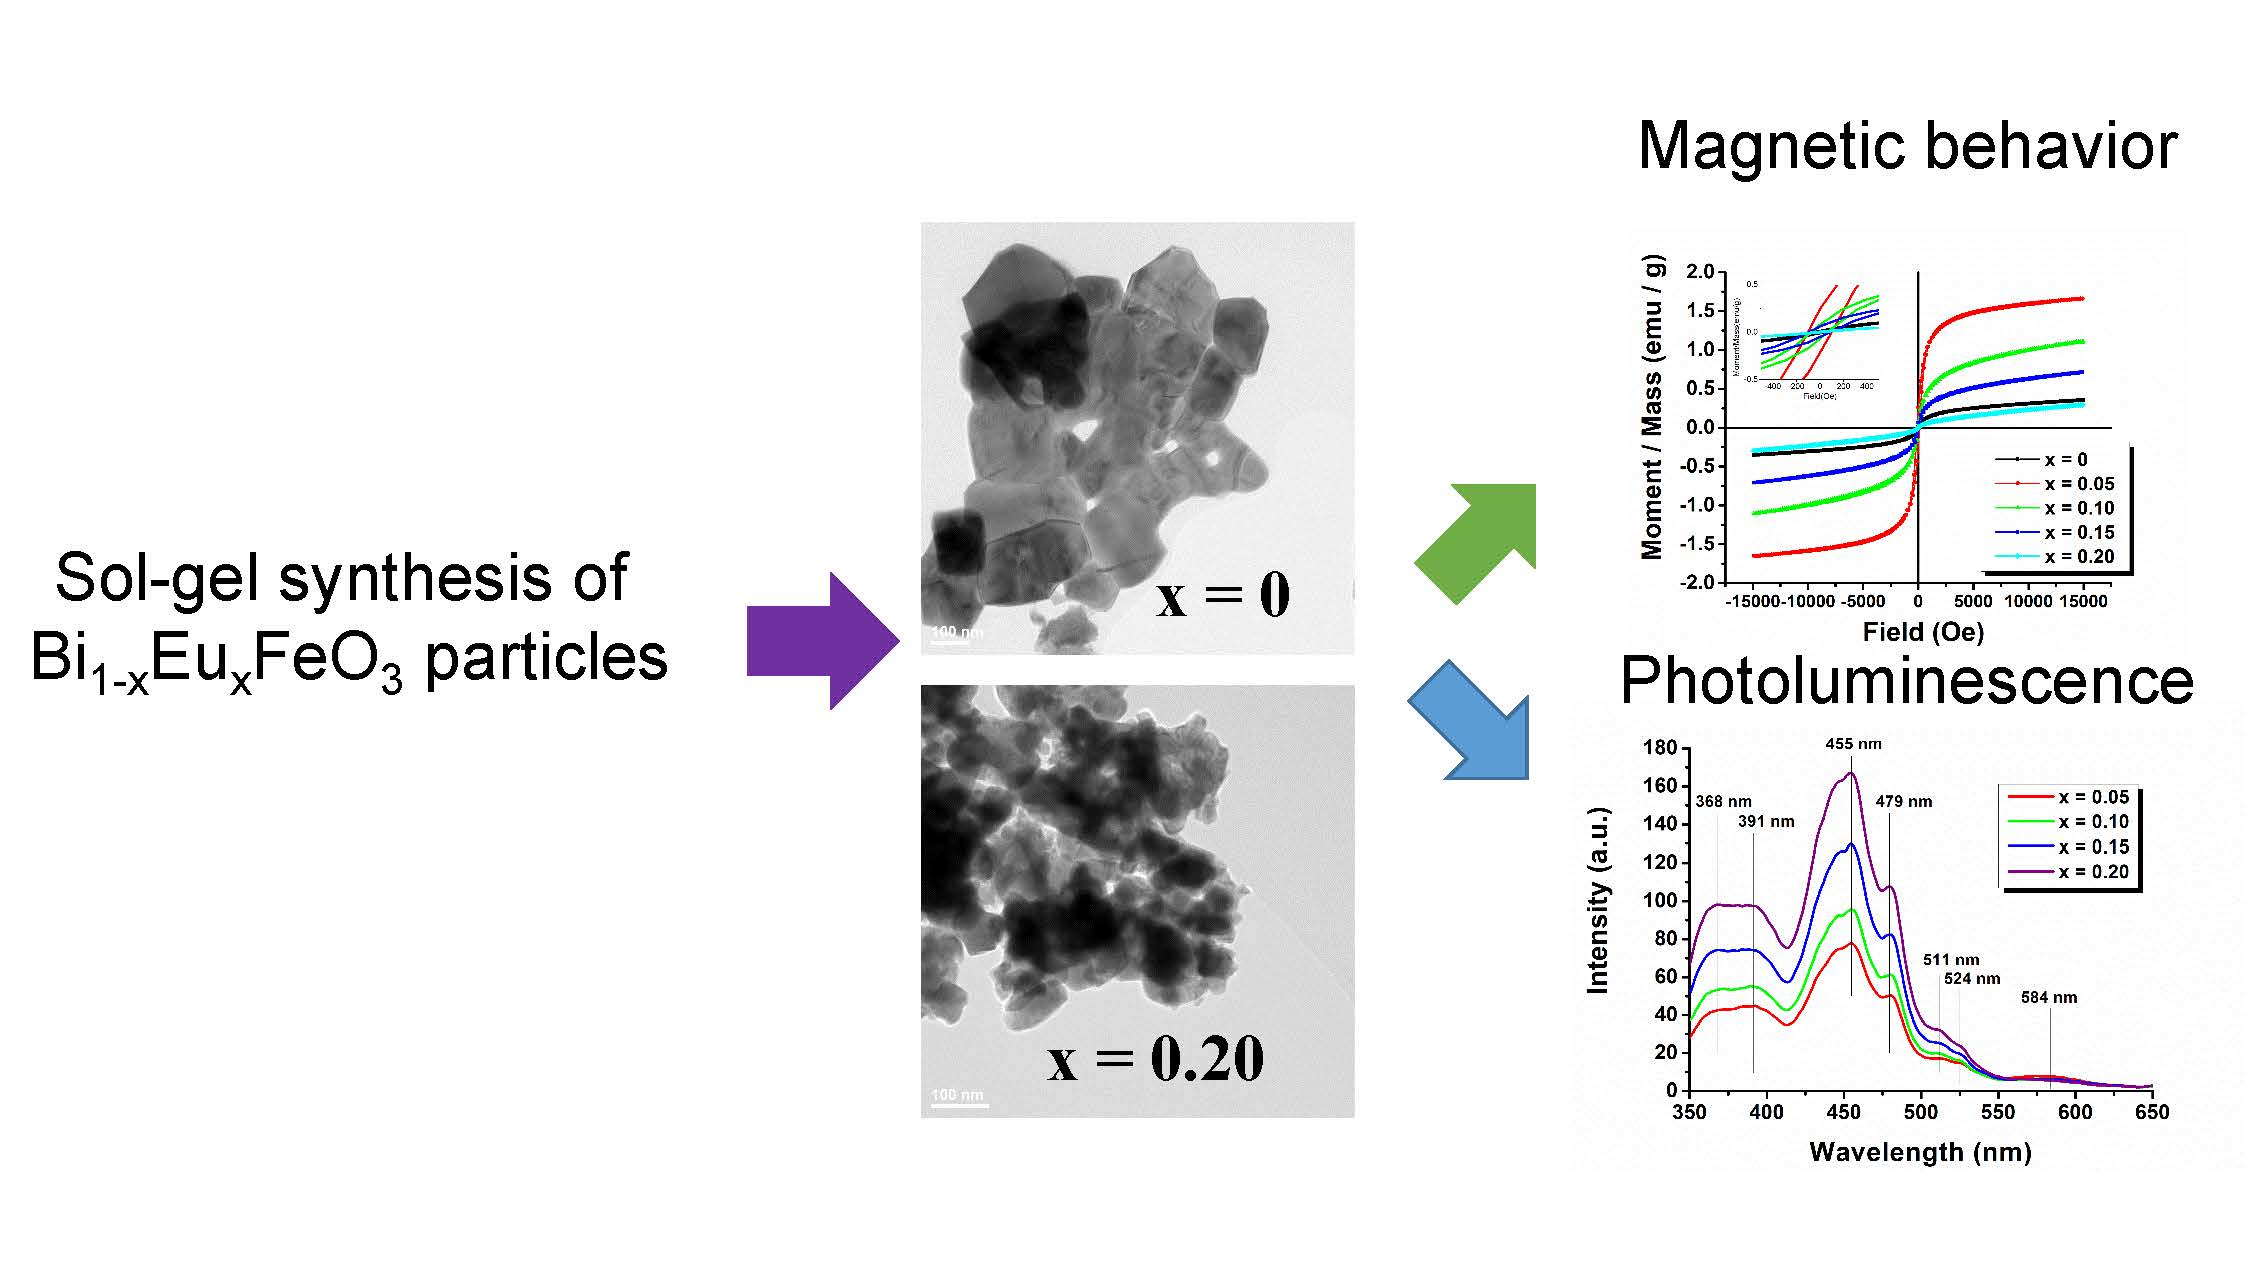
Bi1−xEuxFeO3 Powders: Synthesis, Characterization, Magnetic and Photoluminescence Properties

 ,
,  ,
,  ,
,
Abstract
:
1. Introduction
2. Materials and Methods
3. Results
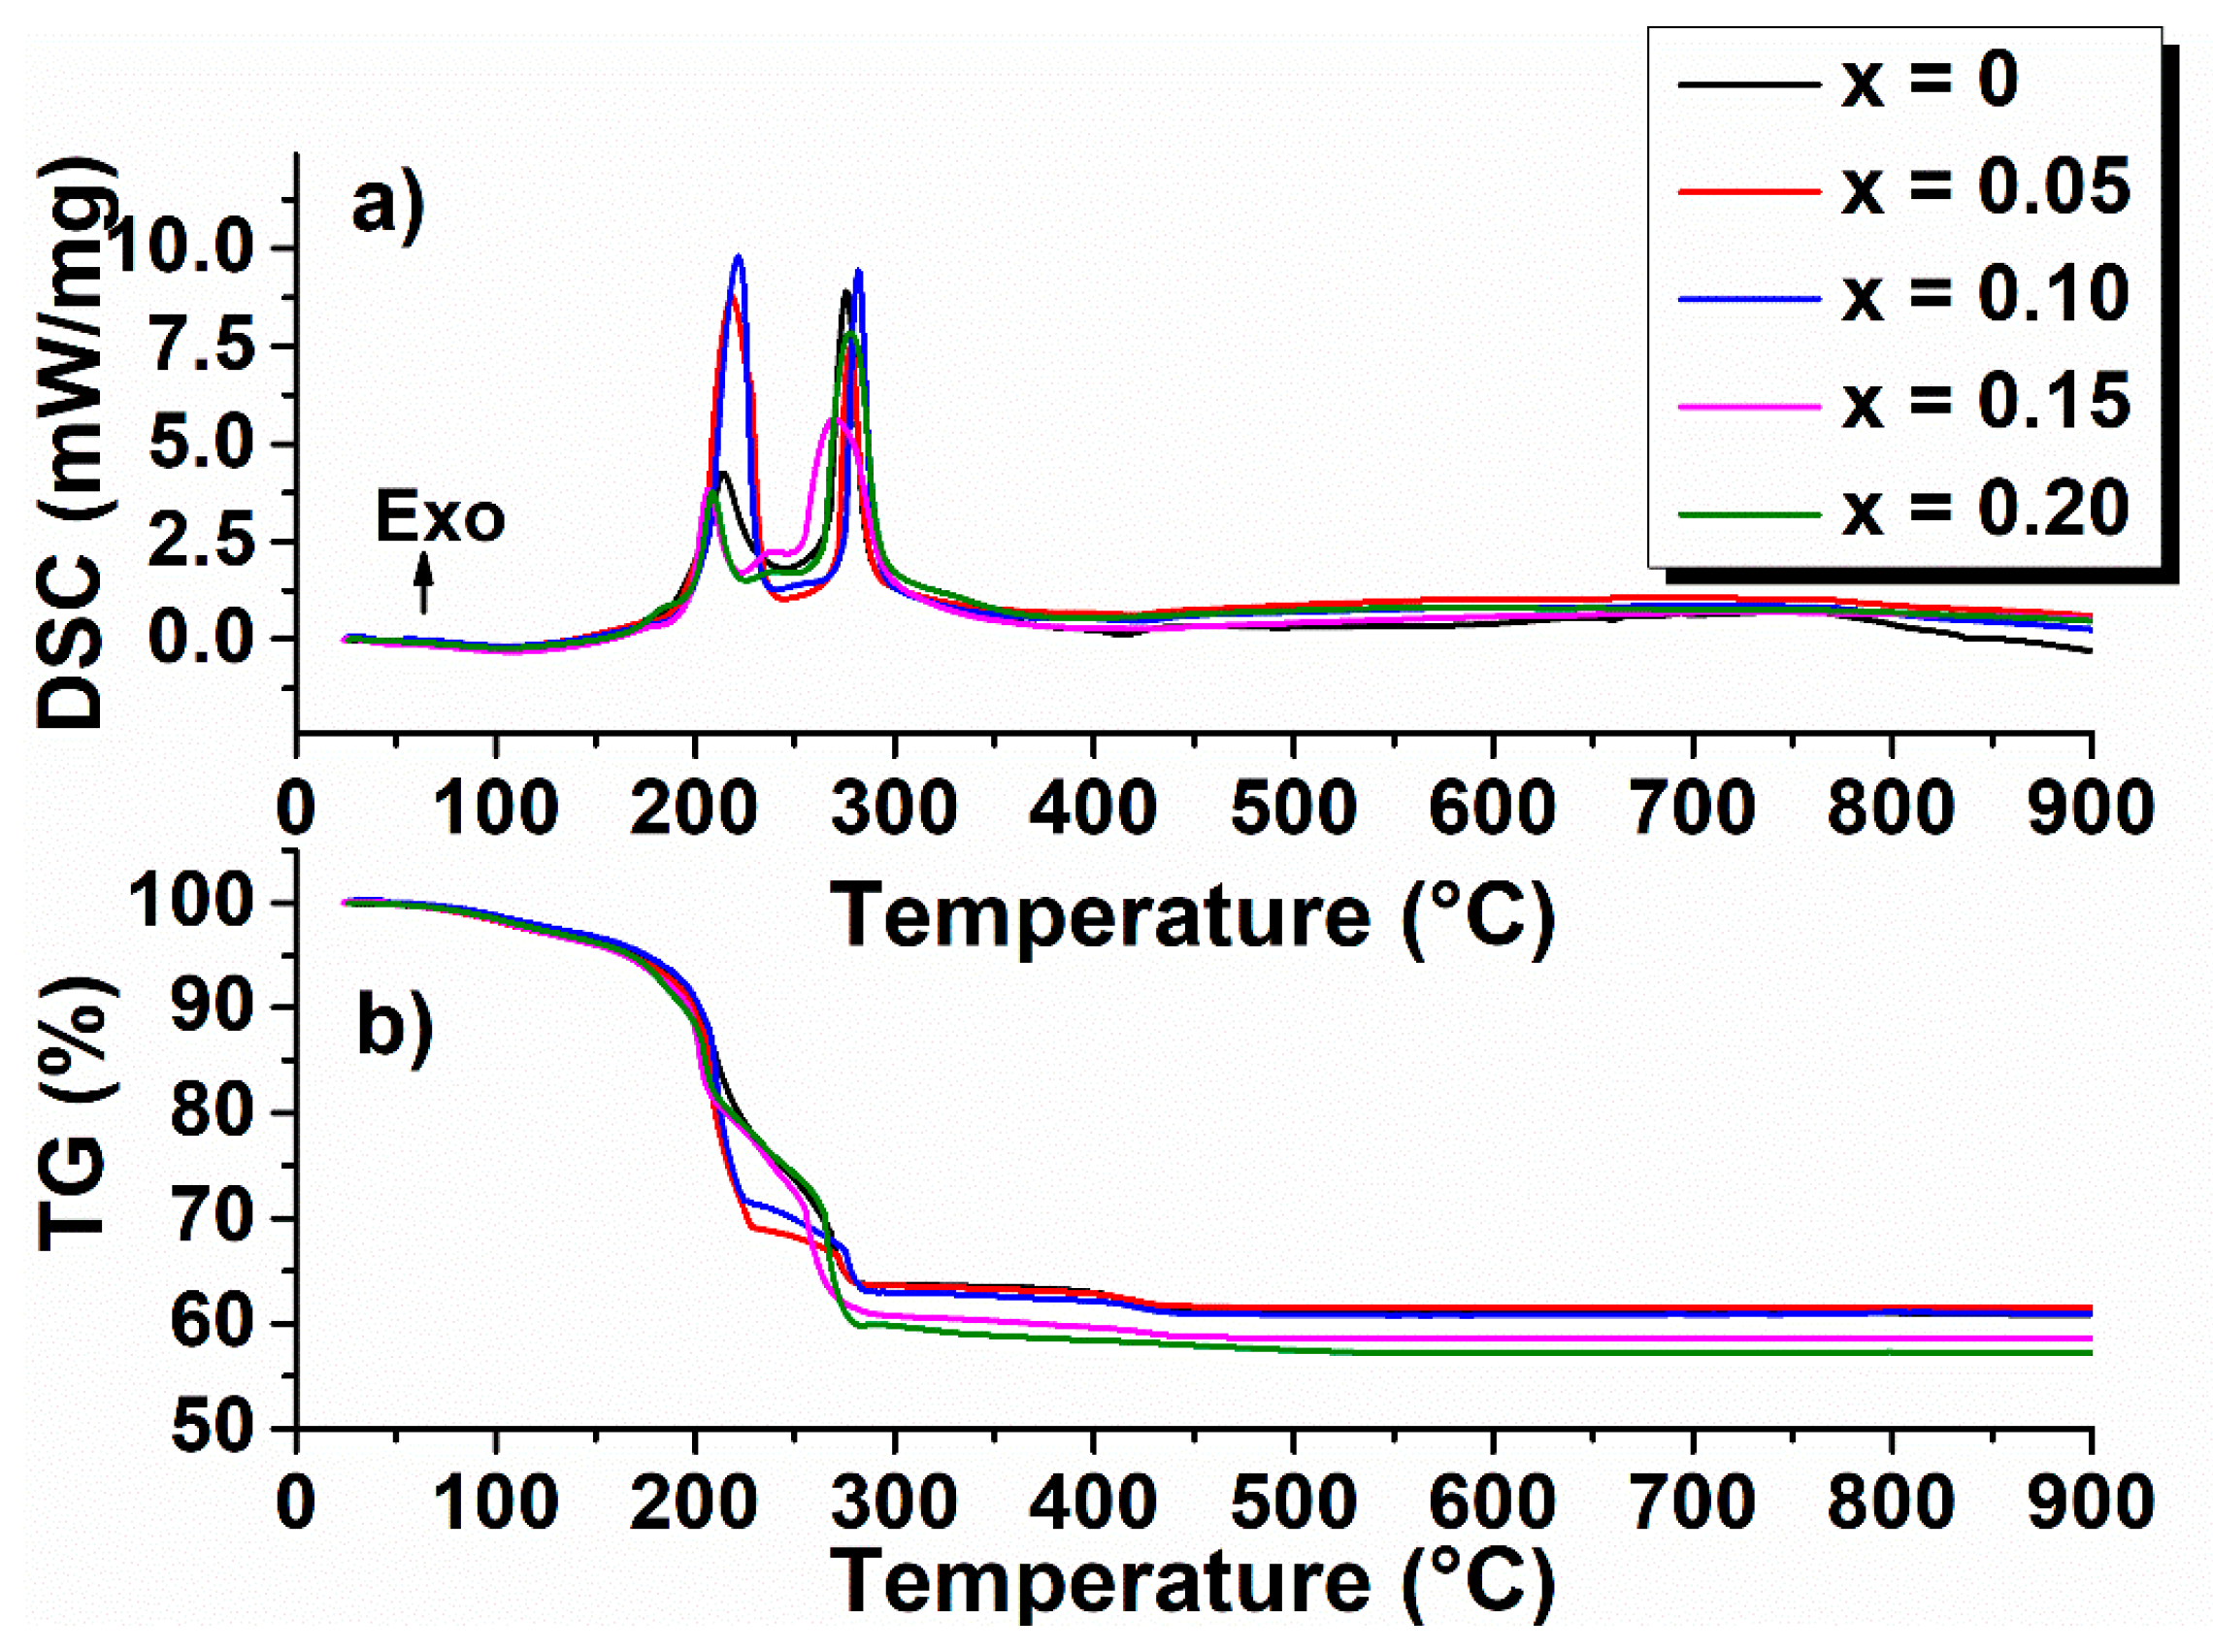
3.1. Thermal Behavior of the Precursor Powders
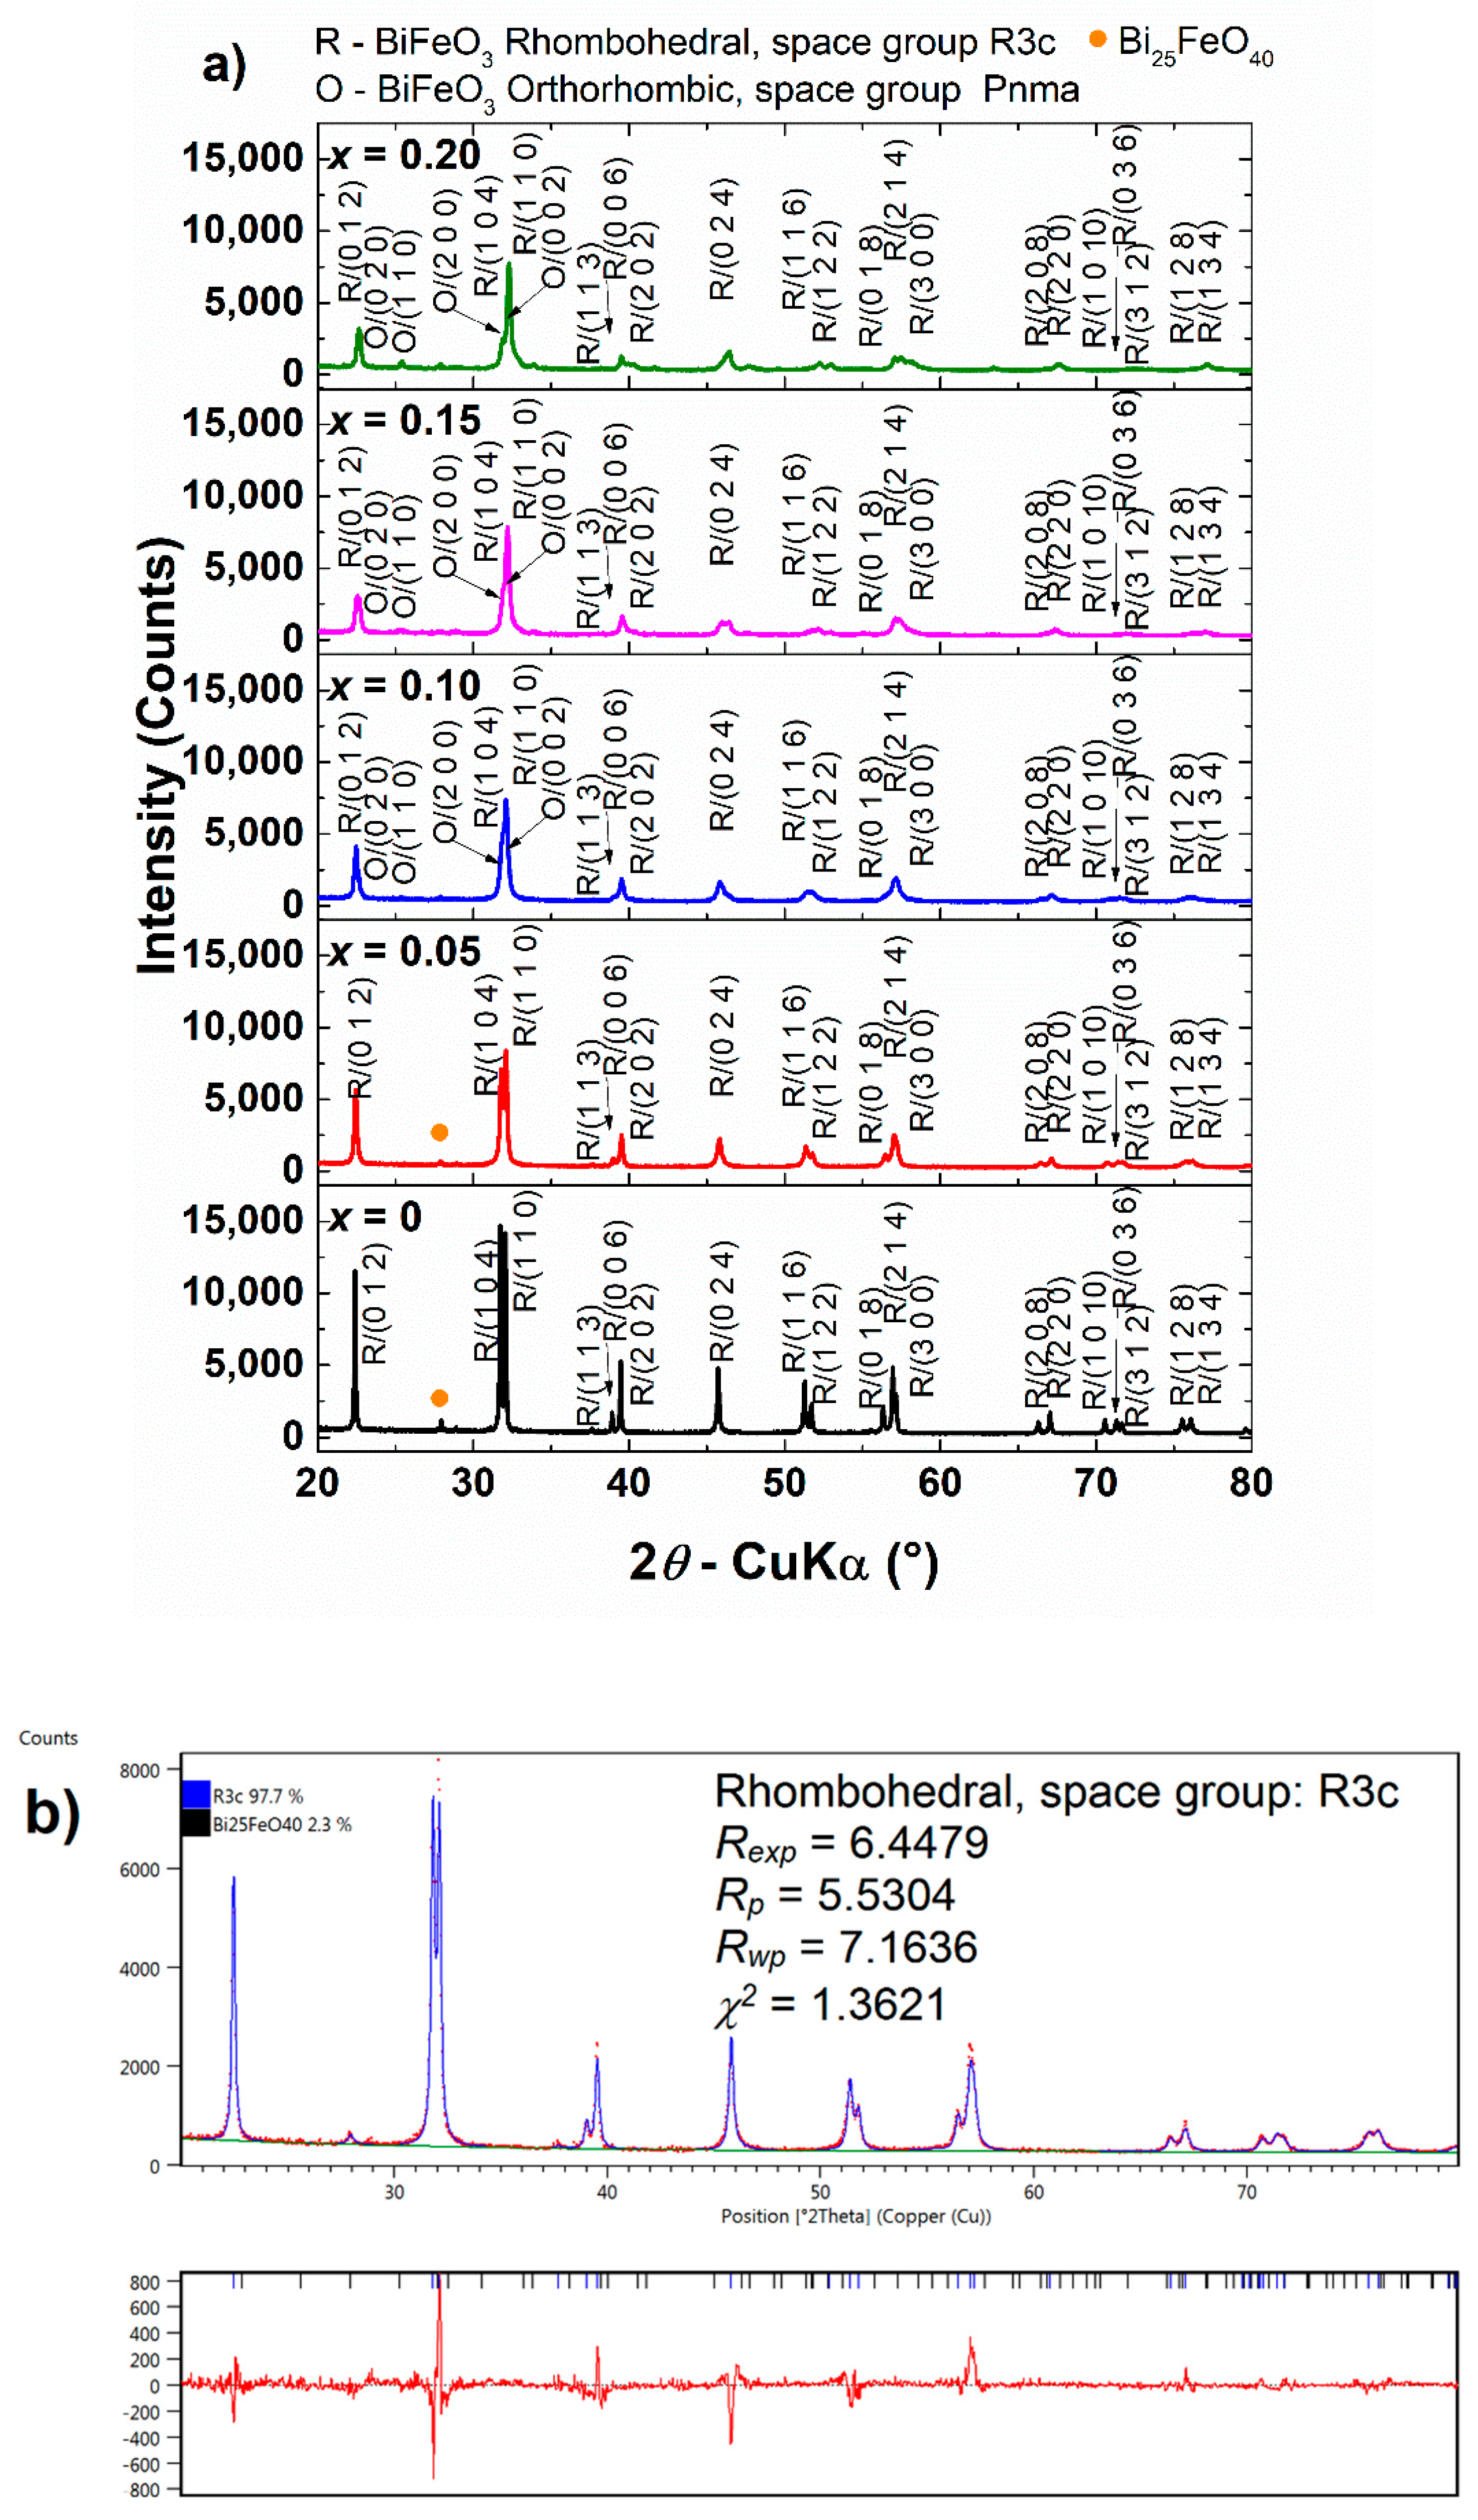
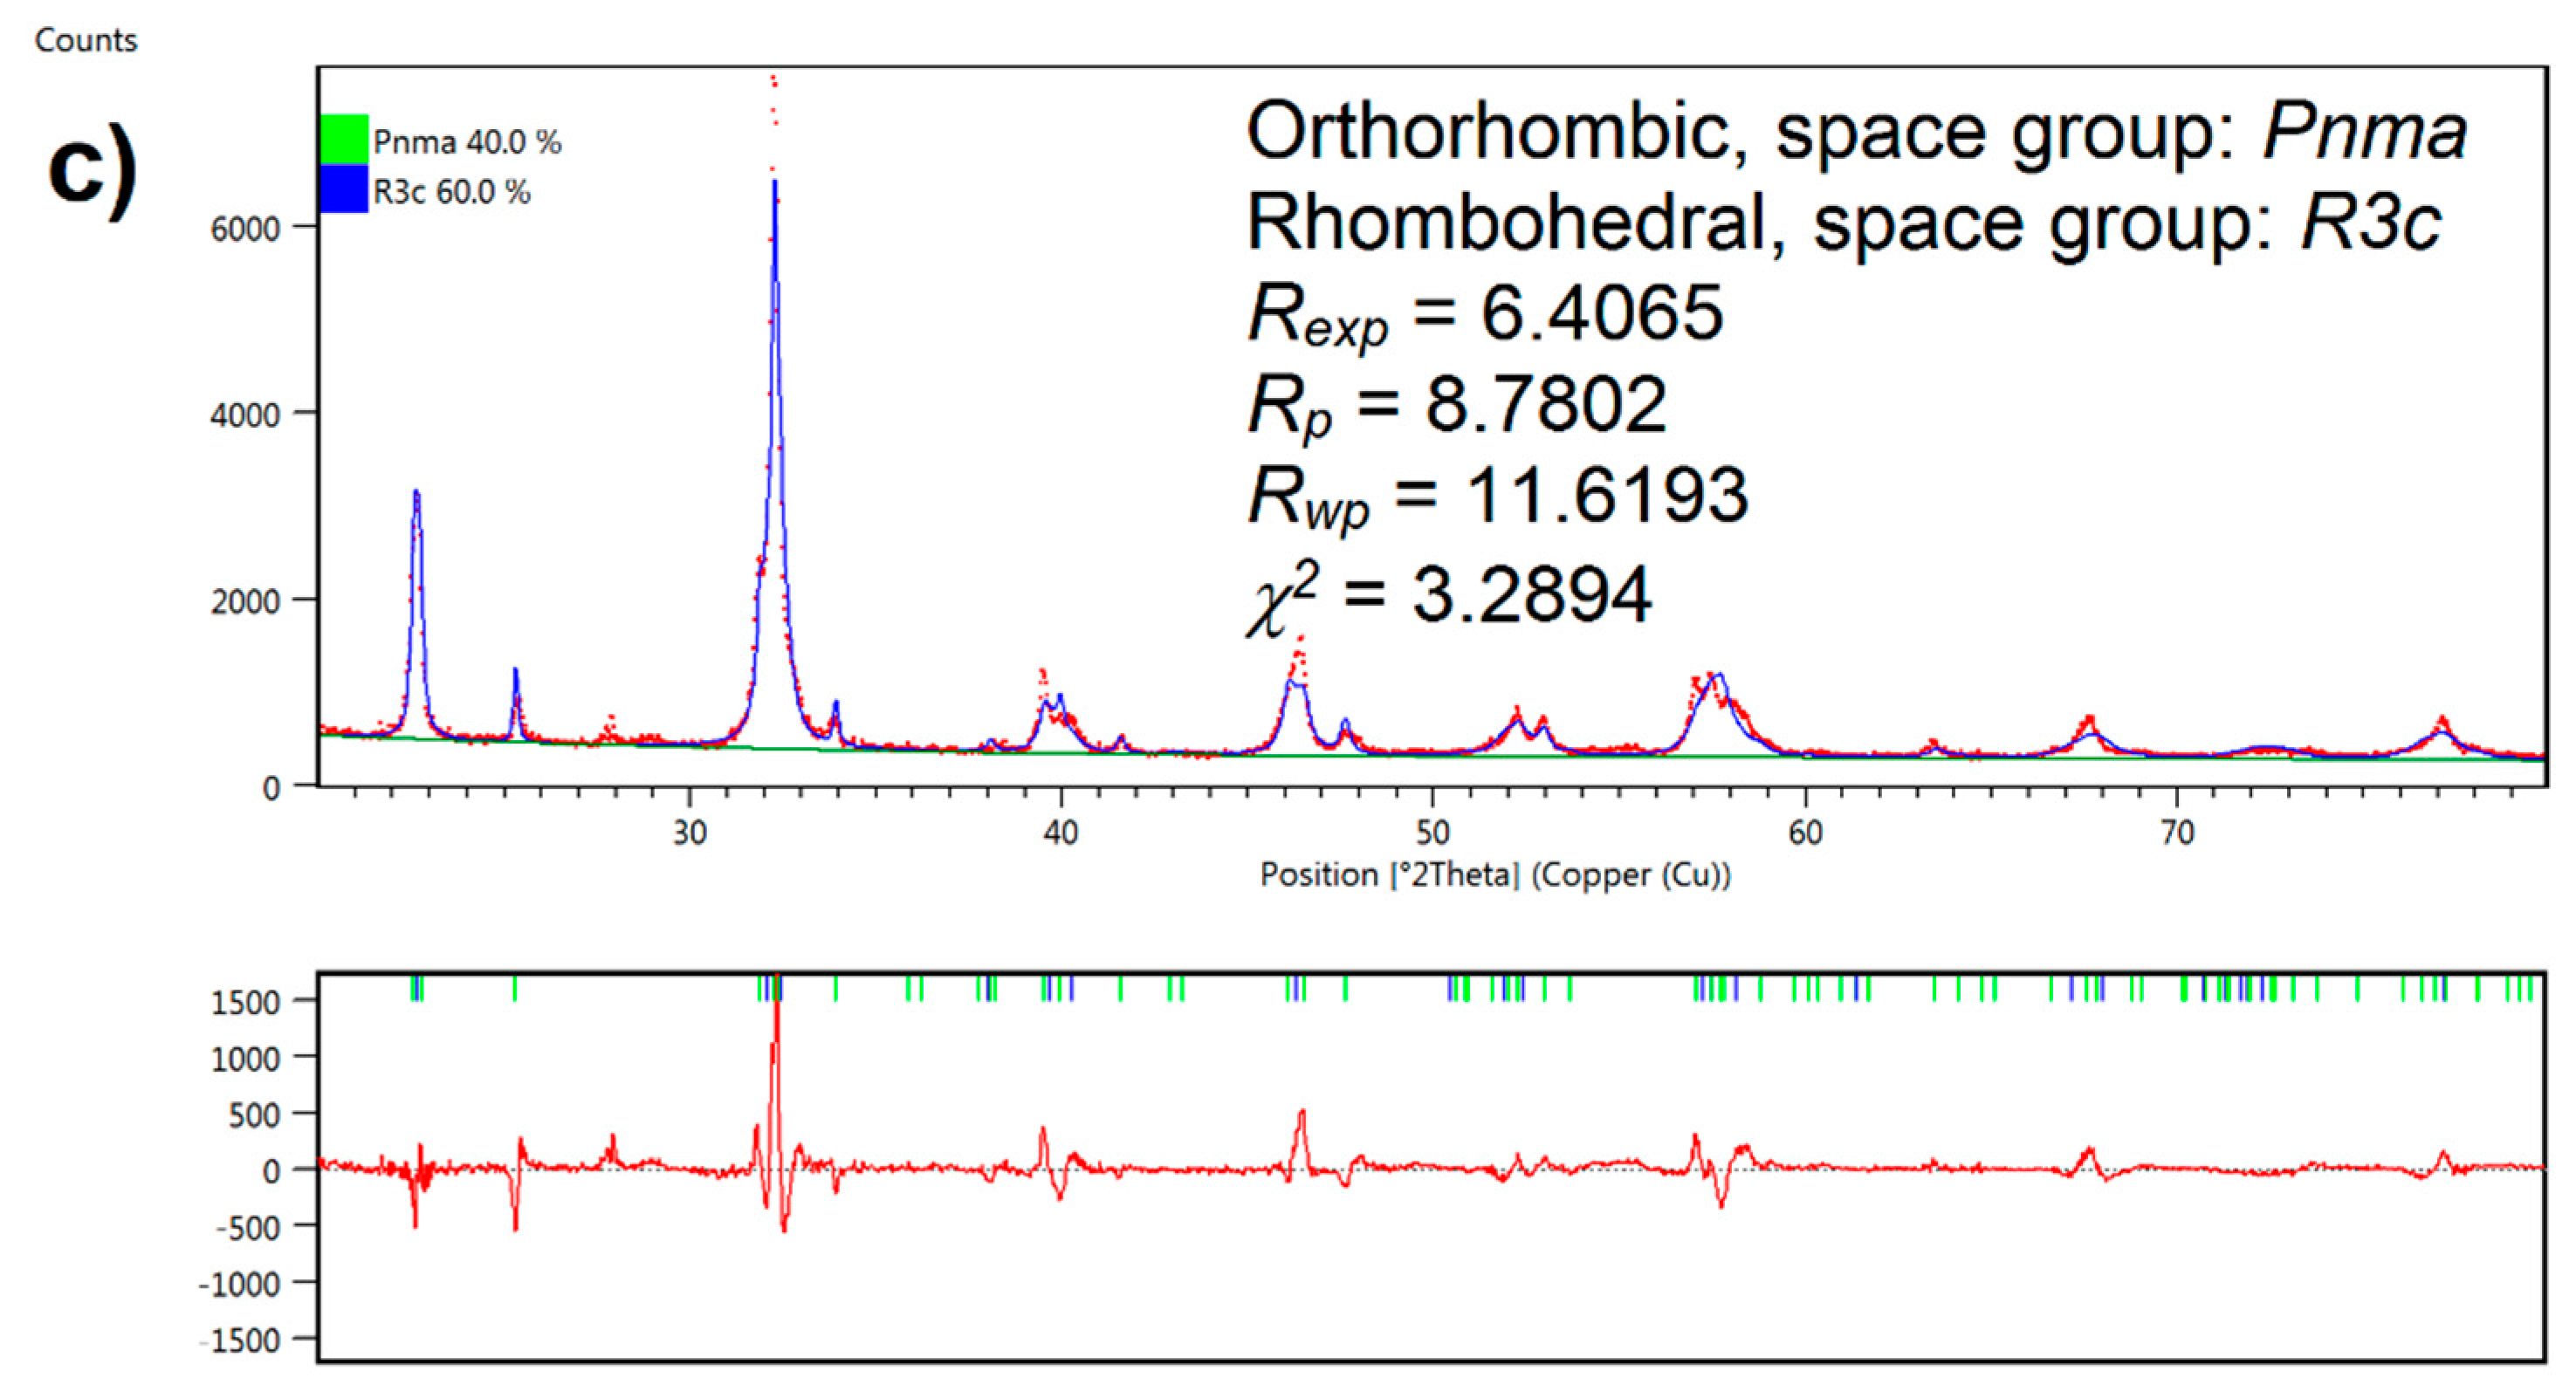
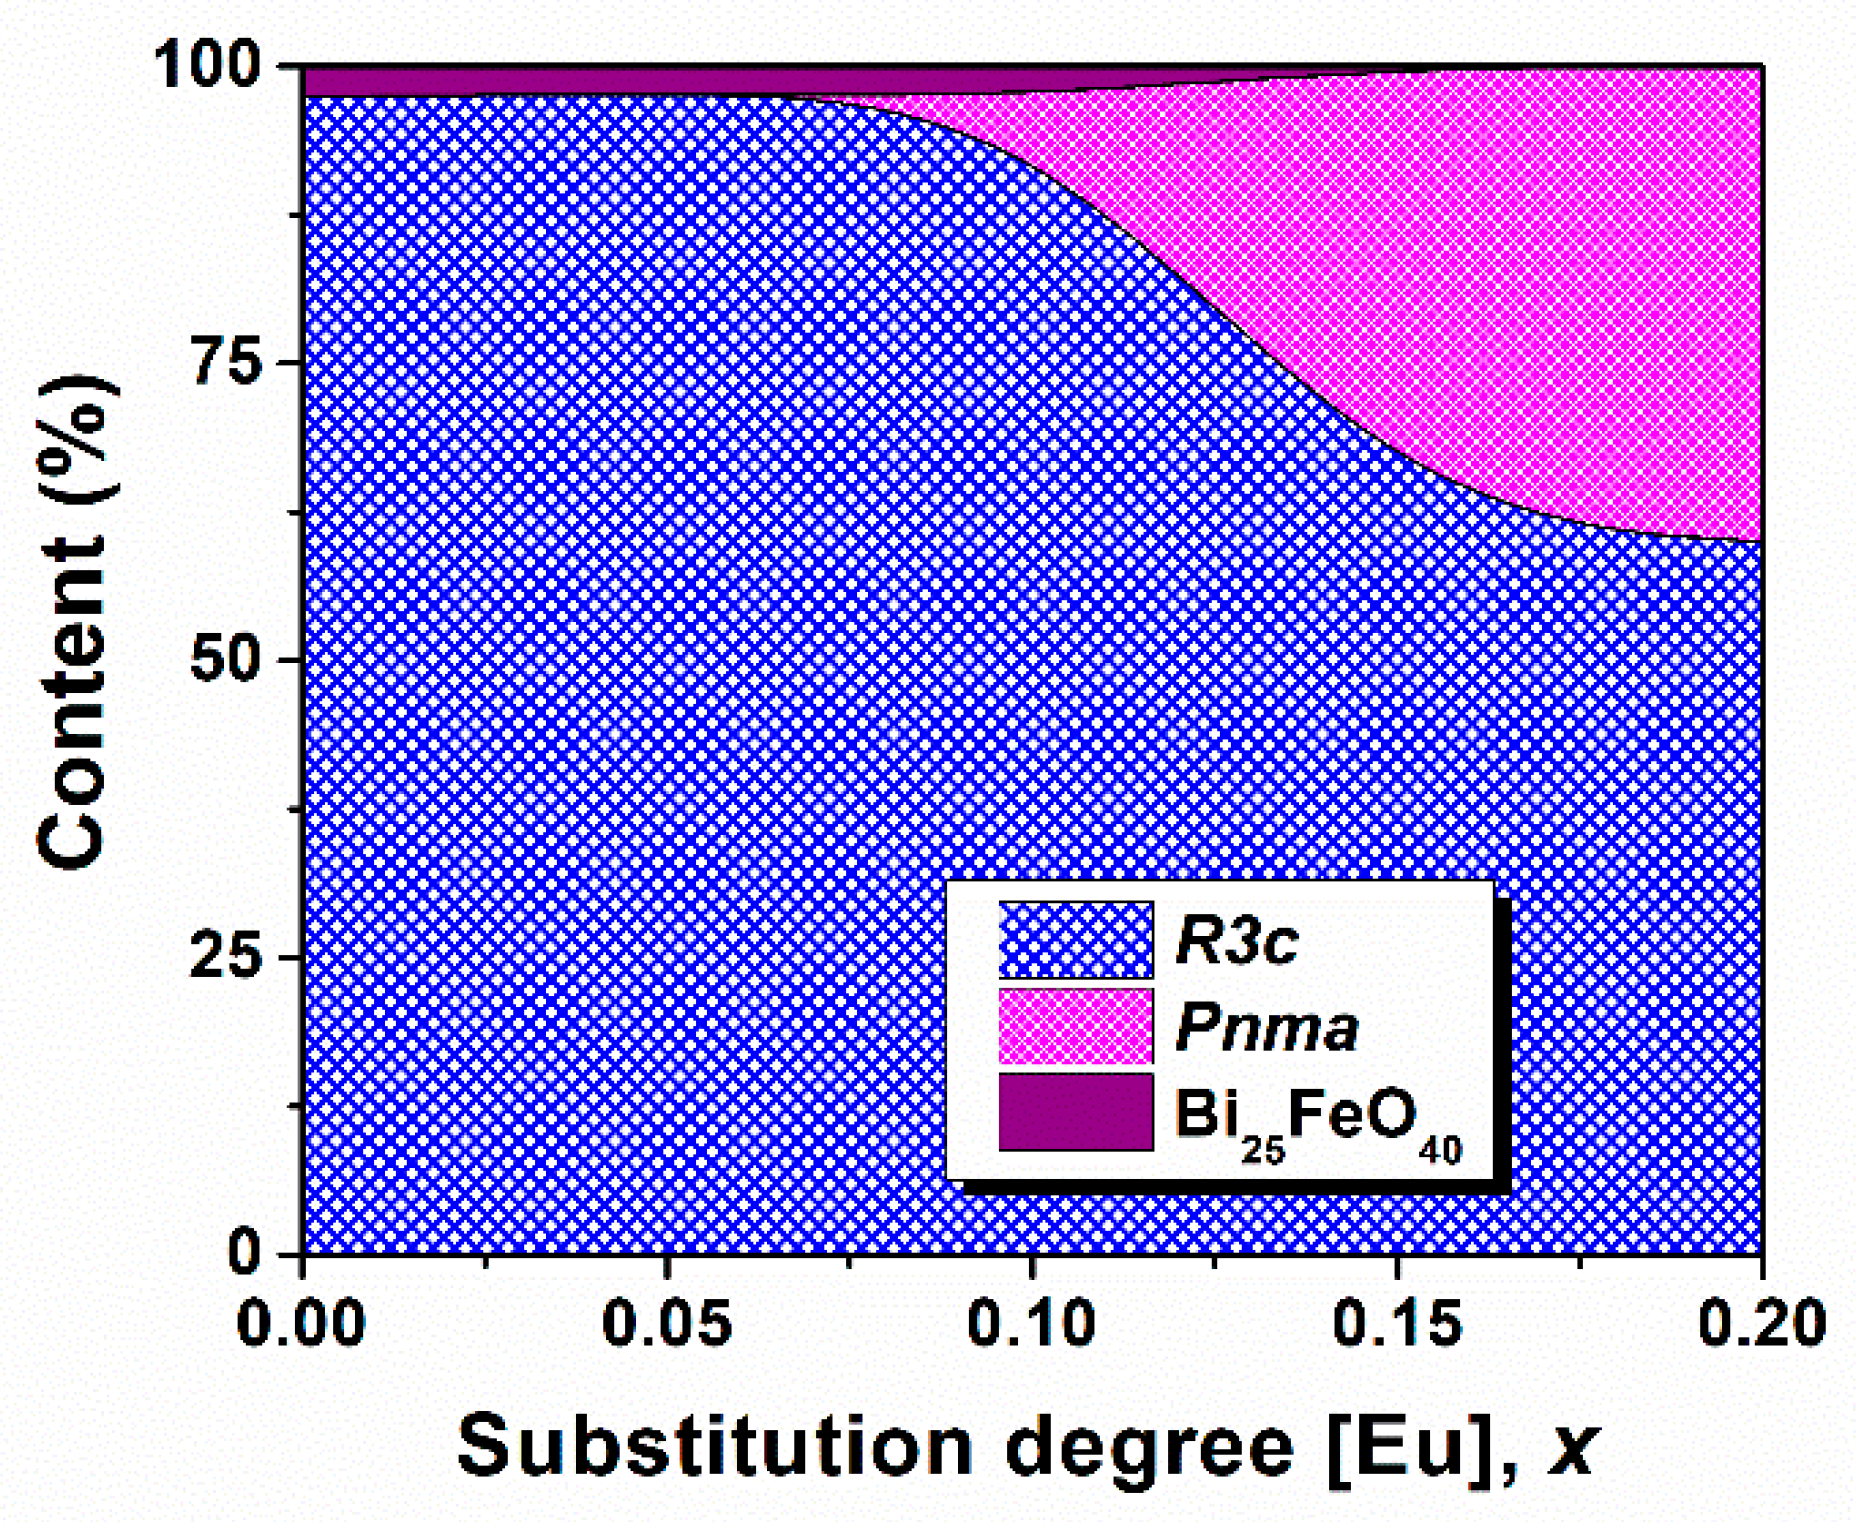
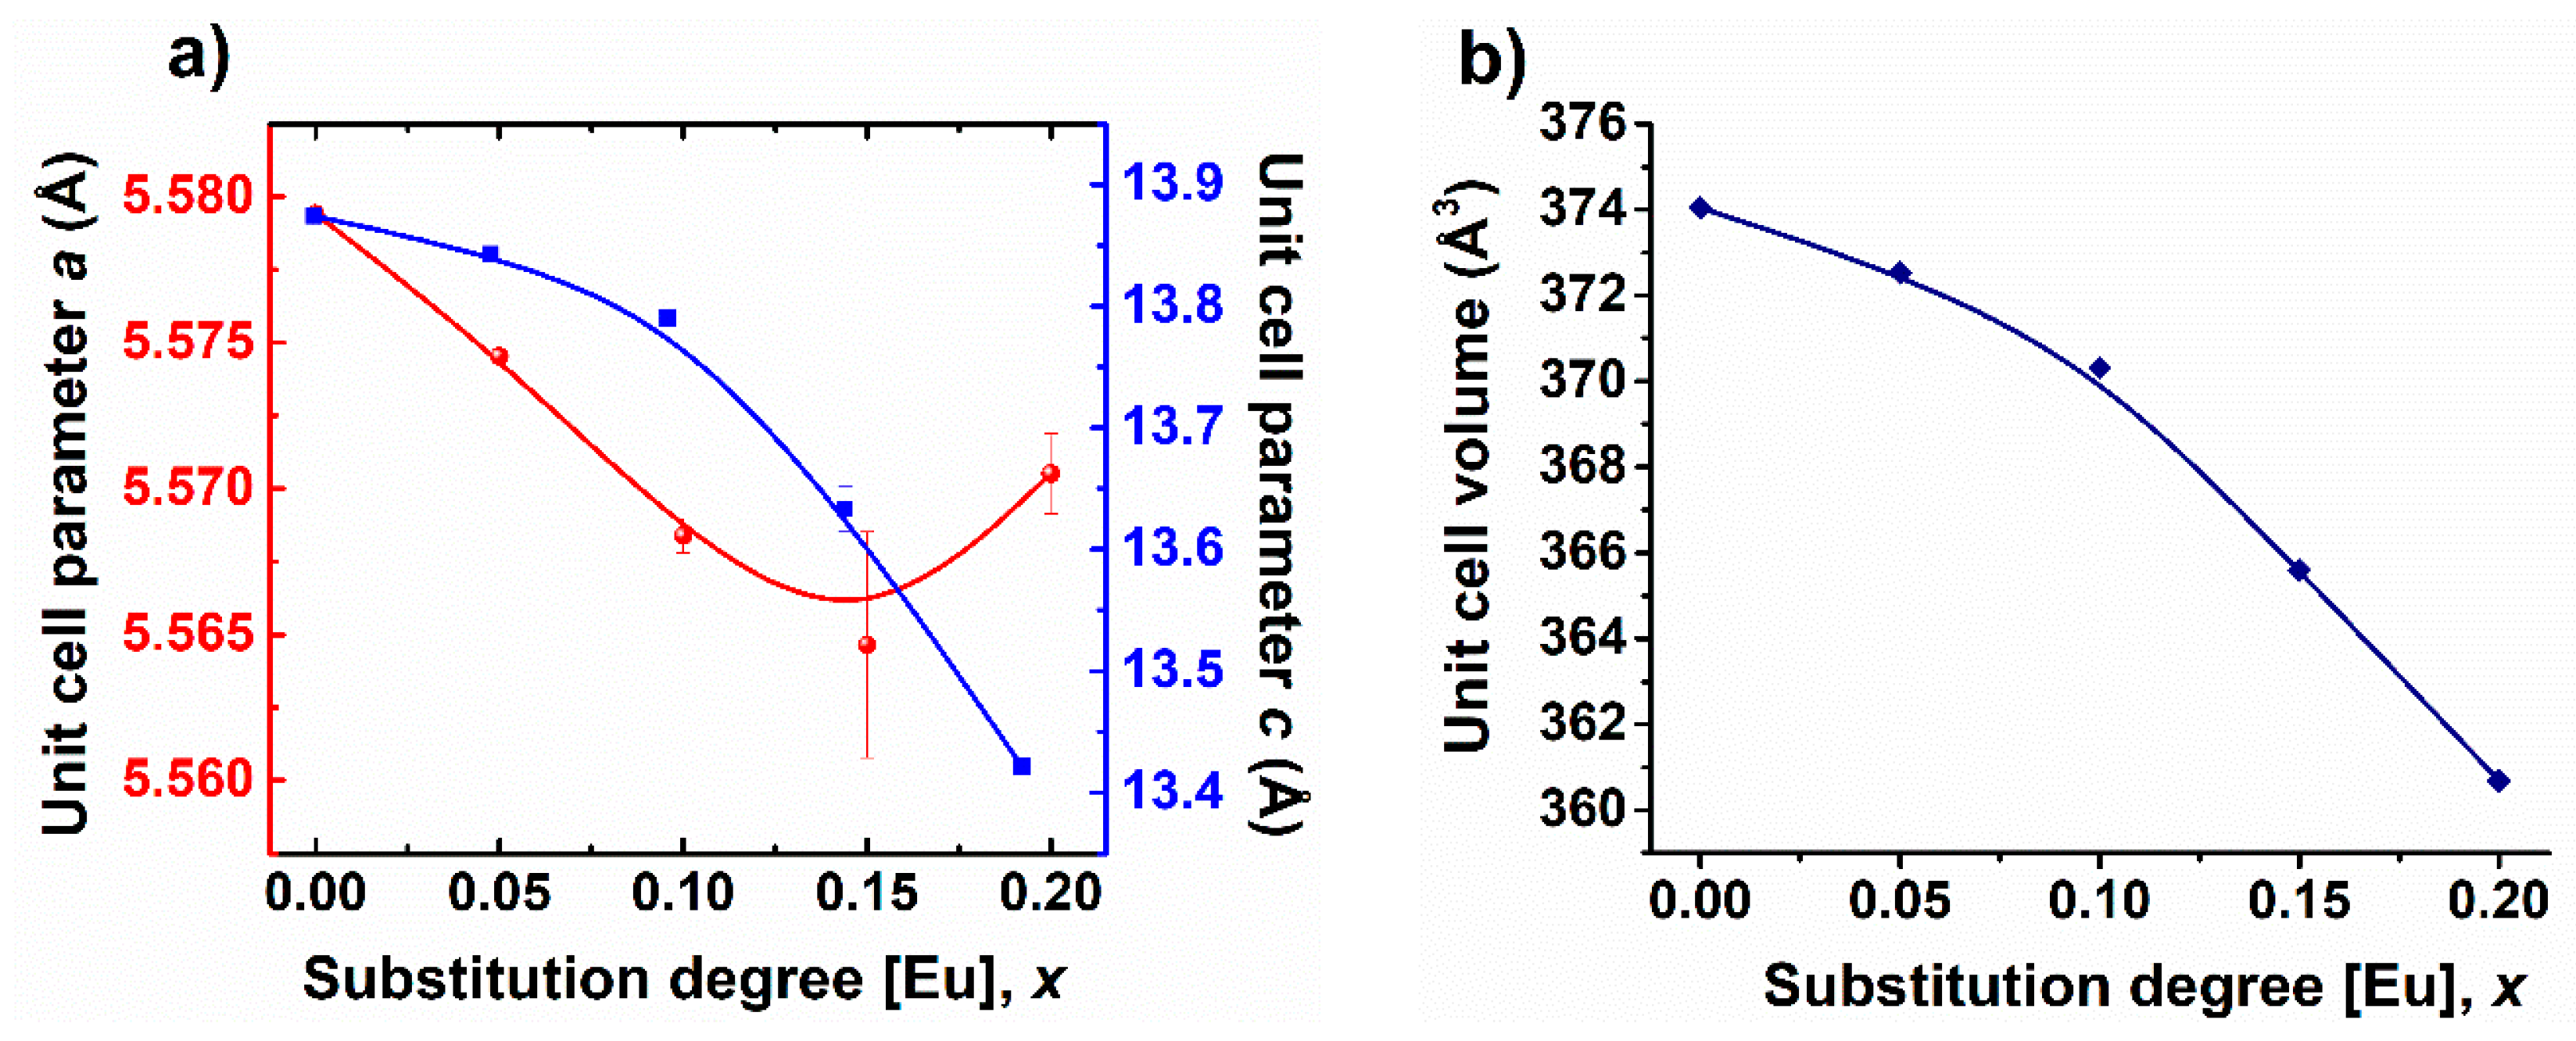
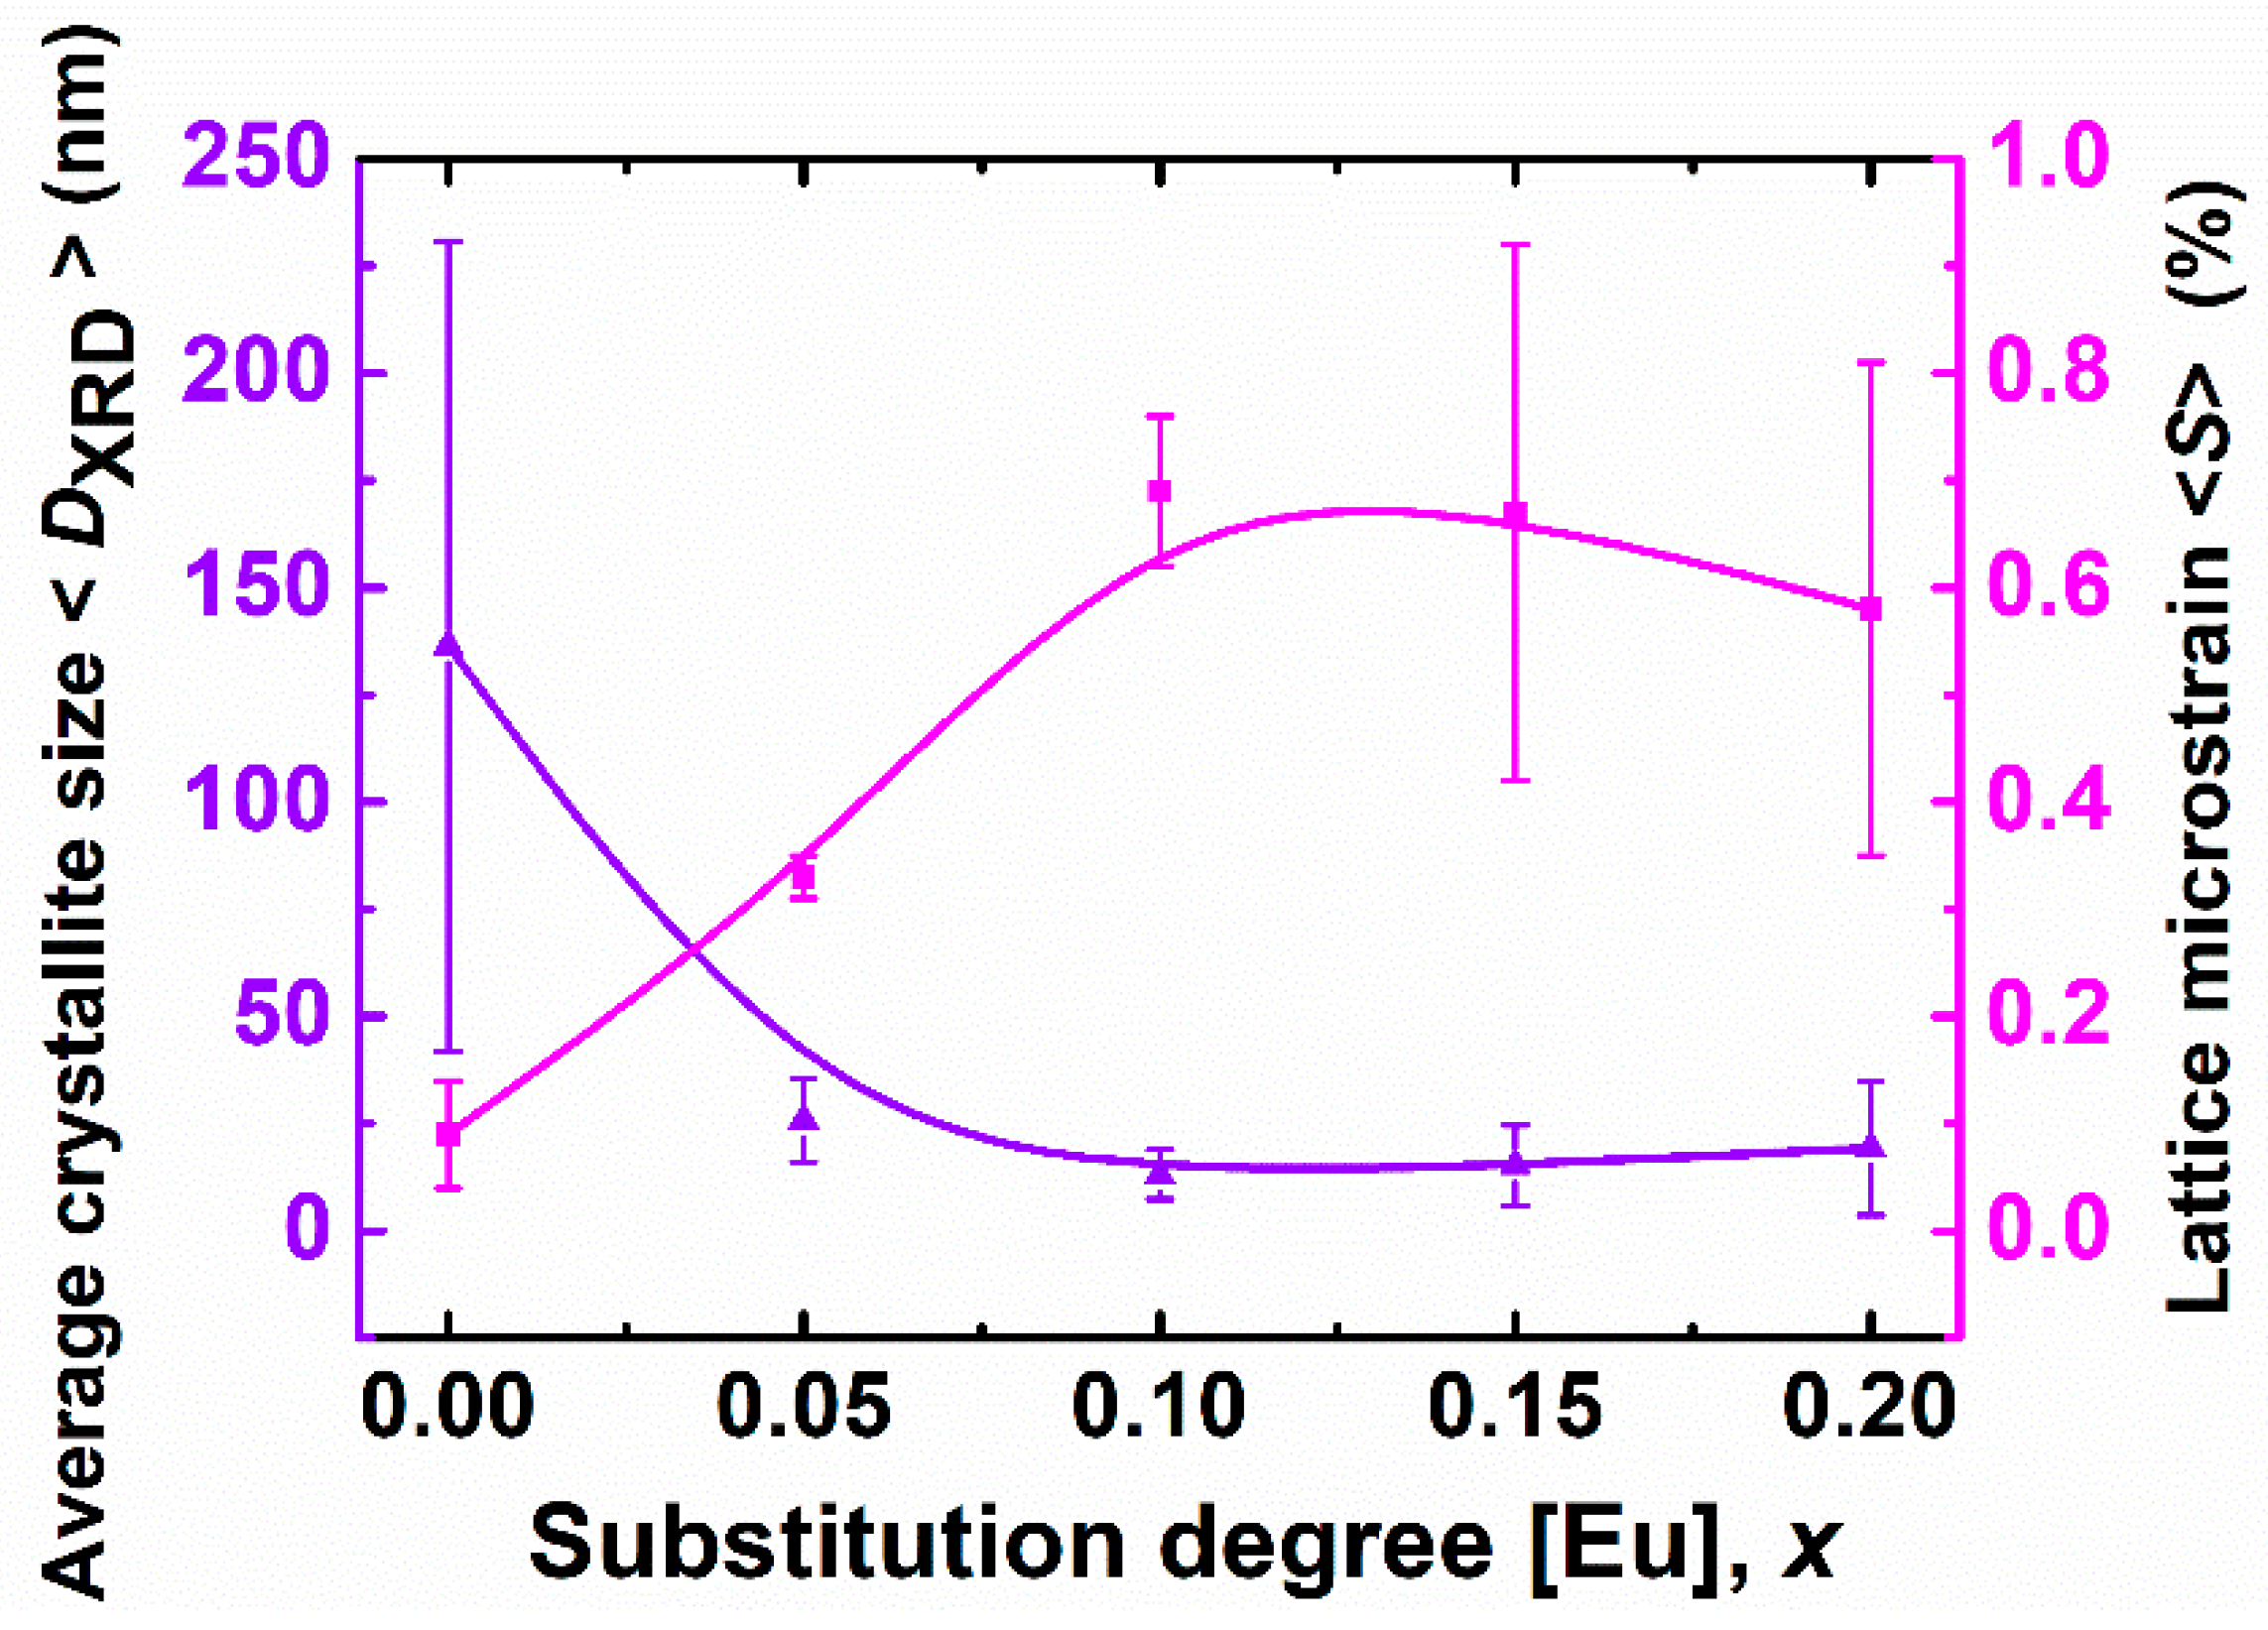
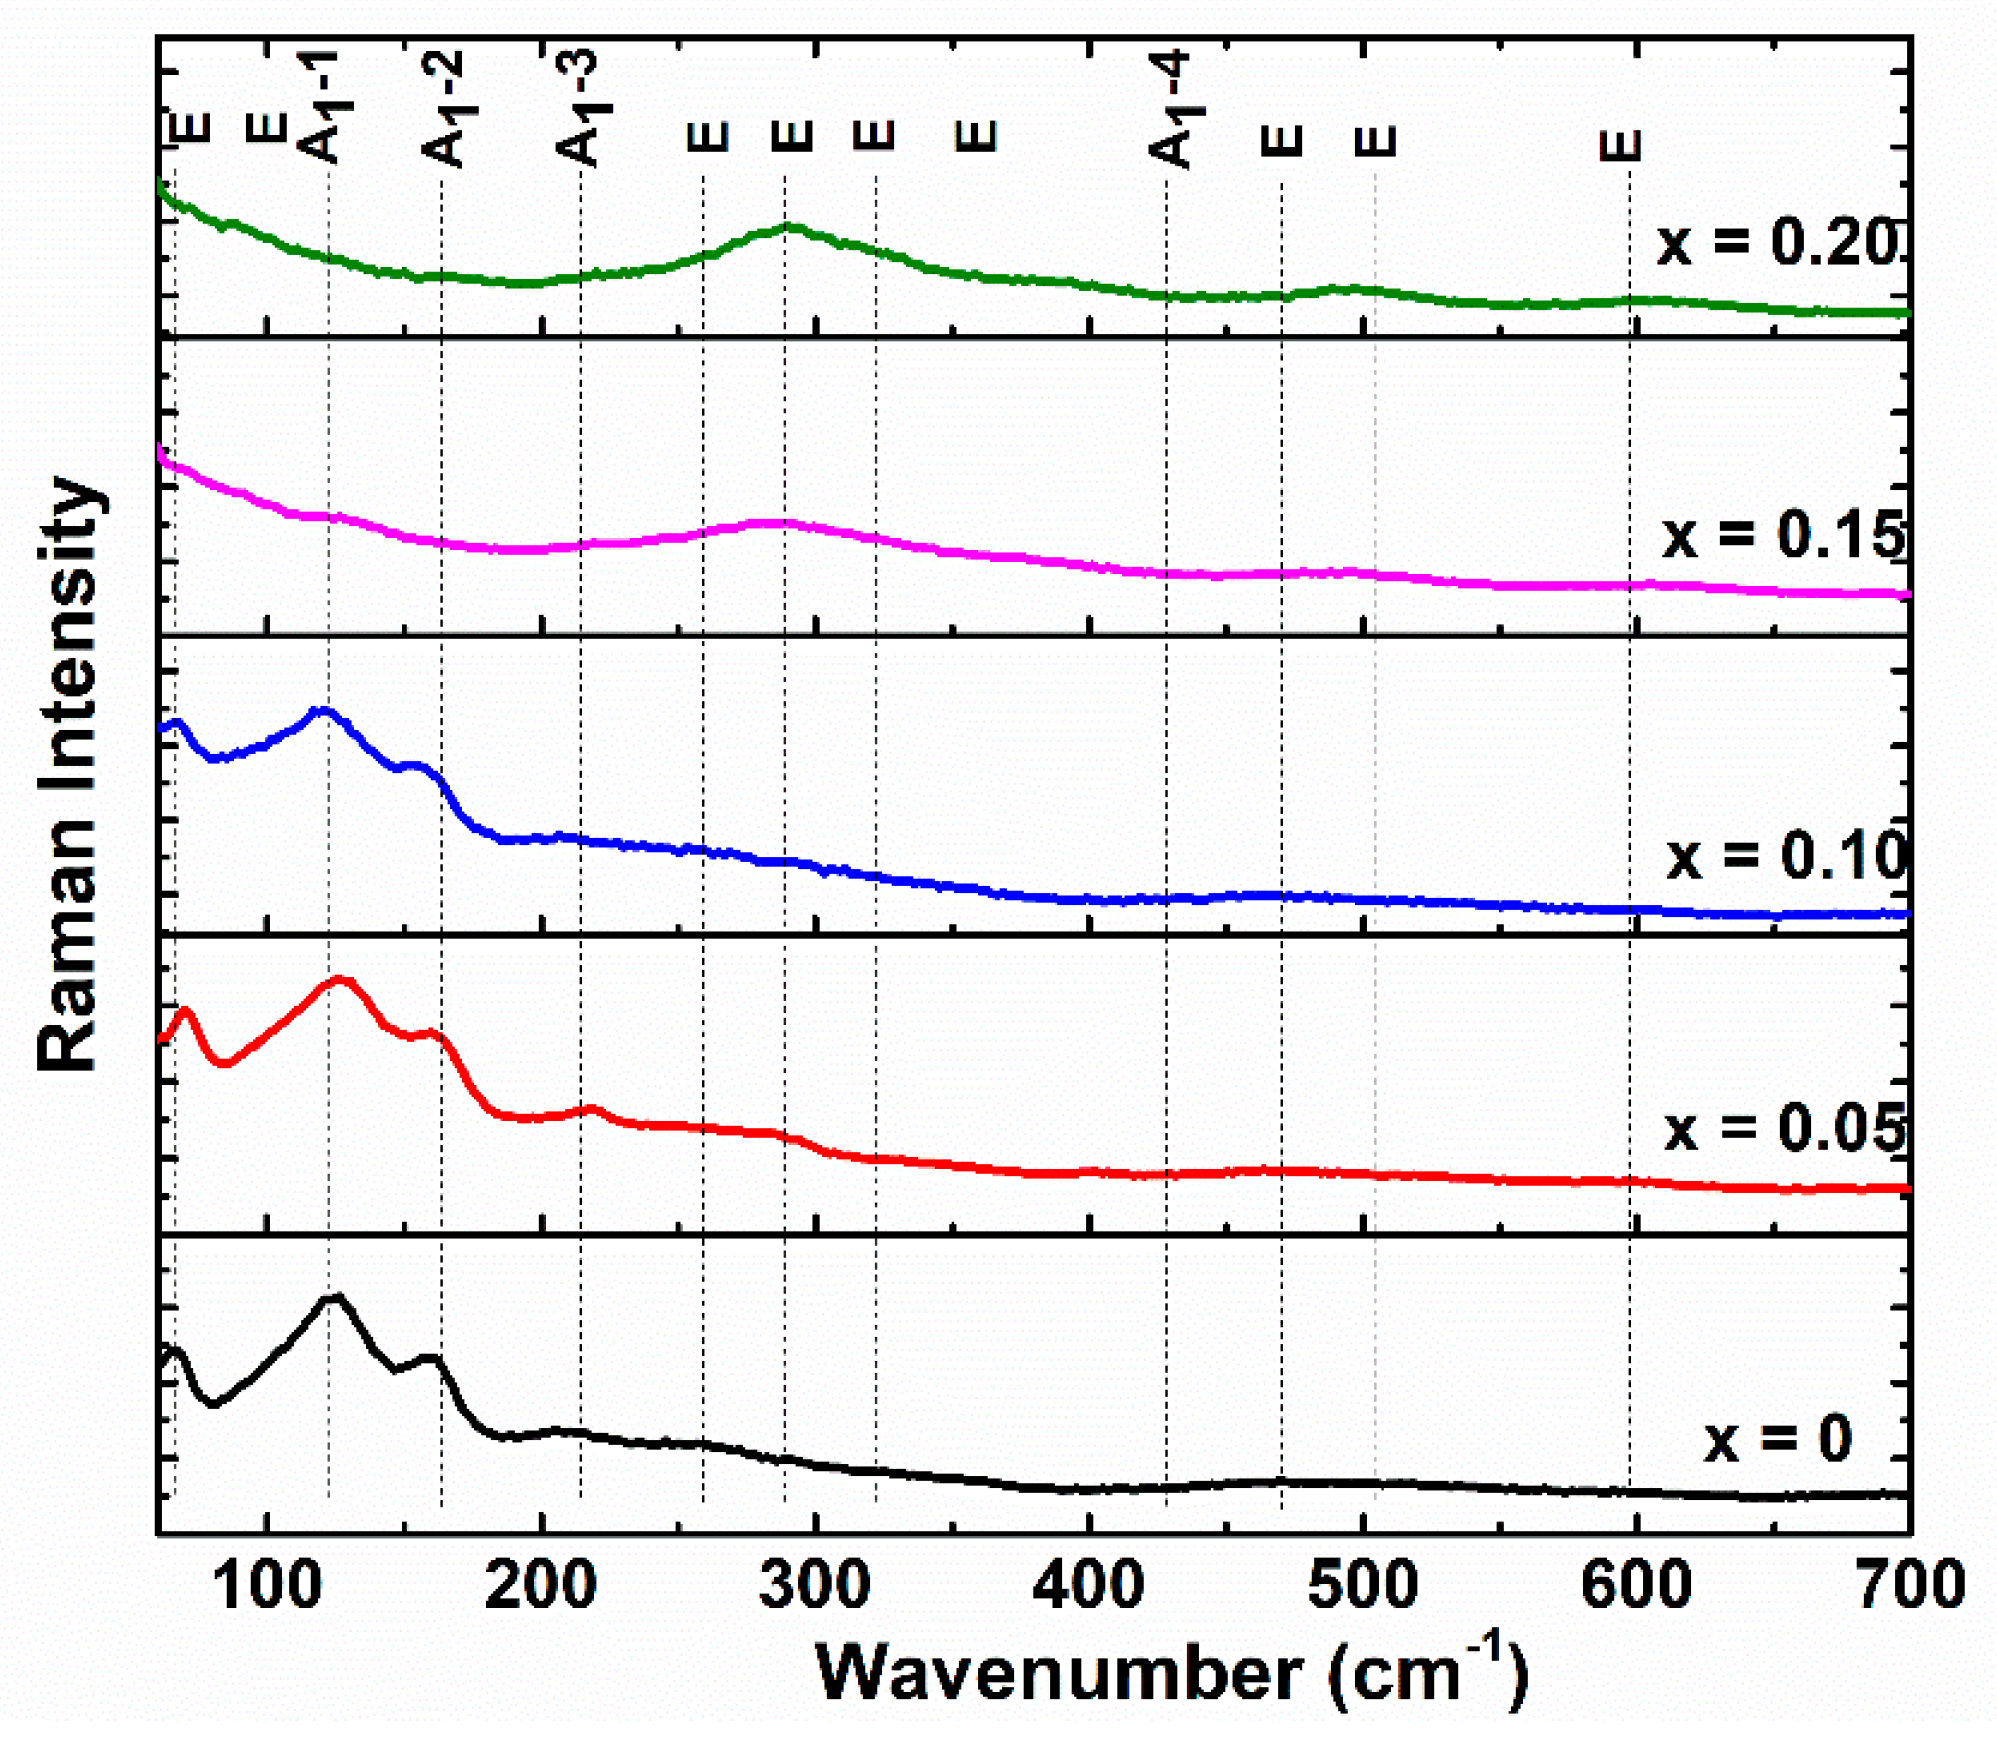
3.2. Phase Composition and Structure of the (Bi,Eu)FeO3 Powders
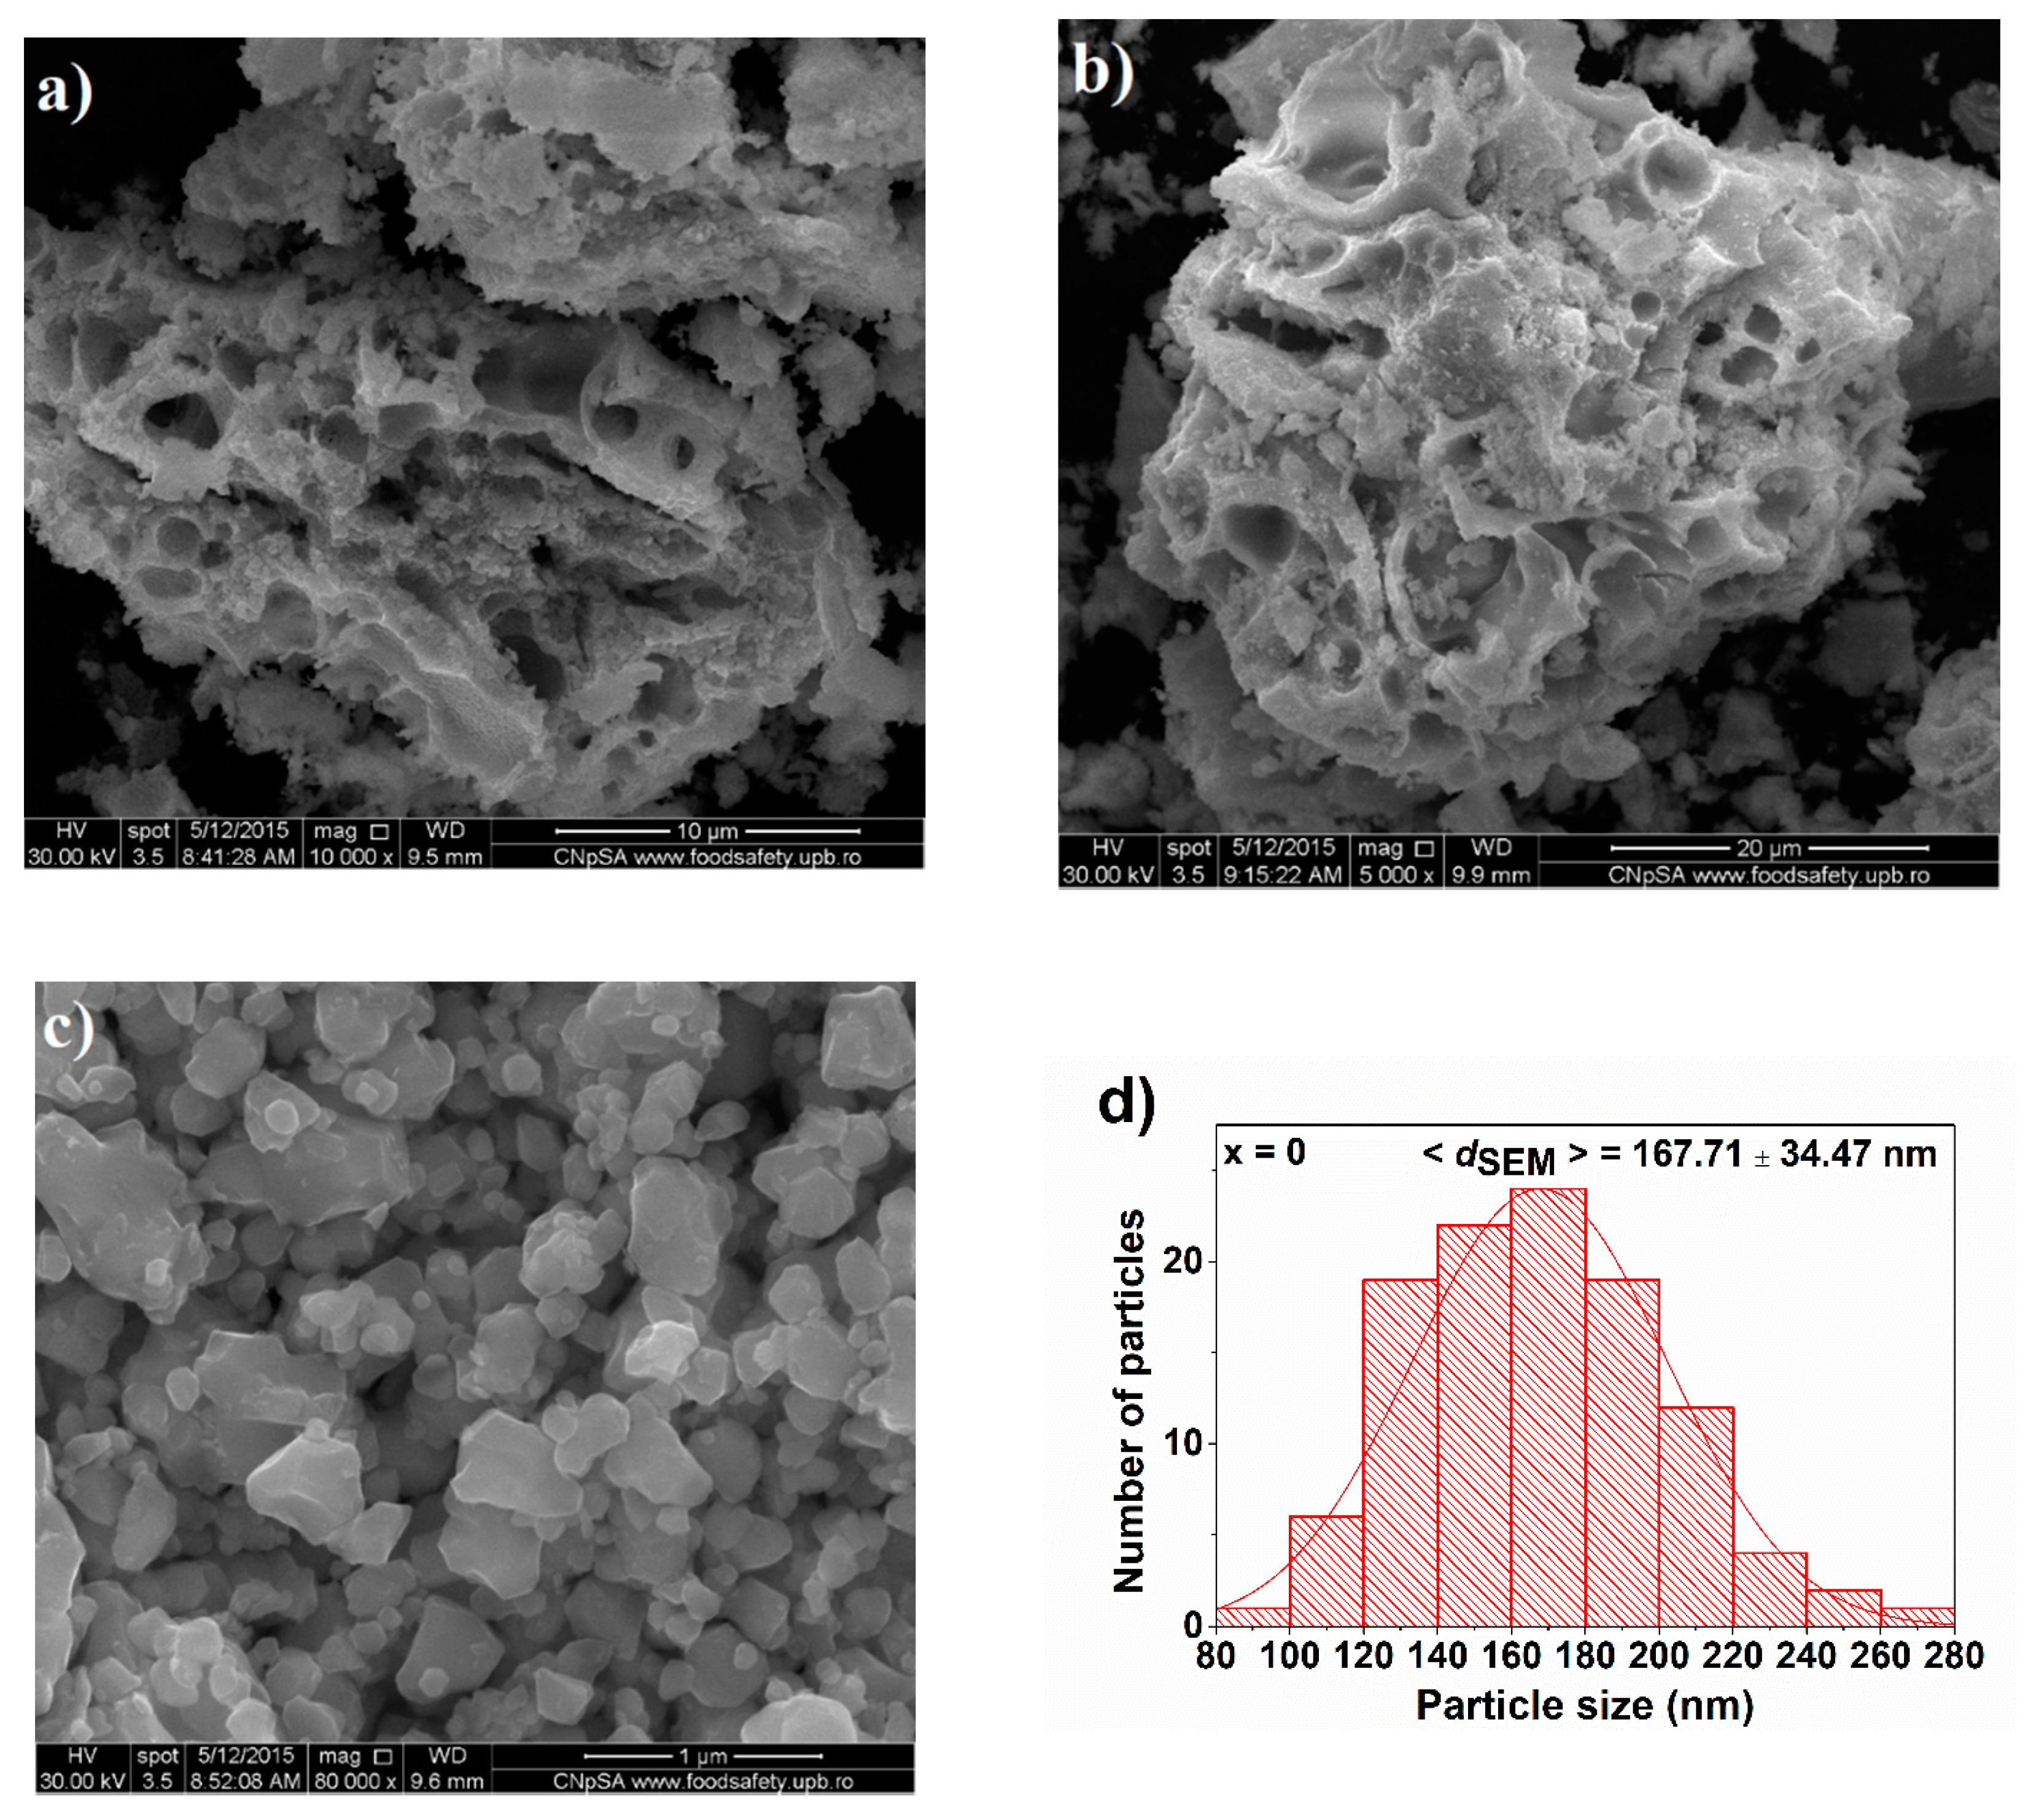
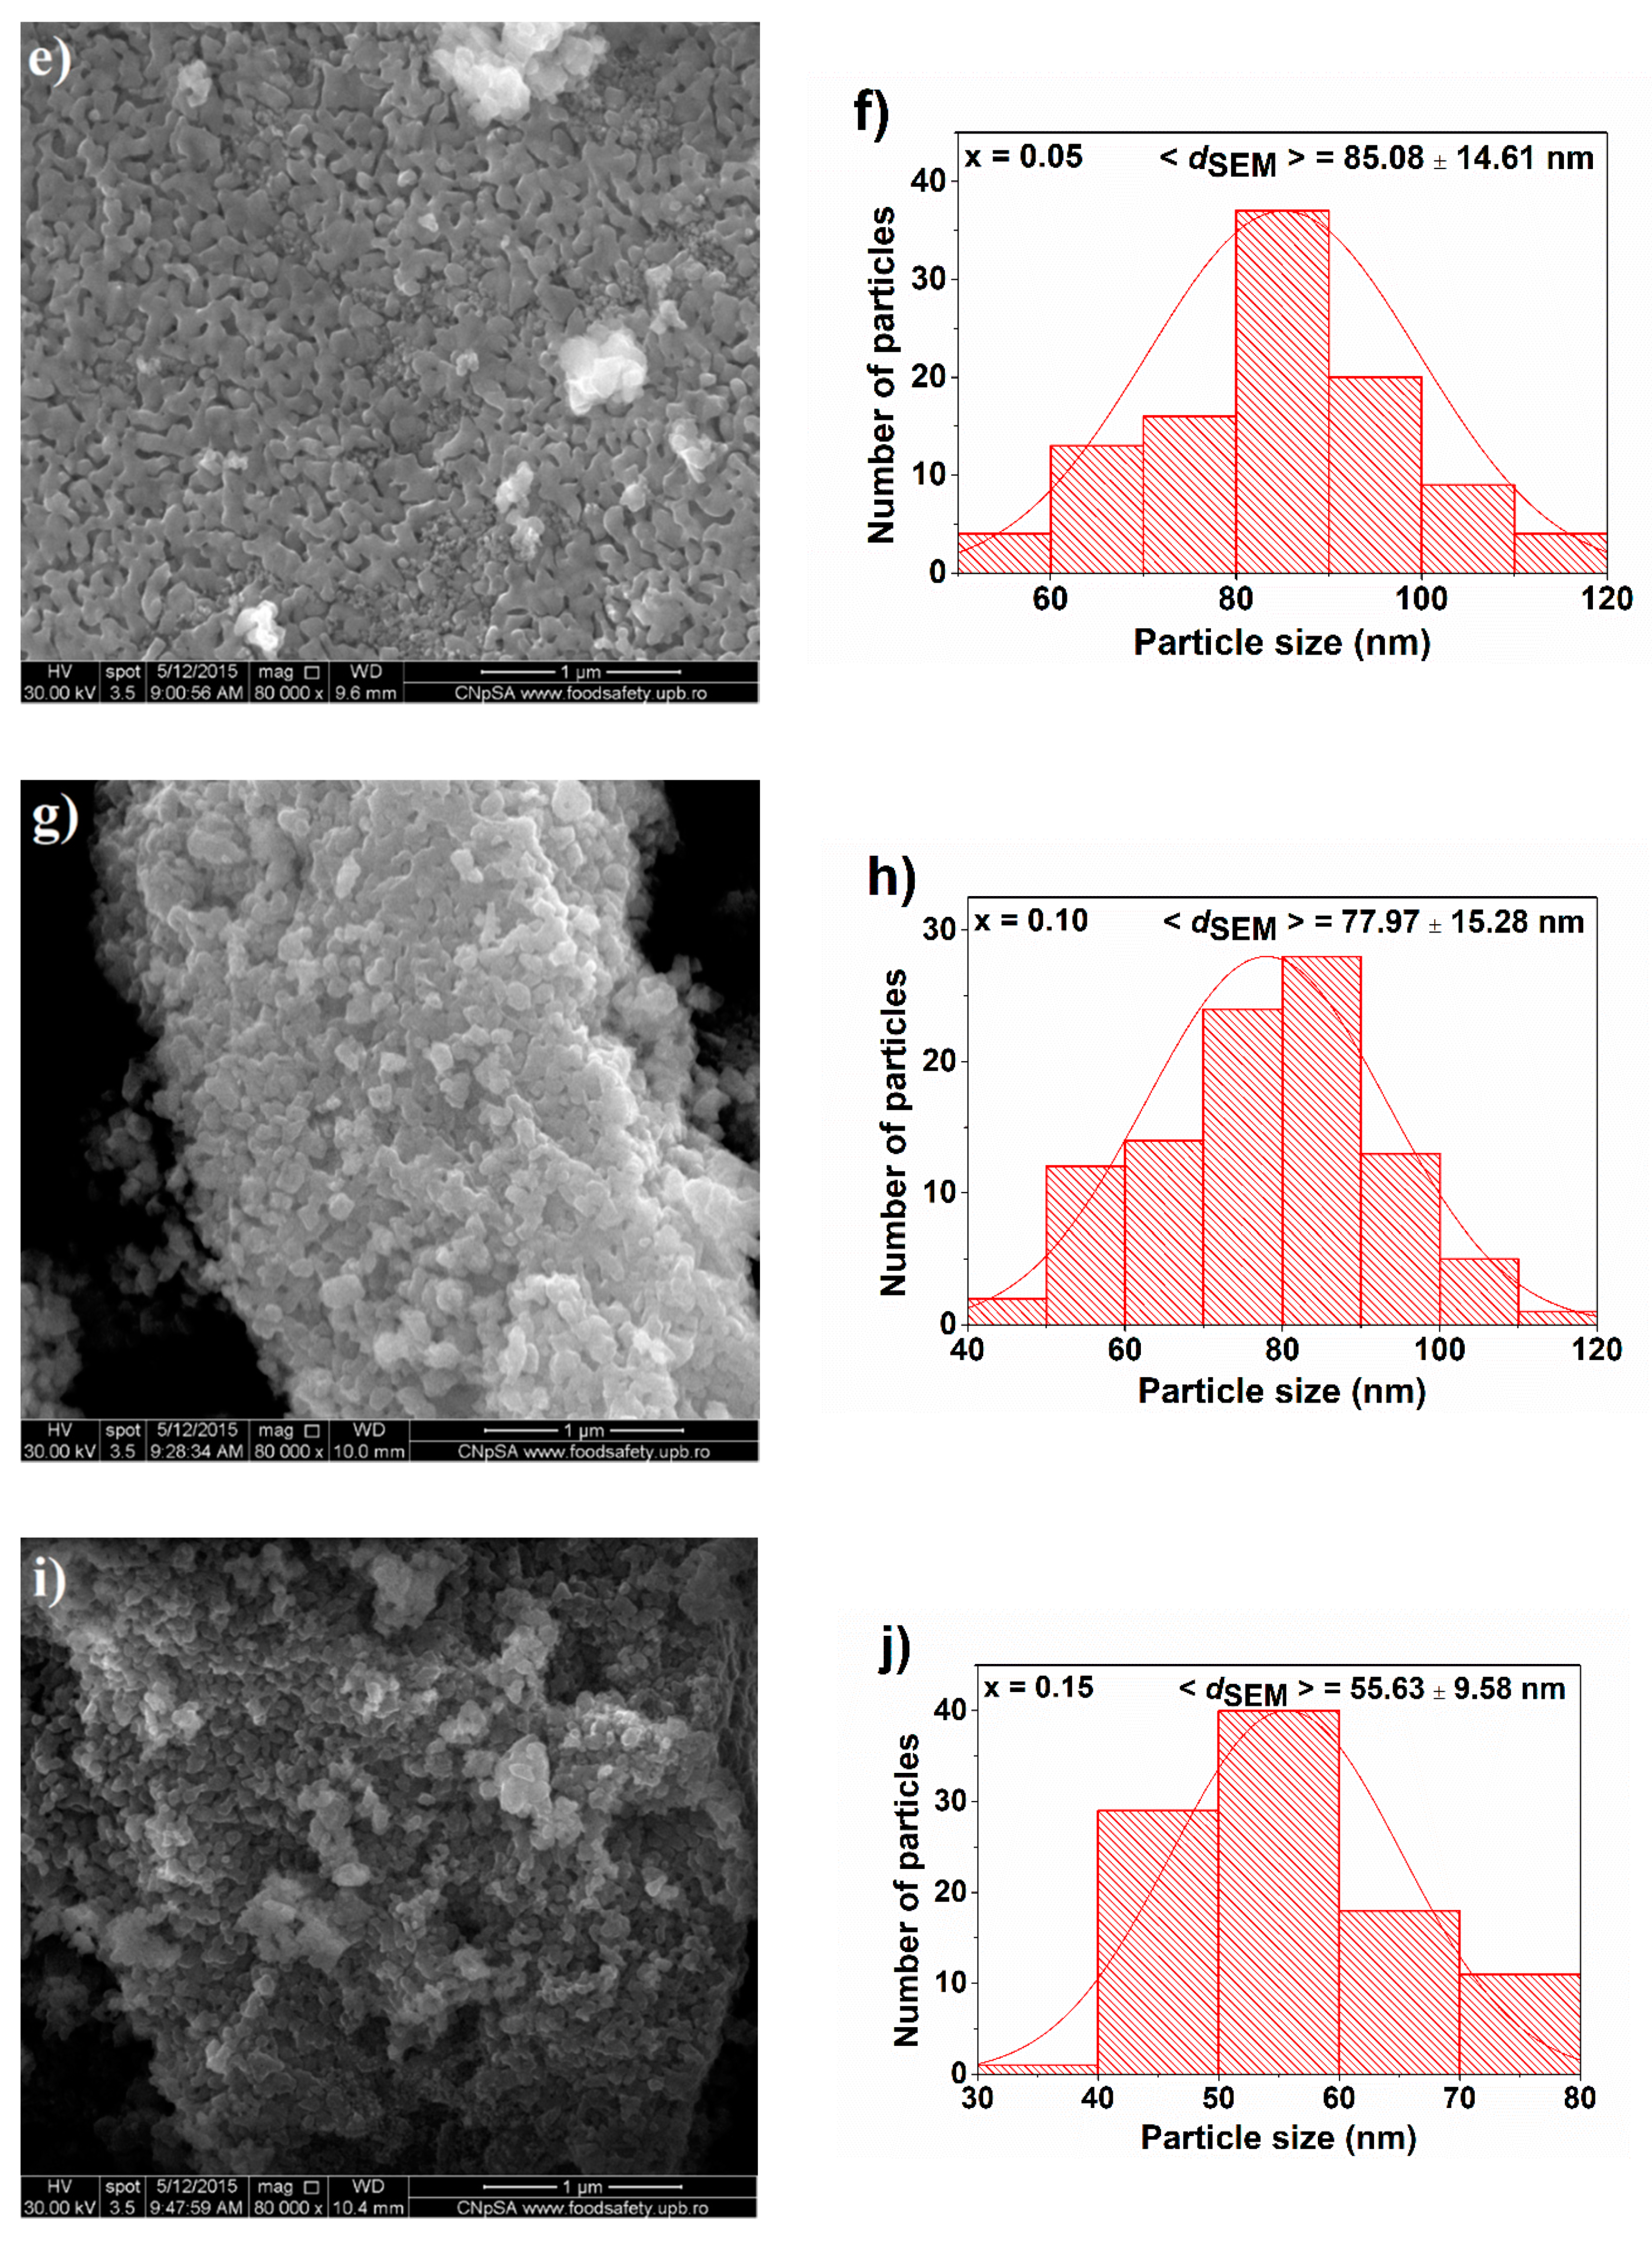
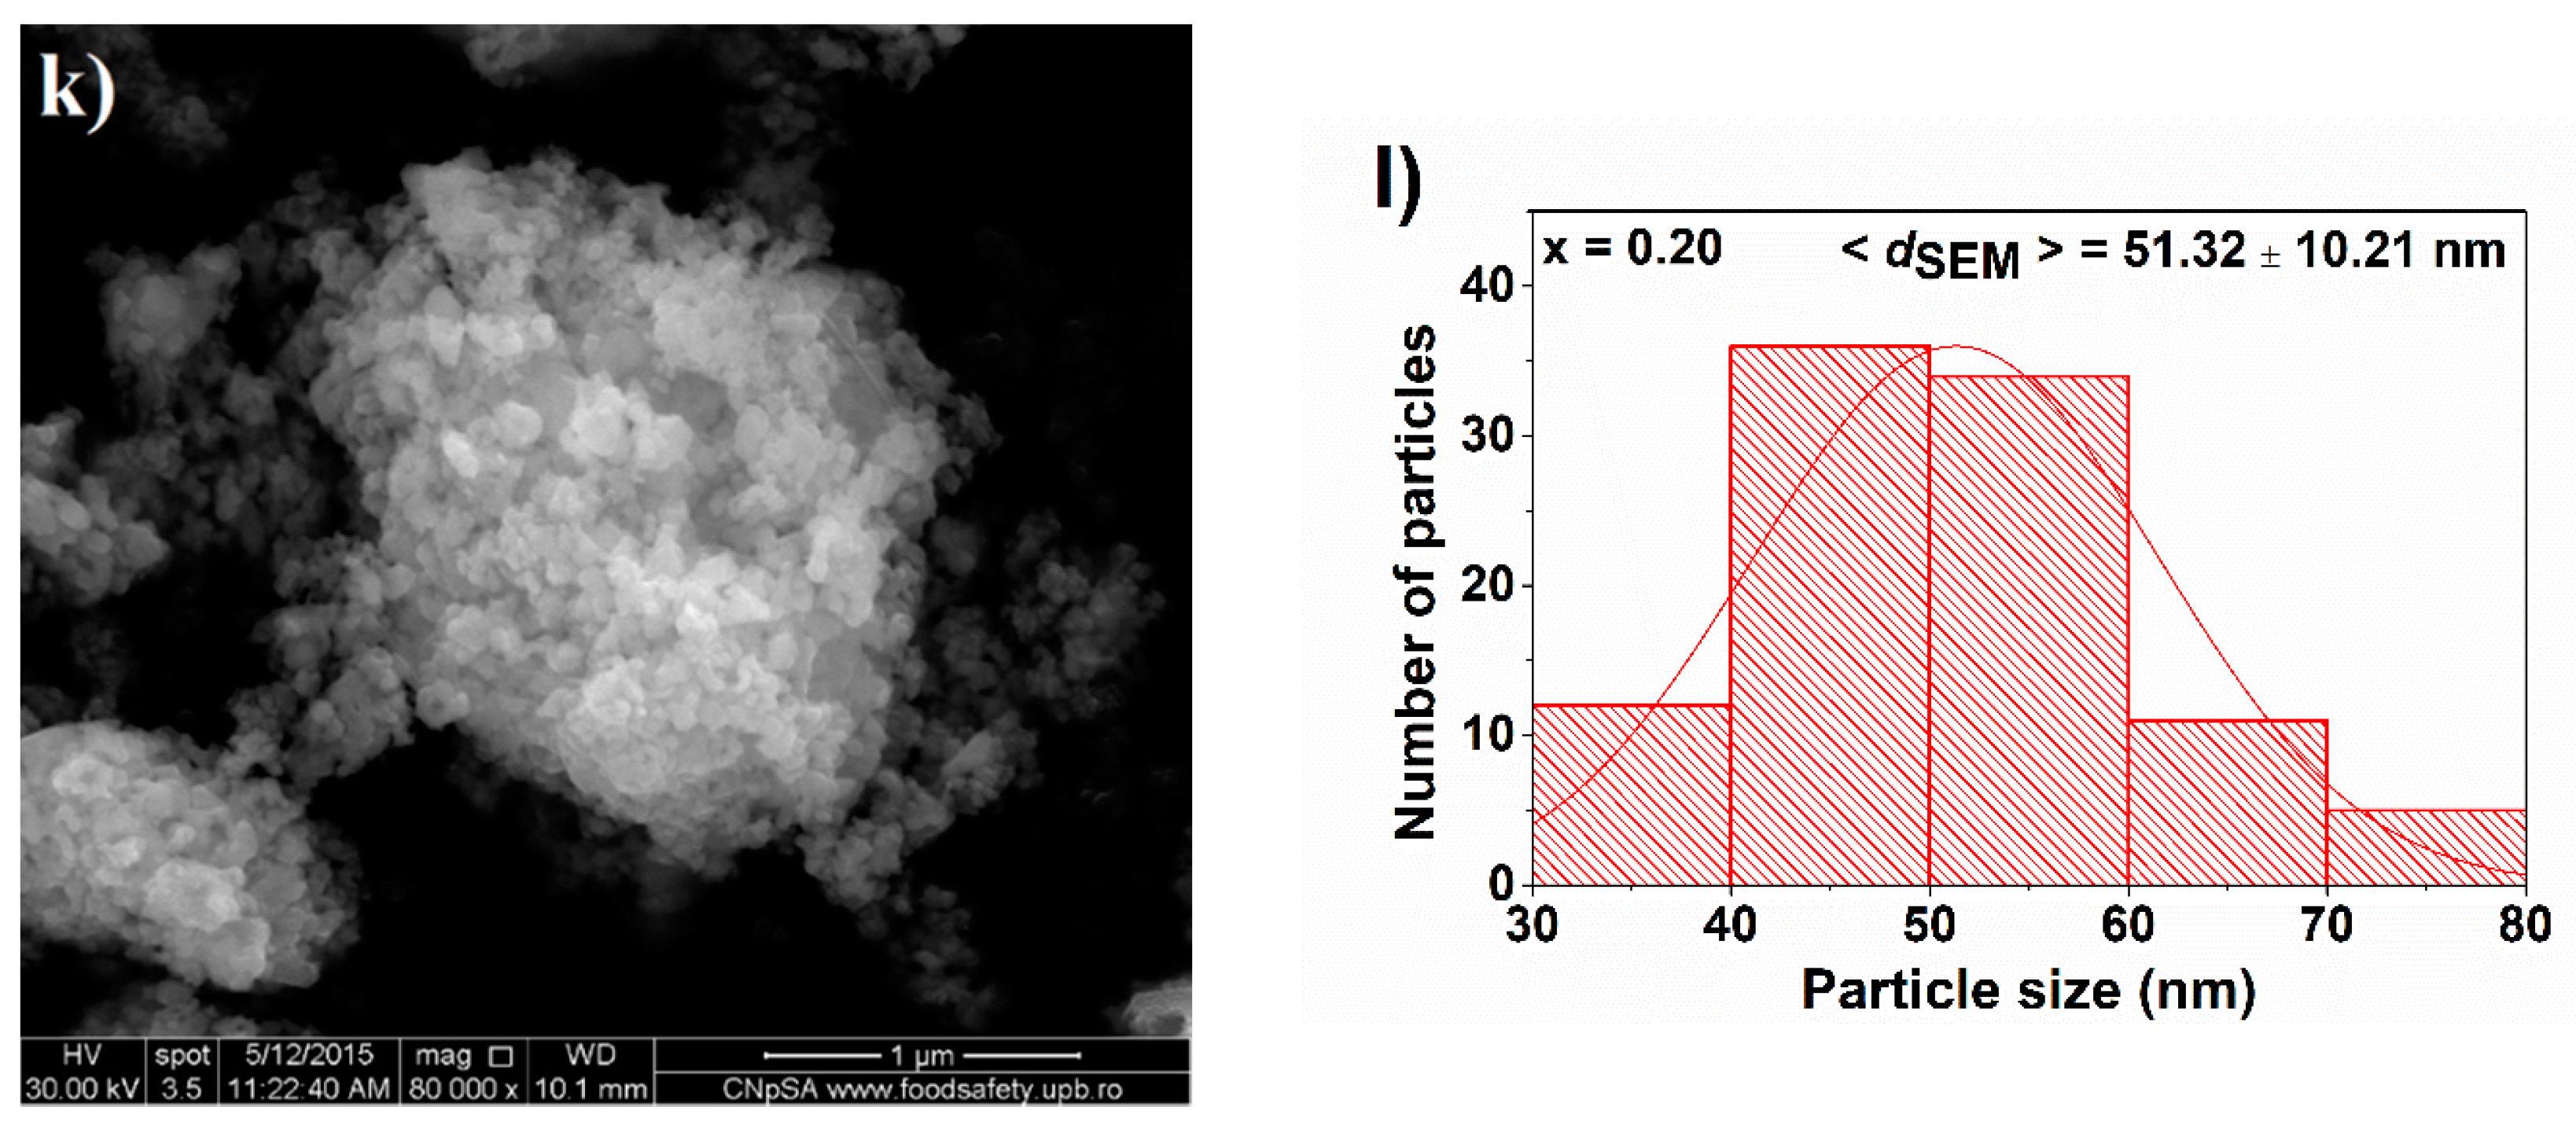
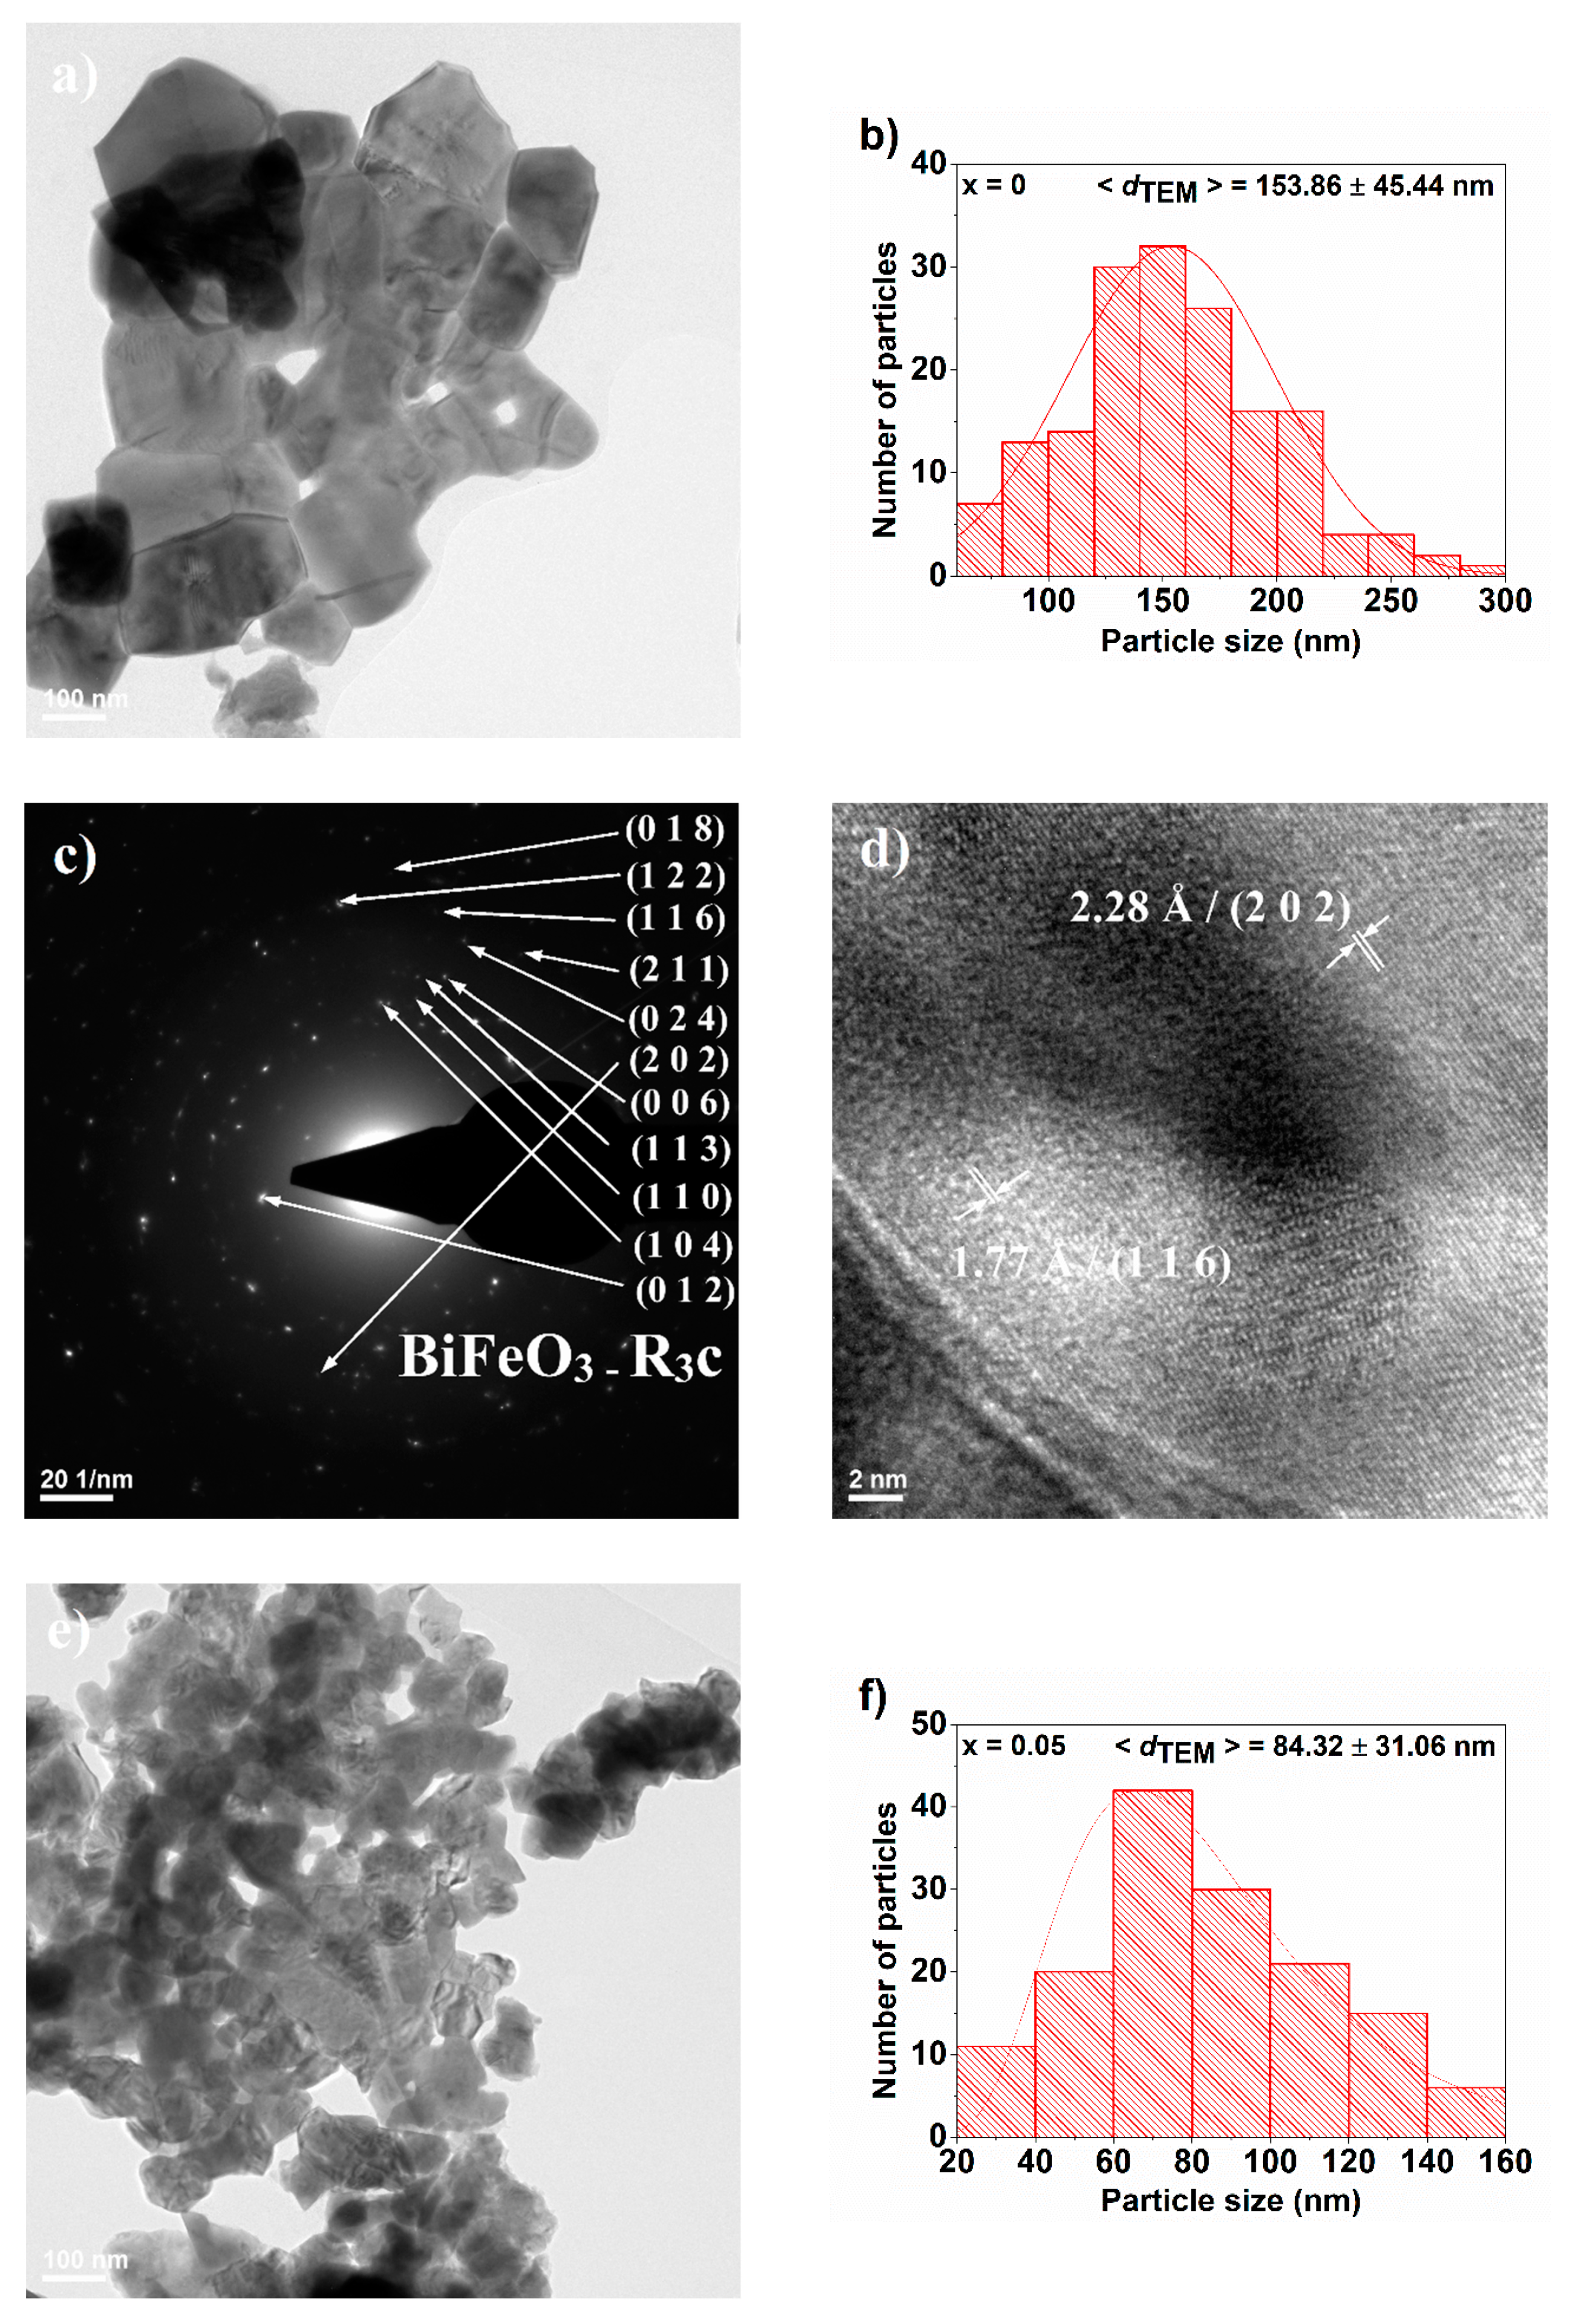
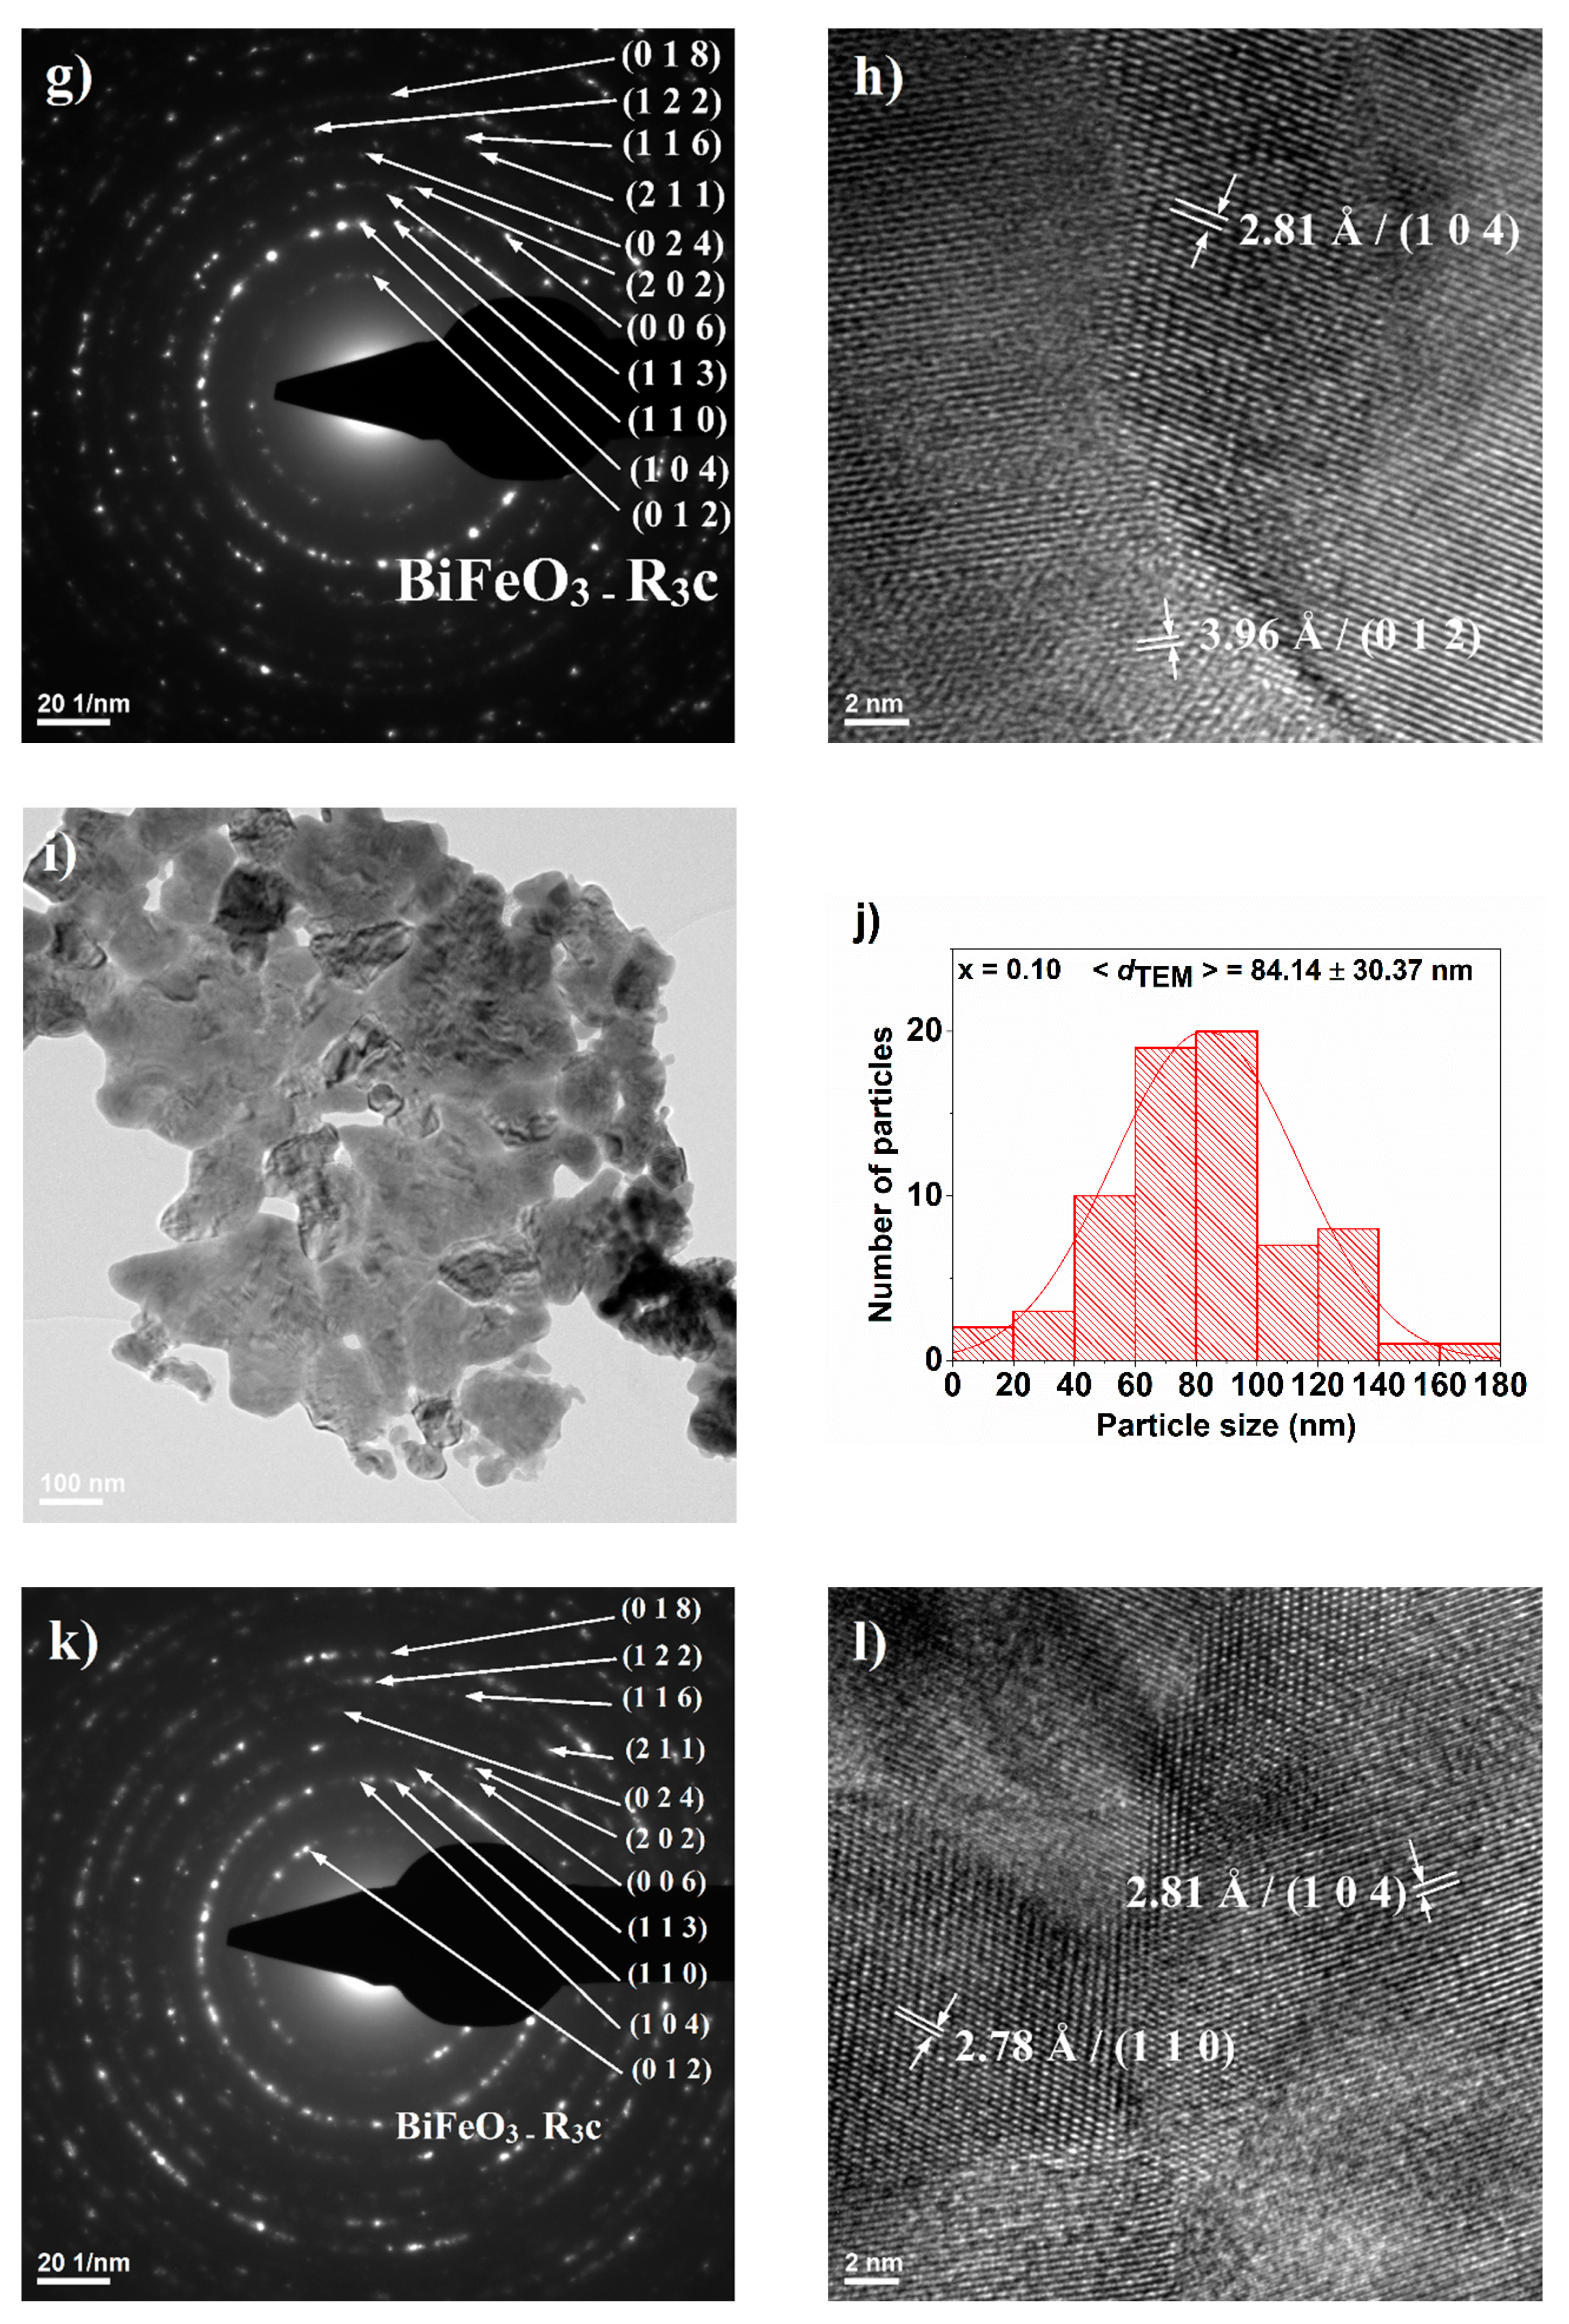
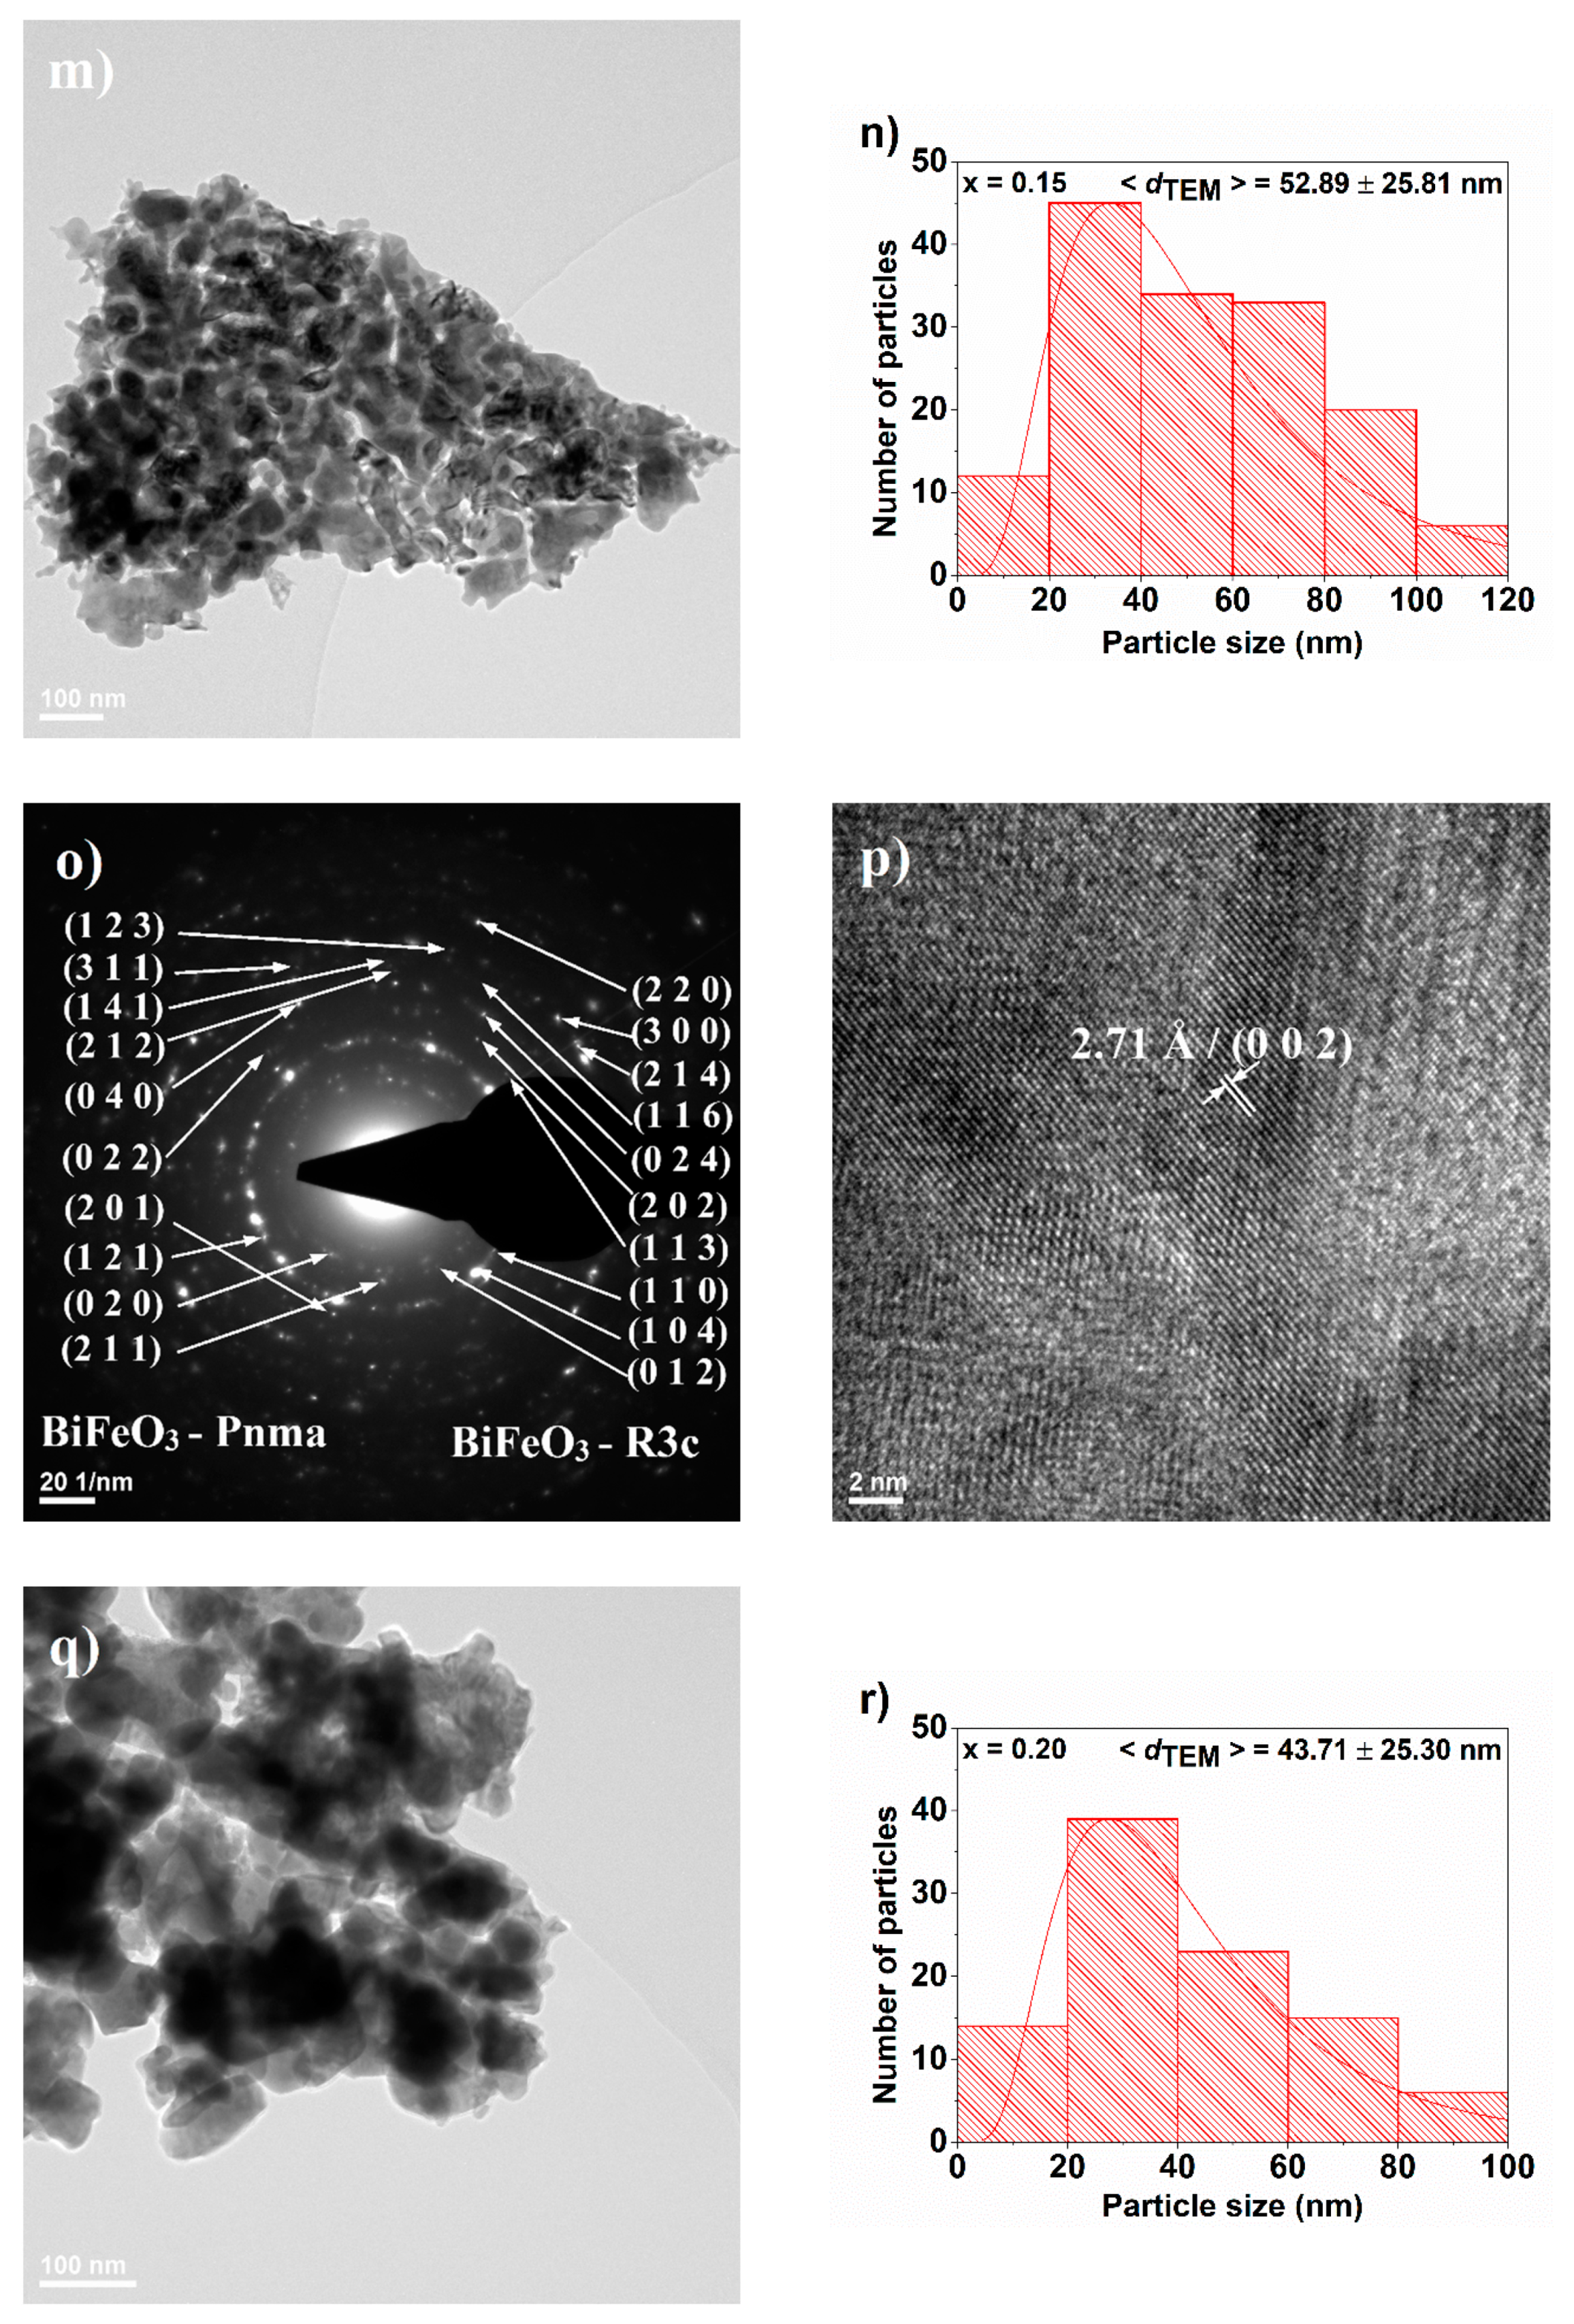
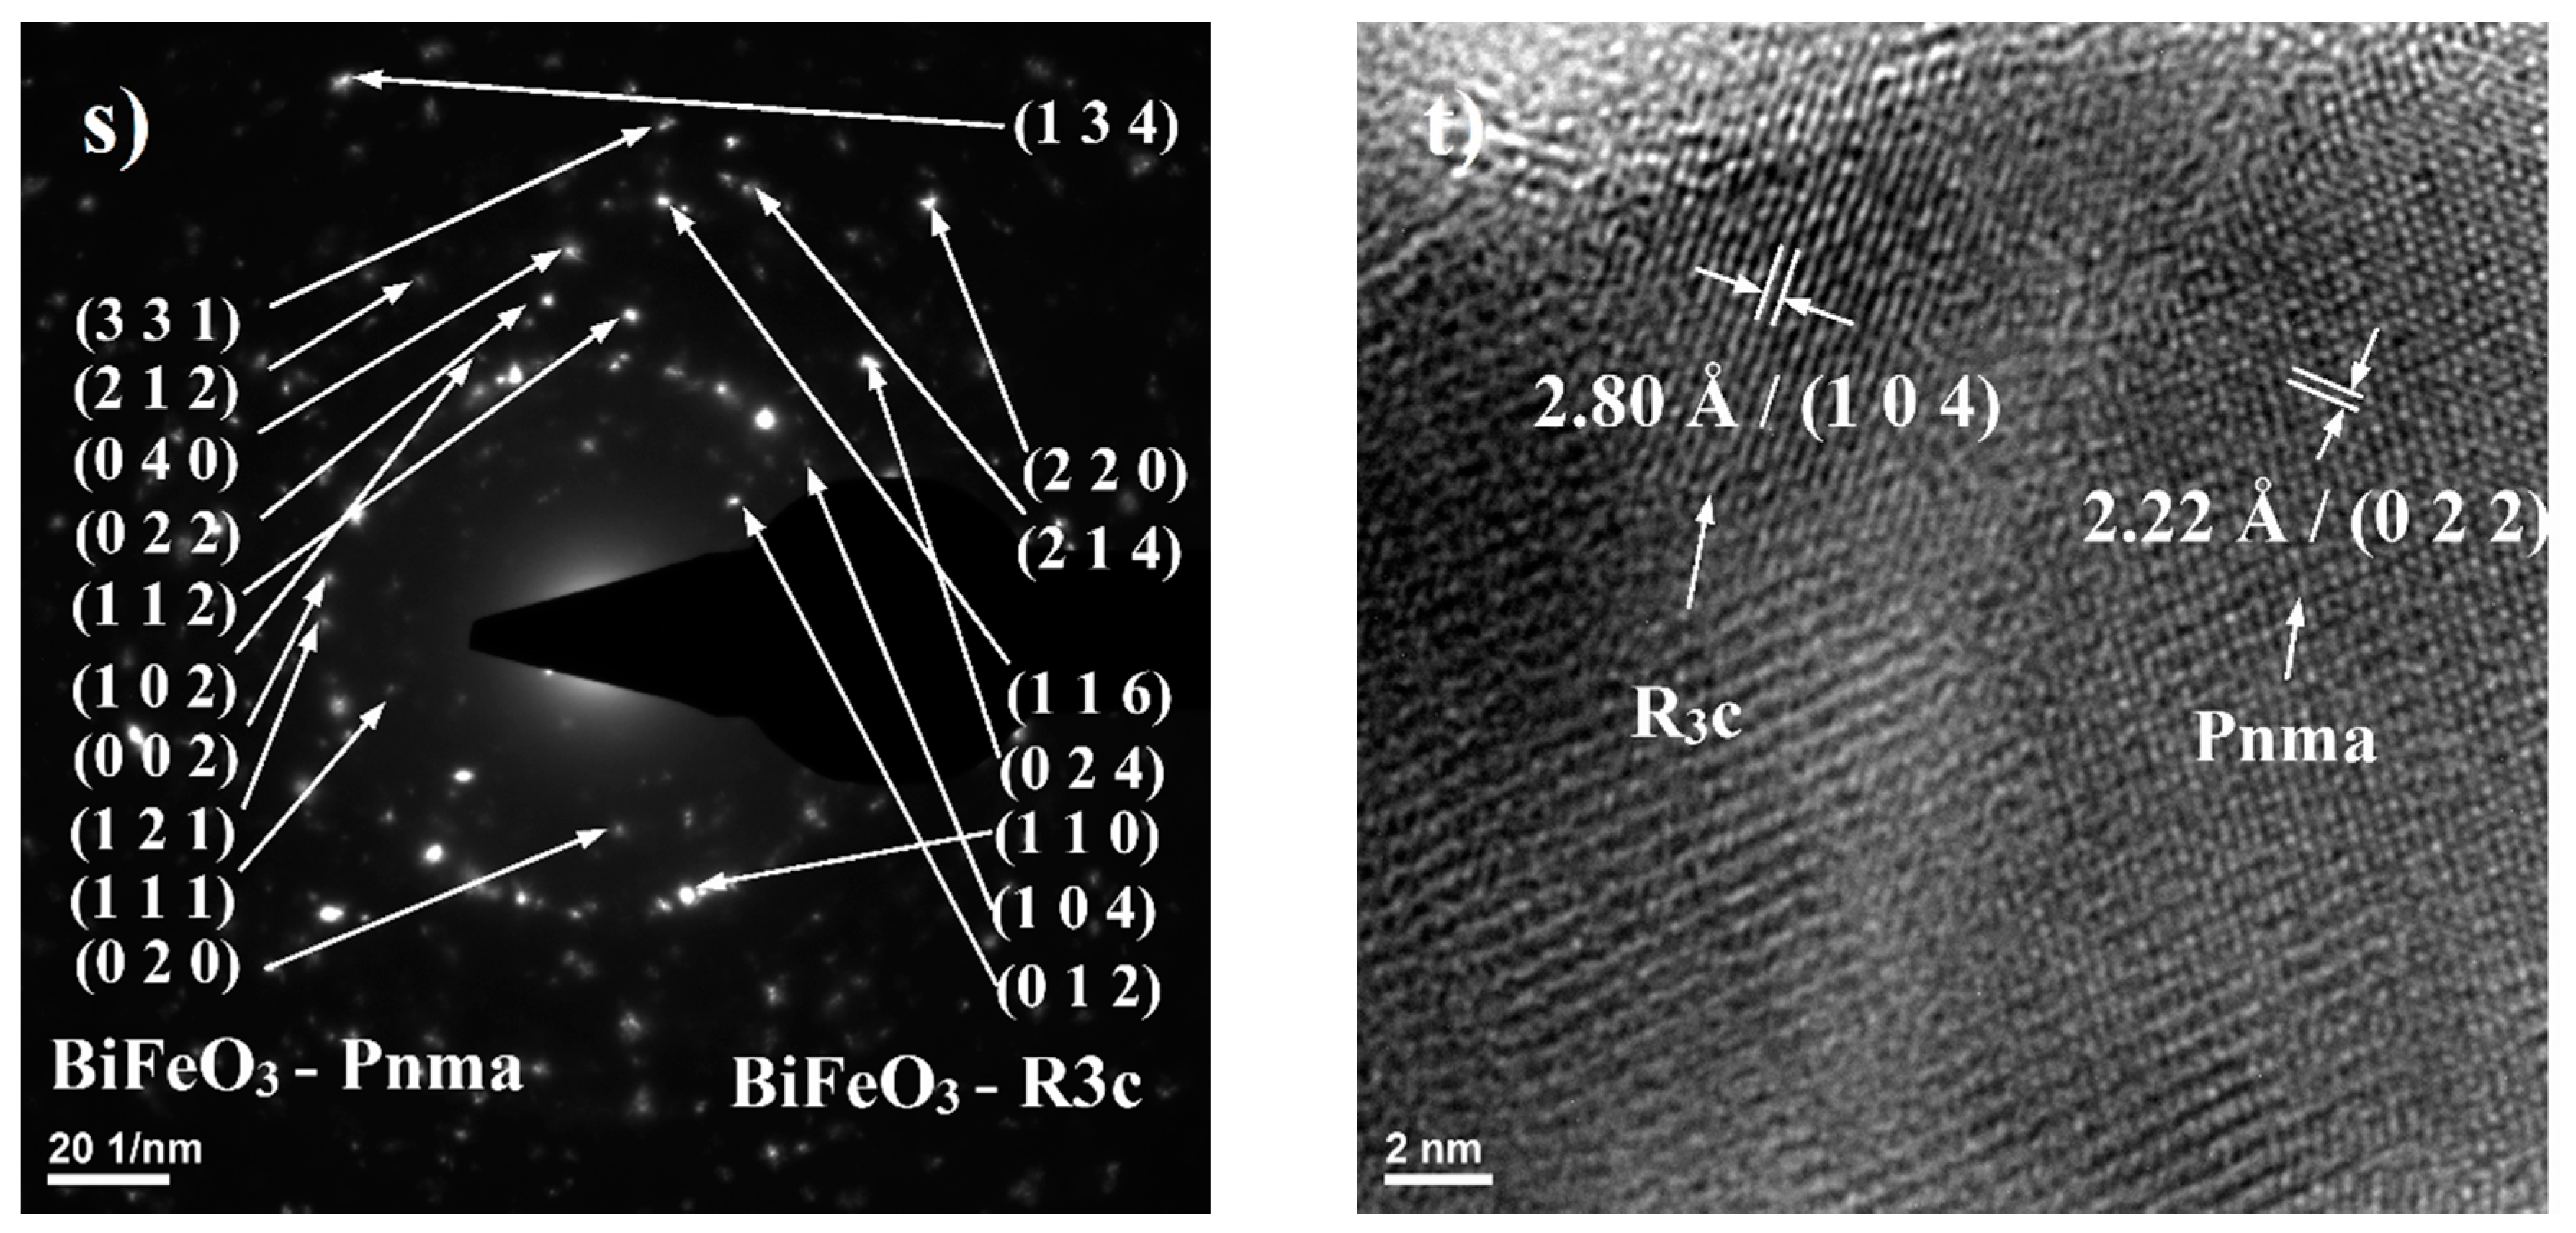
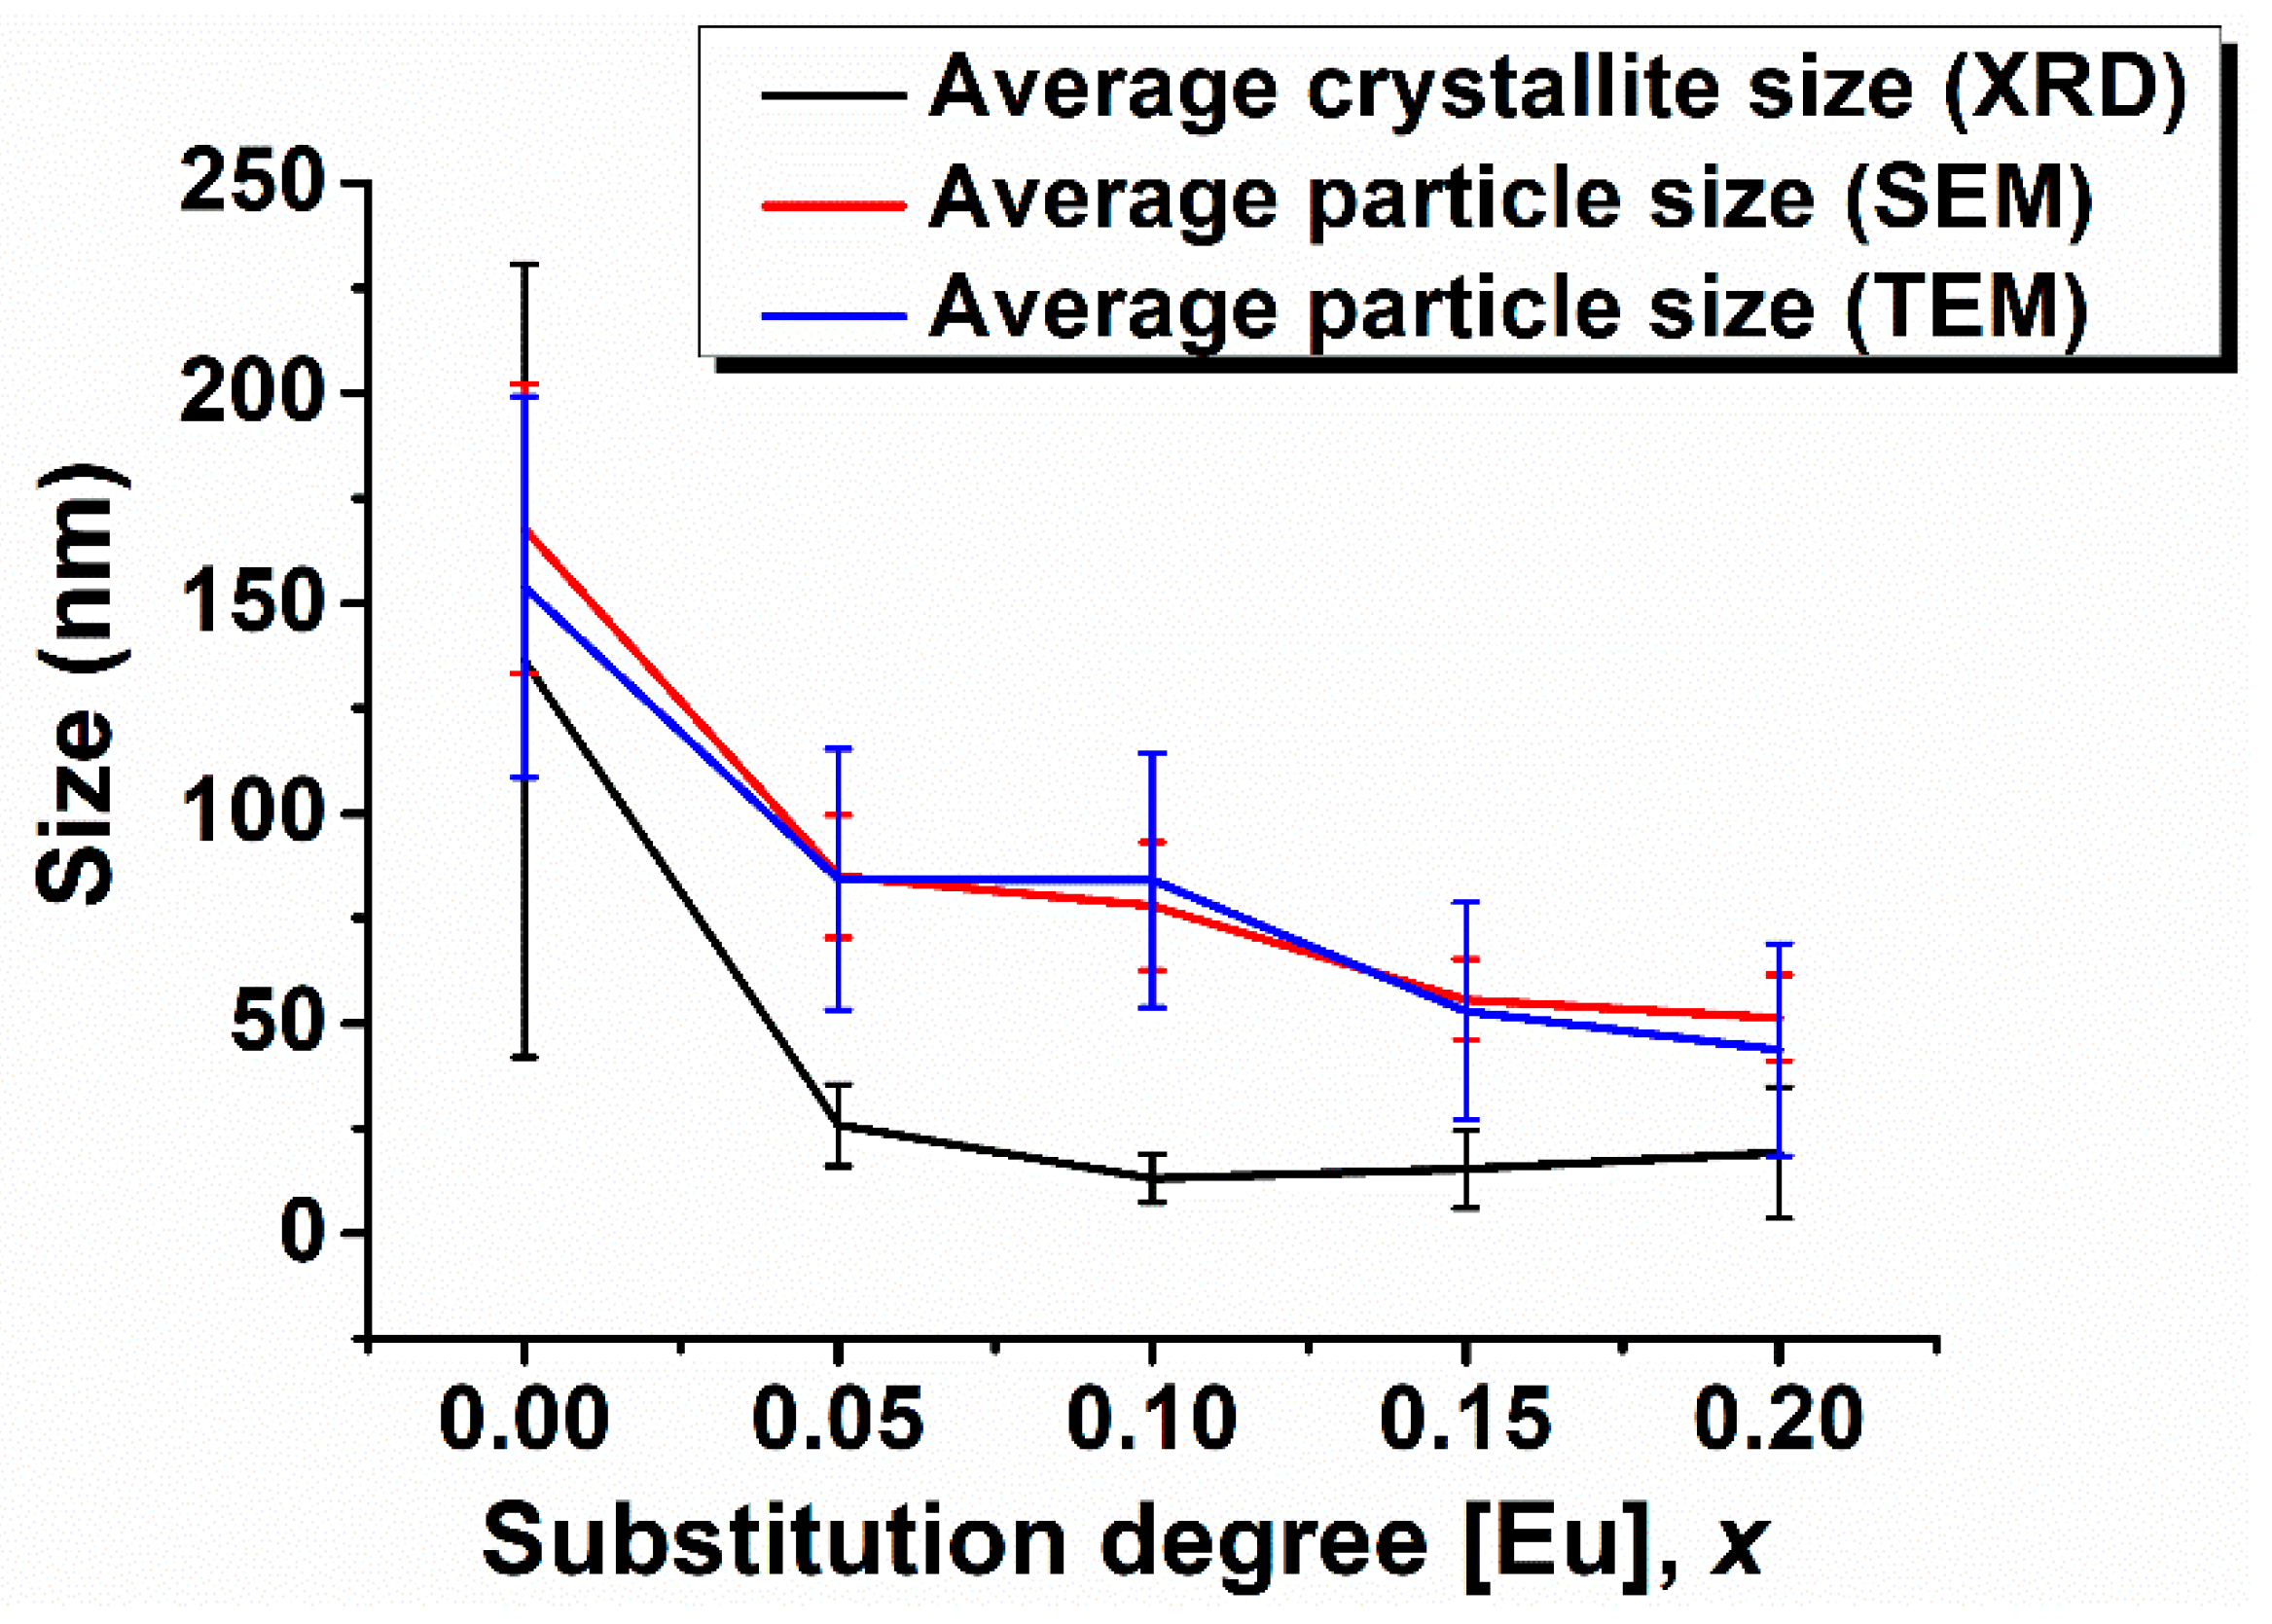
3.3. Morphology
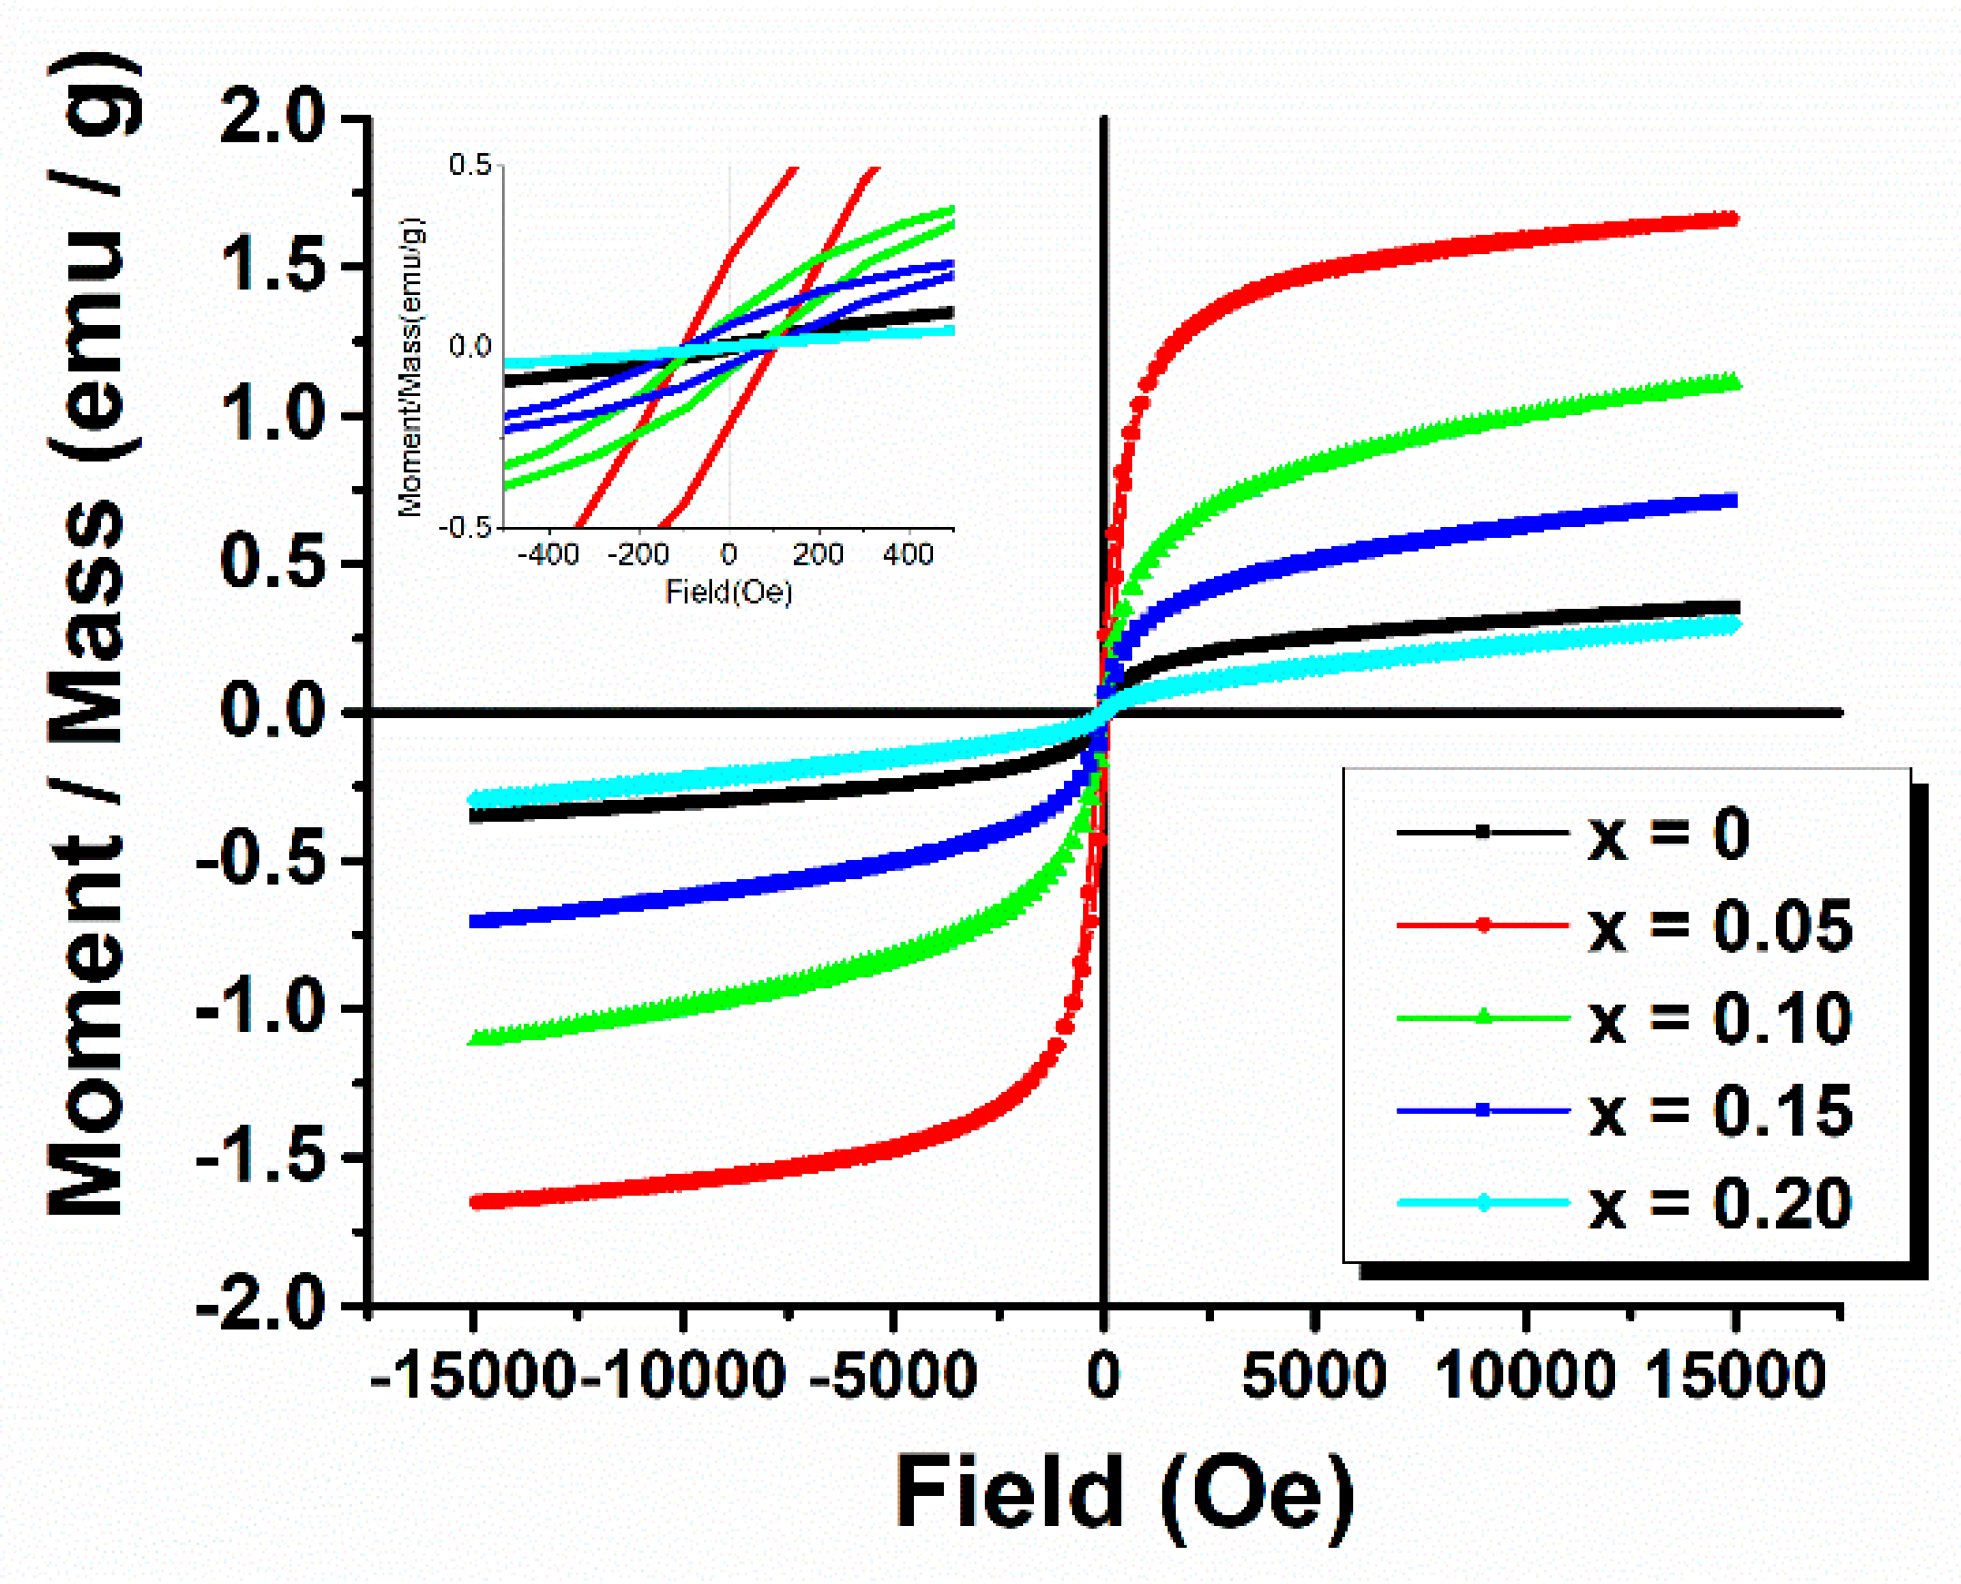
3.4. Magnetic Behavior
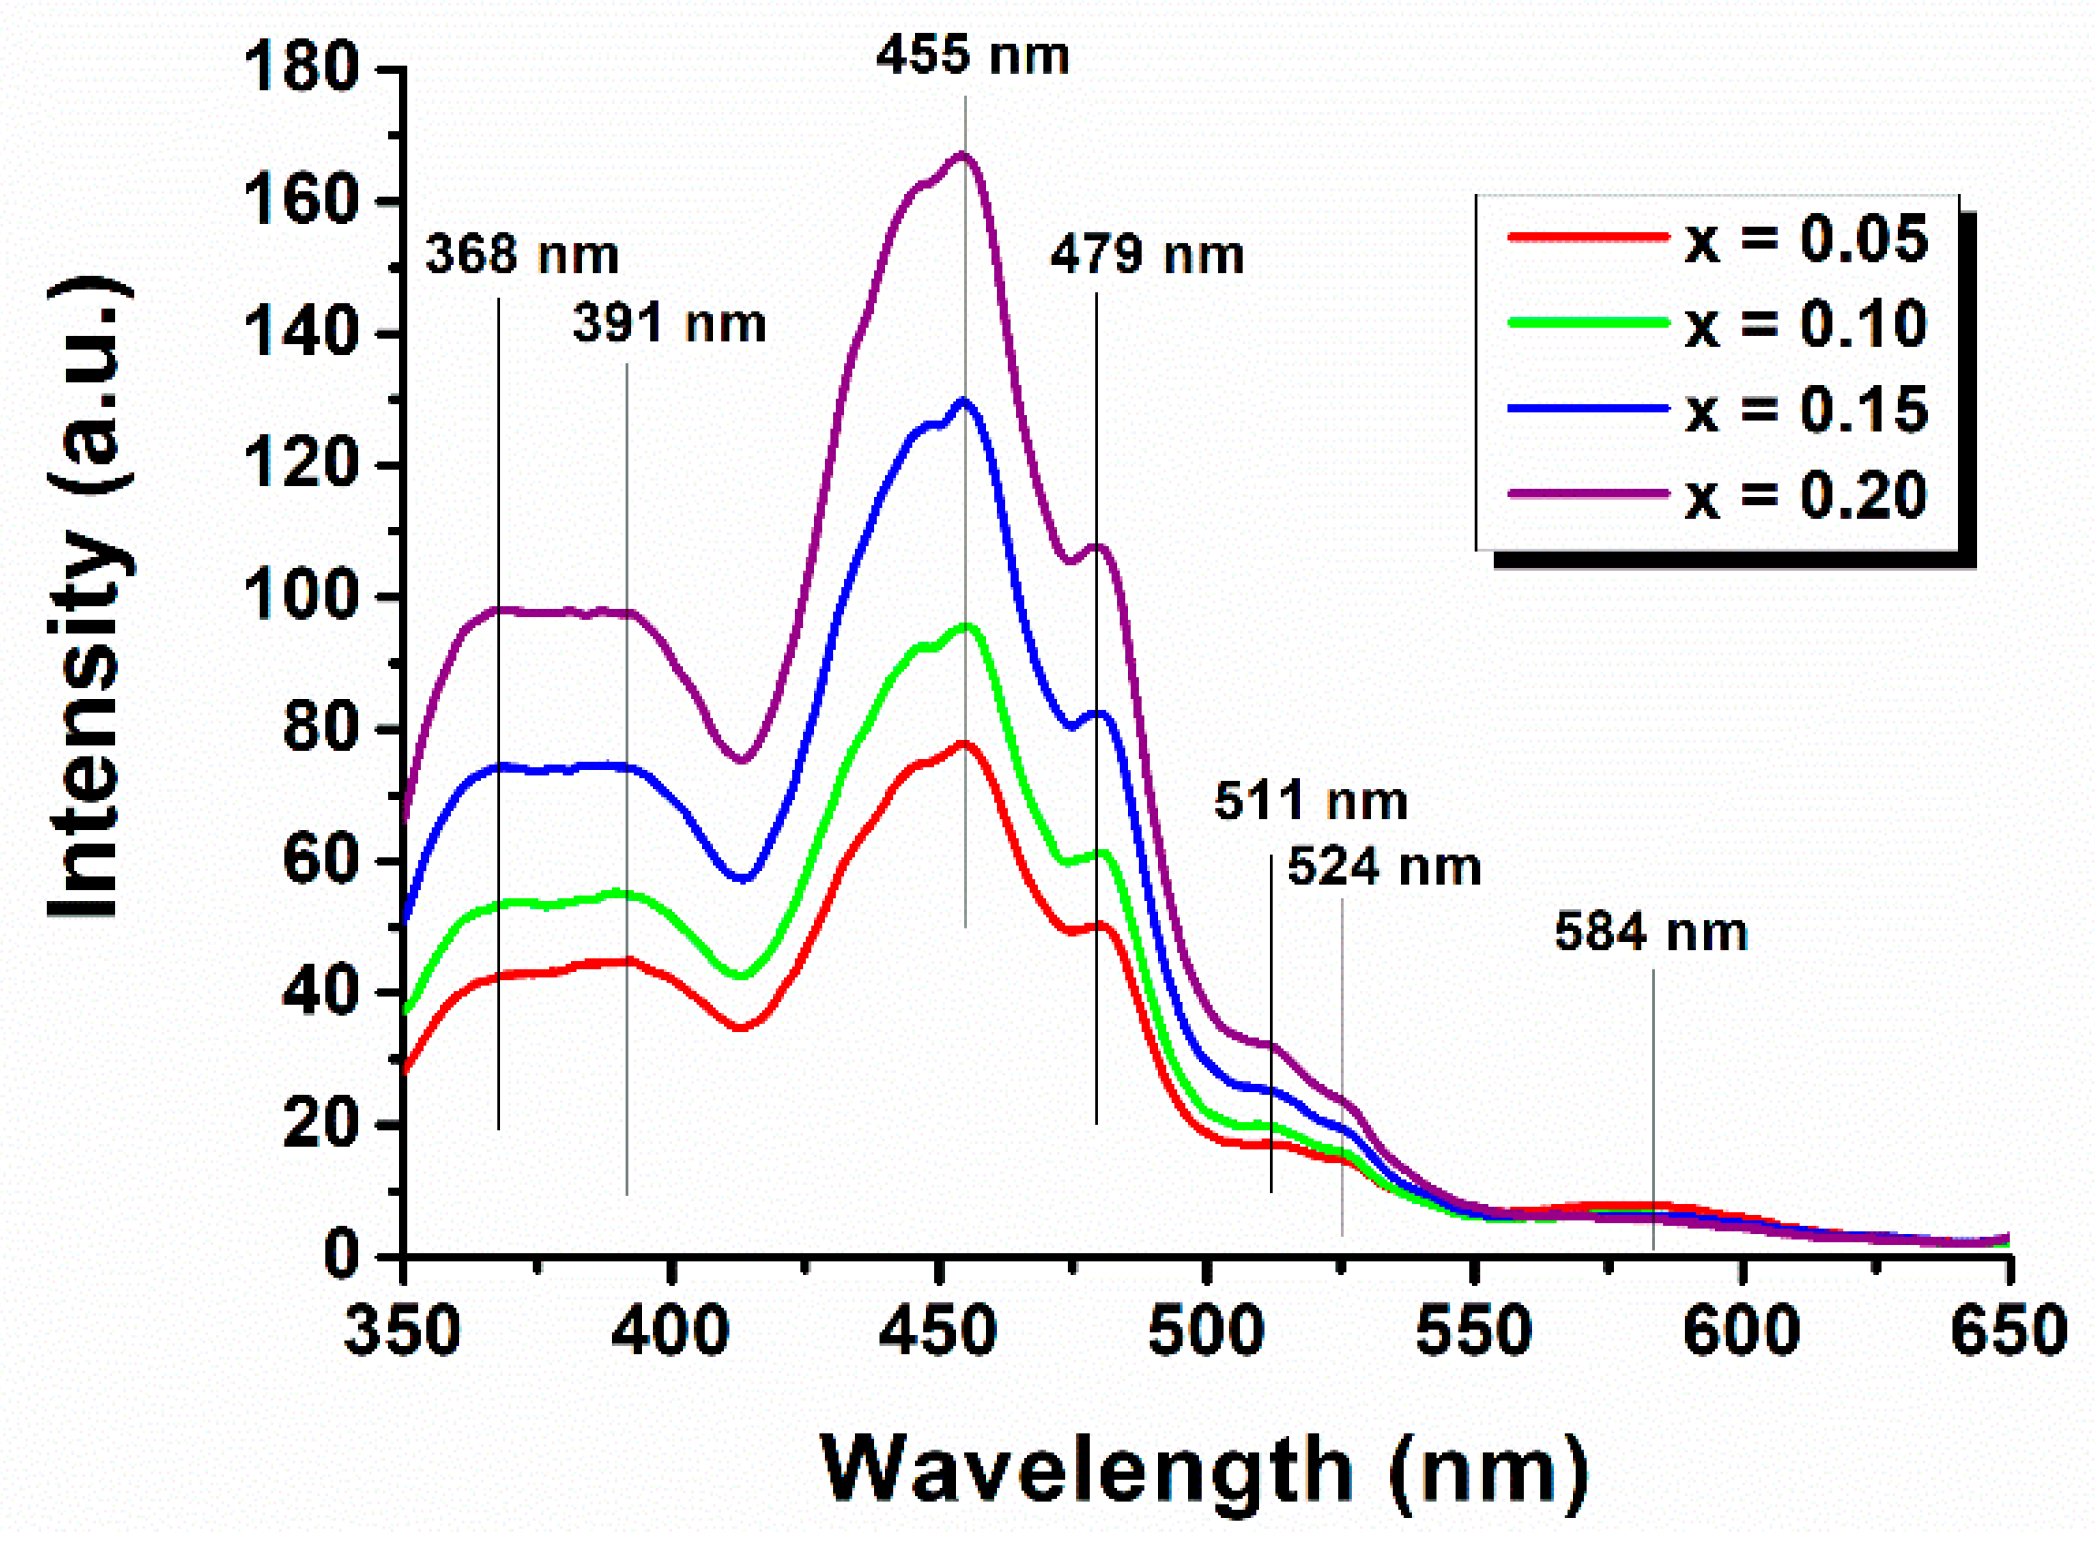
3.5. Photoluminescence Properties
4. Conclusions
Author Contributions
Funding
Conflicts of Interest
References
- Catalan, G.; Scott, J.F. Physics and applications of bismuth ferrite. Adv. Mater. 2009, 21, 2463–2485. [Google Scholar] [CrossRef]
- Clarke, G.; Rogov, A.; McCarthy, S.; Bonacina, L.; Gun’Ko, Y.; Galez, C.; le Dantec, R.; Volkov, Y.; Mugnier, Y.; Prina-Mello, A. Preparation from a revisited wet chemical route of phase-pure, monocrystalline and SHG-efficient BiFeO3 nanoparticles for harmonic bio-imaging. Sci. Rep. 2018, 8, 10473. [Google Scholar] [CrossRef] [PubMed]
- Haruna, A.; Abdulkadir, I.; Idris, S.O. Synthesis, characterization and photocatalytic properties of Bi0.85−XMXBa0.15FeO3 (M = Na and K, X = 0, 0.1) perovskite-like nanoparticles using the sol-gel method. J. King Saud Univ. Sci. 2019. [Google Scholar] [CrossRef]
- Ramos-Gomes, F.; Möbius, W.; Bonacina, L.; Alves, F.; Markus, M.A. Bismuth ferrite second harmonic nanoparticles for pulmonary macrophage tracking. Small 2019, 15, 1803776. [Google Scholar] [CrossRef]
- Chakraborty, S.; Pal, M. Highly selective and stable acetone sensor based on chemically prepared bismuth ferrite nanoparticles. J. Alloys Compd. 2019, 787, 1204–1211. [Google Scholar] [CrossRef]
- Sinha, A.K.; Bhushan, B.; Mishra, S.K.; Sharma, R.K.; Sen, S.; Mandal, B.P.; Meena, S.S.; Bhatt, P.; Prajapat, C.L.; Priyam, A.; et al. Enhanced dielectric, magnetic and optical properties of Cr-doped BiFeO3 multiferroic nanoparticles synthesized by sol-gel route. Results Phys. 2019, 13, 102299. [Google Scholar] [CrossRef]
- Dumitru, R.; Ianculescu, A.; Păcurariu, C.; Lupa, L.; Pop, A.; Vasile, B.; Surdu, A.; Manea, F. BiFeO3-synthesis, characterization and its photocatalytic activity towards doxorubicin degradation from water. Ceram. Int. 2019, 45, 2789–2802. [Google Scholar] [CrossRef]
- Philip, G.G.; Senthamizhan, A.; Natarajan, T.S.; Chandrasekaran, G.; Therese, H.A. The effect of gadolinium doping on the structural, magnetic and photoluminescence properties of electrospun bismuth ferrite nanofibers. Ceram. Int. 2015, 41, 13361–13365. [Google Scholar] [CrossRef]
- Godara, S.; Sinha, N.; Kumar, B. Enhanced electric and magnetic properties in Ce-Cr co-doped bismuth ferrite nanostructure. Mater. Lett. 2014, 136, 441–444. [Google Scholar] [CrossRef]
- Dutta, D.P.; Mandal, B.P.; Mukadam, M.D.; Yusuf, S.M.; Tyagi, A.K. Improved magnetic and ferroelectric properties of Sc and Ti codoped multiferroic nano BiFeO3 prepared via sonochemical synthesis. Dalt. Trans. 2014, 43, 7838–7846. [Google Scholar] [CrossRef]
- Chaudhuri, A.; Mandal, K. Study of structural, ferromagnetic and ferroelectric properties of nanostructured barium doped Bismuth Ferrite. J. Magn. Magn. Mater. 2014, 353, 57–64. [Google Scholar] [CrossRef]
- Huang, F.; Wang, Z.; Lu, X.; Zhang, J.; Min, K.; Lin, W.; Ti, R.; Xu, T.; He, J.; Yue, C.; et al. Peculiar magnetism of BiFeO3 nanoparticles with size approaching the period of the spiral spin structure. Sci. Rep. 2013, 3, 2907. [Google Scholar] [CrossRef] [PubMed]
- Zhang, Y.; Wang, Y.; Qi, J.; Tian, Y.; Zhang, J.; Wei, M.; Liu, Y.; Yang, J. Structural, magnetic and impedance spectroscopy properties of Ho3+ modified BiFeO3 multiferroic thin film. J. Mater. Sci. Mater. Electron. 2019, 30, 2942–2952. [Google Scholar] [CrossRef]
- Muneeswaran, M.; Lee, S.H.; Kim, D.H.; Jung, B.S.; Chang, S.H.; Jang, J.W.; Choi, B.C.; Jeong, J.H.; Giridharan, N.V.; Venkateswaran, C. Structural, vibrational, and enhanced magneto-electric coupling in Ho-substituted BiFeO3. J. Alloys Compd. 2018, 750, 276–285. [Google Scholar] [CrossRef]
- Xu, X.; Guoqiang, T.; Huijun, R.; Ao, X. Structural, electric and multiferroic properties of Sm-doped BiFeO3 thin films prepared by the sol-gelprocess. Ceram. Int. 2013, 39, 6223–6228. [Google Scholar] [CrossRef]
- Yotburut, B.; Thongbai, P.; Yamwong, T.; Maensiri, S. Synthesis and characterization of multiferroic Sm-doped BiFeO3 nanopowders and their bulk dielectric properties. J. Magn. Magn. Mater. 2017, 437, 51–61. [Google Scholar] [CrossRef]
- Reddy, B.P.; Sekhar, M.C.; Prakash, B.P.; Suh, Y.; Park, S.H. Photocatalytic, magnetic, and electrochemical properties of La doped BiFeO3 nanoparticles. Ceram. Int. 2018, 44, 19512–19521. [Google Scholar] [CrossRef]
- Castillo, M.E.; Shvartsman, V.V.; Gobeljic, D.; Gao, Y.; Landers, J.; Wende, H.; Lupascu, D.C. Effect of particle size on ferroelectric and magnetic properties of BiFeO3 nanopowders. Nanotechnology 2013, 24, 355701. [Google Scholar] [CrossRef]
- Dhir, G.; Uniyal, P.; Verma, N.K. Effect of particle size on magnetic and dielectric properties of nanoscale Dy-doped BiFeO3. J. Supercond. Nov. Magn. 2014, 27, 1569–1577. [Google Scholar] [CrossRef]
- Vijayasundaram, S.V.; Suresh, G.; Mondal, R.A.; Kanagadurai, R. Composition-driven enhanced magnetic properties and magnetoelectric coupling in Gd substituted BiFeO3 nanoparticles. J. Magn. Magn. Mater. 2016, 418, 30–36. [Google Scholar] [CrossRef]
- Zhang, H.; Liu, W.F.; Wu, P.; Hai, X.; Wang, S.Y.; Liu, G.Y.; Rao, G.H. Unusual magnetic behaviors and electrical properties of Nd-doped BiFeO3 nanoparticles calcined at different temperatures. J. Nanopart. Res. 2014, 16, 2205. [Google Scholar] [CrossRef]
- Li, X.; Zhu, Z.; Yin, X.; Wang, F.; Gu, W.; Fu, Z.; Lu, Y. Enhanced magnetism and light absorption of Eu-doped BiFeO3. J. Mater. Sci. Mater. Electron. 2016, 27, 7079–7083. [Google Scholar] [CrossRef]
- Freitas, V.F.; Grande, H.L.C.; de Medeiros, S.N.; Santos, I.A.; Cótica, L.F.; Coelho, A.A. Structural, microstructural and magnetic investigations in high-energy ball milled BiFeO3 and Bi0.95Eu0.05FeO3 powders. J. Alloys Compd. 2008, 461, 48–52. [Google Scholar] [CrossRef]
- Reshak, A.H.; Tlemçani, T.S.; Bahraoui, T.E.; Taibi, M.; Plucinski, K.J.; Belayachi, A.; Abd-Lefdil, M.; Lis, M.; Alahmed, Z.A.; Kamarudin, H.; et al. Characterization of multiferroic Bi0.8RE0.2FeO3powders (RE=Nd3+, Eu3+) grown by the sol-gel method. Mater. Lett. 2015, 139, 104–107. [Google Scholar] [CrossRef]
- Liu, J.; Fang, L.; Zheng, F.; Ju, S.; Shen, M. Enhancement of magnetization in Eu doped BiFeO3 nanoparticles. Appl. Phys. Lett. 2009, 95, 022511. [Google Scholar] [CrossRef]
- Bahraoui, T.E.; Tlemçani, T.S.; Taibi, M.; Zaarour, H.; Bey, A.E.; Belayachi, A.; Silver, A.T.; Schmerber, G.; Naggar, A.M.E.; Albassam, A.A.; et al. Characterization of multiferroic Bi1−xEuxFeO3 powders prepared by sol-gel method. Mater. Lett. 2016, 182, 151–154. [Google Scholar] [CrossRef]
- Rietveld, H.M. A profile refinement method for nuclear and magnetic structures. J. Appl. Crystallogr. 1969, 2, 65–71. [Google Scholar] [CrossRef]
- Xu, J.; Ke, H.; Jia, D.; Wang, W.; Zhou, Y. Low-temperature synthesis of BiFeO3 nanopowders via a sol—gel method. J. Alloy. Compd. 2009, 472, 473–477. [Google Scholar] [CrossRef]
- Troyanchuk, I.O.; Bushinsky, M.V.; Karpinsky, D.V.; Mantytskaya, O.S.; Fedotova, V.V.; Prochnenko, O.I. Structural transformations and magnetic properties of Bi1-xLnxFeO3 (Ln = La, Nd, Eu) multiferroics. Phys. Status Solidi Basic Res. 2009, 246, 1901–1907. [Google Scholar] [CrossRef]
- Ravindran, P.; Vidya, R.; Kjekshus, A.; Fjellvåg, H.; Eriksson, O. Theoretical investigation of magnetoelectric behavior in BiFeO3. Phys. Rev. B 2006, 74, 224412. [Google Scholar] [CrossRef]
- Iorgu, A.I.; Maxim, F.; Matei, C.; Ferreira, L.P.; Ferreira, P.; Cruz, M.M.; Berger, D. Fast synthesis of rare-earth (Pr3+, Sm3+, Eu3+ and Gd3+) doped bismuth ferrite powders with enhanced magnetic properties. J. Alloys Compd. 2015, 629, 62–68. [Google Scholar] [CrossRef]
- Khomchenko, V.A.; Troyanchuk, I.O.; Bushinsky, M.V.; Mantytskaya, O.S.; Sikolenko, V.; Paixão, J.A. Structural phase evolution in Bi7/8Ln1/8FeO3 (Ln = La–Dy) series. Mater. Lett. 2011, 65, 1970–1972. [Google Scholar] [CrossRef]
- Shannon, R.D. Revised effective ionic radii and systematic studies of interatomic distances in halides and chalcogenides. Acta Crystallogr. Sect. A 1976, 32, 751–767. [Google Scholar] [CrossRef]
- Rao, T.D.; Karthik, T.; Asthana, S. Investigation of structural, magnetic and optical properties of rare earth substituted bismuth ferrite. J. Rare Earths 2013, 31, 370–375. [Google Scholar] [CrossRef] [Green Version]
- Fukumura, H.; Harima, H.; Kisoda, K.; Tamada, M.; Noguchi, Y.; Miyayama, M. Raman scattering study of multiferroic BiFeO3 single crystal. J. Magn. Magn. Mater. 2007, 310, 2006–2008. [Google Scholar] [CrossRef]
- Kothari, D.; Reddy, V.R.; Sathe, V.G.; Gupta, A.; Banerjee, A.; Awasthi, A.M. Raman scattering study of polycrystalline magnetoelectric BiFeO3. J. Magn. Magn. Mater. 2008, 320, 548–552. [Google Scholar] [CrossRef]
- Gupta, H.C.; Singh, M.K.; Tiwari, L.M. A lattice dynamical investigation of Raman and infrared wavenumbers at the zone center of the orthorhombic NdNiO3 perovskite. J. Phys. Chem. Solids 2003, 64, 531–533. [Google Scholar] [CrossRef]
- Sati, P.C.; Kumar, M.; Chhoker, S.; Jewariya, M. Influence of Eu substitution on structural, magnetic, optical and dielectric properties of BiFeO3 multiferroic ceramics. Ceram. Int. 2015, 41, 2389–2398. [Google Scholar] [CrossRef]
- Qian, F.Z.; Jiang, J.S.; Guo, S.Z.; Jiang, D.M.; Zhang, W.G. Multiferroic properties of Bi1-xDyxFeO3 nanoparticles. J. Appl. Phys. 2009, 106, 084312. [Google Scholar] [CrossRef]
- Prado-Gonjal, J.; Ávila, D.; Villafuerte-Castrejón, M.E.; González-García, F.; Fuentes, L.; Gómez, R.W.; Pérez-Mazariego, J.L.; Marquina, V.; Morán, E. Structural, microstructural and Mössbauer study of BiFeO3 synthesized at low temperature by a microwave-hydrothermal method. Solid State Sci. 2011, 13, 2030–2036. [Google Scholar] [CrossRef]
- Zhu, Y.; Quan, C.; Ma, Y.; Wang, Q.; Mao, W.; Wang, X.; Zhang, J.; Min, Y.; Yang, J.; Li, X.; et al. Effect of Eu, Mn co-doping on structural, optical and magnetic properties of BiFeO3 nanoparticles. Mater. Sci. Semicond. Process. 2017, 57, 178–184. [Google Scholar] [CrossRef]
- Dai, H.; Xue, R.; Chen, Z.; Li, T.; Chen, J.; Xiang, H. Effect of Eu, Ti co-doping on the structural and multiferroic properties of BiFeO3 ceramics. Ceram. Int. 2014, 40, 15617–15622. [Google Scholar] [CrossRef]
- Pandey, D.K.; Modi, A.; Pandey, P.; Gaur, N.K. Variable excitation wavelength photoluminescence response and optical absorption in BiFeO3 nanostructures. J. Mater. Sci. Mater. Electron. 2017, 28, 17245–17253. [Google Scholar] [CrossRef]
- Yu, X.; An, X. Enhanced magnetic and optical properties of pure and (Mn, Sr) doped BiFeO3 nanocrystals. Solid State Commun. 2009, 149, 711–714. [Google Scholar] [CrossRef]
- Moubah, R.; Schmerber, G.; Rousseau, O.; Colson, D.; Viret, M. Photoluminescence investigation of defects and optical band gap in multiferroic BiFeO3 single crystals. Appl. Phys. Express 2012, 5, 035802. [Google Scholar] [CrossRef]
- Chen, X.; Zhang, H.; Wang, T.; Wang, F.; Shi, W. Optical and photoluminescence properties of BiFeO3 thin films grown on ITO-coated glass substrates by chemical solution deposition. Phys. Status Solidi Appl. Mater. Sci. 2012, 209, 1456–1460. [Google Scholar] [CrossRef]
- Prashanthi, K.; Gupta, M.; Tsui, Y.Y.; Thundat, T. Effect of annealing atmosphere on microstructural and photoluminescence characteristics of multiferroic BiFeO3 thin films prepared by pulsed laser deposition technique. Appl. Phys. A 2013, 110, 903–907. [Google Scholar] [CrossRef]
- Hauser, A.J.; Zhang, J.; Mier, L.; Ricciardo, R.A.; Woodward, P.M.; Gustafson, T.L.; Brillson, L.J.; Yang, F.Y. Characterization of electronic structure and defect states of thin epitaxial BiFeO3 films by UV-visible absorption and cathodoluminescence spectroscopies. Appl. Phys. Lett. 2008, 92, 222901. [Google Scholar] [CrossRef]
- Irfan, S.; Rizwan, S.; Shen, Y.; Li, L.; Asfandiyar; Butt, S.; Nan, C.W. The Gadolinium (Gd3+) and Tin (Sn4+) Co-doped BiFeO3 Nanoparticles as New Solar Light Active Photocatalyst. Sci. Rep. 2017, 7, 42493. [Google Scholar] [CrossRef]
- Chauhan, S.; Kumar, M.; Chhoker, S.; Katyal, S.C.; Singh, H.; Jewariya, M.; Yadav, K.L. Multiferroic, magnetoelectric and optical properties of Mn doped BiFeO3 nanoparticles. Solid State Commun. 2012, 152, 525–529. [Google Scholar] [CrossRef]
- Das, R.; Khan, G.G.; Varma, S.; Mukherjee, G.D.; Mandal, K. Effect of quantum confinement on optical and magnetic properties of Pr—Cr-codoped bismuth ferrite nanowires. J. Phys. Chem. C 2013, 39, 20209–20216. [Google Scholar] [CrossRef]
- Kumar, K.S.; Ramanadha, M.; Sudharani, A.; Ramu, S.; Vijayalakshmi, R.P. Structural, magnetic, and photoluminescence properties of BiFeO3: Er-doped nanoparticles prepared by sol-gel technique. J. Supercond. Nov. Magn. 2019, 32, 1035–1042. [Google Scholar] [CrossRef]


| x = 0 | x = 0.05 | x = 0.10 | x = 0.15 | x = 0.20 | |
|---|---|---|---|---|---|
| Bi(NO3)3·5H2O | 1.4554 g | 1.3826 g | 1.3098 g | 1.2371 g | 1.1643 g |
| Eu(NO3)3·5H2O | 0 g | 0.0643 g | 0.1285 g | 0.1928 g | 0.2571 g |
| Fe(NO3)3·9H2O | 1.2121 g | 1.2121 g | 1.2121 g | 1.2121 g | 1.2121 g |
| 2-methoxyetanol | 125 mL | 125 mL | 125 mL | 125 mL | 125 mL |
| Acetic acid | 125 mL | 125 mL | 125 mL | 125 mL | 125 mL |
| x = 0 | x = 0.05 | x = 0.10 | x = 0.15 | x = 0.20 | |||||
|---|---|---|---|---|---|---|---|---|---|
| T (°C) | Mass Loss (%) | T (°C) | Mass Loss (%) | T (°C) | Mass Loss (%) | T (°C) | Mass Loss (%) | T (°C) | Mass Loss (%) |
| 103.3 | −4 | 103 | −4.4 | 105.1 | −3.7 | 108.3 | −4.7 | 104.5 | −4.7 |
| 214.1 | −18.2 | 218.4 | −26.5 | 221.6 | −24.6 | 206.7 | −12.4 | 208.7 | −13.4 |
| 275.9 | −14 | 278.0 | −5.5 | 282.1 | −8.7 | 239.2 | −11.4 | 240.3 | −11.1 |
| 413.5 | −2.4 | 419.9 | −2 | 422.2 | −2.1 | 269.9 | −10.8 | 277.9 | −10.8 |
| 427.8 | −2.2 | 391.9 | −2.7 | ||||||
| Agreement Indices | x = 0 | x = 0.05 | x = 0.10 | x = 0.15 | x = 0.20 |
|---|---|---|---|---|---|
| Rexp | 6.1381 | 6.4479 | 6.4451 | 6.3596 | 6.4065 |
| Rp | 5.5304 | 5.0238 | 6.7391 | 8.6136 | 8.7802 |
| Rwp | 7.1636 | 6.4951 | 8.9802 | 11.6540 | 11.6193 |
| χ2 | 1.3621 | 1.0147 | 1.9414 | 3.3581 | 3.2894 |
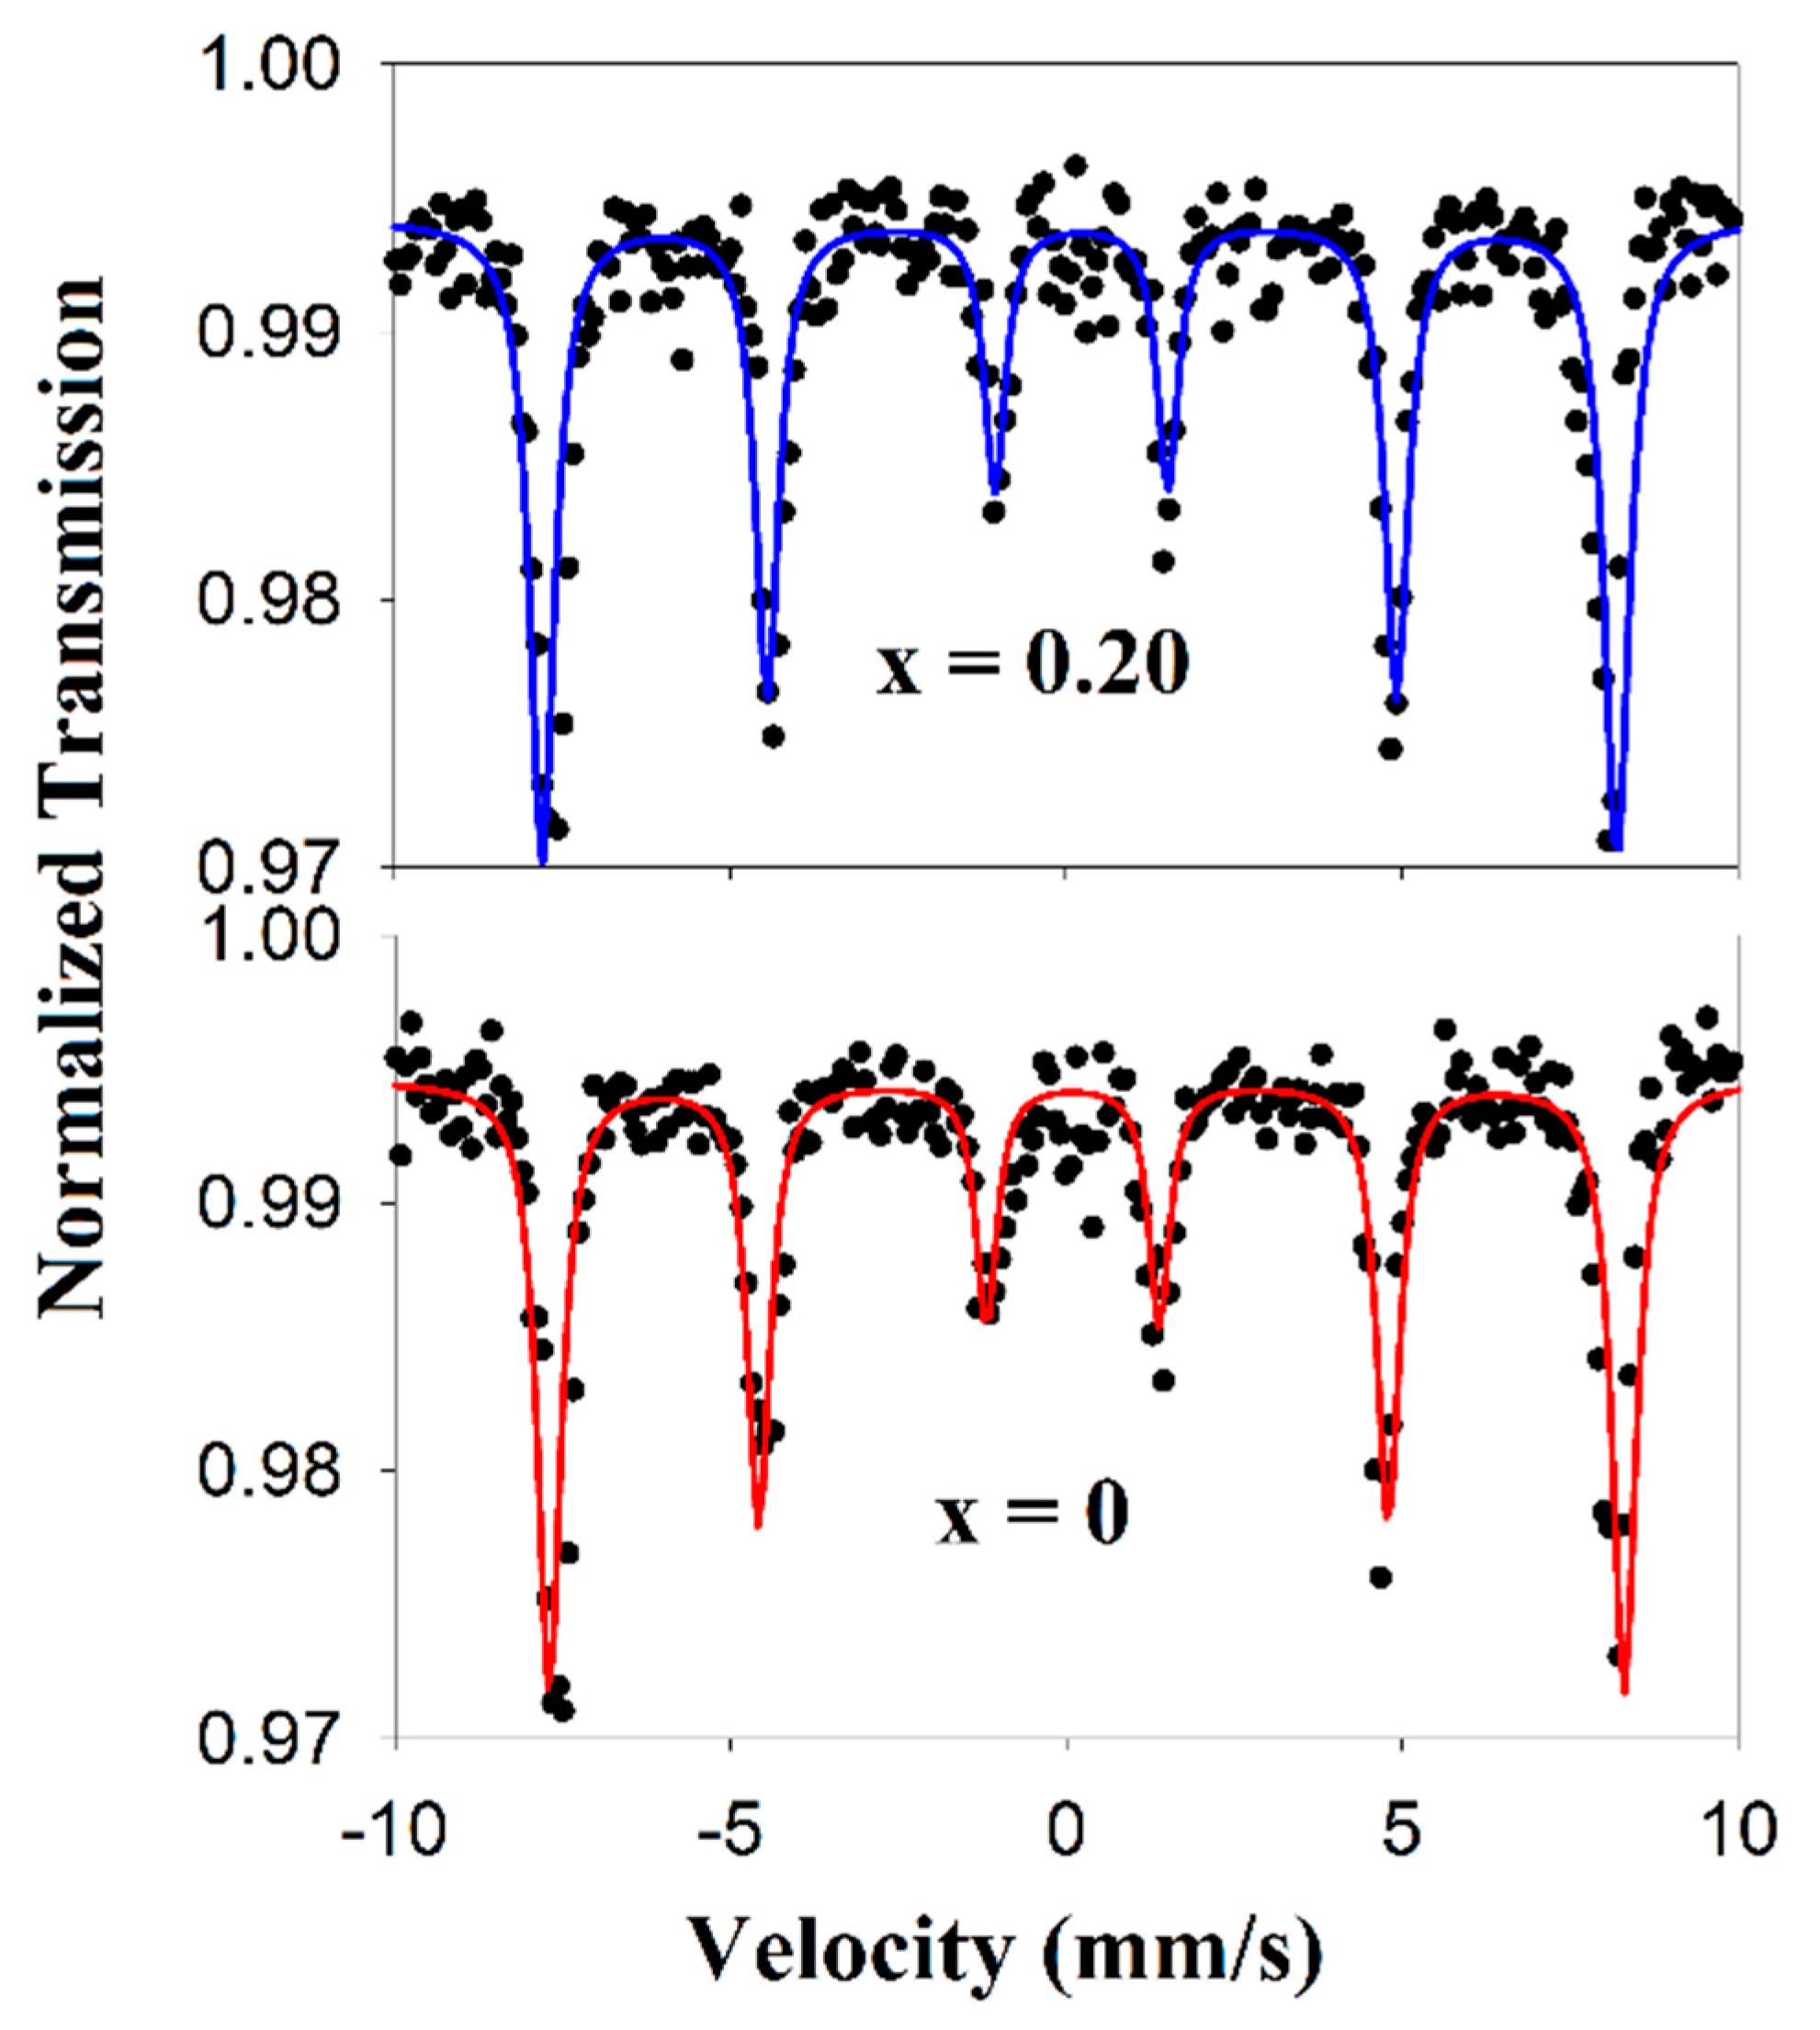
| IS (mm/s) | ΔEq (mm/s) | Hhf (T) | |
|---|---|---|---|
| x = 0 | 0.335 | 0.179 | 48.90 |
| x = 0.20 | 0.335 | −0.054 | 48.89 |
| SE | ±0.001 | ±0.002 | ±0.02 |
| x = 0 | x = 0.05 | x = 0.10 | x = 0.15 | x = 0.20 | |
|---|---|---|---|---|---|
| Ms (emu/g) | 0.3529 | 1.6570 | 1.1089 | 0.7113 | 0.2968 |
| Mr (emu/g) | 0.0128 | 0.2287 | 0.0734 | 0.0551 | 0.0457 |
| Hc (Oe) | 51.290 | 101.160 | 69.883 | 91.156 | 36.815 |
© 2019 by the authors. Licensee MDPI, Basel, Switzerland. This article is an open access article distributed under the terms and conditions of the Creative Commons Attribution (CC BY) license (http://creativecommons.org/licenses/by/4.0/).
Share and Cite
Surdu, V.-A.; Trușcă, R.D.; Vasile, B.Ș.; Oprea, O.C.; Tanasă, E.; Diamandescu, L.; Andronescu, E.; Ianculescu, A.C. Bi1−xEuxFeO3 Powders: Synthesis, Characterization, Magnetic and Photoluminescence Properties. Nanomaterials 2019, 9, 1465. https://doi.org/10.3390/nano9101465
Surdu V-A, Trușcă RD, Vasile BȘ, Oprea OC, Tanasă E, Diamandescu L, Andronescu E, Ianculescu AC. Bi1−xEuxFeO3 Powders: Synthesis, Characterization, Magnetic and Photoluminescence Properties. Nanomaterials. 2019; 9(10):1465. https://doi.org/10.3390/nano9101465
Chicago/Turabian StyleSurdu, Vasile-Adrian, Roxana Doina Trușcă, Bogdan Ștefan Vasile, Ovidiu Cristian Oprea, Eugenia Tanasă, Lucian Diamandescu, Ecaterina Andronescu, and Adelina Carmen Ianculescu. 2019. "Bi1−xEuxFeO3 Powders: Synthesis, Characterization, Magnetic and Photoluminescence Properties" Nanomaterials 9, no. 10: 1465. https://doi.org/10.3390/nano9101465