Coffee and Tea Consumption and the Contribution of Their Added Ingredients to Total Energy and Nutrient Intakes in 10 European Countries: Benchmark Data from the Late 1990s

 , ,
, , 
 ,
,  , , , , , ,
  , , add
Show full author list
, , add
Show full author list
Abstract
:1. Introduction
2. Materials and Methods
2.1. Setting and Subjects
2.2. Dietary Variables
2.3. Nutrient Databases
2.4. Nondietary Variables
2.5. Statistical Methods
3. Results
3.1. Coffee and Tea Intakes
3.2. Proportion of Consumers
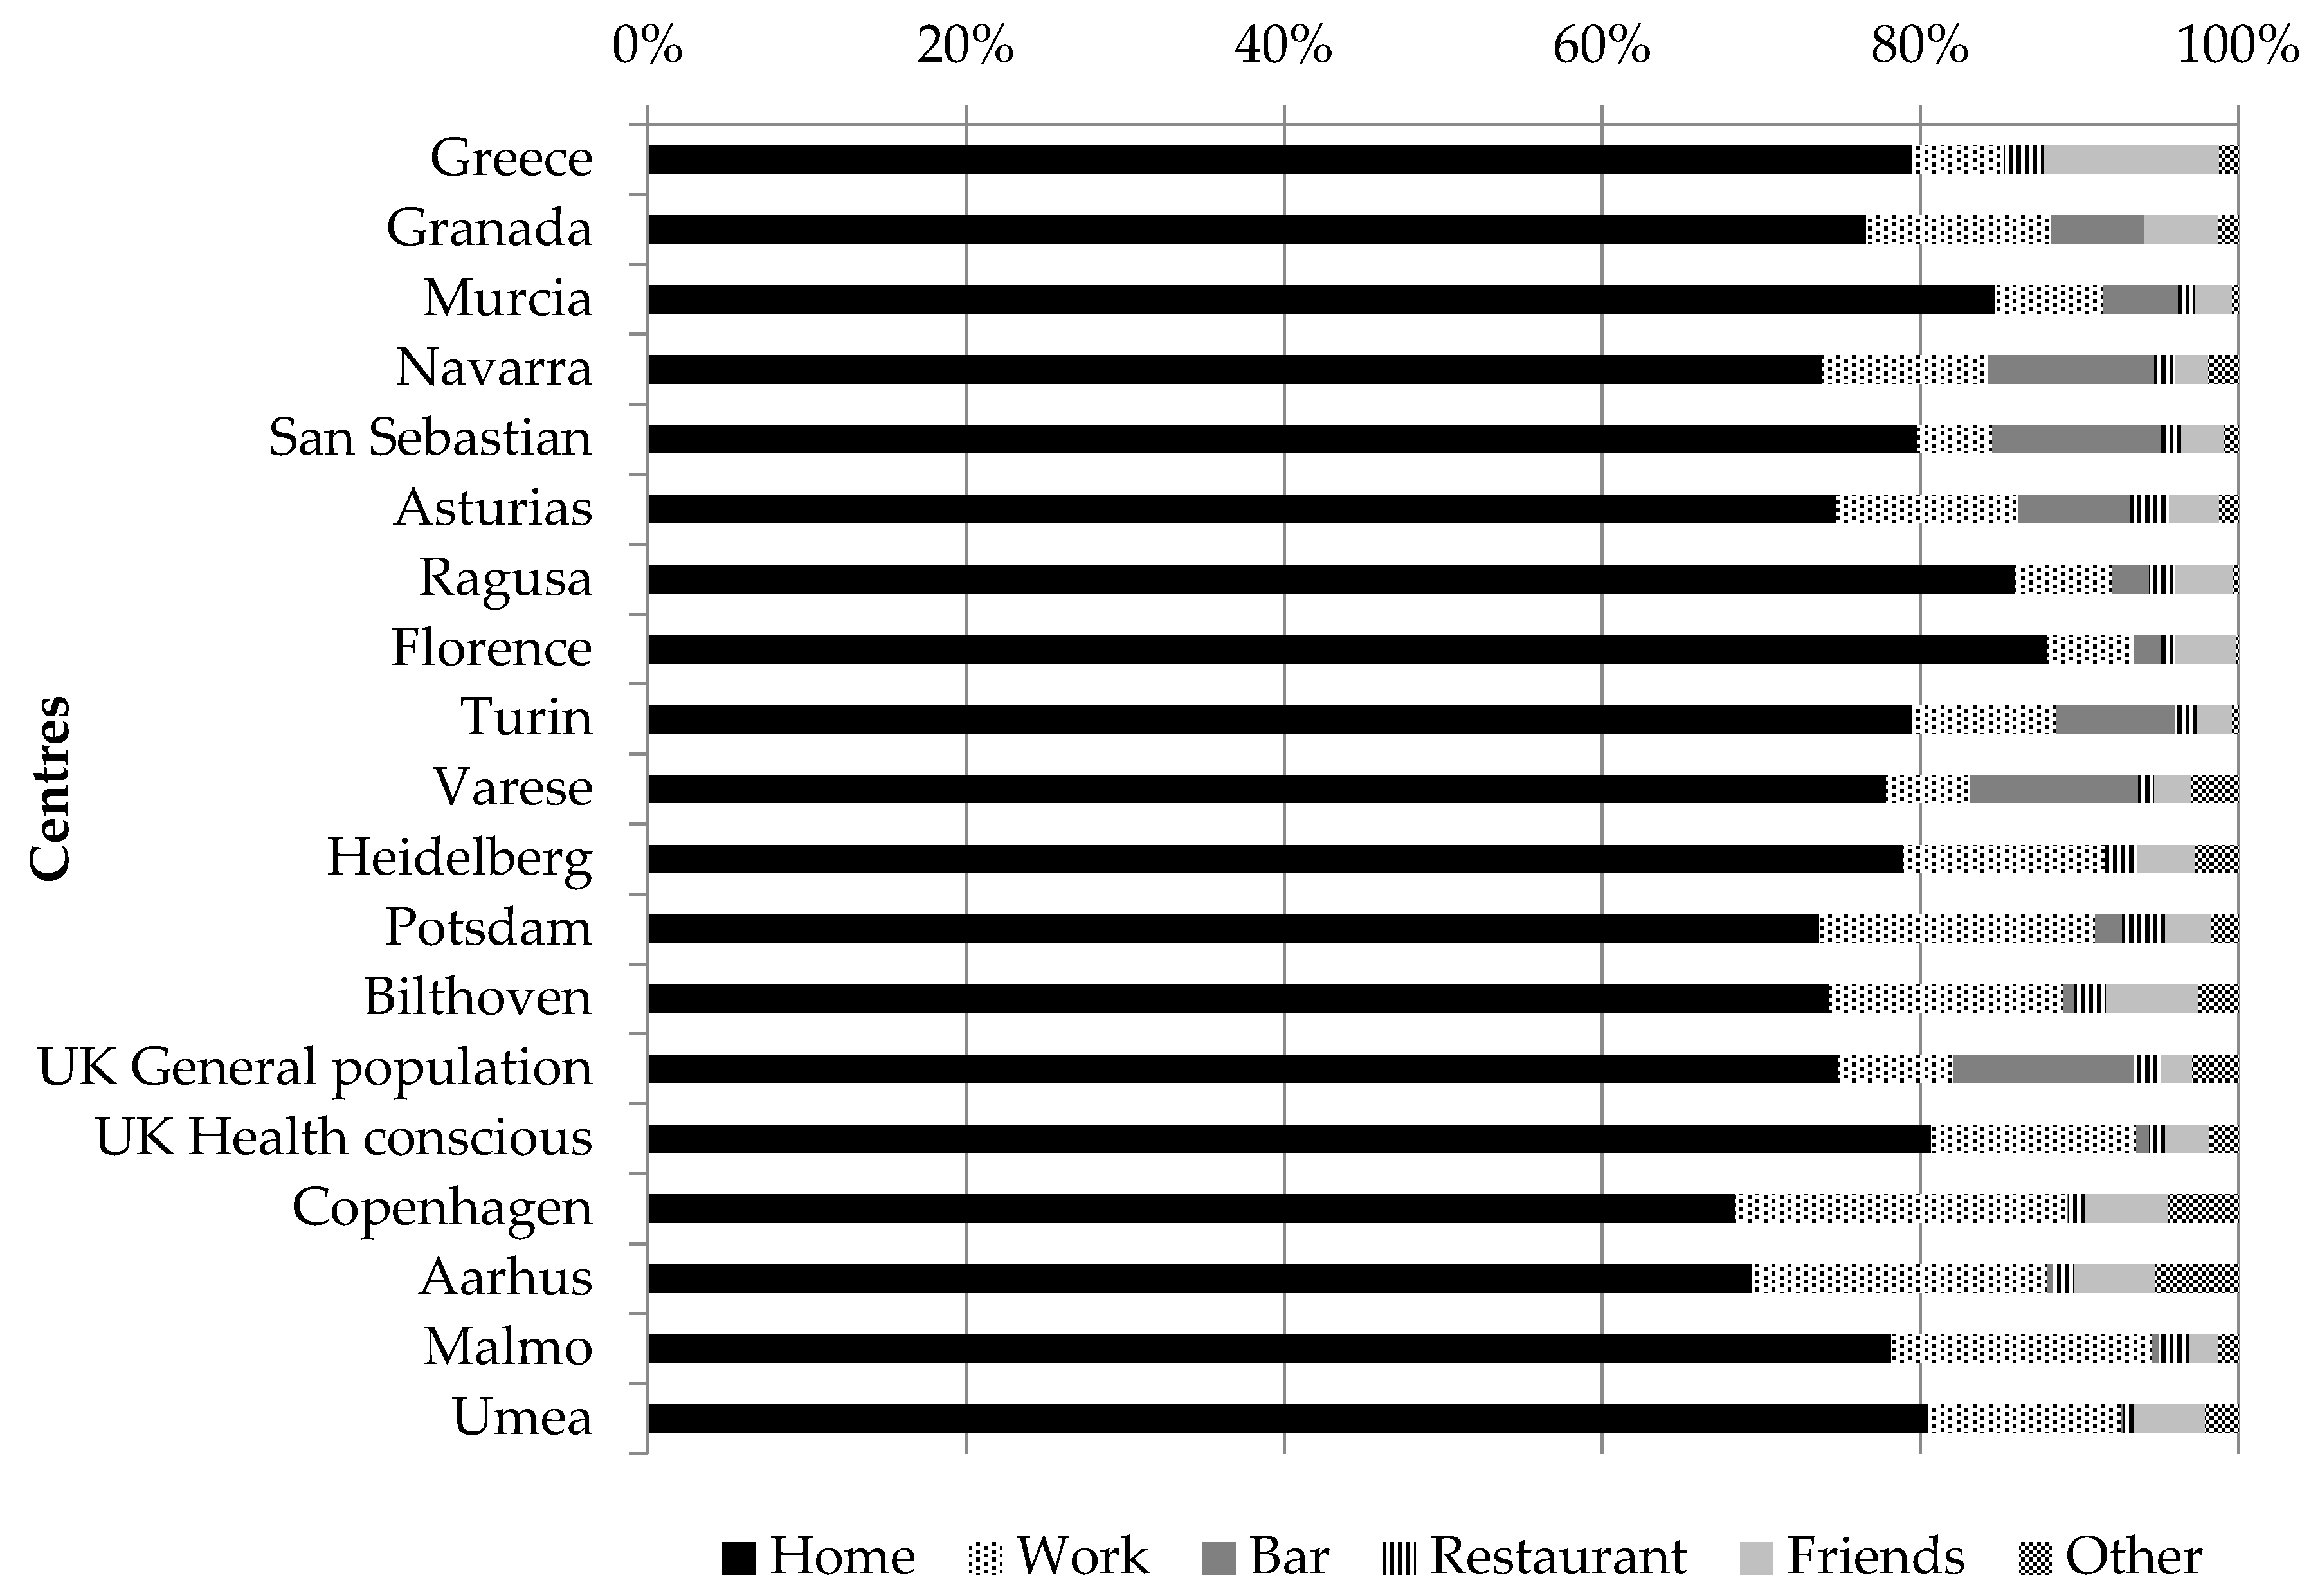
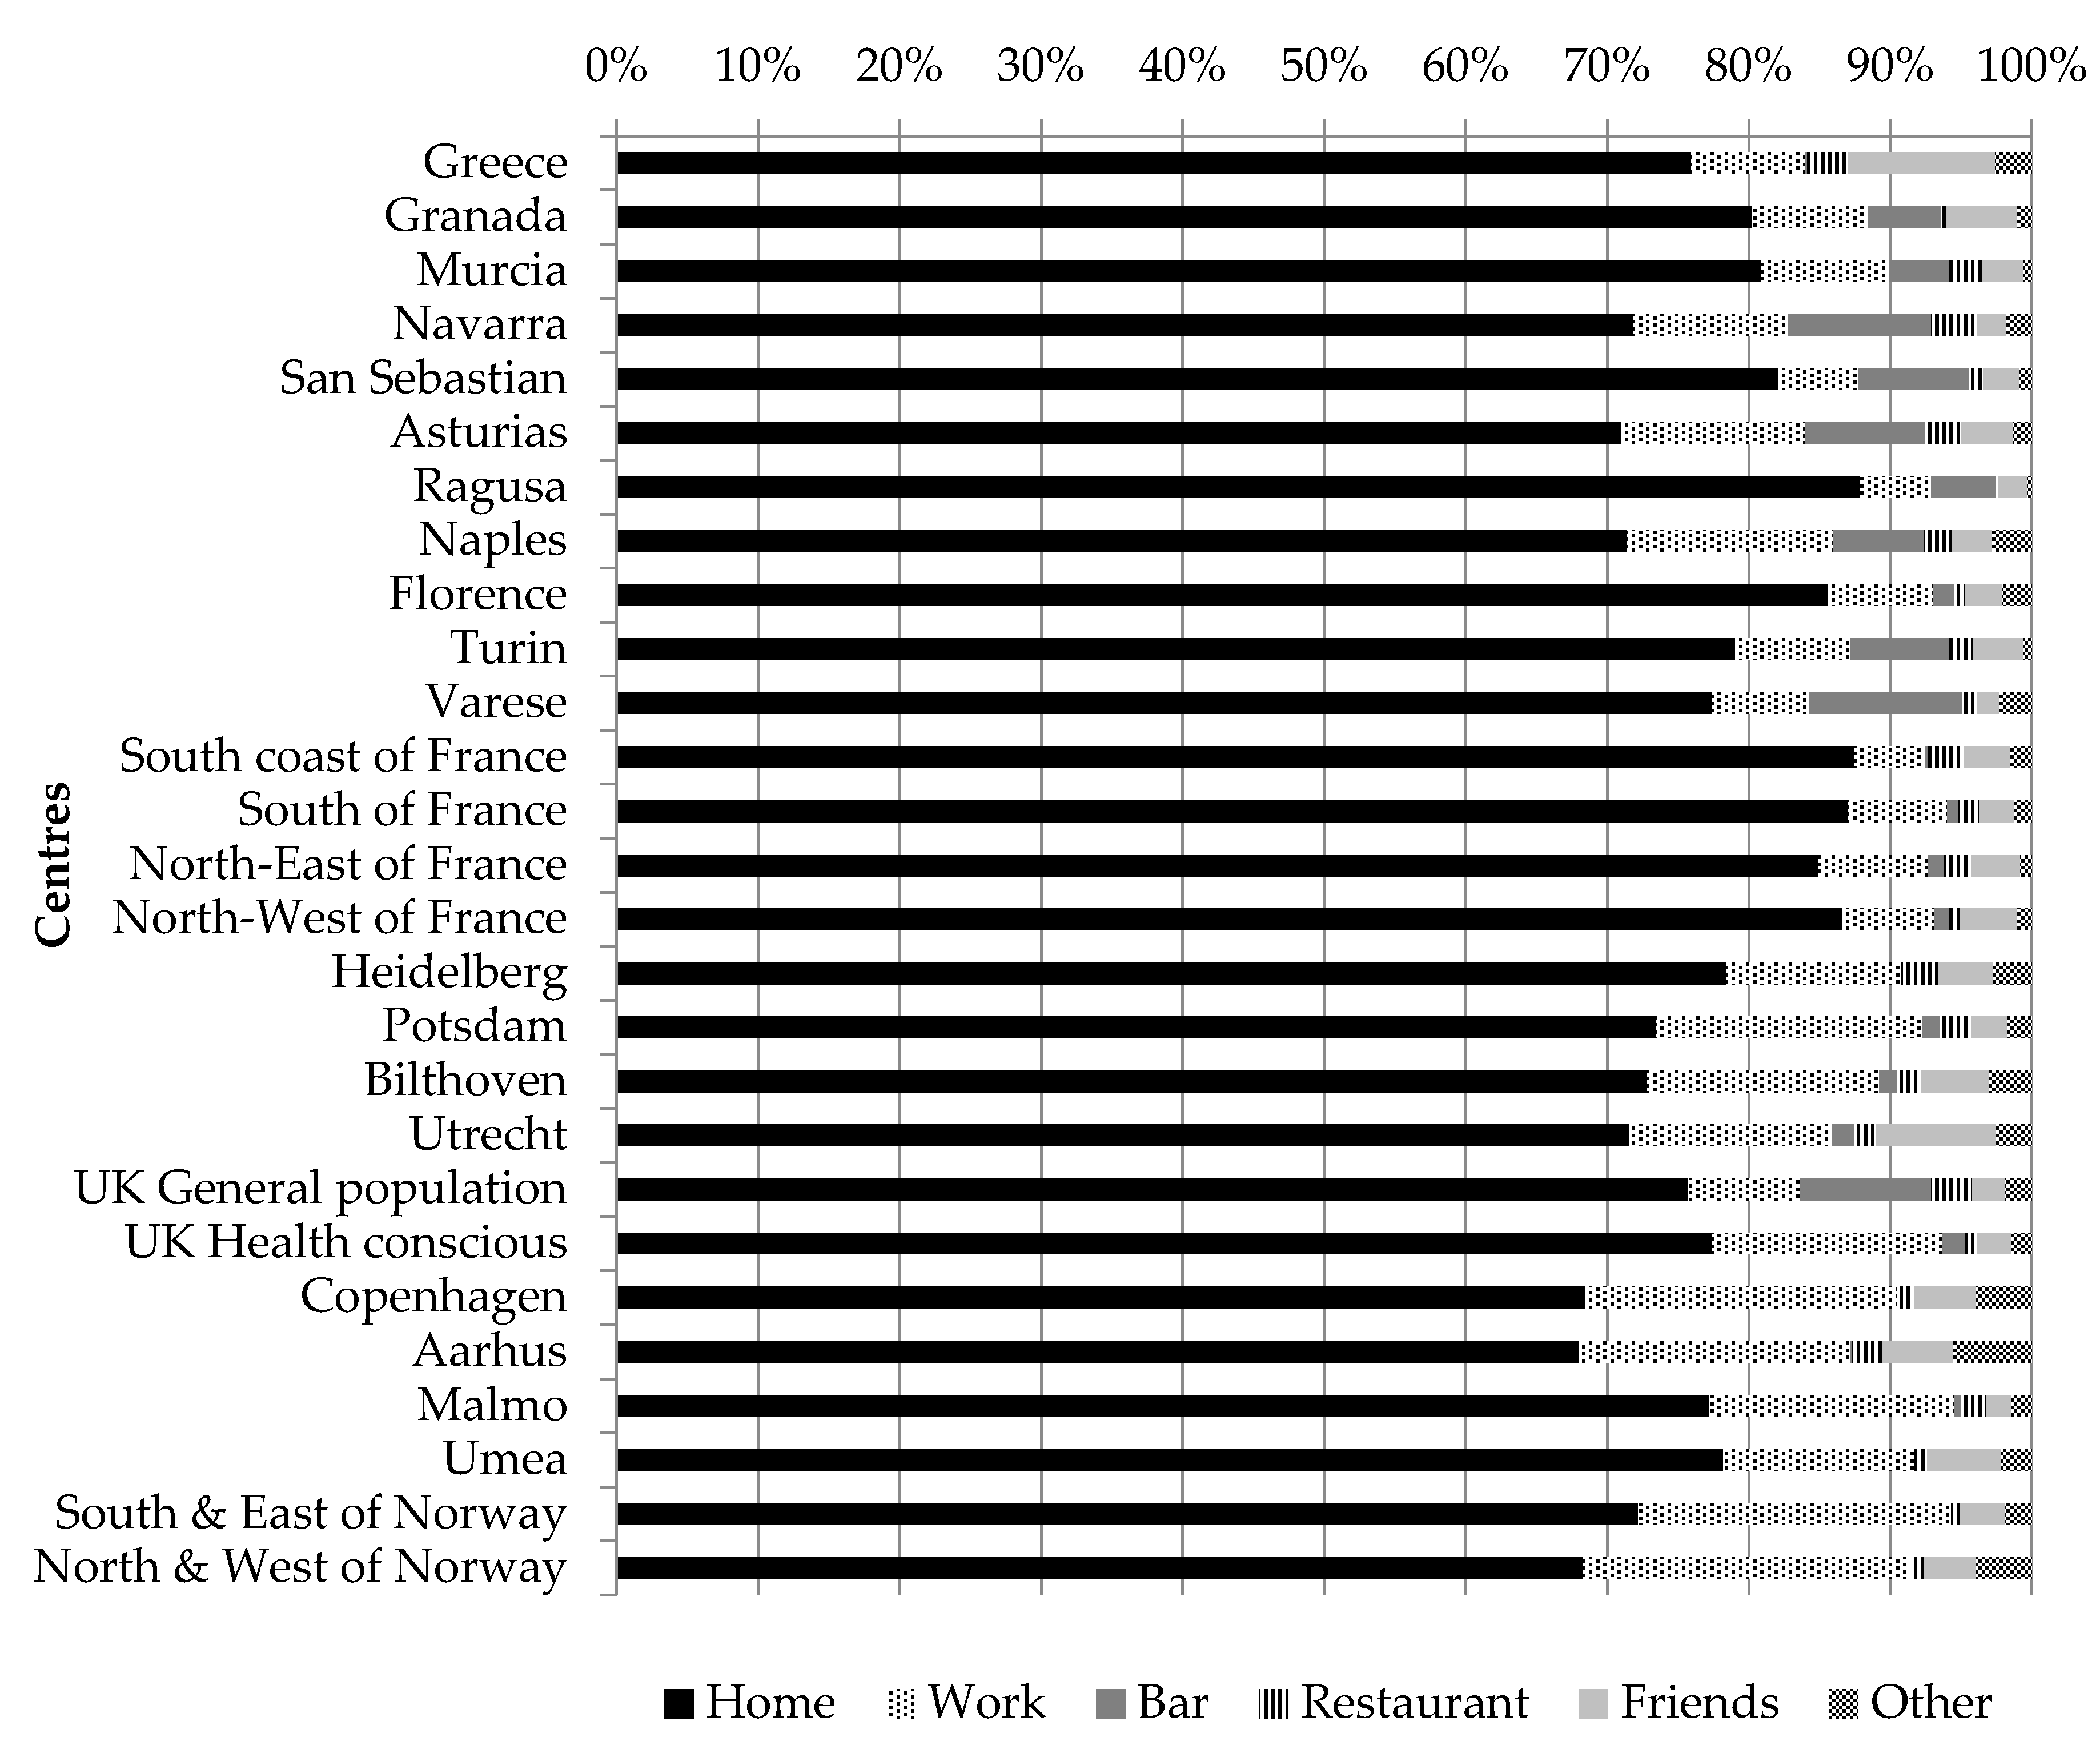
3.3. Place of Consumption
3.4. Sociodemographic Factors
3.5. Lifestyle Factors
3.6. Contribution to Energy and Micronutrients
4. Discussion
5. Conclusions
Supplementary Materials
Author Contributions
Acknowledgments
Conflicts of Interest
References
- Graham, H.N. Green tea composition, consumption, and polyphenol chemistry. Prev. Med. 1992, 21, 334–350. [Google Scholar] [CrossRef]
- Freedman, N.D.; Park, Y.; Abnet, C.C.; Hollenbeck, A.R.; Sinha, R. Association of Coffee Drinking with Total and Cause-Specific Mortality. New Engl. J. Med. 2012, 366, 1891–1904. [Google Scholar] [CrossRef] [PubMed]
- World Cancer Research Fund/American Institute for Cancer Research. Diet, Nutrition, Physical Activity, and Cancer: A Global Perspective. Continuous Update Project Expert Report 2018. Available online: Dietandcancerreport.org (accessed on 29 May 2018).
- Lin, J.K. Mechanisms of cancer chemoprevention by tea and tea polyphenols. In Tea and Tea Products Chemistry and Health-Promoting Properties; Ho, C.T., Lin, J.K., Shahidi, F., Eds.; CRC Press: Boca Raton, FL, USA, 2009; pp. 161–176. [Google Scholar]
- Yang, C.S.; Wang, H.; Li, G.X.; Yang, Z.; Guan, F.; Jin, H. Cancer prevention by tea: Evidence from laboratory studies. Pharmacol. Res. 2011, 64, 113–122. [Google Scholar] [CrossRef] [PubMed]
- Cavin, C.; Holzhaeuser, D.; Scharf, G.; Constable, A.; Huber, W.W.; Schilter, B. Cafestol and kahweol, two coffee specific diterpenes with anticarcinogenic activity. Food Chem. Toxicol. 2002, 40, 1155–1163. [Google Scholar] [CrossRef]
- Norat, T.; Aune, D.; Navarro, D.; Abar, L. The Associations between Food, Nutrition and Physical Activity and the Risk of Liver Cancer; World Cancer Research Fund International: London, UK, 2015. [Google Scholar]
- Cao, S.; Liu, L.; Yin, X.; Wang, Y.; Liu, J.; Lu, Z. Coffee consumption and risk of prostate cancer: A meta-analysis of prospective cohort studies. Carcinogenesis 2014, 35, 256–261. [Google Scholar] [CrossRef] [PubMed]
- Gunter, M.J.; Murphy, N.; Cross, A.J.; Dossus, L.; Dartois, L.; Fagherazzi, G.; Kaaks, R.; Kühn, T.; Boeing, H.; Aleksandrova, K.; et al. Coffee drinking and mortality in 10 european countries: A multinational cohort study. Ann. Intern. Med. 2017, 167, 236–247. [Google Scholar] [CrossRef] [PubMed]
- Lu, Y.; Zhai, L.; Zeng, J.; Peng, Q.; Wang, J.; Deng, Y.; Xie, L.; Mo, C.; Yang, S.; Li, S.; et al. Coffee consumption and prostate cancer risk: An updated meta-analysis. Cancer Causes Control 2014, 25, 591–604. [Google Scholar] [CrossRef] [PubMed]
- Sang, L.X.; Chang, B.; Li, X.H.; Jiang, M. Consumption of coffee associated with reduced risk of liver cancer: A meta-analysis. BMC Gastroenterol. 2013, 13, 34. [Google Scholar] [CrossRef] [PubMed]
- Tang, J.; Zheng, J.-S.; Fang, L.; Jin, Y.; Cai, W.; Li, D. Tea consumption and mortality of all cancers, CVD and all causes: A meta-analysis of eighteen prospective cohort studies. Br. J. Nutr. 2015, 114, 673–683. [Google Scholar] [CrossRef] [PubMed]
- Wang, L.; Zhang, X.; Liu, J.; Shen, L.; Li, Z. Tea consumption and lung cancer risk: A meta-analysis of case-control and cohort studies. Nutrition 2014, 30, 1122–1127. [Google Scholar] [CrossRef] [PubMed]
- Je, Y.; Liu, W.; Giovannucci, E. Coffee consumption and risk of colorectal cancer: A systematic review and meta-analysis of prospective cohort studies. Int. J. Cancer 2009, 124, 1662–1668. [Google Scholar] [CrossRef] [PubMed] [Green Version]
- Zheng, P.; Zheng, H.M.; Deng, X.M.; Zhang, Y.D. Green tea consumption and risk of esophageal cancer: A meta-analysis of epidemiologic studies. BMC Gastroenterol. 2012, 12, 165. [Google Scholar] [CrossRef] [PubMed]
- Hu, Z.H.; Lin, Y.W.; Xu, X.; Chen, H.; Mao, Y.Q.; Wu, J.; Xu, X.L.; Zhu, Y.; Li, S.Q.; Zheng, X.Y.; et al. No association between tea consumption and risk of renal cell carcinoma: A meta-analysis of epidemiological studies. Asian Pac. J. Cancer Prev. 2013, 14, 1691–1695. [Google Scholar] [CrossRef] [PubMed]
- Li, X.J.; Ren, Z.J.; Qin, J.W.; Zhao, J.H.; Tang, J.H.; Ji, M.H.; Wu, J.Z. Coffee consumption and risk of breast cancer: An up-to-date meta-analysis. PLoS ONE 2013, 8, e52681. [Google Scholar] [CrossRef] [PubMed]
- Sang, L.X.; Chang, B.; Li, X.H.; Jiang, M. Green tea consumption and risk of esophageal cancer: A meta-analysis of published epidemiological studies. Nutr. Cancer 2013, 65, 802–812. [Google Scholar] [CrossRef] [PubMed]
- Crippa, A.; Discacciati, A.; Larsson, S.C.; Wolk, A.; Orsini, N. Coffee Consumption and Mortality from All Causes, Cardiovascular Disease, and Cancer: A Dose-Response Meta-Analysis. Am. J. Epidemiol. 2014, 180, 763–775. [Google Scholar] [CrossRef] [PubMed]
- Loomis, D.; Guyton, K.Z.; Grosse, Y.; Lauby-Secretan, B.; El Ghissassi, F.; Bouvard, V.; Benbrahim-Tallaa, L.; Guha, N.; Mattock, H.; Straif, K.; et al. Carcinogenicity of drinking coffee, mate, and very hot beverages. Lancet Oncol. 2016, 17, 877–878. [Google Scholar] [CrossRef]
- Bingham, S.A. Limitations of the various methods for collecting dietary intake data. Ann. Nutr. Metab. 1991, 35, 117–127. [Google Scholar] [CrossRef] [PubMed]
- Riboli, E.; Hunt, K.J.; Slimani, N.; Ferrari, P.; Norat, T.; Fahey, M.; Charrondière, U.R.; Hémon, B.; Casagrande, C.; Vignat, J.; et al. European Prospective Investigation into Cancer and Nutrition (EPIC): Study populations and data collection. Public Health Nutr. 2002, 5, 1113–1124. [Google Scholar] [CrossRef] [PubMed]
- Slimani, N.; Kaaks, R.; Ferrari, P.; Casagrande, C.; Clavel-Chapelon, F.; Lotze, G.; Kroke, A.; Trichopoulos, D.; Trichopoulou, A.; Lauria, C.; et al. European Prospective Investigation into Cancer and Nutrition (EPIC) calibration study: Rationale, design and population characteristics. Public Health Nutr. 2002, 5, 1125–1145. [Google Scholar] [CrossRef] [PubMed]
- Riboli, E.; Kaaks, R. The EPIC Project: Rationale and study design. European Prospective Investigation into Cancer and Nutrition. Int. J. Epidemiol. 1997, 26 (Suppl. 1), S6–S14. [Google Scholar] [CrossRef] [PubMed]
- Bingham, S.; Riboli, E. Diet and cancer—the European Prospective Investigation into Cancer and Nutrition. Nat. Rev. Cancer 2004, 4, 206–215. [Google Scholar] [CrossRef] [PubMed]
- Ferrari, P.; Kaaks, R.; Fahey, M.T.; Slimani, N.; Day, N.E.; Pera, G.; Boshuizen, H.C.; Roddam, A.; Boeing, H.; Nagel, G.; et al. Within- and between-cohort variation in measured macronutrient intakes, taking account of measurement errors, in the European Prospective Investigation into Cancer and Nutrition study. Am. J. Epidemiol. 2004, 160, 814–822. [Google Scholar] [CrossRef] [PubMed]
- Ferrari, P.; Day, N.E.; Boshuizen, H.C.; Roddam, A.; Hoffmann, K.; Thiebaut, A.; Pera, G.; Overvad, K.; Lund, E.; Trichopoulou, A.; et al. The evaluation of the diet/disease relation in the EPIC study: Considerations for the calibration and the disease models. Int. J. Epidemiol. 2008, 37, 368–378. [Google Scholar] [CrossRef] [PubMed]
- Kaaks, R.; Plummer, M.; Riboli, E.; Esteve, J.; van Staveren, W. Adjustment for bias due to errors in exposure assessments in multicenter cohort studies on diet and cancer: A calibration approach. Am. J. Clin. Nutr. 1994, 59, 245S–250S. [Google Scholar] [CrossRef] [PubMed]
- Kaaks, R.; Riboli, E.; van Staveren, W. Calibration of dietary intake measurements in prospective cohort studies. Am. J. Epidemiol. 1995, 142, 548–556. [Google Scholar] [CrossRef] [PubMed]
- Brustad, M.; Skeie, G.; Braaten, T.; Slimani, N.; Lund, E. Comparison of telephone vs face-to-face interviews in the assessment of dietary intake by the 24 h recall EPIC SOFT program--the Norwegian calibration study. Eur. J. Clin. Nutr. 2003, 57, 107–113. [Google Scholar] [CrossRef] [PubMed]
- Slimani, N.; Deharveng, G.; Charrondiere, R.U.; van Kappel, A.L.; Ocke, M.C.; Welch, A.; Lagiou, A.; van Liere, M.; Agudo, A.; Pala, V.; et al. Structure of the standardized computerized 24-h diet recall interview used as reference method in the 22 centers participating in the EPIC project. European Prospective Investigation into Cancer and Nutrition. Comput. Methods Program Biomed. 1999, 58, 251–266. [Google Scholar] [CrossRef]
- Slimani, N.; Ferrari, P.; Ocke, M.; Welch, A.; Boeing, H.; Liere, M.; Pala, V.; Amiano, P.; Lagiou, A.; Mattisson, I.; et al. Standardization of the 24-h diet recall calibration method used in the european prospective investigation into cancer and nutrition (EPIC): General concepts and preliminary results. Eur. J. Clin. Nutr. 2000, 54, 900–917. [Google Scholar] [CrossRef] [PubMed]
- Slimani, N.; Deharveng, G.; Unwin, I.; Southgate, D.A.; Vignat, J.; Skeie, G.; Salvini, S.; Parpinel, M.; Møller, A.; Ireland, J.; et al. The EPIC nutrient database project (ENDB): A first attempt to standardize nutrient databases across the 10 European countries participating in the EPIC study. Eur. J. Clin. Nutr. 2007, 61, 1037–1056. [Google Scholar] [CrossRef] [PubMed]
- Lahmann, P.H.; Friedenreich, C.; Schuit, A.J.; Salvini, S.; Allen, N.E.; Key, T.J.; Khaw, K.T.; Bingham, S.; Peeters, P.H.; Monninkhof, E.; et al. Physical activity and breast cancer risk: The European Prospective Investigation into Cancer and Nutrition. Cancer Epidemiol. Biomark. Prev. 2007, 16, 36–42. [Google Scholar] [CrossRef] [PubMed]
- Haftenberger, M.; Schuit, A.J.; Tormo, M.J.; Boeing, H.; Wareham, N.; Bueno-de-Mesquita, H.B.; Kumle, M.; Hjartåker, A.; Chirlaque, M.D.; Ardanaz, E.; et al. Physical activity of subjects aged 50-64 years involved in the European Prospective Investigation into Cancer and Nutrition (EPIC). Public Health Nutr. 2002, 5, 1163–1176. [Google Scholar] [CrossRef] [PubMed]
- Michaud, D.S.; Gallo, V.; Schlehofer, B.; Tjønneland, A.; Olsen, A.; Overvad, K.; Dahm, C.C.; Teucher, B.; Lukanova, A.; Boeing, H.; et al. Coffee and tea intake and risk of brain tumors in the European Prospective Investigation into Cancer and Nutrition (EPIC) cohort study. Am. J. Clin. Nutr. 2010, 92, 1145–1150. [Google Scholar] [CrossRef] [PubMed] [Green Version]
- Zamora-Ros, R.; Luján-Barroso, L.; Bueno-de-Mesquita, H.B.; Dik, V.K.; Boeing, H.; Steffen, A.; Tjønneland, A.; Olsen, A.; Bech, B.H.; Overvad, K.; et al. Tea and coffee consumption and risk of esophageal cancer: The European prospective investigation into cancer and nutrition study. Int. J. Cancer 2014, 135, 1470–1479. [Google Scholar] [CrossRef] [PubMed] [Green Version]
- Sanikini, H.; Dik, V.K.; Siersema, P.D.; Bhoo-Pathy, N.; Uiterwaal, C.S.P.M.; Peeters, P.H.M.; González, C.A.; Zamora-Ros, R.; Overvad, K.; Tjønneland, A.; et al. Total, caffeinated and decaffeinated coffee and tea intake and gastric cancer risk: Results from the EPIC cohort study. Int. J. Cancer 2015, 136, E720–E730. [Google Scholar] [CrossRef] [PubMed]
- Loftfield, E.; Freedman, N.D.; Dodd, K.W.; Vogtmann, E.; Xiao, Q.; Sinha, R.; Graubard, B.I. Coffee Drinking Is Widespread in the United States, but Usual Intake Varies by Key Demographic and Lifestyle Factors. J. Nutr. 2016, 146, 1762–1768. [Google Scholar] [CrossRef] [PubMed] [Green Version]
- Yamada, H.; Kawado, M.; Aoyama, N.; Hashimoto, S.; Suzuki, K.; Wakai, K.; Suzuki, S.; Watanabe, Y.; Tamakoshi, A.; The JACC Study Group. Coffee Consumption and Risk of Colorectal Cancer: The Japan Collaborative Cohort Study. J. Epidemiol. 2014, 24, 370–378. [Google Scholar] [CrossRef] [PubMed] [Green Version]
- Grosso, G.; Stepaniak, U.; Micek, A.; Topor-Mądry, R.; Pikhart, H.; Szafraniec, K.; Pająk, A. Association of daily coffee and tea consumption and metabolic syndrome: Results from the Polish arm of the HAPIEE study. Eur. J. Nutr. 2015, 54, 1129–1137. [Google Scholar] [CrossRef] [PubMed]
- Ainslie-Waldman, C.E.; Koh, W.-P.; Jin, A.; Yeoh, K.G.; Zhu, F.; Wang, R.; Yuan, J.M.; Butler, L.M. Coffee Intake and Gastric Cancer Risk: The Singapore Chinese Health Study. Cancer Epidemiol. Biomarkers Prev. 2014, 23, 638–647. [Google Scholar] [CrossRef] [PubMed] [Green Version]
- De Oliveira, R.A.M.; Araújo, L.F.; de Figueiredo, R.C.; Goulart, A.C.; Schmidt, M.I.; Barreto, S.M.; Ribeiro, A.L.P. Coffee Consumption and Heart Rate Variability: The Brazilian Longitudinal Study of Adult Health (ELSA-Brasil) Cohort Study. Nutrients 2017, 9, 741. [Google Scholar] [CrossRef] [PubMed]
- Kim, J.-H.; Park, Y.S. Light coffee consumption is protective against sarcopenia, but frequent coffee consumption is associated with obesity in Korean adults. Nutr. Res. 2017, 41, 97–102. [Google Scholar] [CrossRef] [PubMed]
- Vernarelli, J.A.; Lambert, J.D. Tea consumption is inversely associated with weight status and other markers for Metabolic Syndrome in U.S. adults. Eur. J. Nutr. 2013, 52, 1039–1048. [Google Scholar] [CrossRef] [PubMed]
- Caini, S.; Masala, G.; Saieva, C.; Kvaskoff, M.; Savoye, I.; Sacerdote, C.; Hemmingsson, O.; Hammer Bech, B.; Overvad, K.; Tjønneland, A.; et al. Coffee, tea and melanoma risk: Findings from the European Prospective Investigation into Cancer and Nutrition. Int. J. Cancer 2017, 140, 2246–2255. [Google Scholar] [CrossRef] [PubMed]
- EFSA. The EFSA Comprehensive European Food Consumption Database 2011. Available online: http://www.efsa.europa.eu/en/food-consumption/comprehensive-database (accessed on 18 August 2017).
- EFSA. Fact Sheets on Caffeine. 2015. Available online: http://www.efsa.europa.eu/en/corporate/pub/efsaexplainscaffeine150527 (accessed on 30 May 2018).
- Lang, R.; Dieminger, N.; Beusch, A.; Lee, Y.-M.; Dunkel, A.; Suess, B.; Skurk, T.; Wahl, A.; Hauner, H.; Hofmann, T. Bioappearance and pharmacokinetics of bioactives upon coffee consumption. Anal. Bioanal. Chem. 2013, 405, 8487–8503. [Google Scholar] [CrossRef] [PubMed]
- Urgert, R.; Katan, M.B. The cholesterol-raising factor from coffee beans. J. R. Soc. Med. 1996, 89, 618–623. [Google Scholar] [CrossRef] [PubMed]


| Country and Centre | Total Coffee and Tea * | Coffee | Tea * | Herbal Tea | Chicory and Substitutes | ||||||
|---|---|---|---|---|---|---|---|---|---|---|---|
| n | Fully Adjusted Mean 1 | SEM 2 | Fully Adjusted Mean 1 | SEM 2 | Fully Adjusted Mean 1 | SEM 2 | Fully Adjusted Mean 1 | SEM 2 | Fully Adjusted Mean 1 | SEM 2 | |
| Greece | 1324 | 173.5 | 13.3 | 106.7 | 12.2 | 47.9 | 9.2 | 18.3 | 4.4 | 0.6 | 1.8 |
| Spain | |||||||||||
| Granada | 214 | 387.3 | 31.9 | 316.1 | 29.4 | 27.3 | 22.1 | 31.7 | 10.6 | 12.2 | 4.3 |
| Murcia | 243 | 302.0 | 30.0 | 202.9 | 27.7 | 25.1 | 20.8 | 53.5 | 10.0 | 20.5 | 4.0 |
| Navarra | 444 | 309.2 | 22.3 | 267.2 | 20.6 | 18.7 | 15.4 | 14.4 | 7.4 | 9.0 | 3.0 |
| San Sebastian | 490 | 270.2 | 21.4 | 192.9 | 19.7 | 17.7 | 14.8 | 28.1 | 7.1 | 31.6 | 2.9 |
| Asturias | 386 | 379.5 | 23.8 | 295.0 | 22.0 | 23.0 | 16.5 | 29.1 | 7.9 | 32.4 | 3.2 |
| Italy | |||||||||||
| Ragusa | 168 | 222.6 | 36.0 | 160.3 | 33.2 | 47.6 | 25.0 | 4.9 | 12.0 | 9.7 | 4.8 |
| Florence | 271 | 270.1 | 28.2 | 187.2 | 26.0 | 45.5 | 19.6 | 9.0 | 9.4 | 28.4 | 3.8 |
| Turin | 676 | 260.9 | 18.0 | 171.7 | 16.6 | 56.3 | 12.5 | 13.6 | 6.0 | 19.3 | 2.4 |
| Varese | 327 | 392.6 | 25.8 | 277.9 | 23.8 | 70.1 | 17.9 | 14.6 | 8.6 | 29.9 | 3.5 |
| Germany | |||||||||||
| Heidelberg | 1034 | 897.1 | 14.6 | 597.7 | 13.4 | 164.6 | 10.1 | 125.6 | 4.9 | 9.3 | 2.0 |
| Potsdam | 1233 | 843.9 | 13.2 | 578.7 | 12.2 | 126.8 | 9.2 | 128.2 | 4.4 | 10.3 | 1.8 |
| The Netherlands | |||||||||||
| Bilthoven | 1020 | 960.5 | 15.1 | 698.1 | 13.9 | 235.0 | 10.5 | 21.6 | 5.0 | 5.8 | 2.0 |
| United Kingdom | |||||||||||
| General population | 405 | 1467.7 | 23.1 | 523.9 | 21.3 | 927.8 | 16.0 | 9.5 | 7.7 | 6.4 | 3.1 |
| Health-conscious | 113 | 1222.4 | 43.9 | 439.0 | 40.5 | 620.5 | 30.4 | 113.1 | 14.6 | 49.9 | 5.9 |
| Denmark | |||||||||||
| Copenhagen | 1356 | 1152.0 | 12.7 | 896.7 | 11.8 | 229.9 | 8.8 | 25.7 | 4.2 | 0.0 | |
| Aarhus | 567 | 1220.8 | 19.6 | 1015.5 | 18.0 | 184.9 | 13.6 | 18.0 | 6.5 | 2.3 | 2.6 |
| Sweden | |||||||||||
| Malmö | 1421 | 855.7 | 13.2 | 727.1 | 12.1 | 133.5 | 9.1 | 0.0 | 0.0 | ||
| Umeå | 1342 | 785.6 | 12.8 | 626.1 | 11.8 | 160.4 | 8.9 | 0.0 | 0.0 | ||
| Country and Centre | Total Coffee and Tea * | Coffee | Tea * | Herbal Tea | Chicory and Substitutes | ||||||
|---|---|---|---|---|---|---|---|---|---|---|---|
| n | Fully Adjusted Mean 1 | SEM 2 | Fully Adjusted Mean 1 | SEM 2 | Fully Adjusted Mean 2 | SEM 2 | Fully Adjusted Mean 2 | SEM 2 | Fully Adjusted Mean 1 | SEM 2 | |
| Greece | 1368 | 170.3 | 12.5 | 93.8 | 10.3 | 54.5 | 9.8 | 20.0 | 5.5 | 2.0 | 3.4 |
| Spain | |||||||||||
| Granada | 300 | 425.9 | 25.8 | 299.8 | 21.3 | 24.4 | 20.2 | 78.4 | 11.4 | 23.3 | 7.1 |
| Murcia | 304 | 389.9 | 25.6 | 289.3 | 21.1 | 20.9 | 20.1 | 62.0 | 11.4 | 17.7 | 7.1 |
| Navarra | 271 | 491.2 | 27.0 | 433.4 | 22.3 | 14.4 | 21.2 | 24.5 | 12.0 | 18.9 | 7.4 |
| San Sebastian | 244 | 468.3 | 28.4 | 360.8 | 23.5 | 20.8 | 22.3 | 39.9 | 12.6 | 46.8 | 7.8 |
| Asturias | 324 | 532.8 | 24.7 | 454.9 | 20.4 | 18.3 | 19.4 | 37.6 | 11.0 | 22.0 | 6.8 |
| Italy | |||||||||||
| Ragusa | 137 | 201.0 | 38.1 | 147.8 | 31.4 | 32.4 | 29.9 | 12.0 | 16.9 | 8.9 | 10.5 |
| Naples | 403 | 297.2 | 22.3 | 226.6 | 18.4 | 41.5 | 17.5 | 10.3 | 9.9 | 18.8 | 6.1 |
| Florence | 783 | 328.1 | 15.9 | 226.3 | 13.1 | 54.8 | 12.5 | 17.2 | 7.1 | 29.7 | 4.4 |
| Turin | 392 | 312.3 | 22.4 | 194.9 | 18.5 | 73.3 | 17.6 | 21.3 | 10.0 | 22.8 | 6.2 |
| Varese | 795 | 404.1 | 15.9 | 262.8 | 13.1 | 97.0 | 12.5 | 25.1 | 7.0 | 19.1 | 4.4 |
| France | |||||||||||
| South coast | 620 | 567.0 | 17.9 | 282.8 | 14.8 | 147.1 | 14.1 | 63.7 | 8.0 | 73.4 | 4.9 |
| South | 1425 | 651.7 | 11.9 | 280.7 | 9.8 | 228.7 | 9.3 | 64.4 | 5.3 | 78.0 | 3.3 |
| Northeast | 2059 | 656.0 | 9.9 | 323.3 | 8.2 | 200.3 | 7.8 | 62.1 | 4.4 | 70.3 | 2.7 |
| Northwest | 631 | 722.9 | 17.8 | 365.3 | 14.7 | 245.2 | 13.9 | 50.4 | 7.9 | 62.1 | 4.9 |
| Germany | |||||||||||
| Heidelberg | 1087 | 968.7 | 13.6 | 557.6 | 11.2 | 193.1 | 10.7 | 202.2 | 6.1 | 15.8 | 3.8 |
| Potsdam | 1060 | 815.8 | 13.7 | 510.3 | 11.3 | 113.2 | 10.8 | 178.7 | 6.1 | 13.6 | 3.8 |
| The Netherlands | |||||||||||
| Bilthoven | 1076 | 949.0 | 13.8 | 591.0 | 11.4 | 303.3 | 10.8 | 42.4 | 6.1 | 12.3 | 3.8 |
| Utrecht | 1870 | 1050.1 | 10.4 | 570.1 | 8.6 | 431.9 | 8.2 | 39.7 | 4.6 | 8.4 | 2.9 |
| United Kingdom | |||||||||||
| General population | 570 | 1321.3 | 18.6 | 491.2 | 15.3 | 788.4 | 14.6 | 34.3 | 8.2 | 7.4 | 5.1 |
| Health-conscious | 196 | 1139.0 | 31.7 | 328.1 | 26.1 | 601.4 | 24.9 | 116.1 | 14.1 | 93.4 | 8.7 |
| Denmark | |||||||||||
| Copenhagen | 1484 | 1009.3 | 11.6 | 631.7 | 9.6 | 315.8 | 9.1 | 61.4 | 5.2 | 0.5 | 3.2 |
| Aarhus | 510 | 1109.5 | 19.7 | 781.0 | 16.2 | 230.2 | 15.4 | 95.0 | 8.7 | 3.3 | 5.4 |
| Sweden | |||||||||||
| Malmö | 1711 | 805.7 | 11.0 | 646.3 | 9.1 | 147.6 | 8.7 | 11.9 | 4.9 | 0.0 | |
| Umeå | 1567 | 704.0 | 11.2 | 527.8 | 9.3 | 168.9 | 8.8 | 7.1 | 5.0 | 0.2 | 3.1 |
| Norway | |||||||||||
| South and East | 1004 | 892.8 | 14.4 | 643.7 | 11.8 | 190.1 | 11.3 | 57.1 | 6.4 | 1.9 | 4.0 |
| North and West | 793 | 894.5 | 16.0 | 690.9 | 13.2 | 135.1 | 12.6 | 67.4 | 7.1 | 1.1 | 4.4 |
| Country and Centre | Men | Women | ||||||||||||||||||||||
|---|---|---|---|---|---|---|---|---|---|---|---|---|---|---|---|---|---|---|---|---|---|---|---|---|
| All | 35–44 Years | 45–54 Years | 55–64 Years | 65–74 Years | All | 35–44 Years | 45–54 Years | 55–64 Years | 65–74 Years | |||||||||||||||
| n | Mean 1 | SEM 2 | Mean 1 | SEM 2 | Mean 1 | SEM 2 | Mean 1 | SEM 2 | Mean 1 | SEM 2 | p-Trend | n | Mean 1 | SEM 2 | Mean 1 | SEM 2 | Mean 1 | SEM 2 | Mean 1 | SEM 2 | Mean 1 | SEM 2 | p-Trend | |
| Greece | 1324 | 173.5 | 13.3 | 116.4 | 37.9 | 137.9 | 26.9 | 184.5 | 23.1 | 191.6 | 22.0 | 0.034 | 1368 | 170.3 | 12.5 | 146.2 | 31.8 | 169.4 | 21.3 | 179.7 | 21.4 | 166.3 | 26.3 | 0.349 |
| Spain | ||||||||||||||||||||||||
| Granada | 214 | 387.3 | 31.9 | 377.6 | 133.3 | 444.5 | 64.6 | 381.3 | 43.2 | 317.2 | 77.6 | 0.393 | 300 | 425.9 | 25.8 | 426.8 | 63.8 | 475.9 | 42.7 | 409.9 | 40.5 | 349.4 | 88.0 | 0.263 |
| Murcia | 243 | 302.0 | 30.0 | 319.8 | 85.3 | 342.1 | 54.6 | 277.5 | 41.4 | 343.7 | 113.6 | 0.970 | 304 | 389.9 | 25.6 | 408.0 | 49.7 | 463.4 | 43.3 | 351.2 | 42.0 | 268.1 | 144.8 | 0.177 |
| Navarra | 444 | 309.2 | 22.3 | 254.4 | 86.0 | 305.6 | 37.3 | 322.1 | 31.4 | 314.5 | 71.8 | 0.169 | 271 | 491.2 | 27.0 | 603.1 | 66.8 | 493.0 | 44.3 | 469.2 | 40.7 | 385.8 | 143.4 | 0.026 |
| San Sebastian | 490 | 270.2 | 21.4 | 304.0 | 46.5 | 282.9 | 29.4 | 264.3 | 41.0 | 298.8 | 119.3 | 0.754 | 244 | 468.3 | 28.4 | 421.4 | 59.5 | 482.5 | 45.2 | 513.7 | 47.5 | 454.6 | 164.6 | 0.571 |
| Asturias | 386 | 379.5 | 23.8 | 453.1 | 79.5 | 360.1 | 40.4 | 377.3 | 34.8 | 414.1 | 70.1 | 0.689 | 324 | 532.8 | 24.7 | 570.6 | 58.6 | 593.1 | 39.5 | 494.8 | 39.7 | 390.7 | 104.0 | 0.098 |
| Italy | ||||||||||||||||||||||||
| Ragusa | 168 | 222.6 | 36.0 | 184.5 | 103.6 | 234.9 | 53.2 | 240.6 | 55.7 | 250.0 | 246.7 | 0.110 | 137 | 201.0 | 38.1 | 197.2 | 62.6 | 234.9 | 70.5 | 233.0 | 68.5 | 171.6 | 179.0 | 0.667 |
| Naples | 403 | 297.2 | 22.3 | 264.9 | 68.7 | 313.2 | 33.2 | 303.2 | 36.6 | 272.0 | 73.3 | 0.938 | ||||||||||||
| Florence | 271 | 270.1 | 28.2 | 200.1 | 84.8 | 246.5 | 46.0 | 310.5 | 41.1 | 324.3 | 121.7 | 0.025 | 783 | 328.1 | 15.9 | 306.5 | 49.8 | 328.2 | 27.3 | 333.7 | 22.1 | 314.3 | 68.8 | 0.702 |
| Turin | 676 | 260.9 | 18.0 | 260.6 | 54.3 | 268.4 | 29.7 | 268.7 | 25.4 | 225.6 | 86.7 | 0.341 | 392 | 312.3 | 22.4 | 292.7 | 66.6 | 336.4 | 36.4 | 302.0 | 32.1 | 373.8 | 134.9 | 0.269 |
| Varese | 327 | 392.6 | 25.8 | 368.0 | 141.7 | 364.8 | 58.1 | 397.1 | 30.2 | 393.4 | 109.9 | 0.164 | 795 | 404.1 | 15.9 | 376.0 | 48.0 | 405.4 | 26.2 | 414.6 | 23.9 | 391.6 | 49.7 | 0.571 |
| France | ||||||||||||||||||||||||
| South coast | 620 | 567.0 | 17.9 | 608.2 | 28.6 | 541.4 | 27.6 | 497.9 | 39.8 | 0.077 | ||||||||||||||
| South | 1425 | 651.7 | 11.9 | 349.5 | 376.3 | 662.4 | 17.9 | 658.8 | 18.7 | 577.0 | 28.2 | 0.404 | ||||||||||||
| Northeast | 2059 | 656.0 | 9.9 | 663.0 | 15.0 | 648.4 | 15.4 | 619.2 | 23.8 | 0.121 | ||||||||||||||
| Northwest | 631 | 722.9 | 17.8 | 762.2 | 27.5 | 685.9 | 27.0 | 682.5 | 43.7 | 0.309 | ||||||||||||||
| Germany | ||||||||||||||||||||||||
| Heidelberg | 1034 | 897.1 | 14.6 | 946.8 | 37.4 | 949.2 | 22.9 | 846.3 | 21.4 | 1496.3 | 241.5 | 0.324 | 1087 | 968.7 | 13.6 | 1005.3 | 22.9 | 999.2 | 24.1 | 951.6 | 22.8 | 0.267 | ||
| Potsdam | 1233 | 843.9 | 13.2 | 862.2 | 36.4 | 854.8 | 26.4 | 834.9 | 17.3 | 918.3 | 64.5 | 0.464 | 1060 | 815.8 | 13.7 | 816.5 | 26.5 | 879.4 | 26.6 | 806.9 | 19.8 | 538.2 | 154.5 | 0.227 |
| The Netherlands | ||||||||||||||||||||||||
| Bilthoven | 1020 | 960.5 | 15.1 | 987.7 | 27.8 | 989.8 | 22.9 | 946.9 | 25.5 | 850.8 | 333.6 | 0.100 | 1076 | 949.0 | 13.8 | 926.1 | 23.9 | 1030.7 | 21.1 | 923.8 | 26.2 | 756.2 | 249.5 | 0.299 |
| Utrecht | 1870 | 1050.1 | 10.4 | 1040.7 | 17.2 | 1047.5 | 15.7 | 1024.7 | 22.0 | 0.522 | ||||||||||||||
| United Kingdom | ||||||||||||||||||||||||
| General population | 405 | 1467.7 | 23.1 | 1311.7 | 73.8 | 1595.7 | 40.6 | 1418.3 | 42.2 | 1418.9 | 42.8 | 0.842 | 570 | 1321.3 | 18.6 | 1279.9 | 52.8 | 1385.3 | 30.0 | 1316.0 | 34.2 | 1227.8 | 40.9 | 0.560 |
| Health-conscious | 113 | 1222.4 | 43.9 | 1744.7 | 138.7 | 1141.8 | 68.3 | 1125.2 | 70.7 | 1411.1 | 127.9 | 0.548 | 196 | 1139.0 | 31.7 | 1180.6 | 95.9 | 1084.2 | 51.7 | 1256.0 | 50.5 | 910.2 | 88.2 | 0.447 |
| Denmark | ||||||||||||||||||||||||
| Copenhagen | 1356 | 1152.0 | 12.7 | 1162.6 | 19.8 | 1143.5 | 16.6 | 1136.0 | 107.9 | 0.158 | 1484 | 1009.3 | 11.6 | 1092.5 | 18.6 | 949.4 | 14.8 | 954.9 | 91.0 | 0.355 | ||||
| Aarhus | 567 | 1220.8 | 19.6 | 1265.9 | 26.7 | 1176.7 | 28.6 | 1030.8 | 227.0 | 0.088 | 510 | 1109.5 | 19.7 | 1153.2 | 26.4 | 1058.7 | 29.8 | 929.4 | 152.6 | 0.057 | ||||
| Sweden | ||||||||||||||||||||||||
| Malmö | 1421 | 855.7 | 13.2 | 1007.6 | 34.3 | 886.8 | 19.4 | 752.8 | 18.0 | 0.019 | 1711 | 805.7 | 11.0 | 865.8 | 21.6 | 781.8 | 17.6 | 744.8 | 17.2 | 0.141 | ||||
| Umeå | 1342 | 785.6 | 12.8 | 804.0 | 41.4 | 824.2 | 23.0 | 755.7 | 17.1 | 782.9 | 52.9 | 0.420 | 1567 | 704.0 | 11.2 | 792.5 | 26.1 | 733.9 | 19.4 | 643.7 | 16.9 | 694.7 | 50.8 | 0.212 |
| Norway | ||||||||||||||||||||||||
| South and East | 1004 | 892.8 | 14.4 | 853.6 | 30.9 | 909.2 | 17.4 | 1000.1 | 38.4 | 0.088 | ||||||||||||||
| North and West | 793 | 894.5 | 16.0 | 914.7 | 33.6 | 912.9 | 19.2 | 906.6 | 48.8 | 0.195 | ||||||||||||||
| Country and Centre | Men | Women | ||||||||||
|---|---|---|---|---|---|---|---|---|---|---|---|---|
| n | All | None/Primary | Tech/Professional/Secondary | University | p-Trend | n | All | None/Primary | Tech/Professional/Secondary | University | p-Trend | |
| Greece | 1319 | 171.8 (13.2) | 176.6 (19.1) | 145.4 (27.8) | 176.2 (23.2) | 0.993 | 1361 | 170.6 (12.5) | 162.2 (17.0) | 158.6 (25.1) | 181.7 (25.3) | 0.425 |
| Spain | ||||||||||||
| Granada | 208 | 388.2 (32.1) | 375.0 (42.5) | 383.1 (79.8) | 409.8 (60.5) | 0.191 | 294 | 426.9 (26.0) | 434.8 (27.7) | 334.8 (93.1) | 362.5 (118.2) | 0.506 |
| Murcia | 243 | 300.3 (29.9) | 266.0 (35.2) | 385.3 (93.3) | 374.9 (68.6) | 0.384 | 304 | 390.6 (25.5) | 384.0 (29.6) | 360.5 (81.1) | 430.6 (62.9) | 0.547 |
| Navarra | 442 | 307.7 (22.2) | 301.1 (26.1) | 315.5 (47.7) | 322.7 (82.1) | 0.122 | 270 | 493.0 (27.0) | 486.3 (29.5) | 443.6 (89.7) | 601.2 (97.3) | 0.502 |
| San Sebastian | 488 | 269.8 (21.3) | 251.8 (26.9) | 281.3 (38.6) | 339.1 (68.8) | 0.118 | 242 | 464.7 (28.5) | 478.6 (33.4) | 454.3 (63.0) | 361.6 (103.0) | 0.207 |
| Asturias | 384 | 372.8 (23.8) | 372.7 (29.6) | 331.2 (49.7) | 427.2 (63.4) | 0.617 | 319 | 534.7 (24.9) | 533.6 (27.7) | 607.5 (72.6) | 422.8 (87.1) | 0.594 |
| Italy | ||||||||||||
| Ragusa | 167 | 221.2 (35.9) | 200.2 (52.9) | 241.0 (57.1) | 221.6 (90.3) | 0.648 | 137 | 201.6 (38.0) | 224.3 (54.1) | 173.8 (60.0) | 192.0 (110.5) | 0.566 |
| Naples | 403 | 297.5 (22.3) | 287.9 (34.1) | 305.2 (34.1) | 283.0 (54.6) | 0.865 | ||||||
| Florence | 269 | 269.4 (28.2) | 264.6 (45.3) | 278.1 (42.0) | 256.0 (68.2) | 0.747 | 780 | 328.2 (15.9) | 314.1 (22.9) | 330.6 (26.3) | 357.6 (39.4) | 0.088 |
| Turin | 676 | 260.2 (17.9) | 242.8 (28.6) | 270.0 (24.6) | 270.6 (58.3) | 0.322 | 392 | 312.4 (22.4) | 299.7 (29.5) | 323.4 (39.5) | 338.4 (67.4) | 0.082 |
| Varese | 327 | 392.0 (25.6) | 422.2 (36.8) | 370.3 (37.0) | 279.4 (120.9) | 0.100 | 794 | 404.1 (15.9) | 408.9 (19.5) | 384.4 (30.3) | 407.6 (57.4) | 0.969 |
| France | ||||||||||||
| South coast | 595 | 565.4 (18.2) | 521.6 (49.0) | 537.6 (25.1) | 624.1 (30.6) | 0.241 | ||||||
| South | 1358 | 649.5 (12.2) | 549.0 (36.4) | 626.7 (16.7) | 711.7 (19.7) | 0.016 | ||||||
| Northeast | 1984 | 658.6 (10.1) | 574.0 (28.0) | 652.0 (14.4) | 694.4 (15.9) | 0.108 | ||||||
| Northwest | 615 | 722.0 (17.9) | 616.7 (48.3) | 730.0 (23.6) | 755.5 (32.8) | 0.223 | ||||||
| Germany | ||||||||||||
| Heidelberg | 1031 | 897.6 (14.5) | 854.8 (24.5) | 855.8 (24.2) | 995.5 (26.2) | 0.330 | 1085 | 970.1 (13.6) | 948.9 (26.1) | 996.4 (19.0) | 949.3 (28.1) | 0.995 |
| Potsdam | 1233 | 844.0 (13.2) | 829.3 (29.1) | 811.5 (23.4) | 871.3 (18.9) | 0.521 | 1060 | 816.5 (13.7) | 816.7 (26.8) | 835.4 (19.4) | 780.4 (27.3) | 0.550 |
| The Netherlands | ||||||||||||
| Bilthoven | 1017 | 962.1 (15.0) | 1031.4 (39.7) | 928.9 (19.3) | 1002.6 (27.9) | 0.824 | 1071 | 951.3 (13.8) | 894.5 (35.8) | 930.9 (17.2) | 1058.2 (28.8) | 0.198 |
| Utrecht | 1869 | 1050.2 (10.4) | 1030.6 (20.9) | 1036.0 (13.2) | 1138.0 (26.6) | 0.305 | ||||||
| United Kingdom | ||||||||||||
| General population | 335 | 1470.9 (25.0) | 1640.0 (63.0) | 1500.2 (33.3) | 1321.8 (47.0) | 0.045 | 448 | 1312.3 (20.7) | 1406.6 (43.8) | 1319.9 (27.5) | 1195.9 (44.2) | 0.065 |
| Health-conscious | 84 | 1299.3 (49.6) | 1119.2 (85.9) | 1392.6 (60.2) | 164 | 1186.3 (34.7) | 1250.0 (53.2) | 1143.9 (45.4) | ||||
| Denmark | ||||||||||||
| Copenhagen | 1355 | 1153.2 (12.7) | 1155.3 (23.2) | 1135.5 (20.0) | 1176.4 (22.5) | 0.656 | 1484 | 1009.5 (11.6) | 938.2 (22.3) | 1020.9 (14.8) | 1106.8 (32.3) | 0.007 |
| Aarhus | 567 | 1221.6 (19.5) | 1279.7 (34.3) | 1176.8 (29.5) | 1227.7 (38.5) | 0.663 | 510 | 1109.9 (19.6) | 1152.7 (36.0) | 1079.0 (24.9) | 1195.7 (65.8) | 0.763 |
| Sweden | ||||||||||||
| Malmö | 1418 | 856.9 (13.1) | 844.5 (18.9) | 856.4 (22.0) | 886.3 (25.9) | 0.155 | 1708 | 805.8 (11.0) | 780.7 (17.3) | 809.5 (17.5) | 836.4 (22.8) | 0.012 |
| Umeå | 1338 | 787.5 (12.8) | 785.2 (21.0) | 761.3 (19.5) | 847.8 (27.3) | 0.506 | 1560 | 704.9 (11.2) | 656.8 (21.2) | 703.9 (16.7) | 756.5 (21.4) | 0.020 |
| Norway | ||||||||||||
| South and East | 1004 | 893.7 (14.3) | 900.9 (34.3) | 890.0 (17.3) | 932.2 (34.8) | 0.494 | ||||||
| North and West | 793 | 895.5 (16.0) | 942.4 (33.8) | 886.9 (19.5) | 894.0 (44.6) | 0.408 | ||||||
| Country and Centre | Total Energy Intake (kcal) 1 | Sugar (g) 1 | Calcium (mg) 1 | Magnesium (mg) 1 | Phosphorus (mg) 1 | ||||||||||
|---|---|---|---|---|---|---|---|---|---|---|---|---|---|---|---|
| Total Mean Intake (s.e 3) | From CT 2 (s.e 3) | % | Total Mean Intake (s.e 3) | From CT 2 (s.e 3) | % | Total Mean Intake (s.e 3) | From CT 2 (s.e 3) | % | Total Mean Intake (s.e 3) | From CT 2 (s.e 3) | % | Total Mean Intake (s.e 3) | From CT 2 (s.e 3) | % | |
| Greece | 1939.2 (14.0) | 59.6 (1.7) | 3.3 | 79.0 (1.0) | 8.4 (0.3) | 11.8 | 986.1 (9.0) | 80.2 (2.7) | 11.4 | 318.1 (2.3) | 23.5 (0.9) | 8.7 | 1789.4 (10.9) | 68.1 (2.1) | 5.3 |
| Spain | |||||||||||||||
| Granada | 2142.0 (31.3) | 153.1 (3.8) | 7.9 | 102.6 (2.3) | 19.9 (0.7) | 21.5 | 1027.5 (20.3) | 250.1 (6.1) | 28.1 | 369.6 (5.2) | 39.7 (1.9) | 11.7 | 1402.8 (24.4) | 191.0 (4.8) | 15.6 |
| Murcia | 2328.4 (30.3) | 133.3 (3.7) | 6.5 | 117.0 (2.2) | 18.7 (0.6) | 18.4 | 1011.4 (19.6) | 238.1 (5.9) | 27.8 | 403.9 (5.1) | 40.5 (1.9) | 11.3 | 1456.4 (23.7) | 183.0 (4.6) | 18.9 |
| Navarra | 2294.0 (26.6) | 140.0 (3.3) | 6.7 | 96.2 (1.9) | 18.4 (0.6) | 20.9 | 908.3 (17.2) | 254.2 (5.2) | 33.0 | 360.3 (4.5) | 41.9 (1.6) | 13.0 | 1447.9 (20.7) | 193.4 (4.1) | 14.6 |
| San Sebastian | 2456.0 (26.3) | 138.0 (3.2) | 6.1 | 110.3 (1.9) | 18.8 (0.6) | 18.4 | 976.8 (17.0) | 214.9 (5.1) | 25.3 | 411.1 (4.4) | 45.6 (1.6) | 12.6 | 1707.1 (20.5) | 179.2 (4.0) | 11.6 |
| Asturias | 2292.6 (26.6) | 170.3 (3.3) | 8.2 | 114.1 (1.9) | 22.3 (0.6) | 21.6 | 1040.4 (17.2) | 294.3 (5.2) | 33.3 | 393.6 (4.5) | 47.0 (1.6) | 13.0 | 1659.2 (20.8) | 224.8 (4.1) | 15.1 |
| Italy | |||||||||||||||
| Ragusa | 2284.5 (40.6) | 81.1 (5.0) | 3.7 | 93.8 (3.0) | 15.1 (0.9) | 16.2 | 752.0 (26.3) | 76.5 (7.9) | 12.2 | 370.3 (6.8) | 30.0 (2.5) | 9.2 | 1358.7 (31.7) | 75.1 (6.2) | 6.2 |
| Naples | 2214.5 (35.6) | 99.1 (4.4) | 5 | 91.6 (2.6) | 17.7 (0.8) | 22.0 | 852.0 (23.0) | 137.1 (6.9) | 23.8 | 316.1 (6.0) | 43.0 (2.2) | 16.2 | 1394.2 (27.7) | 122.9 (5.4) | 12.1 |
| Florence | 2183.1 (21.9) | 88.9 (2.7) | 4.4 | 89.6 (1.6) | 12.8 (0.5) | 15.6 | 798.1 (14.1) | 134.2 (4.3) | 23.8 | 328.2 (3.7) | 38.5 (1.4) | 13.4 | 1374.1 (17.0) | 122.0 (3.3) | 10.8 |
| Turin | 2202.3 (21.7) | 99.5 (2.7) | 4.7 | 103.0 (1.6) | 17.7 (0.5) | 17.4 | 866.6 (14.0) | 95.7 (4.2) | 15.4 | 335.0 (3.6) | 34.7 (1.3) | 11.6 | 1349.4 (16.9) | 92.3 (3.3) | 7.9 |
| Varese | 2274.7 (21.2) | 138.6 (2.6) | 6.6 | 104.3 (1.5) | 22.3 (0.4) | 23.2 | 877.6 (13.7) | 152.2 (4.1) | 24.3 | 322.7 (3.6) | 44.0 (1.3) | 16.0 | 1413.2 (16.5) | 138.8 (3.2) | 11.8 |
| France | |||||||||||||||
| South Coast | 2316.0 (28.8) | 78.7 (3.5) | 3.7 | 99.9 (2.1) | 10.3 (0.6) | 10.9 | 1037.1 (18.6) | 113.5 (5.6) | 13.7 | 405.6 (4.8) | 96.8 (1.8) | 28.6 | 1500.2 (22.4) | 92.7 (4.4) | 7.4 |
| South | 2271.3 (19.4) | 74.3 (2.4) | 3.3 | 103.1 (1.4) | 9.8 (0.4) | 9.6 | 956.5 (12.5) | 106.4 (3.8) | 13.9 | 395.5 (3.2) | 101.3 (1.2) | 30.3 | 1450.6 (15.1) | 88.2 (3.0) | 7 |
| Northeast | 2338.5 (16.3) | 70.3 (2.0) | 3.1 | 104.9 (1.2) | 9.0 (0.3) | 8.6 | 969.8 (10.5) | 97.8 (3.2) | 12.0 | 414.2 (2.7) | 112.9 (1.0) | 32.7 | 1470.8 (12.7) | 81.2 (2.5) | 6.1 |
| Northwest | 2297.5 (28.5) | 69.4 (3.5) | 3.0 | 100.8 (2.1) | 8.3 (0.6) | 7.9 | 917.4 (18.5) | 87.0 (5.6) | 11.2 | 439.9 (4.8) | 135.1 (1.8) | 35.4 | 1461.5 (22.3) | 76.1 (4.4) | 5.6 |
| Germany | |||||||||||||||
| Heidelberg | 2154.1 (15.5) | 79.7 (1.9) | 3.9 | 102.2 (1.1) | 10.1 (0.3) | 10.1 | 1005.8 (10.1) | 104.9 (3.0) | 13.0 | 430.1 (2.6) | 48.9 (1.0) | 12.9 | 1332.6 (12.1) | 74.5 (2.4) | 6.4 |
| Potsdam | 2186.7 (14.8) | 54.4 (1.8) | 2.7 | 116.0 (1.1) | 6.1 (0.3) | 5.8 | 858.2 (9.6) | 47.2 (2.9) | 7.2 | 392.9 (2.5) | 40.0 (0.9) | 11.4 | 1275.3 (11.6) | 33.2 (2.3) | 3.1 |
| The Netherlands | |||||||||||||||
| Bilthoven | 2224.9 (15.8) | 99.4 (1.9) | 4.4 | 119.2 (1.2) | 18.3 (0.3) | 13.6 | 968.0 (10.3) | 111.4 (3.1) | 15.0 | 353.0 (2.7) | 47.0 (1.0) | 15.3 | 1562.0 (12.4) | 71.0 (2.4) | 5.2 |
| Utrecht | 2254.6 (17.4) | 70.2 (2.1) | 3.1 | 120.4 (1.3) | 10.7 (0.4) | 8.8 | 1124.2 (11.3) | 123.8 (3.4) | 13.9 | 363.4 (2.9) | 44.2 (1.1) | 13.4 | 1644.3 (13.6) | 74.8 (2.7) | 4.8 |
| United Kingdom | |||||||||||||||
| General population | 2039.6 (22.7) | 103.7 (2.8) | 5.3 | 113.4 (1.7) | 13.8 (0.5) | 12.1 | 987.7 (14.7) | 163.4 (4.4) | 19.7 | 321.0 (3.8) | 51.3 (1.4) | 17.9 | 1407.5 (17.7) | 157.2 (3.5) | 12.5 |
| Health-conscious | 2070.1 (40.3) | 68.8 (5.0) | 3.4 | 117.3 (2.9) | 7.2 (0.9) | 6.3 | 887.0 (26.1) | 104.0 (7.9) | 14.7 | 396.3 (6.8) | 39.1 (2.5) | 11.2 | 1314.8 (31.4) | 60.5 (6.2) | 5.3 |
| Denmark | |||||||||||||||
| Copenhagen | 2235.4 (13.7) | 49.3 (1.7) | 2.3 | 99.5 (1.0) | 6.0 (0.3) | 5.0 | 960.0 (8.8) | 43.7 (2.7) | 6.1 | 365.1 (2.3) | 49.9 (0.8) | 15.3 | 1555.3 (10.6) | 38.2 (2.1) | 2.8 |
| Aarhus | 2383.2 (21.7) | 42.9 (2.7) | 2.0 | 105.5 (1.6) | 4.0 (0.5) | 3.6 | 1050.4 (14.0) | 38.3 (4.2) | 4.8 | 384.1 (3.6) | 56.7 (1.3) | 16.0 | 1632.9 (16.9) | 34.5 (3.3) | 2.4 |
| Sweden | |||||||||||||||
| Malmö | 2039.6 (13.2) | 50.2 (1.6) | 2.6 | 96.0 (1.0) | 6.2 (0.3) | 6.4 | 869.4 (8.5) | 45.4 (2.6) | 7.4 | 304.8 (2.2) | 39.3 (0.8) | 14.7 | 1300.2 (10.3) | 33.2 (2.0) | 2.9 |
| Umeå | 2131.0 (13.3) | 41.0 (1.6) | 2.0 | 102.3 (1.0) | 5.6 (0.3) | 5.5 | 989.9 (8.6) | 39.8 (2.6) | 5.3 | 323.8 (2.2) | 36.2 (0.8) | 12.5 | 1417.0 (10.4) | 30.0 (2.0) | 2.4 |
| Norway | |||||||||||||||
| South and East | 2092.8 (23.2) | 29.2 (2.9) | 1.2 | 99.3 (1.7) | 2.9 (0.5) | 2.7 | 814.7 (15.0) | 33.9 (4.5) | 5.5 | 363.3 (3.9) | 40.6 (1.4) | 12.7 | 1482.3 (18.1) | 26.4 (3.5) | 1.6 |
| North and West | 2075.5 (25.8) | 29.0 (3.2) | 1.3 | 100.4 (1.9) | 2.8 (0.5) | 2.5 | 815.2 (16.7) | 29.4 (5.8) | 3.3 | 364.0 (4.3) | 41.3 (1.8) | 9.4 | 1487.4 (20.1) | 22.0 (4.5) | 1.6 |
© 2018 by the authors. Licensee MDPI, Basel, Switzerland. This article is an open access article distributed under the terms and conditions of the Creative Commons Attribution (CC BY) license (http://creativecommons.org/licenses/by/4.0/).
Share and Cite
Landais, E.; Moskal, A.; Mullee, A.; Nicolas, G.; Gunter, M.J.; Huybrechts, I.; Overvad, K.; Roswall, N.; Affret, A.; Fagherazzi, G.; et al. Coffee and Tea Consumption and the Contribution of Their Added Ingredients to Total Energy and Nutrient Intakes in 10 European Countries: Benchmark Data from the Late 1990s. Nutrients 2018, 10, 725. https://doi.org/10.3390/nu10060725
Landais E, Moskal A, Mullee A, Nicolas G, Gunter MJ, Huybrechts I, Overvad K, Roswall N, Affret A, Fagherazzi G, et al. Coffee and Tea Consumption and the Contribution of Their Added Ingredients to Total Energy and Nutrient Intakes in 10 European Countries: Benchmark Data from the Late 1990s. Nutrients. 2018; 10(6):725. https://doi.org/10.3390/nu10060725
Chicago/Turabian StyleLandais, Edwige, Aurélie Moskal, Amy Mullee, Geneviève Nicolas, Marc J. Gunter, Inge Huybrechts, Kim Overvad, Nina Roswall, Aurélie Affret, Guy Fagherazzi, and et al. 2018. "Coffee and Tea Consumption and the Contribution of Their Added Ingredients to Total Energy and Nutrient Intakes in 10 European Countries: Benchmark Data from the Late 1990s" Nutrients 10, no. 6: 725. https://doi.org/10.3390/nu10060725