Article

Genome-Wide Association Study (GWAS) on Bilirubin Concentrations in Subjects with Metabolic Syndrome: Sex-Specific GWAS Analysis and Gene-Diet Interactions in a Mediterranean Population

by
Oscar Coltell
1,2,
Eva M. Asensio
2,3,
José V. Sorlí
2,3,
Rocio Barragán
2,3,
Rebeca Fernández-Carrión
2,3,
Olga Portolés
2,3,
Carolina Ortega-Azorín
2,3,
Raul Martínez-LaCruz
2,3,
José I. González
2,3,
Vicente Zanón-Moreno
4,5,6,
Ignacio Gimenez-Alba
3,
Montserrat Fitó
2,7,
Emilio Ros
2,8,
Jose M. Ordovas
9,10,11 and
Dolores Corella
2,3,*
1
Department of Computer Languages and Systems, Universitat Jaume I, 12071 Castellón, Spain
2
CIBER Fisiopatología de la Obesidad y Nutrición, Instituto de Salud Carlos III, 28029 Madrid, Spain
3
Department of Preventive Medicine and Public Health, School of Medicine, University of Valencia, 46010 Valencia, Spain
4
Area of Health Sciences, Valencian International University, 46002 Valencia, Spain
5
Red Temática de Investigación Cooperativa OftaRed, Instituto de Salud Carlos III, 28029 Madrid, Spain
6
Ophthalmology Research Unit “Santiago Grisolia”, Dr. Peset University Hospital, 46017 Valencia, Spain
7
Instituto Hospital del Mar de Investigaciones Médicas, 08003 Barcelona, Spain
8
Lipid Clinic, Endocrinology and Nutrition Service, Institut d’Investigacions Biomèdiques August Pi Sunyer (IDIBAPS), Hospital Clínic, University of Barcelona, 08036 Barcelona, Spain
9
Nutrition and Genomics Laboratory, JM-USDA Human Nutrition Research Center on Aging at Tufts University, Boston, MA 02111, USA
10
Department of Cardiovascular Epidemiology and Population Genetics, Centro Nacional de Investigaciones Cardiovasculares (CNIC), 28029 Madrid, Spain
11
IMDEA Alimentación, 28049 Madrid, Spain
*
Author to whom correspondence should be addressed.
Nutrients 2019, 11(1), 90; https://doi.org/10.3390/nu11010090
Submission received: 10 December 2018 / Revised: 27 December 2018 / Accepted: 27 December 2018 / Published: 4 January 2019
(This article belongs to the Special Issue Gene-Diet Interactions)

Abstract

:
Although, for decades, increased serum bilirubin concentrations were considered a threatening sign of underlying liver disease and had been associated with neonatal jaundice, data from recent years show that bilirubin is a powerful antioxidant and suggest that slightly increased serum bilirubin concentrations are protective against oxidative stress-related diseases, such as cardiovascular diseases. Therefore, a better understanding of the gene-diet interactions in determining serum bilirubin concentrations is needed. None of the previous genome-wide association studies (GWAS) on bilirubin concentrations has been stratified by sex. Therefore, considering the increasing interest in incorporating the gender perspective into nutritional genomics, our main aim was to carry out a GWAS on total serum bilirubin concentrations in a Mediterranean population with metabolic syndrome, stratified by sex. Our secondary aim was to explore, as a pilot study, the presence of gene-diet interactions at the GWAS level. We included 430 participants (188 men and 242 women, aged 55–75 years, and with metabolic syndrome) in the PREDIMED Plus-Valencia study. Global and sex-specific GWAS were undertaken to analyze associations and gene-diet interaction on total serum bilirubin. Adherence (low and high) to the Mediterranean diet (MedDiet) was analyzed as the dietary modulator. In the GWAS, we detected more than 55 SNPs associated with serum bilirubin at p < 5 × 10⁻⁸ (GWAS level). The top-ranked were four SNPs (rs4148325 (p = 9.25 × 10⁻²⁴), rs4148324 (p = 9.48 × 10⁻²⁴), rs6742078 (p = 1.29 × 10⁻²³), rs887829 (p = 1.39 × 10⁻²³), and the rs4148324 (p = 9.48 × 10⁻²⁴)) in the UGT1A1 (UDP glucuronosyltransferase family 1 member A1) gene, which replicated previous findings revealing the UGT1A1 as the major locus. In the sex-specific GWAS, the top-ranked SNPs at the GWAS level were similar in men and women (the lead SNP was the rs4148324-UGT1A1 in both men (p = 4.77 × 10⁻¹¹) and women (p = 2.15 × 10⁻¹⁴), which shows homogeneous genetic results for the major locus. There was more sex-specific heterogeneity for other minor genes associated at the suggestive level of GWAS significance (p < 1 × 10⁻⁵). We did not detect any gene-MedDiet interaction at p < 1 × 10⁻⁵ for the major genetic locus, but we detected some gene-MedDiet interactions with other genes at p < 1 × 10⁻⁵, and even at the GWAS level for the IL17B gene (p = 3.14 × 10⁻⁸). These interaction results, however, should be interpreted with caution due to our small sample size. In conclusion, our study provides new data, with a gender perspective, on genes associated with total serum bilirubin concentrations in men and women, and suggests possible additional modulations by adherence to MedDiet.

1. Introduction

Genome-wide association studies (GWAS) have allowed the discovery of hundreds of single nucleotide polymorphisms (SNPs) associated with cardiometabolic diseases [1]. However, most of these GWAS were undertaken jointly for men and women, and there is very little data on whether there is any heterogeneity per sex in the gene variants revealed by GWAS [2,3,4,5]. Although several phenotypic sex differences in cardiometabolic diseases have been apparent for decades [6], whether they also exist at the genome level, and consequently influence GWAS results and the subsequent gene-diet interaction studies, has often been overlooked. From the Precision Medicine and Precision Nutrition viewpoints, it is imperative to undertake sex-specific GWAS in order to obtain new information on the most relevant genes and gene variants that may be associated either differentially or homogeneously with cardio-metabolic diseases in men and women [7,8,9,10]. Moreover, it has been suggested that the genetic risk scores (GRS) currently used to predict disease and to test gene-diet interactions, may be skewed and not reflect the correct genetic component, given that the SNPs that have been chosen as the most relevant for constructing the GRS have mostly been obtained from global GWAS, when not taking possible sex differences into account [10]. Thus, it is important to generate new sex-specific GWAS and use the sex-associated SNPs to create sex-specific GRS [10]. Moreover, it is now essential to integrate the gender perspective in any studies undertaken and fill the gap in traditional research when not considering the different characteristics of men and women [11,12,13].
Besides carrying out sex-specific GWAS, it is also crucial in nutritional genomics [14] to generate data on genome-wide sex-specific gene-diet interactions. In traditional GWAS, apart from ignoring the influence of sex, gene-environment interactions were also commonly overlooked [15,16]. Thus, few studies analyzing gene-diet interactions at the GWAS level have been published [17,18,19]. This is, among other factors, due to the large sample size generally required. Moreover, there is a scarcity of studies that have analyzed the heterogeneity/homogeneity by sex in gene-diet interactions at the GWAS level, which is a priority for nutritional genomics.
Therefore, we focused our study on the analysis of sex-specific GWAS and the exploration of gene-diet interactions. We selected the serum concentrations of total bilirubin as the central phenotype taking into account that there is a growing interest in it due to its potential protection against cardiovascular disease [20,21,22,23], and mainly, because it is highly heritable [24]. Hence, statistically significant results at the GWAS level can be obtained with a relatively small number of study subjects. Bilirubin is a tetrapyrrole pigment generated when heme oxygenase catalyzes the degradation of heme. This produces biliverdin, which is converted into bilirubin by biliverdin reductase [25]. Bilirubin is further processed in hepatocytes, where unconjugated bilirubin is conjugated by uridine diphosphate-glucuronosyltransferase (UDP-GT) to a water-soluble form for excretion. In subjects with the Gilbert syndrome, the UDP-GT activity is reduced to 30% of the normal option, which results in hyperbilirubinemia [26]. Several polymorphisms in the UDP-GT family 1 member A1 (UGT1A1) gene, on chromosome 2, have been associated with Gilbert’s syndrome, but the most common one is a TATA box polymorphism (rs8175347), consisting of a (TA)5–7 repeat within the UGT1A1 promoter designated UGT1A1*28 [27]. In general, Gilbert’s syndrome is a benign form of unconjugated hyperbilirubinemia [25,26]. However, for other conditions such as liver disease, neonatal jaundice, and kernicterus, it is well known that increased serum bilirubin concentrations are pathological [28,29,30]. Despite its historical association with toxicity, recently bilirubin has been recognized as a powerful antioxidant and anti-inflammatory protective molecule [31,32,33], which is gaining more attention due to its pleiotropic protective effects against several diseases associated with increased oxidative stress [20,31,33]. Thus, for this paradoxical compound, a protective, mainly U-shaped relationship has been reported for the incidence of diabetic retinopathy [34], diabetic kidney disease [35], cardiovascular diseases [20,23,36], cardiovascular and total death [21,37], diabetes [38,39], carotid atherosclerosis [40,41], and kidney disease [42,43] among others [22,44]. Furthermore, recent findings have shown that bilirubin is a novel signaling molecule capable of binding to peroxisome proliferator-activated receptor-alpha PPARα. This direct binding activates the transcriptional activity of PPARα, this is a novel and potentially important function of bilirubin in addition to its antioxidant role. This function may mediate the protection from adiposity provided by moderate increases in bilirubin [45,46].
Despite the well-known sex differences in total serum bilirubin concentrations, which are higher in males than in females [47,48,49], there is still limited information regarding its inverse association with cardiovascular risk in women [20,34,35], and has been suggested that its antioxidant protective effect may be higher in males than in females [48]. Therefore, more studies analyzing bilirubin-related factors by sex are needed. Although some previous GWAS on bilirubin concentrations have been carried out [49,50,51,52,53,54,55,56,57], none has analyzed sex-specific effects, and this information is lacking. Likewise, none of the previous GWAS has investigated gene-diet interactions on bilirubin concentrations. Hence, our aims are: (1) to undertake a GWAS for total serum bilirubin concentrations in a Mediterranean population with a metabolic syndrome to detect the specific genes of that population, including a sex-specific GWAS. (2) To explore (as a pilot analysis) gene-diet interaction at the GWAS level focusing on the Mediterranean diet (MedDiet) pattern, also takes into account the sex-specific differences.

2. Materials and Methods

2.1. Study Design and Participants

We have carried out a cross-sectional analysis at baseline in participants recruited from the PREDIMED Plus-Valencia study. One of the field centers of the multi-center PREDIMED Plus study, which is an ongoing randomized, primary cardiovascular prevention trial conducted in Spain [58]. A detailed description of the trial is available at http://predimedplus.com/. Baseline data used in this study were obtained from PREDIMED Plus-Valencia participants included in the PREDIMED Plus trial registered at https://doi.org/10.1186/ISRCTN89898870. Eligible participants, recruited from several primary care health facilities in the Valencia field center, were community-dwelling adults (men, 55–75 years, women, 60–75 years) with a body-mass index (BMI) in the overweight or obesity range ((BMI) ≥ 27 and <40 kg/m2) and had at least three components of the metabolic syndrome [58]. In the Valencia field center (located on the eastern Mediterranean coast), the total number of randomized participants included in the PREDIMED Plus trial was 465. In this study, we present the analyses of a specific project of our group in the Valencia field center (currently the only center with genome-wide genotyping data). Here we included all the participants in our center with complete data on total baseline bilirubin concentrations and genome-wide genotyping, in addition to other variables for adjustment (n = 430). These participants did not differ significantly from our entire sample concerning the main variables. Participants provided written informed consent and study protocols and procedures were approved, according to the ethical standards of the Helsinki Declaration and by the Human Research Ethics Committee of Valencia University, Valencia.

2.2. Baseline Anthropometric, Biochemical, and Lifestyle Variables

Anthropometric variables and blood pressure were determined by trained staff and follow the PREDIMED Plus operations protocol [58]. Weight and height were measured with calibrated scales and a wall-mounted stadiometer, respectively. BMI was calculated as the weight in kilograms divided by the height in meters squared. The waist circumference was measured midway between the lowest rib and the iliac crest after normal expiration, using an anthropometric tape. Blood pressure was measured with a validated semi-automatic oscillometer (Omron HEM-705CP, Hoofddorp, The Netherlands) while the participant was in a seated position for 5 min. Blood samples were collected after a 12-h overnight fast. Fasting plasma glucose, total cholesterol, HDL-C, LDL-C, and triglyceride concentrations were measured, as previously described [59]. Standard laboratory analyses were used for the determination of AST and ALT. Serum total bilirubin concentrations were measured using a standardized colorimetric method with the timed-endpoint diazo method with 2,5-dichlorophenyl diazonium.
Type-2 diabetes was defined as previous clinical diagnosis of diabetes, HbA1c levels ≥ 6.5%, or use of anti-diabetic medication [59]. Leisure-time physical activity was assessed using the validated REGICOR questionnaire [60,61], including questions to collect information on the type of activity, frequency (number of days), and duration. The total leisure-time physical activity-related energy expenditure was estimated as the summed product of frequency, duration, and intensity of each activity divided by 30 days/month (MET·min/day). A 17-item screening questionnaire was used for assessing adherence to an energy-restricted Mediterranean diet [62]. Supplemental Table S1 shows the detailed questions included in the 17-item screening questionnaire.

2.3. Genome-Wide Genotyping

Genomic DNA was isolated from blood. The quantity of double-stranded DNA was measured using PicoGreen (Invitrogen Corporation, Carlsbad, CA, USA). High-density genotyping was performed at the University of Valencia using the Infinium OmniExpress-24 v1.2 BeadChip genotyping array (Illumina Inc., San Diego, CA, USA), according to the manufacturer’s protocol with appropriate quality standards. This array captures 713,599 markers. Allele detection and genotype calling were performed in the GenomeStudio genotyping module (Illumina, Inc., San Diego, CA, USA). Data cleaning was performed using standard analysis pipelines implemented in the Phyton programing language using the Numpy library modules combined with the PLINK [63,64]. From the initial full set, those SNPs not mapped on autosomal chromosomes were filtered out. In addition, SNPs with a minor allele frequency (MAF) < 0.01 or those that deviated from expected Hardy-Weinberg equilibrium (p < 1.0 × 10⁻⁵) were removed. A total of 622,468 SNPs that passed the quality filter remained for further analysis.

2.4. Statistical Analysis

Chi-square tests were used to compare proportions. Student t-tests and ANOVA tests were applied to compare crude means of continuous variables. Triglyceride concentrations were log-transformed for the statistical analyses. We analyzed the association using both crude models and adjusted multivariate regression models including potential confounders. When indicated, models were sequentially adjusted as follows: model 1, unadjusted, model 2, adjusted for age and sex, model 3, additionally adjusted for type-2 diabetes, smoking, physical activity, and medications (lipid-lowering drugs, antihypertensive drugs, and insulin) and total adherence to MedDiet (17-item score). For the study of interactions between the SNPs and adherence to MedDiet, we categorized baseline adherence to the MedDiet (obtained by the 17-item screening) into two groups based on the sample median (8 points), defining both groups as “Low” adherence to MedDiet (0–8 points), and “High” adherence to MedDiet (9–17 points). General linear models were used for continuous variables. Adjusted means were estimated for the continuous variables from the corresponding multivariate-adjusted models. Analyses were undertaken for the whole population and stratified by sex. Statistical analyses for descriptive and the selected bilirubin associations (not at the GWAS level) were performed with the IBM SPSS Statistics version 23.0, NY. All tests were two-tailed and p values < 0.05 were considered statistically significant for these associations.
For GWAS, genetic association analyses were performed using PLINK v1.9 [63,64]. To evaluate the association of total bilirubin concentrations with each SNP, using PLINK, an additive genetic model was fitted by regressing total bilirubin on genotype dosage (0, 1, or 2 copies of the variant allele). Coefficients for the minor allele were estimated. Unadjusted and adjusted (for sex and age) general linear models were fitted. For the sex-specific GWAS analysis, we carried out the same procedure as for the global GWAS analysis in both men and women strata. In addition to the stratified sex-specific GWAS, we also tested the gene-sex interactions at the GWAS level in the whole population using PLINK GxE tool and showed the statistical significance on the interaction terms gene-sex, as well as the regression coefficients for each stratum. Likewise, the analysis of the gene-diet at the GWAS level was carried out using PLINK and the GxE utility. Adherence to MedDiet as a dichotomous variable was used to test the gene-diet interactions. Stratified analysis of gene-diet interactions by sex was additionally carried out. We used the conventional threshold of p < 5 × 10⁻⁸ (i.e., Bonferroni correction for 1 million tests) for genome-wide statistical significance. Since this threshold is very conservative for a small sample size, SNPs with p-values below 1 × 10⁻⁵ were also considered suggestive of genome-wide significance, and the corresponding results have been shown in some tables and figures for further replication. SNPs were rank-ordered according to the minimum p-value in the genetic models.
We used Haploview (Version 4.2) [65] to create Manhattan plots and to calculate LD, and LD-Link to annotate the proxy of the top SNP, respectively. We used RegulomeDB to annotate SNPs with known and predicted regulatory elements in the intergenic regions of the H. sapiens genome [66]. This database allows the annotation of relevant regulatory elements (DNAase hypersensitivity, binding sites of transcription factors, and promoter regions that have been biochemically characterized to regulation transcription), according to several scores. Score 1 indicates higher functionality than score 2, and so on. Scores 4, 5, and 6 indicate little evidence of functionality. Quantile-quantile plot comparing the expected and observed p-values [67] was performed in the R-statistical environment.

3. Results

The demographic, lifestyle, and clinical characteristics of the study participants at baseline by sex are presented in Table 1. We analyzed 430 subjects, including 242 women and 188 men, aged 65 ± 5 years, which all harbor the metabolic syndrome. Total serum bilirubin concentrations were higher in men than in women, but, in both groups, the mean value of bilirubin concentrations was within normal limits (≤1 mg/dL generally proposed as reference value) [44]. Figure 1 shows adjusted means for total serum bilirubin concentrations in men and women after adjustment for age, diabetes, BMI, medications, smoking, physical activity, and adherence to the MedDiet. Even after this multivariate adjustment, differences in means by sex still differed significantly (0.63 mg/dL in men versus 0.52 mg/dL in women, p = 1.2 × 10⁻⁵). Even though the mean values of serum bilirubin concentrations were low, 12 participants showed values greater than 1 mg/dL, ranging between 1.1 mg/dL and 1.9 mg/dL, and we excluded these individuals for some interaction analysis.

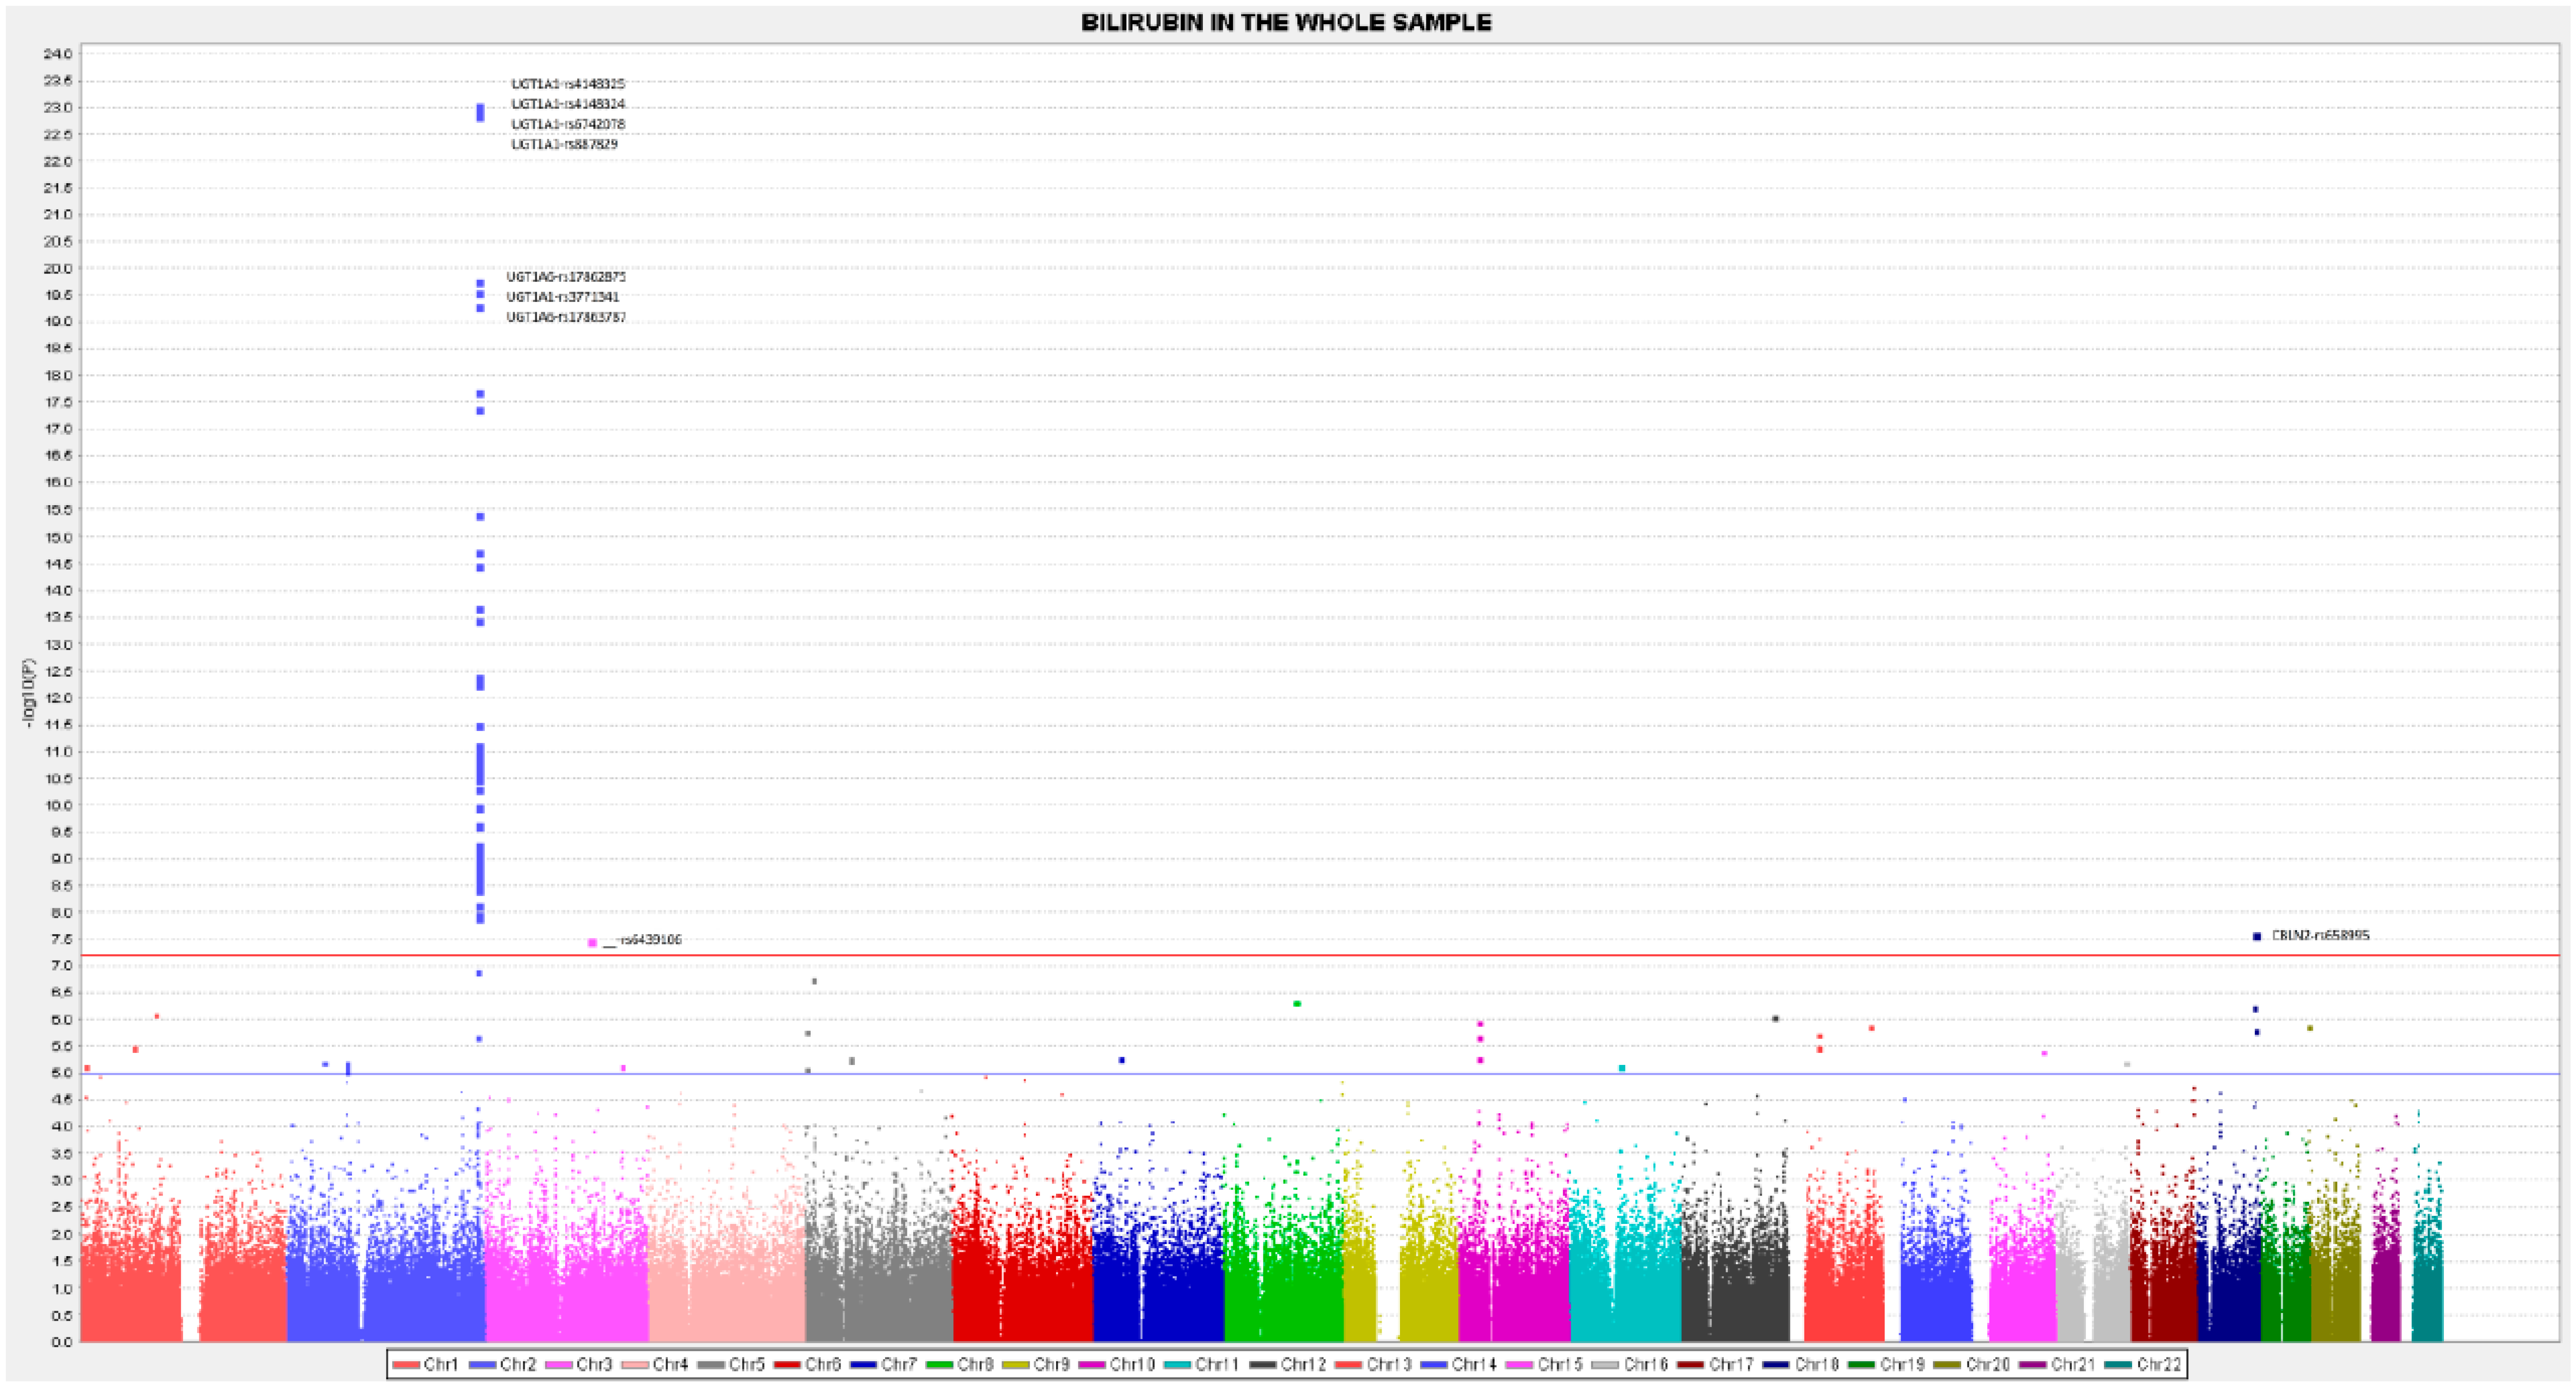
3.1. GWAS Results for Total Serum Bilirubin Concentrations in the Whole Population

Table 2 shows GWAS results for total bilirubin in the whole sample including both men and women. Included in the Table are the 59 top-ranked SNPs with p-values for association with bilirubin concentrations at the genome-wide level (p < 5 × 10⁻⁸) of significance in the crude model and/or in the model adjusted for sex and age. The table also shows the regression coefficient, the determination coefficient, the gene name, the minor allele frequency (MAF), and the annotation of relevant regulatory elements, according to RegulomeDB [66]. Scores 1 (a, b, c, d, e, f), 2 (a, b, c), and 3 (a, b) from the RegulomeDB show the predicted functionality of the corresponding SNPs, which are indicated. Scores 4, 5, and 6 indicate little evidence of functionality, which is why they have not been highlighted. As expected, the GWAS carried out in this Mediterranean population revealed the UGT1A gene cluster, located at chromosome 2q37.1, to be the locus most significantly associated with bilirubin concentrations at the GWAS level, which indicates the robustness of our findings. The UGT1A cluster includes nine highly similar protein-coding (UGT1A1, UGT1A3, UGT1A4, UGT1A5, UGT1A6, UGT1A7, UGT1A8, UGT1A9, and UGT1A10) and four non-coding genes, each with a unique alternative first exon followed by a set of common exons 2–5 [68] (Supplemental Figure S1). Each of the UGT1 variable exons is alternatively spliced to the common set of constant exons to produce different mRNA. The top-ranked SNP in our study was the rs4148325-UGT1A1 SNP, with a p-value of 9.25 × 10⁻²⁴, after adjustment for sex and age. Similar results were obtained for three other SNPs (rs6742078-UGT1A1, rs887829-UGT1A1, rs4148324-UGT1A1) in the proximal promoter region and intron 1, which is physically close to the well-known UGT1A1*28 TATA box polymorphism (rs8175347). The four top-ranked SNPs (rs4148325-UGT1A1, rs6742078-UGT1A1, rs887829-UGT1A1, and rs4148324-UGT1A). All of these showed similar significant signals with nearly identical regression coefficients (0.149, 0.148, 0.148, and 0.147 mg/dL increase in bilirubin concentrations per variant allele), which were in nearly perfect LD in our study (r2 of the rs4148325-UGT1A1 with the s6742078-UGT1A1, rs887829-UGT1A1, and the rs4148324-UGT1A, were: 1, 1, and 0.995, respectively), and in the HapMap CEU population (r2 = 1.0). These four top-ranked SNPs accounted for approximately 17.4%, 17.3%, 17.1%, and 17.0%, respectively, of the variation in total serum bilirubin levels. Our results for these SNPs were in complete agreement with those reported in the Framingham Heart Study (FHS), the Rotterdam Study (RS), and the Age, Gene, Environment, and Susceptibility-Reykjavik Study (AGES-Reykjavik) [50], which show a remarkable consistency.
Apart from the top-ranked SNPs situated in the UGT1A1 gene, we also detected other relevant SNPs at the GWAS level situated in the UGT1A6, UGT1A10, and UGT1A8 genes. Most of these SNPs are found to be in high LD with the lead GWAS SNP rs4148325-UGT1A1. Therefore, they could not be included as independent SNPs in building the GRS for predicting serum bilirubin concentrations, given that the independence criteria for including SNPs in a GRS is considered to have an r2 < 0.2 with the lead SNP. Supplemental Table S2 presents the LD (r2) between the lead GWAS SNP rs4148325-UGT1A1 and the other SNPs situated in the cluster of chromosome 2. Figure 2 represents the position of the polymorphisms and their pairwise LD analysis for the entire list of the top-ranked SNPs in the UGT1 cluster. Besides the UGT1A cluster, we have detected a significant association with an intergenic SNP, which is also situated in chromosome 2, the rs2741012 (p = 3.22 × 10⁻¹¹, in the sex and age-adjusted model). Figure 3 represents the Manhattan plot of the GWAS for total bilirubin in the whole population, and Supplemental Figure S2, the corresponding Q-Q plot. Additionally, in chromosome 2, we have detected a statistically significant association with two SNPs of the MROH2A (Maestro Heat Like Repeat Family Member 2A) gene, which has previously been associated with high bilirubin concentrations in various GWAS carried out in other populations [50,51,52,53,54]. The percentage of explained variability for this gene (6.8%) is lower than for those of the UGT1A gene. Additionally, at the GWAS-significance level, we have observed an association of bilirubin concentrations with SNPs in the CBLN2 gene (cerebellin 2 precursor). This gene, situated on chromosome 18, has not previously been reported by other GWAS and could represent a more specific association of the characteristics of this Mediterranean population with metabolic syndrome.

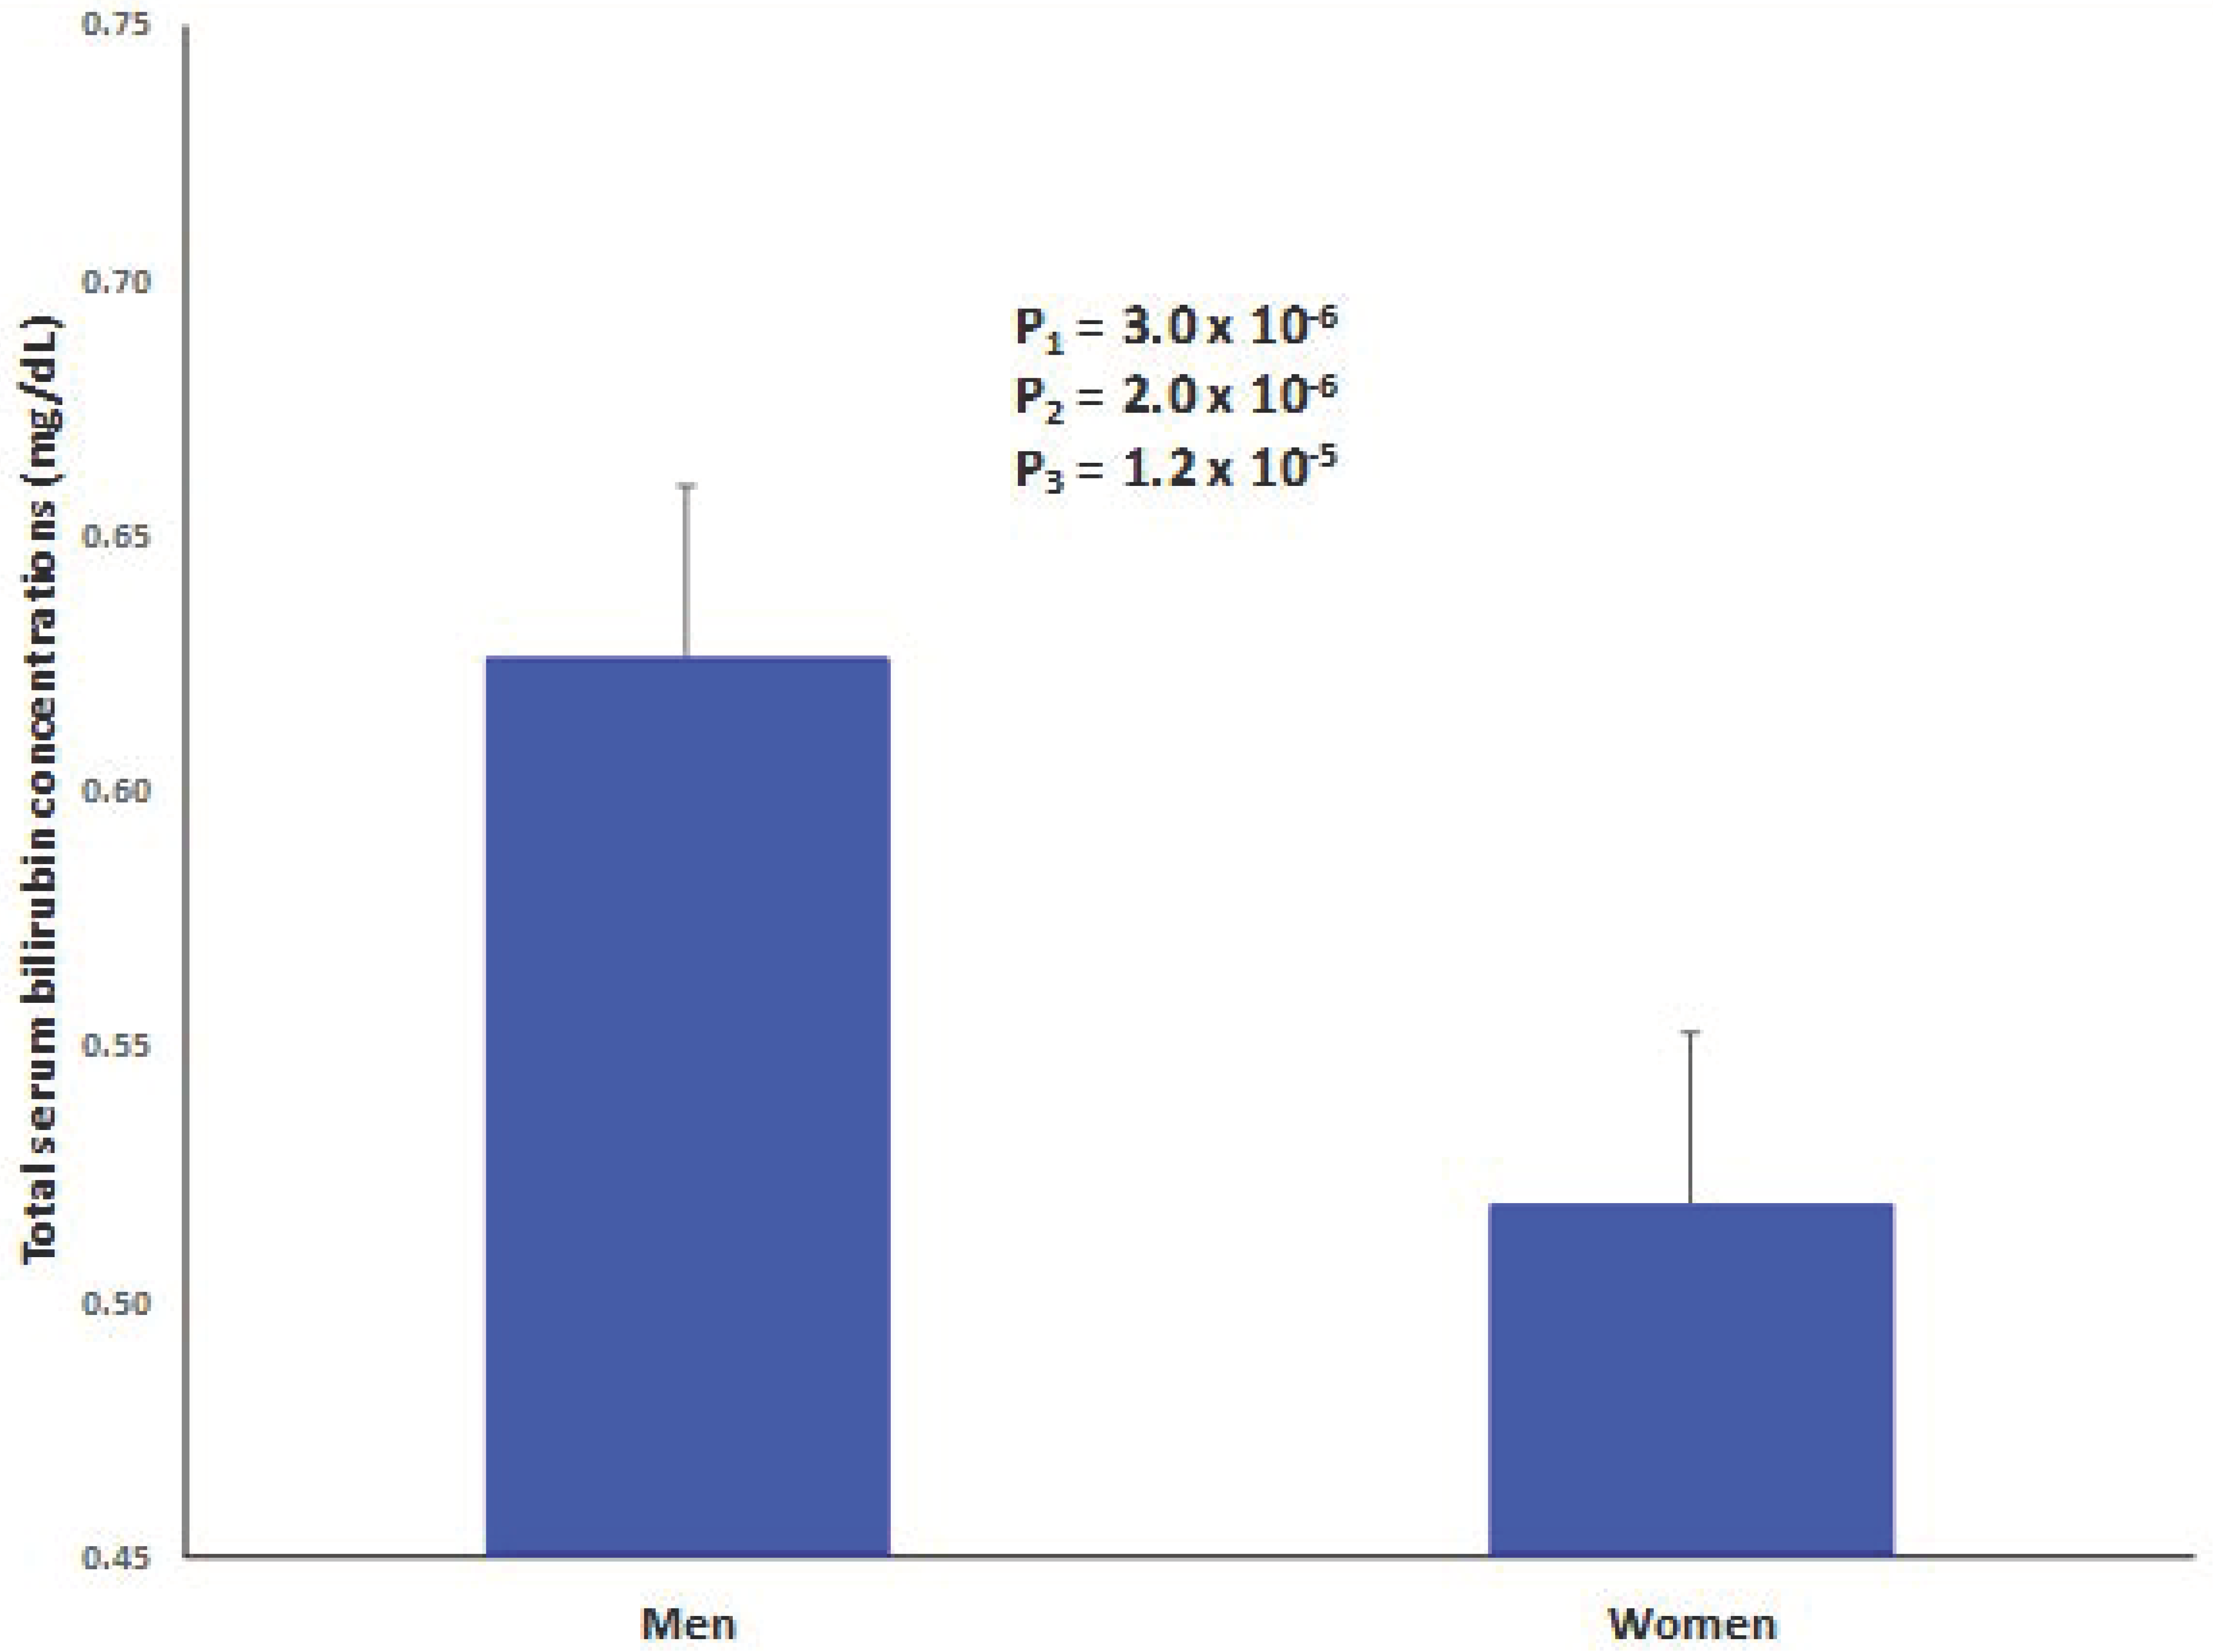
3.2. Sex-Specific GWAS Results for Total Serum Bilirubin Concentrations in Men and Women

In the stratified GWAS analysis for men and women separately, we have also obtained statistically significant associations at the GWAS level. These statistically significant associations at p < 5 × 10⁻⁸ are presented in Table 3 and Table 4 for men and women, respectively. Bearing in mind that, on reducing the sample size when stratifying for sex, statistical power can be lost and that it would be interesting to know more SNPs that may be associated differentially with bilirubin concentrations in men and women, on the suggestive level of genome-wide significance (p < 1 × 10⁻⁵), Supplemental Tables S3 and S4 present the complete list of top-ranking SNPs for men and women, respectively, from the lead top-ranked SNP to the SNPs with p < 1 × 10⁻⁵. Supplemental Figure S3 shows the Manhattan plots for the sex-specific GWAS in men (A) and women (B). Supplemental Figure S4 shows the corresponding Q-Q plots for the GWAS results in men (A) and women (B). It can be observed that there is an excellent homogeneity in the top-ranked SNPs detected at a GWAS level, both in men and women. In both sexes, the lead GWAS SNP was the rs4148324-UGT1A, which obtained a p value, adjusted for age, of 4.77 × 10⁻¹¹ in men and 2.15 × 10⁻¹⁴ in women. This SNP forms part of the cluster of the four top-ranked SNPs (rs4148325-UGT1A1, rs6742078-UGT1A1, rs887829-UGT1A1, rs4148324-UGT1A), detected for the whole population. For the following SNPs, the order in the list changes a little depending on significance, but the results are similar for the cluster UGTA1. As the newest result, we should point out that, in women, we detected the SNP rs359935, situated in chromosome 1 (intergenic), as statistically significant at the GWAS level (p = 2.17 × 10⁻⁸), which, as far as we know, is the first time that this has been reported.
Where most heterogeneity exists between men and women is in the SNPs situated in the zone of associations at the suggestive level of genome-wide significance (p < 1 × 10⁻⁵), where we should mention the ASIC2 (acid-sensing ion channel subunit 2), CBLN2, TLL1 (tolloid like 1), ARHGEF38 (Rho Guanine Nucleotide Exchange Factor 38), and SSBP3 (Single-Stranded DNA Binding Protein 3) genes that are detected in men, but not in women. In women, however, we detected associations with the ROM1 (Retinal Outer Segment Membrane Protein 1) and KANK1 (KN Motif and Ankyrin Repeat Domains 1) genes, which do not appear on the list of top-ranked genes in men. These results are reported for the first time and require replication in other studies to confirm their differential significance.
In our study, apart from the sex-specific GWAS, we also analyzed data at the GWAS level including the interactions between sex and each SNP determining serum bilirubin concentrations. Supplemental Table S5 presents the top-ranked SNPs, depending on statistical significance, of the gene-sex interaction term, as well as the values of the regression coefficient on each of the strata (men and women). In line with the homogeneity observed in the stratified analysis, none of the top-ranked SNPs in the cluster of chromosome 2 presents heterogeneity per sex. In general, no statistically significant gene-sex interaction term was obtained at the GWAS level. The first SNP to reach the lower statistical significance of the interaction term (p = 1.14 × 10⁻⁷) is the rs16885705, situated in chromosome 6 (intergenic). The minor allele increases bilirubin concentrations in women, with little effects in men. The next SNP in statistical significance of the interaction term (p = 4.8 × 10⁻⁷) is the rs10484092 in chromosome 14, situated in the FRMD6-AS2 (FRMD6 Antisense RNA 2) gene. Contrary to the previous SNP, the minor allele is associated with higher bilirubin concentrations in men, but not in women.

3.3. Gene-Diet Interactions at the GWAS Level in the Whole Population and Sex-Specific Results

As indicated in the Methods section, as the overall diet measurement variable, we analyzed adherence to the MedDiet through a 17-item score. For the analysis of gene-diet interactions, we used the dichotomous variable: high adherence and low adherence. In the gene-diet interaction analyses, we excluded the 12 subjects with serum bilirubin ≥1.1. Table 5 shows the top-ranked SNPs analyzed at the GWAS level and in order of the statistical significance of the gene-MedDiet interaction term in the whole sample.
Only one SNP (rs6887452), located in chromosome 5, reached the statistical significance at this level (p = 3.14 × 10⁻⁸). This SNP is located in the IL17B (Interleukin 17B) gene. The minor allele of this SNP would increase bilirubin concentrations (B = 0.045 mg/dL per minor allele) with low MedDiet adherence while, with high adherence to the MedDiet, the minor allele of this SNPs would be associated with a small decrease of serum bilirubin (B = −0.087 mg/dL). This gene-diet interaction was consistently observed after adjustment for age, diabetes, BMI, smoking, medications, and physical activity. Other SNPs also presented gene-diet interactions in the whole population at p < 1 × 10⁻⁵, including some intergenic variants and variants in the LAMA2 (laminin subunit alpha 2) and EDNRA (Endothelin Receptor Type A) genes. The effect of the minor allele in each dietary strata is detailed in Table 5. There is some heterogeneity on the increasing or decreasing effect of the MedDiet adherence depending on the SNPs analyzed, which suggests the further analysis of diet-specific GRS.
In the sex-specific gene-diet interaction analysis, we detected no SNP reaching the statistical significance at the GWAS level for the interaction term, although one should consider that our sample size is small. However, both for men and women, we detected several SNPs interacting with MedDiet at p < 1 × 10⁻⁵. Supplemental Table S6 shows the top-ranked SNPs for gene-diet interactions in men and Supplemental Table S7 shows the results for women. In this sex-specific analysis, the top-ranked SNPs were heterogeneous for men and women. In men, we detected 3 SNPs, including one in the GRAMD1B (GRAM Domain Containing 1B) gene, which shows opposite effects of the minor allele on serum bilirubin concentrations depending on the adherence to the MedDiet. For women, we detected 16 interacting SNPs at p < 1 × 10⁻⁵ with most of them located in chromosome 10 (intergenic). Other annotated genes were NAT1 (N-Acetyltransferase 1) and PTPRT (Protein Tyrosine Phosphatase, Receptor Type T). Again, the effect of the minor allele of the interacting genes on serum bilirubin concentrations depends on the level of the adherence to the MedDiet, and is heterogeneous depending on the SNP, which adds complexity to the global picture and supports the need for research on diet-specific GRS in addition to the sex-specific analysis.

4. Discussion

In this GWAS analysis from a Mediterranean population (composed of European Caucasian subjects) with metabolic syndrome, we confirmed the substantial contribution of the UGT1 gene cluster (chromosome 2) on total serum bilirubin concentrations. Our results at the GWAS level were practically identical to those obtained by other GWAS undertaken in populations of European origin [50,52,54], which shows the high consistency of the results for this major gene. What is more, specifically in the UGT1 gene cluster, the most significant associations at the GWAS level were with 4 SNPs in the UGT1A1. For these SNPs (rs4148325-UGT1A1, rs6742078-UGT1A1, rs887829-UGT1A1, and rs4148324-UGT1A), in nearly perfect LD, located in the promoter region and intron 1, we obtained similar regression coefficients (about 0.148 mg/dL increase in bilirubin concentrations per variant allele) and nearly identical determination coefficients (accounting for 17% of the variation in total serum bilirubin levels), as the values for these parameters reported in the GWAS performed in other European populations, including the FHS, RS, and AGES-Reykjavik studies [50]. Likewise, other GWAS carried out in Chinese [53], Korean [51], or African-American individuals [56], also identified SNPs in the UGT1A1 as the major gene involved in serum bilirubin concentrations. The main differences among populations regarding the major locus are related to the ranking order for the top-ranked SNPs or with their corresponding MAFs. For other minor genes associated with serum bilirubin concentrations, some heterogeneity depending on the population origin that has been reported [50,51,52,53,54]. Thus, the SEMA3C (semaphorin 3C) gene has been detected in GWAS from African-Americans [56] as well as from some European populations [50]. In addition, the associations at the GWAS level with SNPs in other genes of the same cluster, mainly in the UGT1A6 and UGT1A10 genes, are highly significant in our study and, therefore, coincide with previous GWAS [50,51,52,53,54]. However, those studies did not separately analyze men and women. Hence, they do not provide disaggregated data to test the heterogeneity or homogeneity of the genetic influence depending on sex. After many years in which biomedical research studies did not pay attention to the gender perspective [11,13], it is now essential to incorporate the gender perspective or analyze associations in men and women in greater detail in order to uncover the possible similarities or differences [11,12,13]. By carrying out sex-specific GWAS, in our study, we have been able to show that, for the top-ranked SNPs in the major gene determining total serum bilirubin concentrations, there is an excellent homogeneity between men and women. In both sexes, it is the SNPs situated in the UGT1A1 gene, followed by those in the UGT1A6 gene, that are most associated with serum bilirubin concentrations, which emphasizes the great genetic influence of those loci. Nevertheless, although very important, this cluster only explains about 16% to 20% of the variability in bilirubin concentrations. Therefore, other genes in other chromosomes, either with a predominantly genetic influence or through interactions with environmental factors, might contribute to explain another significant percentage of serum bilirubin variability.
In the GWAS analysis for the whole population, we found other SNPs with statistically significant associations at the GWAS level, located in other genes. Outstanding among them is the MROH2A gene that has previously been reported in other GWAS [50,51,52] and which, in our study, explains approximately 6% of the variability of serum bilirubin concentrations. Another gene in our study known as the CBLN2, also presents SNPs associated at the GWAS level. The minor allele of this gene is also associated with higher bilirubin concentrations and would contribute 6% to 7% of the variability. This gene, which may play a role in synaptogenesis induction [69], has been associated with various traits in previous GWAS, including pulmonary arterial hypertension [70] and alcohol consumption [71], but its function is not well known. We did not find any previous GWAS reporting an association with bilirubin concentrations for this SNP. Our association is a particular characteristic of this population (older subjects with metabolic syndrome) or is the result of a false positive. Other GWAS specific for bilirubin have reported associations with other genes such as the SLCO1B1 (solute carrier organic anion transporter family member 1B1) [50,51,52,53]. This function is well known in the metabolism of bilirubin [44]. In our case, we did not detect this gene as being statistically significant at the GWAS level, nor did we find others that functionally are known to participate in the metabolism of bilirubin [44]. This is due to the fact that the contribution in the percentage of explained variability of these genes is lower than those of the UGT1 loci (for example, 1–2% estimated for SLCO1B1) [50,51,52]. Our small sample size does not enable us to detect associations of a lower magnitude than 6% of explained variability as statistically significant at the GWAS level in the whole sample. Thus, to identify new relevant genes, it is necessary to increase the sample size in later studies in Mediterranean populations.
By undertaking the sex-specific GWAS, however, we have been able to show that there is a greater diversity of the genes detected (although our sample size has not allowed us to find associations at the GWAS level, but at the level of suggestive GWAS association (p < 1 × 10⁻⁵)), and that they differ in men and women, which presents a greater heterogeneity that will have to be taken into account if confirmed in later studies. The interest in men is the signal obtained with SNP rs11942650 situated in the TLL1 gene with p = 4.27 × 10⁻⁶, after adjustment for age. This gene has recently been associated with a higher risk of developing hepatocellular carcinoma, probably via hepatic fibrogenesis [72], and its association with that phenotype in patients still in the early stages of the disease could be responsible for the statistically significant signal that we have found in the higher bilirubin concentrations of men in our study. This gene has not been found in women in the corresponding analysis. In contrast, in women, the genes found and associated with serum bilirubin at p < 1 × 10⁻⁵ were ROM1 and KANK1. The ROM1 gene is a member of a photoreceptor-specific gene family and variations in this gene have been associated with retinitis pigmentosa [73]. The possible link between this disease and bilirubin concentrations is unknown. However, for the other gene, KANK1, there may be a stronger relationship, given that deletions in this gene have been associated with cerebral palsy and alterations in neurodevelopment [74] and it is known that, in the case of extreme hyperbilirubinemia in the newborn neurological sequelae can occur, including the Kernicterus Spectrum Disorders [30,75]. However, our data on this level of statistical significance only provide suggestive results for later replication.
Interest in the study of the factors associated with serum bilirubin concentrations has increased recently since there is more evidence of its antioxidant and anti-inflammatory effects [22,31,32,33] and its protective effect (U-shaped) against the incidence of diabetes, kidney disease, cardiovascular disease, other cardiovascular phenotypes, and even mortality [20,21,23,34,35,36,37,38,39,40,41,42,43,44]. Initially, the focus was between the association of high bilirubin concentrations and jaundice in children and other related syndromes (Gilbert, etc.) as well as liver damage in adults [28,29,30,75]. However, even in Gilbert’s syndrome [26], associated with SNPs in the UGT1A1 gene and a mild hyperbilirubinemia, a lower incidence of cardiovascular diseases has been reported [76]. An explanation for this protection may be bilirubin’s ability to inhibit multiple processes that induce platelet hyper-reactivity and thrombosis, which have not been widely recognized until recently [22,31]. Moreover, the protective role of bilirubin has been reported even for subjects with a high range but not exceeding the normal range of values for serum bilirubin concentrations [20,22]. These values are lower than those present in Gilbert’s syndrome [26]. For all those reasons, as well as investigating the central genes involved in the genetic influence, it is also necessary to study the environmental factors that modulate bilirubin concentrations. Several years ago, the “Iatrogenic Gilbert syndrome” was proposed as a strategy for reducing vascular risk by increasing plasma-unconjugated bilirubin by specific medications [77]. Currently, the dietary modulation could provide an alternative approach. Previous studies that analyzed the relationship between diet and serum bilirubin concentrations were mainly aimed at investigating the components of the diet that could contribute to reducing bilirubin concentrations in situations where they were pathologically high [78,79,80].
Nevertheless, current knowledge suggests that, within the normal range, slightly higher serum bilirubin concentrations may have an anti-oxidizing protective effect. Thus, it would be interesting to know whether such concentrations could be slightly increased through dietary intervention, especially in individuals with gene variants associated with genetically lower concentrations. In our study, we have focused on analyzing gene-diet interactions, concentrating on adherence to the MedDiet as the primary variable, and looking at both increasing and decreasing effects depending on the SNP and the level of adherence to the MedDiet. Despite the limitations of a small sample size, we have been able to show that, for the main SNPs in the UGT1A1 cluster, there was no statistically significant gene-MedDiet interaction, neither in the whole population or for either men or women, which suggests that it might be difficult to modulate the significant genetic effect of main variants through diet, or at least with adherence to the MedDiet as assessed here. This is necessary to study other more specific dietary components of diet to detect additional interactions with the major bilirubin-related genes. For other gene variants that do not have such a strong genetic contribution in the association GWAS, we did find some statistically significant gene-diet interactions at p < 5 × 10⁻⁵ both for the whole sample and for men and women. For the whole sample, we have obtained a gene-MedDiet interaction on serum bilirubin concentrations at the GWAS level involving the rs6887452 SNP (an upstream variant) in the IL17B gene. The interleukin-17 family of cytokines has emerged as a critical player in inflammatory diseases with the IL-17B being an anti-inflammatory cytokine [81]. According to our results, the minor allele of the rs6887452-IL17B SNP is associated with higher or lower serum bilirubin concentrations depending on adherence to the MedDiet. This is the first time that this and the other sex-specific gene-diet interactions have been reported at the suggestive level of GWAS significance, and we do not fully understand the mechanisms involved. Some could be false positives, and future studies are required to characterize them. Our results provide new data suggesting that, to generate evidence on gene-diet interactions that can be applied to the new precision nutrition [14], sex-specific studies have to be undertaken to characterize whether there are important sex/gender differences because not all the gene variants involved will be homogeneous or heterogeneous per sex.

5. Conclusions

In conclusion, our results in the general GWAS for bilirubin concentrations in subjects with metabolic syndrome from a Mediterranean population are robust and support the great importance of various SNPs in the UGT1A1gene associated with the total serum bilirubin concentrations reported in other studies. These associations with the top-ranked SNPs were homogeneous in men and women in the sex-specific GWAS. However, for other SNPs with a minor genetic contribution, there was more diversity between men and women. The study of gene-diet interactions at the GWAS level, considering adherence to MedDiet, has allowed us to observe some gene-diet interactions at the suggestive level of GWAS significance, both in the whole sample and in men and women. Therefore, this indicates the need for further studies that incorporate the gender perspective in order to obtain more useful results in precision nutrition. Our novel gene-diet interaction results require replication and a more in-depth study in other populations.

Supplementary Materials

The following are available online at https://www.mdpi.com/2072-6643/11/1/90/s1: Table S1: Quantitative 17-item questionnaire for Adherence to Mediterranean diet. Figure S1: Graphic representation of the human UGT1A cluster, indicating the nine protein-coding (UGT1A1, UGT1A3, UGT1A4, UGT1A5, UGT1A6, UGT1A7, UGT1A8, UGT1A9, and UGT1A10) genes and the four non-coding genes (pseudogenes), as well as the process of alternative splicing with a first exon followed by a set of common exons 2–5. Table S2: Linkage disequilibrium parameters between the lead SNP (rs4148325) and the other top-ranked SNPs in chromosome 2 at the GWAS significance level for total bilirubin concentrations in the whole population. Figure S2: Q-Q plot for the GWAS on total serum bilirubin concentrations in the whole population (n = 430). Table S3: GWAS results (at p < 1 × 10⁻⁵) for the association between bilirubin concentrations and the top-ranked SNPs in men. Table S4: GWAS results (at p < 1 × 10⁻⁵) for the association between bilirubin concentrations and the top-ranked SNPs in women. Figure S3: Manhattan plot for the GWAS analysis on total serum bilirubin concentrations in men (A) (n = 188 participants) and women (B) (n = 242 participants) obtained in the genetic additive model adjusted for age, expressed in −log10(p-value). The blue line represents the threshold 1 (−log10(5 × 10⁻⁸)) for the GWAS statistical significance. The red line represents the threshold 2 ((−log10(1 × 10⁻⁵)). Table S5: GWAS results for the interaction term between sex and the top-ranked SNPs (at p < 1 × 10⁻⁵) for bilirubin concentrations in the whole sample. Table S6: GWAS results for the interaction term between the Mediterranean diet adherence and the corresponding SPN (at p < 1 × 10⁻⁵) for bilirubin concentrations in men. Table S7: GWAS results for the interaction term between the Mediterranean diet adherence and the corresponding SPN (at p < 1 × 10⁻⁵) for bilirubin concentrations in women. Figure S4: Q-Q plot for the GWAS on total serum bilirubin concentrations in the men (A) (n = 188) and women (B) (n = 242).

Author Contributions

The authors’ responsibilities were as follows: Conceptualization, O.C., J.V.S., O.P., J.M.O., and D.C. Data curation, R.F.-C., C.O.-A., J.I.G., M.F., and E.R. Formal analysis, O.C., J.V.S., O.P., and D.C. Funding acquisition, O.C., M.F., E.R., and D.C. Investigation, E.M.A., J.V.S., R.B., R.F.-C., O.P., C.O.-A., R.M.-L., J.I.G., I.G.-A., V.Z.-M., M.F., and E.R. Methodology, J.M.O. and D.C. Project administration, O.C., J.I.G., and D.C. Software, O.C. Supervision, J.M.O., J.V.S., and D.C. Writing—original draft, O.C., J.M.O., and D.C. Writing—review & editing, O.C., D.C., J.V.S., E.R., and J.M.O. All authors read and approved the final manuscript.

Funding

This study was partially funded by the Spanish Ministry of Health (Instituto de Salud Carlos III) and the Ministerio de Economía y Competitividad-Fondo Europeo de Desarrollo Regional (FEDER) (grants CIBER 06/03, PRX17/00500, PI16/00366, PI06/1326, and SAF2016–80532-R), the University Jaume I (grants P1–1B2013–54 and COGRUP/2016/06), the Fundació La Marató de TV3 (grant 538/U/2016), the Real Colegio Complutense at Harvard University, the Fundación MAPFRE (grant Ignacio Larramendi 2014), the Rei Jaume I Award for Medical Research 2018, the Generalitat Valenciana (grants PROMETEO2017/017, and AEST/2018/044), and the US Department of Agriculture, Agriculture Research Service (grant 8050–51000-098-00D).

Conflicts of Interest

The authors declare no conflict of interest.

References

  1. Atanasovska, B.; Kumar, V.; Fu, J.; Wijmenga, C.; Hofker, M.H. GWAS as a Driver of Gene Discovery in Cardiometabolic Diseases. Trends Endocrinol. Metab. 2015, 26, 722–732. [Google Scholar] [CrossRef] [PubMed]
  2. Loos, R.J. The genetics of adiposity. Curr. Opin. Genet. Dev. 2018, 50, 86–95. [Google Scholar] [CrossRef] [PubMed]
  3. de los Campos, G.; Vazquez, A.I.; Hsu, S.; Lello, L. Complex-Trait Prediction in the Era of Big Data. Trends Genet. 2018, 34, 746–754. [Google Scholar] [CrossRef] [PubMed]
  4. Hofker, M.H.; Fu, J.; Wijmenga, C. The genome revolution and its role in understanding complex diseases. Biochim. Biophys. Acta 2014, 1842, 1889–1895. [Google Scholar] [CrossRef] [PubMed] [Green Version]
  5. Munroe, P.B.; Tinker, A. Genome-wide association studies and contribution to cardiovascular physiology. Physiol. Genom. 2015, 47, 365–375. [Google Scholar] [CrossRef] [PubMed]
  6. Dearden, L.; Bouret, S.G.; Ozanne, S.E. Sex and gender differences in developmental programming of metabolism. Mol. Metab. 2018, 15, 8–19. [Google Scholar] [CrossRef] [PubMed]
  7. Zeng, Y.; Nie, C.; Min, J.; Chen, H.; Liu, X.; Ye, R.; Chen, Z.; Bai, C.; Xie, E.; Yin, Z.; et al. Sex Differences in Genetic Associations With Longevity. JAMA Netw. Open 2018, 1, e181670. [Google Scholar] [CrossRef]
  8. Gao, C.; Langefeld, C.D.; Ziegler, J.T.; Taylor, K.D.; Norris, J.M.; Chen, Y.-D.I.; Hellwege, J.N.; Guo, X.; Allison, M.A.; Speliotes, E.K.; et al. Genome-Wide Study of Subcutaneous and Visceral Adipose Tissue Reveals Novel Sex-Specific Adiposity Loci in Mexican Americans: Genetics of Adipose Deposition. Obesity 2018, 26, 202–212. [Google Scholar] [CrossRef]
  9. Hartiala, J.A.; Wilson Tang, W.H.; Wang, Z.; Crow, A.L.; Stewart, A.F.R.; Roberts, R.; McPherson, R.; Erdmann, J.; Willenborg, C.; Hazen, S.L.; et al. Genome-wide association study and targeted metabolomics identifies sex-specific association of CPS1 with coronary artery disease. Nat. Commun. 2016, 7. [Google Scholar] [CrossRef]
  10. Byars, S.G.; Inouye, M. Genome-Wide Association Studies and Risk Scores for Coronary Artery Disease: Sex Biases. In Sex-Specific Analysis of Cardiovascular Function; Kerkhof, P.L.M., Miller, V.M., Eds.; Springer International Publishing: Cham, Switzerland, 2018; Volume 1065, pp. 627–642. ISBN 9783319779317. [Google Scholar]
  11. Schiebinger, L.; Stefanick, M.L. Gender Matters in Biological Research and Medical Practice. J. Am. Coll. Cardiol. 2016, 67, 136–138. [Google Scholar] [CrossRef]
  12. Collins, F.S.; Tabak, L.A. Policy: NIH plans to enhance reproducibility. Nature 2014, 505, 612–613. [Google Scholar] [CrossRef] [PubMed] [Green Version]
  13. Clayton, J.A. Studying both sexes: A guiding principle for biomedicine. FASEB J. 2016, 30, 519–524. [Google Scholar] [CrossRef] [PubMed]
  14. Ordovas, J.M.; Ferguson, L.R.; Tai, E.S.; Mathers, J.C. Personalised nutrition and health. BMJ 2018. [Google Scholar] [CrossRef]
  15. Gauderman, W.J.; Zhang, P.; Morrison, J.L.; Lewinger, J.P. Finding Novel Genes by Testing G × E Interactions in a Genome-Wide Association Study: Scanning for G × E Interaction to Find New Genes. Genet. Epidemiol. 2013, 37, 603–613. [Google Scholar] [CrossRef] [PubMed]
  16. Zhang, P.; Lewinger, J.P.; Conti, D.; Morrison, J.L.; Gauderman, W.J. Detecting Gene-Environment Interactions for a Quantitative Trait in a Genome-Wide Association Study: Detecting Gene-Environment Interactions for a Quantitative. Genet. Epidemiol. 2016, 40, 394–403. [Google Scholar] [CrossRef] [PubMed]
  17. Figueiredo, J.C.; Hsu, L.; Hutter, C.M.; Lin, Y.; Campbell, P.T.; Baron, J.A.; Berndt, S.I.; Jiao, S.; Casey, G.; Fortini, B.; et al. Genome-Wide Diet-Gene Interaction Analyses for Risk of Colorectal Cancer. PLoS Genet. 2014, 10, e1004228. [Google Scholar] [CrossRef] [PubMed]
  18. Merino, J.; Dashti, H.S.; Li, S.X.; Sarnowski, C.; Justice, A.E.; Graff, M.; Papoutsakis, C.; Smith, C.E.; Dedoussis, G.V.; Lemaitre, R.N.; et al. Genome-wide meta-analysis of macronutrient intake of 91,114 European ancestry participants from the cohorts for heart and aging research in genomic epidemiology consortium. Mol. Psychiatry 2018. [Google Scholar] [CrossRef]
  19. Smith, C.E.; Follis, J.L.; Dashti, H.S.; Tanaka, T.; Graff, M.; Fretts, A.M.; Kilpeläinen, T.O.; Wojczynski, M.K.; Richardson, K.; Nalls, M.A.; et al. Genome-Wide Interactions with Dairy Intake for Body Mass Index in Adults of European Descent. Mol. Nutr. Food Res. 2018, 62, 1700347. [Google Scholar] [CrossRef]
  20. Marconi, V.C.; Duncan, M.S.; So-Armah, K.; Re, V.L.; Lim, J.K.; Butt, A.A.; Goetz, M.B.; Rodriguez-Barradas, M.C.; Alcorn, C.W.; Lennox, J.; et al. Bilirubin Is Inversely Associated With Cardiovascular Disease Among HIV-Positive and HIV-Negative Individuals in VACS (Veterans Aging Cohort Study). J. Am. Heart Assoc. 2018, 7. [Google Scholar] [CrossRef]
  21. Chen, S.-C.; Lin, C.-P.; Hsu, H.-C.; Shu, J.-H.; Liang, Y.; Hsu, P.-F.; Wang, Y.-J.; Ding, Y.-Z.; Liou, T.-L.; Wang, Y.-W.; et al. Serum bilirubin improves the risk predictions of cardiovascular and total death in diabetic patients. Clin. Chim. Acta 2019, 488, 1–6. [Google Scholar] [CrossRef]
  22. Bulmer, A.C.; Bakrania, B.; Du Toit, E.F.; Boon, A.-C.; Clark, P.J.; Powell, L.W.; Wagner, K.-H.; Headrick, J.P. Bilirubin acts as a multipotent guardian of cardiovascular integrity: More than just a radical idea. Am. J. Physiol.-Heart Circ. Physiol. 2018, 315, H429–H447. [Google Scholar] [CrossRef] [PubMed]
  23. Djoussé, L.; Levy, D.; Cupples, L.A.; Evans, J.C.; D’Agostino, R.B.; Ellison, R.C. Total serum bilirubin and risk of cardiovascular disease in the Framingham offspring study. Am. J. Cardiol. 2001, 87, 1196–1200. [Google Scholar] [CrossRef]
  24. Bathum, L.; Petersen, H.C.; Rosholm, J.U.; Hyltoft Petersen, P.; Vaupel, J.; Christensen, K. Evidence for a substantial genetic influence on biochemical liver function tests: Results from a population-based Danish twin study. Clin. Chem. 2001, 47, 81–87. [Google Scholar] [PubMed]
  25. Ding, B.; Gibbs, P.E.M.; Brookes, P.S.; Maines, M.D. The coordinated increased expression of biliverdin reductase and heme oxygenase-2 promotes cardiomyocyte survival: A reductase-based peptide counters β-adrenergic receptor ligand-mediated cardiac dysfunction. FASEB J. 2011, 25, 301–313. [Google Scholar] [CrossRef] [PubMed]
  26. Fretzayas, A.; Moustaki, M.; Liapi, O.; Karpathios, T. Eponym: Gilbert syndrome. Eur. J. Pediatr. 2012, 171, 11–15. [Google Scholar] [CrossRef] [PubMed]
  27. D’Angelo, R.; Rinaldi, C.; Donato, L.; Nicocia, G.; Sidoti, A. The combination of new missense mutation with (A(TA)7TAA) dinucleotide repeat in UGT1A1 gene promoter causes Gilbert’s syndrome. Ann. Clin. Lab. Sci. 2015, 45, 202–205. [Google Scholar]
  28. Lala, V.; Minter, D.A. Liver Function Tests. In StatPearls; StatPearls Publishing: Treasure Island, FL, USA, 2018. [Google Scholar]
  29. Chen, H.-L.; Wu, S.-H.; Hsu, S.-H.; Liou, B.-Y.; Chen, H.-L.; Chang, M.-H. Jaundice revisited: Recent advances in the diagnosis and treatment of inherited cholestatic liver diseases. J. Biomed. Sci. 2018, 25. [Google Scholar] [CrossRef]
  30. Olusanya, B.O.; Kaplan, M.; Hansen, T.W.R. Neonatal hyperbilirubinaemia: A global perspective. Lancet Child Adolesc. Health 2018, 2, 610–620. [Google Scholar] [CrossRef]
  31. Gazzin, S.; Vitek, L.; Watchko, J.; Shapiro, S.M.; Tiribelli, C. A Novel Perspective on the Biology of Bilirubin in Health and Disease. Trends Mol. Med. 2016, 22, 758–768. [Google Scholar] [CrossRef]
  32. Ziberna, L.; Martelanc, M.; Franko, M.; Passamonti, S. Bilirubin is an Endogenous Antioxidant in Human Vascular Endothelial Cells. Sci. Rep. 2016, 6. [Google Scholar] [CrossRef]
  33. Fujiwara, R.; Haag, M.; Schaeffeler, E.; Nies, A.T.; Zanger, U.M.; Schwab, M. Systemic regulation of bilirubin homeostasis: Potential benefits of hyperbilirubinemia. Hepatology 2018, 67, 1609–1619. [Google Scholar] [CrossRef] [PubMed]
  34. Liu, M.; Wang, J.; He, Y. The U-Shaped Association between Bilirubin and Diabetic Retinopathy Risk: A Five-Year Cohort Based on 5323 Male Diabetic Patients. J. Diabetes Res. 2018, 2018, 1–7. [Google Scholar] [CrossRef] [PubMed]
  35. Liu, M.; Li, J.; Lv, X.; He, Y. Bilirubin and its changes were negatively associated with diabetic kidney disease incidence and progression: A five-year’s cohort study based on 5323 Chinese male diabetic patients. J. Diabetes Its Complicat. 2018, 32, 1012–1017. [Google Scholar] [CrossRef] [PubMed]
  36. Lai, X.; Fang, Q.; Yang, L.; Chen, X.; Wang, H.; Ma, L.; Guo, W.; Liu, M.; Yang, H.; Zhang, C.; et al. Direct, indirect and total bilirubin and risk of incident coronary heart disease in the Dongfeng-Tongji cohort. Ann. Med. 2018, 50, 16–25. [Google Scholar] [CrossRef] [PubMed]
  37. Boon, A.-C.; Bulmer, A.C.; Coombes, J.S.; Fassett, R.G. Circulating bilirubin and defense against kidney disease and cardiovascular mortality: Mechanisms contributing to protection in clinical investigations. Am. J. Physiol.-Ren. Physiol. 2014, 307, F123–F136. [Google Scholar] [CrossRef] [PubMed]
  38. Cheriyath, P.; Gorrepati, V.S.; Peters, I.; Nookala, V.; Murphy, M.E.; Srouji, N.; Fischman, D. High Total Bilirubin as a Protective Factor for Diabetes Mellitus: An Analysis of NHANES Data from 1999–2006. J. Clin. Med. Res. 2010, 2, 201–206. [Google Scholar] [CrossRef]
  39. Benton, M.C.; Lea, R.A.; Macartney-Coxson, D.; Bellis, C.; Carless, M.A.; Curran, J.E.; Hanna, M.; Eccles, D.; Chambers, G.K.; Blangero, J.; et al. Serum bilirubin concentration is modified by UGT1A1 Haplotypes and influences risk of Type-2 diabetes in the Norfolk Island genetic isolate. BMC Genet. 2015, 16. [Google Scholar] [CrossRef]
  40. Tang, L.; Huang, C.; Feng, Y. Serum total bilirubin concentration is associated with carotid atherosclerosis in patients with prehypertension. Clin. Exp. Hypertens. 2018, 1–5. [Google Scholar] [CrossRef]
  41. Amor, A.J.; Ortega, E.; Perea, V.; Cofán, M.; Sala-Vila, A.; Nuñez, I.; Gilabert, R.; Ros, E. Relationship Between Total Serum Bilirubin Levels and Carotid and Femoral Atherosclerosis in Familial DyslipidemiaHighlights. Arterioscler. Thromb. Vasc. Biol. 2017, 37, 2356–2363. [Google Scholar] [CrossRef]
  42. Sundararaghavan, V.L.; Binepal, S.; Stec, D.E.; Sindhwani, P.; Hinds, T.D. Bilirubin, a new therapeutic for kidney transplant? Transplant. Rev. 2018, 32, 234–240. [Google Scholar] [CrossRef]
  43. Uludag, K.; Oguzhan, N.; Arıkan, T.; Boz, G. Serum bilirubin level and its impact on the progression of chronic kidney disease. Int. Urol. Nephrol. 2018, 50, 1695–1701. [Google Scholar] [CrossRef] [PubMed]
  44. Lin, J.-P.; Vitek, L.; Schwertner, H.A. Serum Bilirubin and Genes Controlling Bilirubin Concentrations as Biomarkers for Cardiovascular Disease. Clin. Chem. 2010, 56, 1535–1543. [Google Scholar] [CrossRef] [PubMed] [Green Version]
  45. Stec, D.E.; John, K.; Trabbic, C.J.; Luniwal, A.; Hankins, M.W.; Baum, J.; Hinds, T.D. Bilirubin Binding to PPARα Inhibits Lipid Accumulation. PLoS ONE 2016, 11, e0153427. [Google Scholar] [CrossRef] [PubMed]
  46. Hinds, T.D.; Stec, D.E. Bilirubin, a Cardiometabolic Signaling Molecule. Hypertension 2018, 72, 788–795. [Google Scholar] [CrossRef] [PubMed]
  47. Zhang, X.; Meng, Z.; Li, X.; Liu, M.; Ren, X.; Zhu, M.; He, Q.; Zhang, Q.; Song, K.; Jia, Q.; et al. The association between total bilirubin and serum triglyceride in both sexes in Chinese. Lipids Health Dis. 2018, 17. [Google Scholar] [CrossRef]
  48. Hunt, S.C.; Kronenberg, F.; Eckfeldt, J.H.; Hopkins, P.N.; Myers, R.H.; Heiss, G. Association of plasma bilirubin with coronary heart disease and segregation of bilirubin as a major gene trait: The NHLBI family heart study. Atherosclerosis 2001, 154, 747–754. [Google Scholar] [CrossRef]
  49. Zucker, S.D.; Horn, P.S.; Sherman, K.E. Serum bilirubin levels in the U.S. population: Gender effect and inverse correlation with colorectal cancer. Hepatology 2004, 40, 827–835. [Google Scholar] [CrossRef]
  50. Johnson, A.D.; Kavousi, M.; Smith, A.V.; Chen, M.-H.; Dehghan, A.; Aspelund, T.; Lin, J.-P.; van Duijn, C.M.; Harris, T.B.; Cupples, L.A.; et al. Genome-wide association meta-analysis for total serum bilirubin levels. Hum. Mol. Genet. 2009, 18, 2700–2710. [Google Scholar] [CrossRef] [Green Version]
  51. Kang, T.-W.; Kim, H.-J.; Ju, H.; Kim, J.-H.; Jeon, Y.-J.; Lee, H.-C.; Kim, K.-K.; Kim, J.-W.; Lee, S.; Kim, J.Y.; et al. Genome-wide association of serum bilirubin levels in Korean population. Hum. Mol. Genet. 2010, 19, 3672–3678. [Google Scholar] [CrossRef] [Green Version]
  52. Namjou, B.; Marsolo, K.; Lingren, T.; Ritchie, M.D.; Verma, S.S.; Cobb, B.L.; Perry, C.; Kitchner, T.E.; Brilliant, M.H.; Peissig, P.L.; et al. A GWAS Study on Liver Function Test Using eMERGE Network Participants. PLoS ONE 2015, 10, e0138677. [Google Scholar] [CrossRef]
  53. Dai, X.; Wu, C.; He, Y.; Gui, L.; Zhou, L.; Guo, H.; Yuan, J.; Yang, B.; Li, J.; Deng, Q.; et al. A Genome-Wide Association Study for Serum Bilirubin Levels and Gene-Environment Interaction in a Chinese Population. Genet. Epidemiol. 2013, 37, 293–300. [Google Scholar] [CrossRef] [PubMed]
  54. Bielinski, S.J.; Chai, H.S.; Pathak, J.; Talwalkar, J.A.; Limburg, P.J.; Gullerud, R.E.; Sicotte, H.; Klee, E.W.; Ross, J.L.; Kocher, J.-P.A.; et al. Mayo Genome Consortia: A Genotype-Phenotype Resource for Genome-Wide Association Studies with an Application to the Analysis of Circulating Bilirubin Levels. Mayo Clin. Proc. 2011, 86, 606–614. [Google Scholar] [CrossRef] [PubMed]
  55. Sanna, S.; Busonero, F.; Maschio, A.; McArdle, P.F.; Usala, G.; Dei, M.; Lai, S.; Mulas, A.; Piras, M.G.; Perseu, L.; et al. Common variants in the SLCO1B3 locus are associated with bilirubin levels and unconjugated hyperbilirubinemia. Hum. Mol. Genet. 2009, 18, 2711–2718. [Google Scholar] [CrossRef] [Green Version]
  56. Chen, G.; Ramos, E.; Adeyemo, A.; Shriner, D.; Zhou, J.; Doumatey, A.P.; Huang, H.; Erdos, M.R.; Gerry, N.P.; Herbert, A.; et al. UGT1A1 is a major locus influencing bilirubin levels in African Americans. Eur. J. Hum. Genet. 2012, 20, 463–468. [Google Scholar] [CrossRef] [PubMed]
  57. Nelson, D.; Yoshida, E.M.; Paulson, M.S.; Hengen, P.N.; Ge, D.; Kanwar, B.; McNally, J.; Pang, P.S.; Subramanian, G.M.; McHutchison, J.G.; et al. Genome-wide association study to characterize serum bilirubin elevations in patients with HCV treated with GS-9256, an HCV NS3 serine protease inhibitor. Antivir. Ther. 2014, 19, 679–686. [Google Scholar] [CrossRef] [PubMed]
  58. Martínez-González, M.A.; Buil-Cosiales, P.; Corella, D.; Bulló, M.; Fitó, M.; Vioque, J.; Romaguera, D.; Martínez, J.A.; Wärnberg, J.; López-Miranda, J.; et al. Cohort Profile: Design and methods of the PREDIMED-Plus randomized trial. Int. J. Epidemiol. 2018. [Google Scholar] [CrossRef] [PubMed]
  59. Rosique-Esteban, N.; Díaz-López, A.; Martínez-González, M.A.; Corella, D.; Goday, A.; Martínez, J.A.; Romaguera, D.; Vioque, J.; Arós, F.; Garcia-Rios, A.; et al. Leisure-time physical activity, sedentary behaviors, sleep, and cardiometabolic risk factors at baseline in the PREDIMED-PLUS intervention trial: A cross-sectional analysis. PLoS ONE 2017, 12, e0172253. [Google Scholar] [CrossRef]
  60. On Behalf of the PREDIMED-Plus Investigators; Schröder, H.; Cárdenas-Fuentes, G.; Martínez-González, M.A.; Corella, D.; Vioque, J.; Romaguera, D.; Alfredo Martínez, J.; Tinahones, F.J.; Miranda, J.L.; et al. Effectiveness of the physical activity intervention program in the PREDIMED-Plus study: A randomized controlled trial. Int. J. Behav. Nutr. Phys. Act. 2018, 15. [Google Scholar] [CrossRef]
  61. Molina, L.; Sarmiento, M.; Peñafiel, J.; Donaire, D.; Garcia-Aymerich, J.; Gomez, M.; Ble, M.; Ruiz, S.; Frances, A.; Schröder, H.; et al. Validation of the Regicor Short Physical Activity Questionnaire for the Adult Population. PLoS ONE 2017, 12, e0168148. [Google Scholar] [CrossRef]
  62. Galilea-Zabalza, I.; Buil-Cosiales, P.; Salas-Salvadó, J.; Toledo, E.; Ortega-Azorín, C.; Díez-Espino, J.; Vázquez-Ruiz, Z.; Zomeño, M.D.; Vioque, J.; Martínez, J.A.; et al. Mediterranean diet and quality of life: Baseline cross-sectional analysis of the PREDIMED-PLUS trial. PLoS ONE 2018, 13, e0198974. [Google Scholar] [CrossRef]
  63. Purcell, S.; Neale, B.; Todd-Brown, K.; Thomas, L.; Ferreira, M.A.R.; Bender, D.; Maller, J.; Sklar, P.; de Bakker, P.I.W.; Daly, M.J.; et al. PLINK: A Tool Set for Whole-Genome Association and Population-Based Linkage Analyses. Am. J. Hum. Genet. 2007, 81, 559–575. [Google Scholar] [CrossRef] [PubMed] [Green Version]
  64. Chang, C.C.; Chow, C.C.; Tellier, L.C.; Vattikuti, S.; Purcell, S.M.; Lee, J.J. Second-generation PLINK: Rising to the challenge of larger and richer datasets. GigaScience 2015, 4. [Google Scholar] [CrossRef] [PubMed]
  65. Barrett, J.C.; Fry, B.; Maller, J.; Daly, M.J. Haploview: Analysis and visualization of LD and haplotype maps. Bioinformatics 2005, 21, 263–265. [Google Scholar] [CrossRef] [PubMed]
  66. Boyle, A.P.; Hong, E.L.; Hariharan, M.; Cheng, Y.; Schaub, M.A.; Kasowski, M.; Karczewski, K.J.; Park, J.; Hitz, B.C.; Weng, S.; et al. Annotation of functional variation in personal genomes using RegulomeDB. Genome Res. 2012, 22, 1790–1797. [Google Scholar] [CrossRef] [PubMed] [Green Version]
  67. Turner, S.D. qqman: An R package for visualizing GWAS results using Q-Q and manhattan plots. BioRxiv 2014. [Google Scholar] [CrossRef]
  68. Yang, J.; Cai, L.; Huang, H.; Liu, B.; Wu, Q. Genetic Variations and Haplotype Diversity of the UGT1 Gene Cluster in the Chinese Population. PLoS ONE 2012, 7, e33988. [Google Scholar] [CrossRef]
  69. Seigneur, E.; Polepalli, J.S.; Südhof, T.C. Cbln2 and Cbln4 are expressed in distinct medial habenula-interpeduncular projections and contribute to different behavioral outputs. Proc. Natl. Acad. Sci. USA 2018, 115, E10235–E10244. [Google Scholar] [CrossRef] [PubMed]
  70. Germain, M.; Eyries, M.; Montani, D.; Poirier, O.; Girerd, B.; Dorfmüller, P.; Coulet, F.; Nadaud, S.; Maugenre, S.; Guignabert, C.; et al. Genome-wide association analysis identifies a susceptibility locus for pulmonary arterial hypertension. Nat. Genet. 2013, 45, 518–521. [Google Scholar] [CrossRef] [Green Version]
  71. Zuo, L.; Tan, Y.; Zhang, X.; Wang, X.; Krystal, J.; Tabakoff, B.; Zhong, C.; Luo, X. A New Genomewide Association Meta-Analysis of Alcohol Dependence. Alcohol. Clin. Exp. Res. 2015, 39, 1388–1395. [Google Scholar] [CrossRef] [Green Version]
  72. Matsuura, K.; Sawai, H.; Ikeo, K.; Ogawa, S.; Iio, E.; Isogawa, M.; Shimada, N.; Komori, A.; Toyoda, H.; Kumada, T.; et al. Genome-Wide Association Study Identifies TLL1 Variant Associated With Development of Hepatocellular Carcinoma After Eradication of Hepatitis C Virus Infection. Gastroenterology 2017, 152, 1383–1394. [Google Scholar] [CrossRef]
  73. Böhm, S.; Riedmayr, L.M.; Nguyen, O.N.P.; Gießl, A.; Liebscher, T.; Butz, E.S.; Schön, C.; Michalakis, S.; Wahl-Schott, C.; Biel, M.; et al. Peripherin-2 and Rom-1 have opposing effects on rod outer segment targeting of retinitis pigmentosa-linked peripherin-2 mutants. Sci. Rep. 2017, 7. [Google Scholar] [CrossRef]
  74. Vanzo, R.J.; Twede, H.; Ho, K.S.; Prasad, A.; Martin, M.M.; South, S.T.; Wassman, E.R. Clinical significance of copy number variants involving KANK1 in patients with neurodevelopmental disorders. Eur. J. Med. Genet. 2018. [Google Scholar] [CrossRef] [PubMed]
  75. McCarthy, M.E.; Oltman, S.P.; Baer, R.J.; Ryckman, K.K.; Rogers, E.E.; Steurer-Muller, M.A.; Witte, J.S.; Jelliffe-Pawlowski, L.L. Newborn Metabolic Profile Associated with Hyperbilirubinemia With and Without Kernicterus. Clin. Transl. Sci. 2018. [Google Scholar] [CrossRef] [PubMed]
  76. Lin, J.-P.; O’Donnell, C.J.; Schwaiger, J.P.; Cupples, L.A.; Lingenhel, A.; Hunt, S.C.; Yang, S.; Kronenberg, F. Association Between the UGT1A1*28 Allele, Bilirubin Levels, and Coronary Heart Disease in the Framingham Heart Study. Circulation 2006, 114, 1476–1481. [Google Scholar] [CrossRef] [PubMed] [Green Version]
  77. McCarty, M.F. ‘“Iatrogenic Gilbert syndrome”’—A strategy for reducing vascular and cancer risk by increasing plasma unconjugated bilirubin. Med. Hypotheses 2007, 69, 974–994. [Google Scholar] [CrossRef] [PubMed]
  78. Yueh, M.-F.; Chen, S.; Nguyen, N.; Tukey, R.H. Developmental, Genetic, Dietary, and Xenobiotic Influences on Neonatal Hyperbilirubinemia. Mol. Pharmacol. 2017, 91, 545–553. [Google Scholar] [CrossRef] [PubMed] [Green Version]
  79. Maruo, Y.; Morioka, Y.; Fujito, H.; Nakahara, S.; Yanagi, T.; Matsui, K.; Mori, A.; Sato, H.; Tukey, R.H.; Takeuchi, Y. Bilirubin Uridine Diphosphate-Glucuronosyltransferase Variation Is a Genetic Basis of Breast Milk Jaundice. J. Pediatr. 2014, 165, 36–41. [Google Scholar] [CrossRef] [PubMed]
  80. McKiernan, P. Metabolic liver disease. Clin. Res. Hepatol. Gastroenterol. 2012, 36, 287–290. [Google Scholar] [CrossRef] [PubMed]
  81. Reynolds, J.M.; Lee, Y.-H.; Shi, Y.; Wang, X.; Angkasekwinai, P.; Nallaparaju, K.C.; Flaherty, S.; Chang, S.H.; Watarai, H.; Dong, C. Interleukin-17B Antagonizes Interleukin-25-Mediated Mucosal Inflammation. Immunity 2015, 42, 692–703. [Google Scholar] [CrossRef] [PubMed] [Green Version]
Figure 1. Sex-differences in serum bilirubin concentrations in men and women. Adjusted means for total serum bilirubin concentrations in men (n = 188) and women (242). Means adjusted for age, diabetes, body mass index, medications, smoking, physical activity, and adherence to Mediterranean diet (17-item score). The p-value for the mean differences between men and women obtained in this multivariate adjusted model is P3. P2: adjusted for age and P1: unadjusted. Error bars: SE of means.
Nutrients 11 00090 g001
Figure 2. Linkage disequilibrium parameters (R2) between the top-ranked SNPs in chromosome 2 for the GWAS on total bilirubin concentrations in the 430 participants.
Nutrients 11 00090 g002
Figure 3. Manhattan plot for the GWAS analysis on total serum bilirubin concentrations in the whole population (n = 430 participants), obtained from the genetic additive model adjusted for sex and age, expressed in −log10(p-value). The blue line represents the threshold 1 (−log10(5 × 10⁻⁸)) for the GWAS statistical significance. The red line represents the threshold 2 ((−log10(1 × 10⁻⁵)).
Nutrients 11 00090 g003
Table 1. Demographic, clinical, lifestyle, and genetic characteristics of the study participants at baseline according to sex.
Total (n = 430)Men (n = 188)Women (n = 242)p
Age (years)65.1 ± 0.263.9 ± 0.466.1 ± 0.3<0.001
Weight (Kg)84.5 ± 0.792.8 ± 1.078.0 ± 0.6<0.001
BMI (Kg/m2)32.4 ± 0.232.3 ± 0.232.5 ± 0.20.629
Waist circumference (cm)106.1 ± 0.5111.2 ± 0.6102.0 ± 0.6<0.001
SBP (mm Hg)141.6 ± 0.9143.8 ± 1.3139.9 ± 1.20.026
DBP (mm Hg)81.0 ± 0.582.6 ± 0.779.7 ± 0.60.002
Total cholesterol (mg/dL)196.4 ± 1.8188.3 ± 2.8202.6 ± 2.3<0.001
LDL-C (mg/dL)125.0 ± 1.5121.6 ± 2.4127.7 ± 1.90.044
HDL-C (mg/dL)51.5 ± 0.547.5 ± 0.854.7 ± 0.7<0.001
Triglycerides (mg/dL)141.6 ± 2.9138.2 ± 3.8144.3 ± 4.20.296
Fasting glucose (mg/dL)112.5 ± 1.3112.8 ± 2.0112.3 ± 1.70.862
Bilirubin (mg/dL)0.58 ± 0.010.64 ± 0.020.53 ± 0.01<0.001
AST (U/L)26.4 ± 0.427.7 ± 0.725.4 ± 0.50.005
ALT (U/L)28.4 ± 0.830.8 ± 1.226.6 ± 1.00.008
Type 2 diabetes: n, %169 (39.3)74 (39.4)95 (39.3)0.982
Current smokers: n, %49 (11.4)30 (16.0)19 (7.9)<0.001
Medications: n, %
 Antihypertensive drugs339 (78.8)148 (78.7)191 (78.9)0.959
 Hypolipidemic drugs278 (64.7)125 (66.5)153 (63.2)0.482
 Insulin22 (5.1)11 (5.9)11 (4.5)0.542
Physical Activity (MET.min/week)1715 ± 771940 ± 1341539 ± 890.227
Adherence to MedDiet (P17) 17.97 ± 0.137.79 ± 0.208.12 ± 0.180.010
Values are mean ± SE for continuous variables and number (%) for categorical variables. BMI indicates body mass index. MedDiet, Mediterranean diet. p: p-value for the comparisons (means or %) between male and female individuals. AST: Aspartate transaminase. ALT: Alanine transaminase. MET: Metabolic Equivalent. 1 MET is equivalent to kcal·kg−1·h−1, the oxygen cost of sitting quietly measured as 3.5 mL/kg/min. 1: Quantitative 17-item questionnaire for Adherence to Mediterranean diet (MedDiet). SBP: Systolic Blood Pressure. DBP: Diastolic Blood Pressure.
Table 2. GWAS results (the top-ranked SNPs) for the association between bilirubin concentrations in the whole sample.
CHRSNPBETASER2p1p2MAMAFGene
2rs41483250.1490.0160.1741.97 × 10−199.25 × 10⁻²⁴C0.354UGT1A1
2rs67420780.1480.0160.1732.84 × 10−191.29 × 10⁻²³T0.348UGT1A1
2rs8878290.1480.0160.1713.72 × 10−191.39 × 10⁻²³T0.354UGT1A1
2rs41483240.1470.0160.1704.62 × 10−199.48 × 10⁻²⁴G0.353UGT1A1
2rs178637870.1420.0160.1571.40 × 10−174.70 × 10⁻²⁰G0.263UGT1A6 4
2rs178628750.1460.0170.1524.46 × 10−171.68 × 10⁻²⁰A0.295UGT1A6
2rs37713410.1430.0170.1508.64 × 10−172.65 × 10⁻²⁰A0.330UGT1A1
2rs67442840.1410.0170.1444.39 × 10−164.06 × 10⁻¹⁸T0.390UGT1A6
2rs9295960.1360.0170.1328.14 × 10−151.83 × 10⁻¹⁸G0.324UGT1A1
2rs20709590.1270.0160.1272.47 × 10−143.78 × 10⁻¹⁶G0.278UGT1A6
2rs11058790.1210.0160.1238.14 × 10−141.84 × 10⁻¹⁵C0.325UGT1A6
2rs11058800.1200.0160.1201.55 × 10−133.30 × 10⁻¹⁵G0.343UGT1A6
2rs27410450.1190.0170.1092.50 × 10−122.03 × 10⁻¹⁴T0.159UGT1A10
2rs75832780.1110.0160.1057.21 × 10−123.87 × 10⁻¹³T0.391UGT1A6
2rs20189850.1110.0160.1031.19 × 10−113.49 × 10⁻¹⁴G0.441UGT1A6
2rs67254780.1100.0160.1021.22 × 10−115.42 × 10⁻¹³T0.388UGT1A6
2rs76041150.1060.0160.0883.28 × 10−103.09 × 10⁻¹²T0.350UGT1A6
2rs37553190.1020.0160.0867.53 × 10−107.28 × 10⁻¹²A0.450UGT1A1
2rs41483260.1010.0160.0858.03 × 10−108.20 × 10⁻¹²T0.480UGT1A1
2rs46639650.1010.0160.0841.00 × 10−091.10 × 10⁻¹¹T0.415UGT1A6
2rs41248740.1000.0160.0831.04 × 10−099.01 × 10⁻¹²T0.412UGT1A6 3
2rs20085950.1010.0160.0831.08 × 10−091.67 × 10⁻¹¹C0.412UGT1A6
2rs18752630.1020.0160.0841.10 × 10−091.02 × 10⁻¹⁰T0.417UGT1A6 3
2rs64316280.1000.0160.0831.29 × 10−091.30 × 10⁻¹¹A0.410UGT1A6
2rs27410270.1020.0160.0831.32 × 10−099.63 × 10⁻¹²A0.177__
2rs101790910.1000.0160.0831.34 × 10−091.01 × 10⁻¹¹T0.482UGT1A6
2rs46633330.1000.0160.0831.35 × 10−091.38 × 10⁻¹¹G0.411UGT1A6
2rs46639630.1000.0160.0831.35 × 10−091.35 × 10⁻¹¹T0.420UGT1A6
2rs8715140.1000.0160.0821.37 × 10−091.82 × 10⁻¹¹T0.428UGT1A6
2rs101974600.0990.0160.0831.42 × 10−092.32 × 10⁻¹⁰T0.298UGT1A10
2rs27410290.1020.0170.0811.79 × 10−091.07 × 10⁻¹¹G0.177UGT1A8
2rs43997190.0990.0160.0811.89 × 10−091.63 × 10⁻¹¹T0.415UGT1A6
2rs26023730.1020.0170.0802.16 × 10−091.51 × 10⁻¹¹C0.177UGT1A10
2rs26023740.1050.0170.0802.16 × 10−092.36 × 10⁻¹¹T0.173UGT1A10
2rs42949990.0980.0160.0793.15 × 10−094.78 × 10⁻¹¹A0.426UGT1A6
18rs6589950.2860.0470.0793.33 × 10−092.50 × 10−08A0.282CBLN2
2rs101790940.0960.0160.0783.75 × 10−095.34 × 10⁻¹⁰A0.297UGT1A10 3
2rs27410120.0980.0160.0784.11 × 10−093.22 × 10⁻¹¹T0.191__
2rs67244850.0950.0160.0774.50 × 10−091.12 × 10−09A0.358UGT1A10
2rs12988520−0.0980.0160.0775.01 × 10−096.94 × 10⁻¹⁰C0.470UGT1A6
2rs130157200.0960.0160.0775.06 × 10−099.86 × 10⁻¹⁰A0.362UGT1A6
2rs7572563−0.0980.0160.0775.43 × 10−091.03 × 10−09G0.403UGT1A6
2rs42617160.0950.0160.0766.40 × 10−091.45 × 10−09T0.358UGT1A10
2rs17862866−0.0970.0160.0766.86 × 10−091.12 × 10−09A0.402UGT1A6
2rs67367430.0940.0160.0757.24 × 10−091.69 × 10−09A0.362UGT1A10
2rs67365080.0940.0160.0757.25 × 10−091.68 × 10−09A0.362UGT1A10
2rs126232710.0940.0160.0757.65 × 10−091.75 × 10−09G0.362UGT1A6
2rs101681550.0940.0160.0757.87 × 10−091.69 × 10−09T0.362UGT1A10
2rs67533200.0930.0160.0741.03 × 10−082.30 × 10−09C0.363UGT1A10
2rs75635610.0930.0160.0741.03 × 10−082.30 × 10−09G0.362UGT1A10
2rs45538190.0930.0160.0741.05 × 10−082.43 × 10−09G0.358UGT1A10
2rs67535690.0930.0160.0741.09 × 10−082.39 × 10−09C0.362UGT1A10
2rs43478320.0930.0160.0741.13 × 10−082.52 × 10−09C0.358UGT1A10
2rs116804500.0920.0160.0721.73 × 10−083.54 × 10−09C0.362UGT1A10
2rs75566760.0930.0170.0693.51 × 10−086.99 × 10⁻¹⁰G0.497UGT1A6
2rs23615020.0960.0170.0693.69 × 10−081.17 × 10−08C0.282MROH2A
2rs116907860.0960.0170.0676.38 × 10−087.05 × 10−09T0.281MROH2A
18rs5953330.2520.0460.0667.46 × 10−085.81 × 10−07T0.291CBLN2
3rs64391060.4090.0770.0621.79 × 10−073.14 × 10−08T0.221__
CHR: Chromosome. SNP: Single Nucleotide Polymorphism. Beta: indicates the regression coefficients showing the increase or decrease in the bilirubin concentrations (mg/dL) per minor allele. SE: Standard error of Beta. R2: Indicates the determination coefficient (variability explained). MA: Minor allele. MAF: minor allele (MA) frequency. n = 430 subjects analyzed. 1: Unadjusted p-value in the additive model. 2: adjusted p-value for sex and age (additive model). 3: SNP scored as 2b in the RegulomeDB with the meaning of likely to affect binding. 4: SNP scored as 3a in the RegulomeDB with the meaning being less likely to affect binding.
Table 3. GWAS results for the association between bilirubin concentrations and the top-ranked SNPs (at the GWAS level: p < 5 × 10⁻⁸) in men.
CHRSNPBetaSER2p1p2MAMAFGene
2rs41483240.1770.0270.1894.44 × 10−104.77 × 10⁻¹¹G0.353UGT1A1
2rs8878290.1760.0270.1885.89 × 10−107.04 × 10⁻¹¹T0.354UGT1A1
2rs37713410.1740.0280.1666.20 × 10−091.20 × 10−09A0.330UGT1A1
2rs178628750.1730.0290.1611.00 × 10−082.40 × 10−09A0.295UGT1A6
2rs9295960.1710.0290.1542.29 × 10−083.75 × 10−09G0.324UGT1A1
2rs178637870.1590.0280.1494.37 × 10−081.04 × 10−08G0.263UGT1A6 3
2rs11058790.1500.0270.1448.14 × 10−081.07 × 10−08C0.325UGT1A6
2rs20709590.1550.0280.1438.44 × 10−082.15 × 10−08G0.278UGT1A6
CHR: Chromosome. SNP: Single Nucleotide Polymorphism. Beta: indicates the regression coefficients showing the increase or decrease in the bilirubin concentrations (mg/dL) per minor allele. SE: Standard error of Beta. R2: Indicates the determination coefficient (variability explained). MA: Minor allele. MAF: minor allele (MA) frequency. n = 188 subjects analyzed. 1: Unadjusted p-value in the additive model. 2: Adjusted p-value for age (additive model). 3: SNP scored as 3a in the RegulomeDB with the meaning of less likely to affect binding.
Table 4. GWAS results for the association between bilirubin concentrations and the top-ranked SNPs (at the GWAS level: p < 5 × 10⁻⁸) in women.
CHRSNPBetaSER2p1p2MAMAFGene
2rs41483240.1420.0170.2181.99 × 10−142.15 × 10⁻¹⁴G0.353UGT1A1
2rs67420780.1420.0180.2172.69 × 10−142.97 × 10⁻¹⁴T0.348UGT1A1
2rs178637870.1350.0170.2022.14 × 10−132.40 × 10⁻¹³G0.263UGT1A6 3
2rs178628750.1410.0180.1993.61 × 10−134.03 × 10⁻¹³A0.295UGT1A6
2rs37713410.1360.0180.1891.52 × 10−121.67 × 10⁻¹²A0.330UGT1A1
2rs67442840.1340.0180.1825.16 × 10−125.70 × 10⁻¹²T0.390UGT1A6
2rs9295960.1280.0190.1664.48 × 10−114.65 × 10⁻¹¹G0.324UGT1A1
2rs20189850.1150.0180.1479.23 × 10−101.00 × 10−09G0.441UGT1A6
2rs20709590.1110.0180.1392.40 × 10−092.57 × 10−09G0.278UGT1A6
2rs27410450.1080.0180.1281.08 × 10−081.07 × 10−08T0.159UGT1A10
1rs3599350.3530.0610.1261.99 × 10−082.17 × 10−08A0.053__
2rs67254780.1040.0180.1232.13 × 10−082.28 × 10−08T0.388UGT1A6
2rs11058800.1030.0180.1232.30 × 10−082.40 × 10−08G0.343UGT1A6
2rs11058790.1030.0180.1232.30 × 10−082.40 × 10−08C0.325UGT1A6
2rs75832780.1050.0180.1242.57 × 10−082.75 × 10−08T0.391UGT1A6
2rs76041150.1070.0190.1222.57 × 10−082.76 × 10−08T0.350UGT1A6
CHR: Chromosome. SNP: Single Nucleotide Polymorphism. Beta: indicates the regression coefficients showing the increase or decrease in the bilirubin concentrations (mg/dL) per minor allele. SE: Standard error of Beta. R2: Indicates the determination coefficient (variability explained). MA: Minor allele. MAF: minor allele (MA) frequency. n = 242 subjects analyzed. 1: Unadjusted p-value in the additive model. 2: Adjusted p-value for age (additive model). 3: SNP scored as 3a in the RegulomeDB with the meaning less likely to affect binding.
Table 5. GWAS results for the interaction term between the Mediterranean diet adherence and the corresponding SPN (at p < 1 × 10⁻⁵) for bilirubin concentrations in the whole sample.
Low Adherence Mediterranean Diet 1High Adherence Mediterranean Diet 2
CHRSNPBeta1 3SE1 3Beta2 4SE2 4p5 Gene-Diet InteractionMAMAFGene
5rs68874520.0450.016−0.0870.0183.14 × 1008G0.397IL17B
10rs6585514−0.0610.0160.0630.0195.89 × 10−07A0.395__
6rs7770270−0.0460.0240.1400.0301.52 × 10−06A0.112LAMA2
17rs12424920.0380.015−0.0740.0182.78 × 10−06C0.249__
4rs131080210.0520.017−0.0690.0202.96 × 10−06A0.228__
10rs108863420.0590.017−0.0670.0224.19 × 10−06A0.277__
18rs12964365−0.0480.0170.0730.0204.59 × 10−06T0.150LOC107985179
6rs6904763−0.0460.0240.1280.0305.32 × 10−06C0.126LAMA2
5rs9071950.0540.017−0.0700.0215.91 × 10−06C0.253__
4rs103058950.0610.020−0.0760.0236.04 × 10−06G0.341EDNRA
1rs112085120.0370.016−0.0750.0196.35 × 10−06T0.417__
5rs7443165−0.0460.0190.0890.0248.62 × 10−06A0.277__
10rs4642993−0.0600.0150.0430.0189.19 × 10−06A0.455__
18rs687862−0.0430.0170.0740.0209.70 × 10−06A0.220LINC01541
5rs168719330.1110.027−0.0720.0319.70 × 10−06G0.081LINC01331
CHR: Chromosome. SNP: Single Nucleotide Polymorphism. 1: Low Adherence to the Mediterranean Diet: from 0 to 8 points in the 17-item score (n = 257 subjects). 2: High Adherence to the Mediterranean Diet: from 9 to 17 points in the 17-item score. Beta1 3: indicates the regression coefficients showing the increase or decrease in the bilirubin concentrations (mg/dL) per minor allele in the low adherence stratum. SE1 3: Standard error of Beta in the low adherence stratum. Beta2 4: indicates the regression coefficients showing the increase or decrease in the bilirubin concentrations (mg/dL) per minor allele in the high adherence stratum. SE2 4: Standard error of Beta in the high adherence stratum. 5: Adjusted p-value for the interaction term between the Mediterranean diet adherence and the corresponding SPN. MAF: minor allele (MA) frequency. n = 418 subjects analyzed.

