Agreement among Mediterranean Diet Pattern Adherence Indexes: MCC-Spain Study

 , , , , , , , , ,
  add
Show full author list
add
Show full author list
Abstract
:1. Introduction
2. Materials and Methods
2.1. Study Design, Setting and Participants
2.2. Data Collection
2.3. Mediterranean Diet Pattern Adherence Indexes
- Mediterranean Diet Score (MDS) [11]. This index considers 9 food groups: vegetables, legumes, fruit, fish, cereals, meat, dairy products, monounsaturated/saturated fats ratio and alcohol consumption. The total score ranges from 0 (minimum adherence to a traditional Mediterranean dietary pattern) to 9 (maximum adherence);
- Alternative Mediterranean Diet (aMED) [24]. In this index the following groups of food/nutrients were considered: vegetables, legumes, fruit, nuts, fish, whole grains, red meat, monounsaturated/saturated fats ratio and alcohol consumption. The total score ranged from 0 (minimum adherence) to 9 (maximum adherence);
- Relative Mediterranean Diet (rMED) [25]. The following groups of food were considered: vegetables, legumes, fruit, cereals, fish, olive oil, meat, dairy products and alcohol. The total score ranged between 0 (minimum adherence to a traditional Mediterranean dietary pattern) to 18 (maximum adherence);
- Dietary Score (DS) [26]. This index includes the following groups of food: vegetables, legumes, fruits, fish, whole grains, potatoes, olive oil, poultry, dairy products with fat, red meat and alcohol. The total score ranged from 0 (minimum adherence) to 55 (maximum adherence);
- Literature-Based Adherence Score (LBAS) [20]: vegetables, legumes, fruits, fish, whole grains, olive oil, dairy products, red meat and processed meat and alcohol. The total score ranged from 0 (minimum adherence) to 18 (maximum adherence).
2.4. Statistical Analysis
3. Results
4. Discussion
4.1. Methodological Differences Between Indices
- (A)
- Type of food, base components and/or nutrients included in the indexes. For example, classification agreement for the level of adherence to a Mediterranean diet among indexes is difficult when there are differences in the types of fat included. Differences include: i) monounsaturated/saturated fat ratio are included in MDS and aMED and excluded in the rest of the indexes; ii) dairy products are included in the MDS, rMED, and LBAS indexes but not in the aMED; iii) the type of meat included: all kinds of meat; or only poultry, processed or red meat; iv) cereals are only included in MDS, aMED, and rMED; however, the MDS and rMED included all type of cereals and the aMED includes only whole grain; v) nuts may be considered part of the fruit group as in the MDS or rMED, or like an independent group in the aMED, or not considered at all such as in the LBAS and DS.
- (B)
- Criteria used to build the index. There are indexes based on in g/day (i.e., MDS and LBAS), in rations/day (i.e., aMED) or rations/month (i.e., DS) or in energy density (i.e., rMED). Regardless of how intake is measured, some indexes use scores with established fixed points (i.e., DS and LBAS) and others use sex-specific medians (i.e., MDS and aMED) or tertiles derived directly from the population (see next point). All these differences can be factors that make it difficult to observe a good correlation between the indexes.
- (C)
- Dependence or not on the study sample. While the MDS, aMED and rMED are estimated using the distribution of some food and nutrients in the study sample, the DS and LBAS are based on previously published a priori recommendations. This may explain part of the variability found among indexes. When MDS, aMED or rMED are used, it may occur that if the level of general adherence to the diet of a population is low, when having to classify the population in three levels, there are subjects classified with a medium or high adherence level to a Mediterranean diet when they do not really have it. For example, one participant was classified with a medium adherence with MDS and aMED, but was classified with low adherence for the indexes that did not depend on the population (i.e., DS and LBAS). That is to say, the obtained scores using these indexes for an individual subject are relative and dependent on the characteristics of the rest of the sample, which makes their comparability difficult.
4.2. Strengths and Limitations
5. Conclusions
Supplementary Materials
Author Contributions
Funding
Acknowledgments
Conflicts of Interest
References
- Kourlaba, G.; Panagiotakos, D.B. Dietary quality indices and human health: A review. Maturitas 2019, 62, 1–8. [Google Scholar] [CrossRef] [PubMed]
- Waijers, P.M.; Feskens, E.J.; Ocké, M.C. A critical review of predefined diet quality scores. Br. J. Nutr. 2007, 97, 219–231. [Google Scholar] [CrossRef] [PubMed]
- Bach, A.; Serra-Majem, L.; Carrasco, J.L.; Roman, B.; Ngo, J.; Bertomeu, I.; Obrador, B. The use of indexes evaluating the adherence to the Mediterranean diet in epidemiological studies: A review. Public Health Nutr. 2006, 9, 132–146. [Google Scholar] [CrossRef] [PubMed]
- Román-Viñas, B.; Ribas-Barba, L.; Ngo, J.; Martínez-Gonzalez, M.A.; Wijnhoven, T.M.; Serra-Majem, L. Validity of dietary patterns to assess nutrient intake adequacy. Br. J. Nutr. 2019, 101 (Suppl. 2), S12–S20. [Google Scholar]
- Kant, A.K. Dietary patterns and health outcomes. J. Am. Diet. Assoc. 2004, 104, 615–635. [Google Scholar] [CrossRef] [PubMed]
- Cespedes, E.M.; Hu, F.B. Dietary patterns: From nutritional epidemiologic analysis to national guidelines. Am. J. Clin. Nutr. 2015, 101, 899–900. [Google Scholar] [CrossRef] [PubMed]
- Bloomfield, H.E.; Kane, R.; Koeller, E.; Greer, N.; MacDonald, R.; Wilt, T. Benefits and Harms of the Mediterranean Diet Compared to Other Diets; VA ESP Project #09-009; Department of Veterans Affairs (US): Washington, DC, USA, 2015.
- Martinez-Gonzalez, M.A.; Martin-Calvo, N. Mediterranean diet and life expectancy; beyond olive oil, fruits, and vegetables. Curr. Opin. Clin. Nutr. Metab. Care 2016, 19, 401–407. [Google Scholar] [CrossRef] [PubMed] [Green Version]
- Keys, A.; Grande, F. Role of dietary fat in human nutrition. III. Diet and the epidemiology of coronary heart disease. Am. J. Public Health Nations Health 1957, 47, 1520–1530. [Google Scholar] [CrossRef] [PubMed]
- Willet, W.; Sacks, F.; Trichopoulou, A.; Drescher, G.; Ferro-Luzzi, A.; Helsing, E.; Trichopoulou, A. Mediterranean diet pyramid: A cultural model for healthy eating. Am. J. Clin. Nutr. 1995, 61 (Suppl. 6), 1402S–1406S. [Google Scholar] [CrossRef] [PubMed]
- Trichopoulou, A.; Costacou, T.; Bamia, C.; Trichopoulou, D. Adherence to a Mediterranean and survival in a Greek population. N. Engl. J. Med. 2003, 348, 2599–2608. [Google Scholar] [CrossRef] [PubMed]
- Estruch, R.; Ros, E.; Salas-Salvado, J.; Covas, M.I.; Corella, D.; Arós, F.; Gómez-Gracia, E.; Ruiz-Gutiérrez, V.; Fiol, M.; Lapetra, J.; et al. Primary prevention of cardiovascular disease with a Mediterranean diet supplemented with extra-virgin olive oil or nuts. N. Engl. J. Med. 2018, 378, e34. [Google Scholar] [CrossRef] [PubMed]
- Salas-Salvado, J.; Guasch-Ferre, M.; Lee, C.H.; Estruch, R.; Clish, C.B.; Ros, E. Protective effects of the Mediterranean det on type 2 diabetes and mtabolic syndrome. J. Nutr. 2016, in press. [Google Scholar]
- Romaguera, D.; Norat, T.; Mouw, T.; May, A.M.; Bamia, C.; Slimani, N.; Travier, N.; Besson, H.; Luan, J.; Wareham, N.; et al. Adherence to the Mediterranean diet is associated with lower abdominal adiposity in European men and women. J. Nutr. 2009, 139, 1728–1737. [Google Scholar] [CrossRef] [PubMed]
- U.S. Department of Health and Human Services; U.S. Department of Agriculture. 2015–2020 Dietary Guidelines for Americans, 8th ed.; December 2015. Available online: http://health.gov/dietaryguidelines/2015/guidelines/ (accessed on 22 January 2018).
- Dinu, M.; Pagliai, G.; Casini, A.; Sofi, F. Mediterranean diet and multiple health outcomes: An umbrella review of meta-analysis of observational studies and randomised trials. Eur. J. Clin. Nutr. 2018, 72, 30–43. [Google Scholar] [CrossRef] [PubMed]
- Milà-Villarroel, R.; Bach-Faig, A.; Puig, J.; Puchal, A.; Serra-Majem, L.; Carrasco, J.L. Comparison and evaluation of the reliability of indexes of adherence to the Mediterranean diet. Public Health Nutr. 2011, 14, 2338–2345. [Google Scholar] [CrossRef] [PubMed] [Green Version]
- D’Alessandro, A.; De Pergola, G.; Silvestris, F. Mediterranean Diet and cancer risk: An open issue. Int. J. Food Sci. Nutr. 2016, 67, 593–605. [Google Scholar] [CrossRef] [PubMed]
- Ciprián, D.; Navarrete-Muñoz, E.M.; Garcia de la Hera, M.; Giménez-Monzo, D.; González-Palacios, S.; Quiles, J.; Vioque, J. Mediterranean and Western dietary patterns in adult population of a Mediterranean area; a cluster analysis. Nutr. Hosp. 2013, 28, 1741–1749. [Google Scholar] [PubMed]
- Sofi, F.; Macchi, C.; Abbate, R.; Gensini, G.F.; Casini, A. Mediterranean diet and health status: An updated meta-analysis and a proposal for a literature-based adherence score. Public Health Nutr. 2014, 17, 2769–2782. [Google Scholar] [CrossRef] [PubMed]
- Castaño-Vinyals, G.; Aragonés, N.; Pérez-Gómez, B.; Martin, V.; Llorca, J.; Moreno, V.; Altzibar, J.M.; Ardanaz, E.; Sanjosé, S.; Jiménez-Moleón, J.J.; et al. Population-based multicase-control study in common tumors in Spain (MCC-Spain): Rationale and study design. Gac. Sanit. 2015, 29, 308–315. [Google Scholar]
- Garcia-Closas, R.; Garcia-Closas, M.; Kogevinas, M.; Malats, N.; Silverman, D.; Serra, C.; Tardón, A.; Carrato, A.; Castaño-Vinyals, G.; Dosemeci, M.; et al. Food, nutrient and heterocyclic amine intake and the risk of bladder cáncer. Eur. J. Cancer 2007, 43, 1731–1740. [Google Scholar] [CrossRef] [PubMed]
- Calvert, C.; Cade, J.; Barrett, J.H.; Woodhouse, A. Using cross-check questions to address the problem of mis-reporting of specific food groups on food frequency questionnaires. UKWCS steering group. United Kingdom women’s cohort study steering group. Eur. J. Clin. Nutr. 1997, 51, 708–712. [Google Scholar] [CrossRef] [PubMed]
- Fung, T.T.; McCullough, M.L.; Newby, P.K.; Manson, J.E.; Meigs, J.B.; Rifai, N.; Willett, W.C.; Hu, F.B. Diet-quality scores and plasma concentrations of markers of inflammation and endothelial dysfunction. Am. J. Clin. Nutr. 2005, 82, 163–173. [Google Scholar] [CrossRef] [PubMed] [Green Version]
- Buckland, G.; Gonzalez, C.A.; Agudo, A.; Vilardell, M.; Berenger, A.; Amiano, P.; Ardanaz, E.; Arriola, L.; Barricarte, A.; Basterretxea, M.; et al. Adherence to the Mediterranean diet and risk of coronary heart disease in the Spanish EPIC Cohort Study. Am. J. Epidemiol. 2009, 170, 1518–1529. [Google Scholar] [CrossRef] [PubMed]
- Panagiotakos, D.B.; Pitsavos, C.; Arvaniti, F.; Stefanadis, C. Adherence to the Mediterranean food pattern predicts the prevalence of hypertension, hypercholesterolemia, diabetes and obesity, among healthy adult; the accuracy of the MedDietScore. Prev. Med. 2007, 44, 335–340. [Google Scholar] [CrossRef] [PubMed]
- Moore, D.S.; Notz, W.I.; Flinger, M.A. The Basic Practice of Statistics, 6th ed.; W.H. Freeman and Company: New York, NY, USA, 2013. [Google Scholar]
- Mukaka, M.M. Statistics Corner: A guide to appropriate use of Correlation coefficient in medical research. Malawi Med. J. 2012, 24, 69–71. [Google Scholar] [PubMed]
- Armitage, P.; Berry, G. Statistical Methods in Medical Research, 3rd ed.; Blackwell Scientific Publications: Oxford, UK, 1994. [Google Scholar]
- Brenner, H.; Kliebsch, U. Dependence of weighted kappa coefficients on the number of categories. Epidemiology. 1996, 7, 199–202. [Google Scholar] [CrossRef] [PubMed]
- Landis, J.R.; Koch, G.G. The measurement of observer agreement for categorical data. Biometrics 1977, 33, 159–174. [Google Scholar] [CrossRef] [PubMed]
- Bamia, C.; Martimianaki, G.; Kritikou, M.; Trichopoulou, A. Indexes for assessing adherence to a Mediterranean diet from data measured through brief questionnaires: Issues raissed from the analysis of a Greek population study. Curr. Dev. Nutr. 2017, 1, e000075. [Google Scholar] [CrossRef] [PubMed]
- Martínez-González, M.A.; de la Fuente-Arrillaga, C.; Wärnberg, J. Epidemiología nutricional. In Conceptos de Salud Pública y Estrategias Preventivas. Un Manual Para Ciencias de la Salud, 1st ed.; Martínez-González, M.A., Ed.; Elsevier España SL: Barcelona, Spain, 2013; pp. 337–341. [Google Scholar]
- Hebert, J.R.; Clemow, L.; Pbert, L.; Ockene, I.S.; Ockene, J.K. Social desirability bias in dietary selfreport may compromise the validity of dietary intake measures. Int. J. Epidemiol. 1995, 24, 389–398. [Google Scholar] [CrossRef] [PubMed]


| Food Groups | Mediterranean Diet Score (MDS) Trichopoulou, 2003 | Alternative Mediterranean Diet (aMED) Fung, 2005 | Relative Mediterranean Diet (rMED) Buckland, 2010 | Dietary Score (DS) Panagiotakos, 2007 | Literature-Based Adherence Score (LBAS) Sofi, 2014 |
|---|---|---|---|---|---|
| Scoring criteria | Grams(g)/day | Rations/day | Energy density = g*1000 kcal/day | Rations/month | Grams(g)/day |
| Vegetables | 0 points < median; 1 point ≥ median | 0 points median; 1 point > median | Tertile 1 = 0 points; Tertile 2 = 1 point; Tertile 3 = 2 points | 0 points=0, 1 point= 1–4, 2 points= 5–8, 3 points = 9–12, 4 points =13–18, 5 points =>18 | 0 points <100; 1 point 100–250; 2 points ≥250 |
| Legumes | 0 points < median; 1 point ≥ median | 0 points ≤ median; 1 point > median | Tertile 1 = 0 points; Tertile 2 = 1 point; Tertile 3 = 2 points | 0 points=0, 1 point= 1–4, 2 points= 5–8, 3 points = 9–12, 4 points =13–18, 5 points =>18 | 0 points <70; 1 point 70–140; 2 points ≥140 |
| Fruit | (Included nuts) 0 points < median; 1 point ≥ median | 0 points ≤ median; 1 point > median | Tertile 1 = 0 points; Tertile 2 = 1 point; Tertile 3 = 2 points | 0 points=0, 1 point= 1–4, 2 points= 5–8, 3 points = 9–12, 4 points =13–18, 5 points =>18 | 0 points <150; 1 point 150–300; 2 points ≥300 |
| Nuts | Included in fruit group | 0 points ≤ median; 1 point > median | Included in fruit group | Not included | Not included |
| Fish | 0 points < median; 1 point ≥ median | 0 points ≤ median; 1 point > median | Tertile 1 = 0 points; Tertile 2 = 1 point; Tertile 3 = 2 points | 0 points=0, 1 point= 1–4, 2 points= 5–8, 3 points = 9–12, 4 points =13–18, 5 points =>18 | 0 points <100; 1 point 100–250; 2 points ≥250 |
| Cereals | 0 points < median; 1 point ≥ median | (only whole grain) 0 points ≤ median; 1 point > median | Tertile 1 = 0 points; Tertile 2 = 1 point; Tertile 3 = 2 points | 0 points=0, 1 point= 1–4, 2 points= 5–8, 3 points = 9–12, 4 points = 13–18, 5 points =>18 | 0 points <130; 1 point 130–195; 2 points ≥195 |
| Scoring criteria | Grams(g)/day | Rations/day | Energy density = g*1,000 kcal/day | Rations/month | Grams(g)/day |
| Meat | (Poultry included) 1 point < median; 0 point ≥ median | (Red and processed meat) 0 points ≥ median; 1 point < median | (All kinds of meat) Tertile 1 = 2 points; Tertile 2 = 1 point; Tertile 3 = 0 points | (Red meat) 5 points = 0, 4 points = 1–4, 3 points = 5–8, 2 points = 9–12, 1 point = 13–18, 0 points ≥ 18 | (Red and processed meat) 2 points <80; 1 point 80–120; 0 points ≥120 |
| Dairy products | 1 point < median; 0 point ≥ median | Not included | Tertile 1 = 2 points; Tertile 2 = 1 point; Tertile 3 = 0 points | (Dairy products with fats) 5 points = 0, 4 points = 1–4, 3 points = 5–8, 2 points = 9–12, 1 point = 13–18, 0 points ≥ 18 | 2 points <180; 1 point 180–270; 0 points ≥270 |
| Mono/saturated fats ratio | 0 points < median; 1 point ≥ median | 0 points ≤ median; 1 point > median | Not included | Not included | Not included |
| Alcohol | Woman: 1 point → 5–25 g/day Man: 1 point → 10–50 g/day | Woman: 1 point → 5–15 g/day Man: 1 point → 10–25 g/day | Woman = 5–25 g/day and Man = 10–50 g/day (2 points) and <or> this quantity = 0 points | 5 points ≤ 300, 4 points = 300, 3 points = 400, 2 points = 500, 1 point = 600, 0 points = 700 or 0 | 1 point <12; 2 point 12–24; 0 points ≥24 |
| Potatoes | Included in vegetables group | Not included | Not included | 0 points = 0, 1 point = 1–4, 2 points = 5–8, 3 points = 9–12, 4 points = 13–18, 5 points ≥ 18 (rations/week) | Not included |
| Olive oil cooking | Included in mono/saturated fats ratio group | Included in mono/saturated fats ratio group | Included in mono/saturated fats ratio group | 0 points= never, 1 point = hardly ever; 2 points ≤ 1, 3 points = 1–3, 4 points = 3–5, 5 points= daily | 0 points <0.1; 1 point 0.1–0.99; 2 points ≥1 |
| Poultry | Included in meat group | Not included | Included in meat group | 5 points =0, 4 points = 1–4, 3 points = 5–8, 2 points = 9–12, 1 point = 13–18, 0 points ≥ 18 | Not included |
| Score ranged | 0–9 points | 0–9 points | 0–18 points | 0–55 points | 0–18 points |
| Adherence categories | Low = 0–3 points Medium = 4–5 points High ≥ 6 points | Low = 0–3 points Medium = 4–5 points High ≥ 6 points | Low = 0–6 points Medium = 7–10 points High = 11–18 points | Low = tertile 1 Medium = tertile 2 High = tertile 3 | Low ≤9 points Medium 9–11 points High ≥11 points |
| MDS | aMED | rMED | DS | LBAS | ||
|---|---|---|---|---|---|---|
| Sex | ||||||
| Men | Mean (SD) | 4.3 (1.7) | 4.0 (1.8) | 8.9 (3.3) | 34.3 (4.4) | 9.3 (2.3) |
| Min–Max | (0–9) | (0–9) | (0–17) | (11–48) | (2–16) | |
| P25,50,75 | (3–4–5) | (3–4–5) | (7–9–11) | (32–34–37) | (8–9–11) | |
| Women | Mean (SD) | 4.3 (1.6) | 4.1 (1.8) | 8.7 (3.1) | 35.0 (4.2) | 9.6 (2.0) |
| Min–Max | (0–9) | (0–9) | (0–18) | (16–49) | (3–15) | |
| P25,50,75 | (3–4–5) | (3–4–5) | (7–9–11) | (32–35–38) | (8–10–11) | |
| Education level | ||||||
| Less than primary | Mean (SD) | 4.2 (1.7) | 3.8 (1.7) | 8.5 (3.3) | 34.2 (4.8) | 9.7 (2.3) |
| Min–Max | (0–9) | (0–8) | (0–17) | (11–48) | (2–15) | |
| P25,50,75 | (3–4–5) | (3–4–5) | (6–9–11) | (32–34–37) | (8–10–11) | |
| Primary school | Mean (SD) | 4.4 (1.6) | 4.2 (1.7) | 9.1 (3.2) | 34.7 (4.2) | 9.6 (2.2) |
| Min–Max | (0–9) | (0–9) | (0–17) | (17–48) | (2–16) | |
| P25,50,75 | (3–5–6) | (3–4–5) | (7–9–11) | (32–35–37) | (8–10–11) | |
| Secondary | Mean (SD) | 4.1 (1.7) | 4.0 (1.8) | 8.6 (3.2) | 34.4 (4.3) | 9.3 (2.1) |
| Min–Max | (0–9) | (0–9) | (0–17) | (16–49) | (2–16) | |
| P25,50,75 | (3–5–6) | (3–4–5) | (6–9–11) | (32–35–37) | (8–9–11) | |
| University | Mean (SD) | 4.2 (1.7) | 4.1 (1.7) | 8.9 (3.2) | 35.0 (4.2) | 9.4 (2.0) |
| Min–Max | (0–9) | (0–9) | (0–18) | (16–49) | (3–15) | |
| P25,50,75 | (3–4–5) | (3–4–5) | (7–9–11) | (32–35–38) | (8–9–11) | |
| Total | ||||||
| Mean (SD) | 4.3 (1.7) | 4.1 (1.8) | 8.8 (3.2) | 34.6 (4.3) | 9.4 (2.1) | |
| Min–Max | (0–9) | (0–9) | (0–18) | (11–49) | (2–16) | |
| P25,50,75 | (3–4–5) | (3–4–5) | (7–9–11) | (32–34–37) | (8–9–11) | |
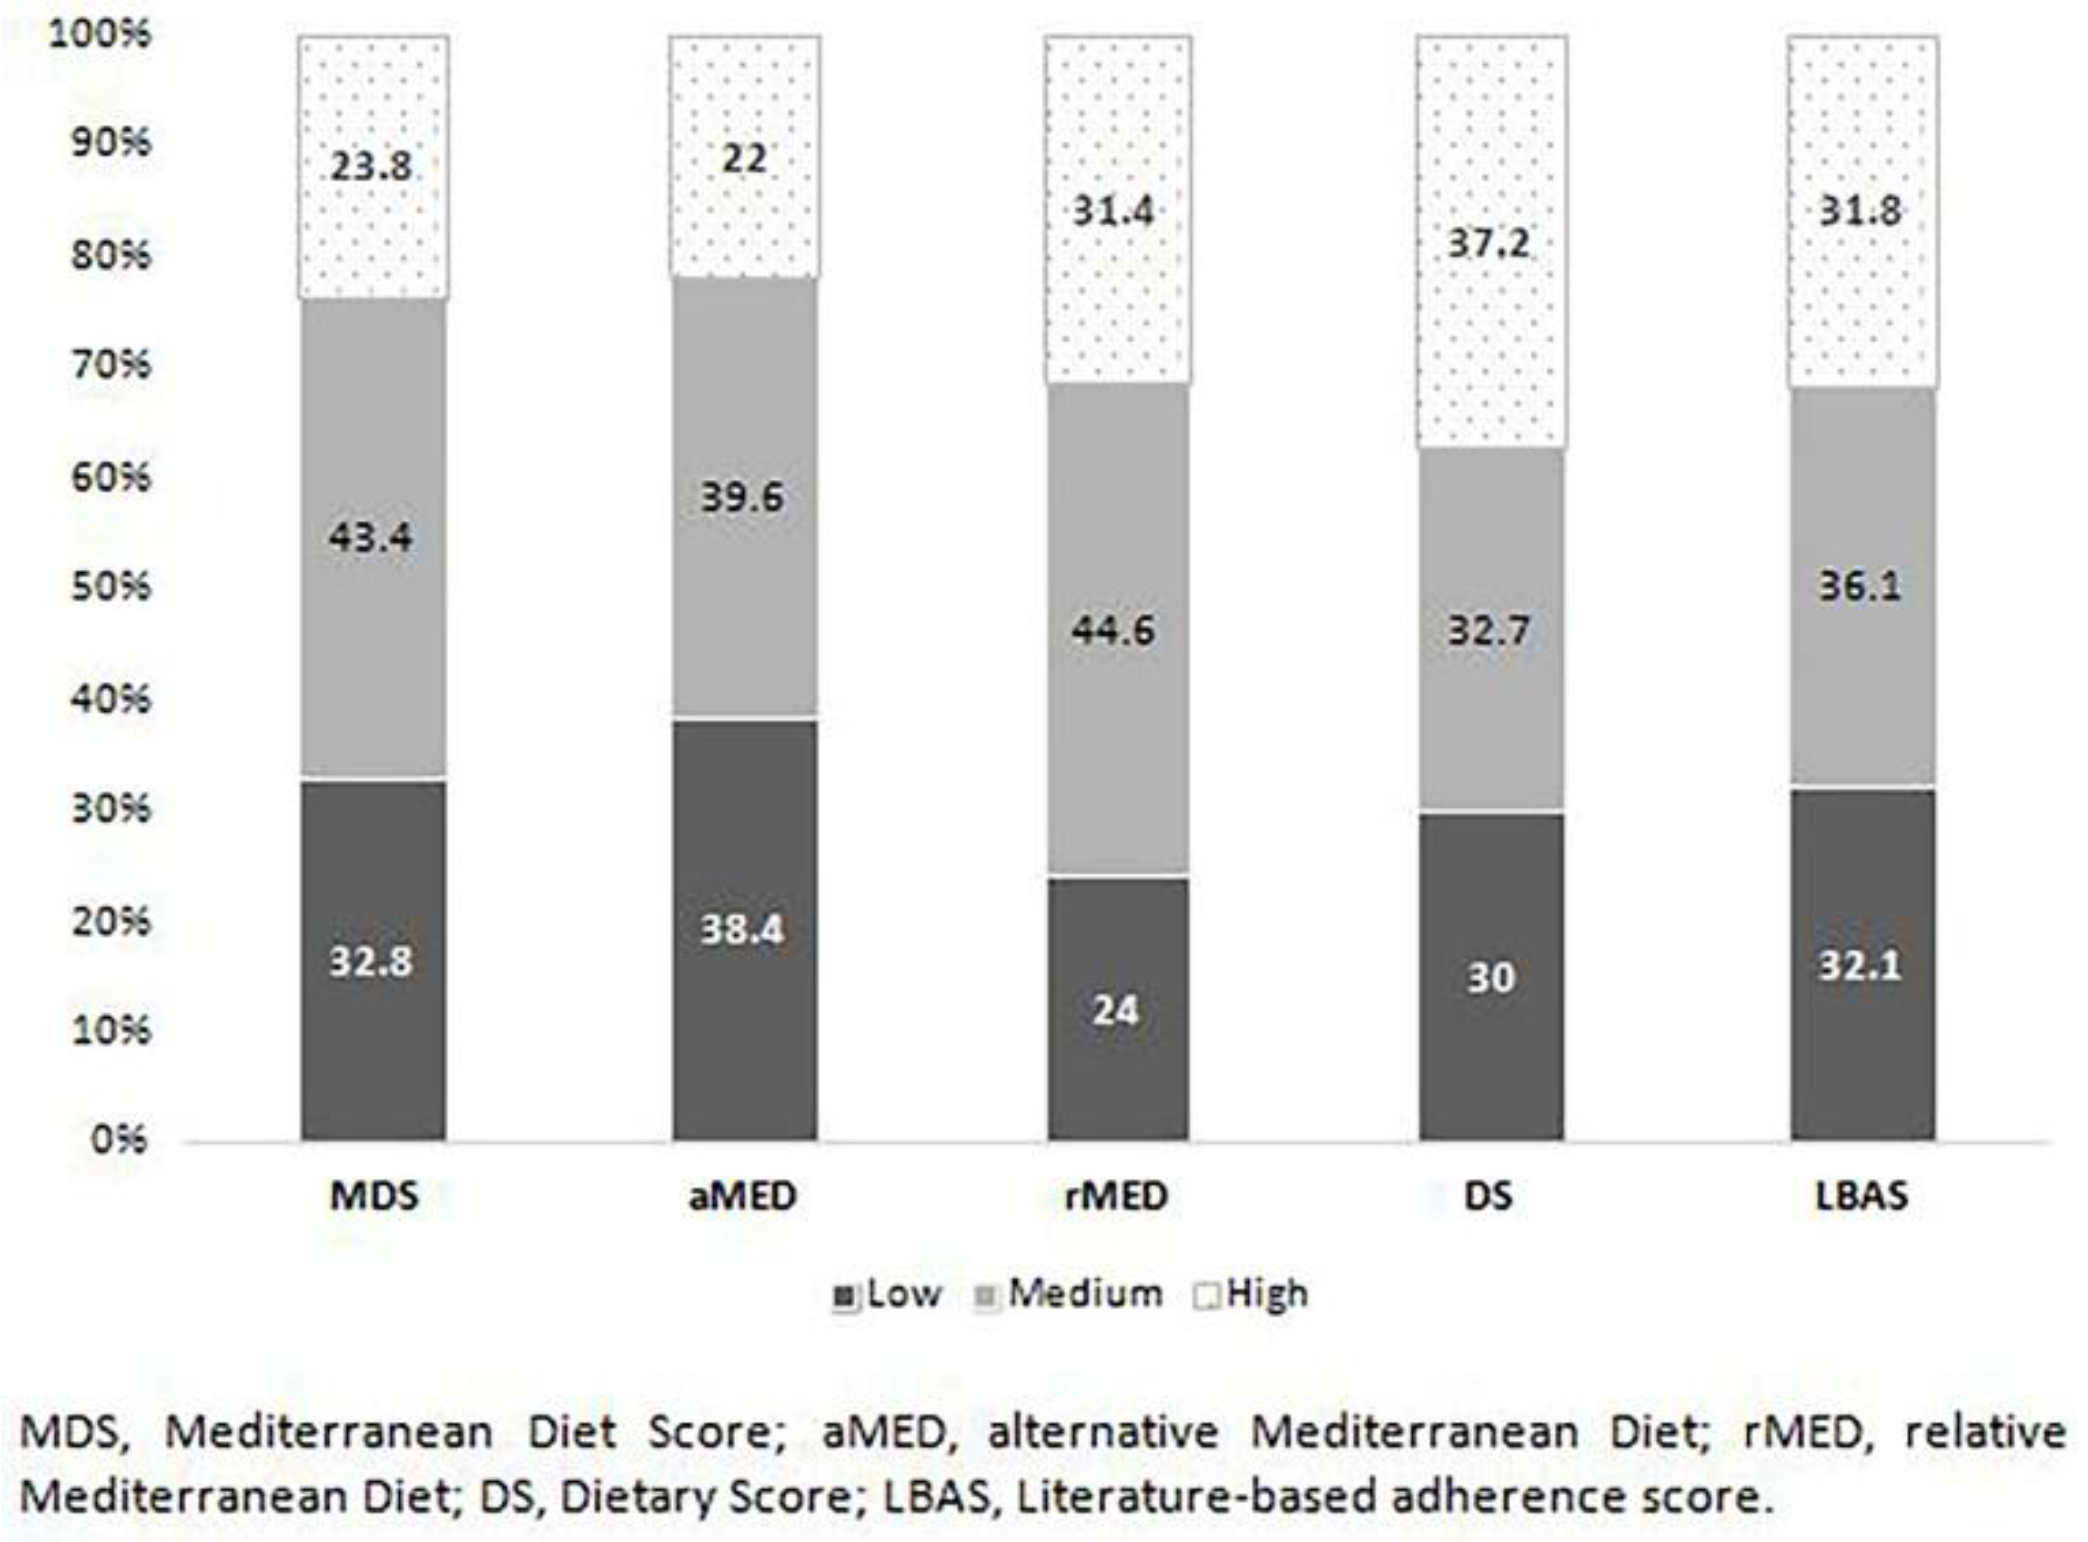
| Low Adherence | Medium Adherence | High Adherence | |||||||||||
|---|---|---|---|---|---|---|---|---|---|---|---|---|---|
| Indexes | aMED | DS | rMED | LBAS | aMED | DS | rMED | LBAS | aMED | DS | rMED | LBAS | |
| n (%) | n (%) | n (%) | n (%) | n (%) | n (%) | n (%) | n (%) | n (%) | n (%) | n (%) | n (%) | ||
| Low | 935 (78.2) | 580 (48.5) | 569 (47.6) | 751 (62.8) | 250 (20.9) | 368 (30.8) | 535 (44.7) | 367 (30.7) | 11 (0.92) | 248 (20.7) | 92 (7.7) | 78 (6.5) | |
| MDS | Medium | 443 (28.1) | 417 (26.4) | 287 (18.2) | 374 (23.7) | 896 (56.8) | 555 (35.2) | 781 (49.5) | 727 (46.1) | 239 (15.1) | 606 (38.4) | 510 (32.3) | 477 (30.2) |
| High | 20 (2.3) | 97 (11.2) | 19 (2.2) | 43 (5.0) | 294 (33.9) | 267 (30.8) | 307 (35.4) | 219 (25.3) | 552 (63.7) | 502 (58.0) | 540 (62.4) | 604 (69.7) | |
| Low | 837 (71.7) | 588 (50.3) | 523 (44.8) | 289 (24.7) | 326 (27.9) | 496 (42.5) | 42 (3.6) | 254 (21.7) | 149 (12.8) | ||||
| LBAS | Medium | 440 (33.5) | 346 (26.3) | 267 (20.3) | 650 (49.5) | 483 (36.8) | 638 (48.6) | 223 (16.9) | 484 (36.9) | 408 (31.1) | |||
| High | 121 (10.4) | 160 (13.8) | 85 (7.3) | 501 (43.2) | 381 (32.9) | 489 (42.2) | 537 (46.3) | 618 (53.3) | 585 (50.5) | ||||
| Low | 629 (71.9) | 442 (50.5) | 220 (25.1) | 239 (27.3) | 26 (3.0) | 194 (22.2) | |||||||
| rMED | Medium | 635 (39.1) | 461 (28.4) | 717 (44.2) | 544 (33.5) | 271 (16.7) | 618 (38.1) | ||||||
| High | 134 (11.7) | 191 (16.7) | 503 (44.1) | 407 (35.6) | 505 (44.2) | 544 (47.6) | |||||||
| Low | 706 (64.5) | 327 (29.9) | 61 (5.6) | ||||||||||
| DS | Medium | 430 (36.1) | 523 (43.9) | 237 (19.9) | |||||||||
| High | 262 (19.3) | 590 (43.5) | 504 (37.2) | ||||||||||
| Indexes | aMED | rMED | DS | LBAS | |
|---|---|---|---|---|---|
| Correlation coefficient (95% CI) | 0.75 (0.74–0.77) | 0.56 (0.55–0.59) | 0.42 (0.40–0.45) | 0.65 (0.63–0.67) | |
| MDS | KAPPAa | 0.56 (0.55–0.59) | 0.37 (0.36–0.39) | 0.25 (0.24–0.27) | 0.45 (0.44–0.47) |
| KAPPA^2b | 0.67 (0.66–0.68) | 0.49 (0.48–0.51) | 0.33 (0.31–0.35) | 0.56 (0.55–0.58) | |
| Correlation coefficient (95% CI) | 1 | 0.56 (0.54–0.59) | 0.52 (0.49–0.54) | 0.62 (0.60–0.64) | |
| aMED | KAPPAa | 0.36 (0.35–0.37) | 0.30 (0.28–0.32) | 0.43 (0.42–0.45) | |
| KAPPA^2b | 0.47 (0.45–0.49) | 0.39 (0.37–0.40) | 0.53 (0.52–0.56) | ||
| Correlation coefficient (95% CI) | 1 | 0.35 (0.32–0.38) | 0.49 (0.46–0.51) | ||
| rMED | KAPPAa | 0.19 (0.18–0.21) | 0.30 (0.29–0.32) | ||
| KAPPA^2b | 0.26 (0.25–0.28) | 0.40 (0.38–0.42) | |||
| Correlation coefficient (95% CI) | 1 | 0.45 (0.42–0.47) | |||
| DS | KAPPAa | 0.26 (0.25–0.28) | |||
| KAPPA^2b | 0.33 (0.30–0.36) |
© 2019 by the authors. Licensee MDPI, Basel, Switzerland. This article is an open access article distributed under the terms and conditions of the Creative Commons Attribution (CC BY) license (http://creativecommons.org/licenses/by/4.0/).
Share and Cite
Olmedo-Requena, R.; González-Donquiles, C.; Dávila-Batista, V.; Romaguera, D.; Castelló, A.; Molina de la Torre, A.J.; Amiano, P.; Dierssen-Sotos, T.; Guevara, M.; Fernández-Tardón, G.; et al. Agreement among Mediterranean Diet Pattern Adherence Indexes: MCC-Spain Study. Nutrients 2019, 11, 488. https://doi.org/10.3390/nu11030488
Olmedo-Requena R, González-Donquiles C, Dávila-Batista V, Romaguera D, Castelló A, Molina de la Torre AJ, Amiano P, Dierssen-Sotos T, Guevara M, Fernández-Tardón G, et al. Agreement among Mediterranean Diet Pattern Adherence Indexes: MCC-Spain Study. Nutrients. 2019; 11(3):488. https://doi.org/10.3390/nu11030488
Chicago/Turabian StyleOlmedo-Requena, Rocío, Carmen González-Donquiles, Verónica Dávila-Batista, Dora Romaguera, Adela Castelló, Antonio José Molina de la Torre, Pilar Amiano, Trinidad Dierssen-Sotos, Marcela Guevara, Guillermo Fernández-Tardón, and et al. 2019. "Agreement among Mediterranean Diet Pattern Adherence Indexes: MCC-Spain Study" Nutrients 11, no. 3: 488. https://doi.org/10.3390/nu11030488