Next Article in Journal
γ-Oryzanol Improves Cognitive Function and Modulates Hippocampal Proteome in Mice
Next Article in Special Issue
Body Shape Index Is a Stronger Predictor of Diabetes
Previous Article in Journal
Uroguanylin Improves Leptin Responsiveness in Diet-Induced Obese Mice
Previous Article in Special Issue
Congruent Validity of Resting Energy Expenditure Predictive Equations in Young Adults
 
 
nutrients-logo
Article Menu

Article Menu

Article

Nut Consumptions as a Marker of Higher Diet Quality in a Mediterranean Population at High Cardiovascular Risk

by
Maria del Mar Bibiloni
1,2,3,
Alicia Julibert
1,2,3,
Cristina Bouzas
1,2,3,
Miguel A. Martínez-González
1,4,5,
Dolores Corella
1,6,
Jordi Salas-Salvadó
1,7,
M. Dolors Zomeño
8,9,
Jesús Vioque
10,11,
Dora Romaguera
1,3,
J. Alfredo Martínez
1,12,13,
Julia Wärnberg
1,14,
José López-Miranda
1,15,
Ramón Estruch
1,16,
Aurora Bueno-Cavanillas
10,17,
Fernando Arós
1,18,
Francisco Tinahones
1,19,
Lluis Serra-Majem
1,20,
Vicente Martín
10,21,
José Lapetra
1,22,
Clotilde Vázquez
1,23,
Xavier Pintó
1,24,
Josep Vidal
25,26,
Lidia Daimiel
27,
Miguel Delgado-Rodríguez
11,28,
Pilar Matía
29,
Emilio Ros
1,30,
Rebeca Fernández-Carrión
1,6,
Antonio Garcia-Rios
1,15,
M. Angeles Zulet
1,12,
Domingo Orozco-Beltrán
10,11,
Helmut Schröder
8,11,
Montserrat Fitó
1,8,
Mónica Bulló
1,7,
Josep Basora
1,7,
Juan Carlos Cenoz
1,4,
Javier Diez-Espino
1,4,
Estefanía Toledo
1,4 and
Josep A. Tur
1,2,3,*
add Show full author list
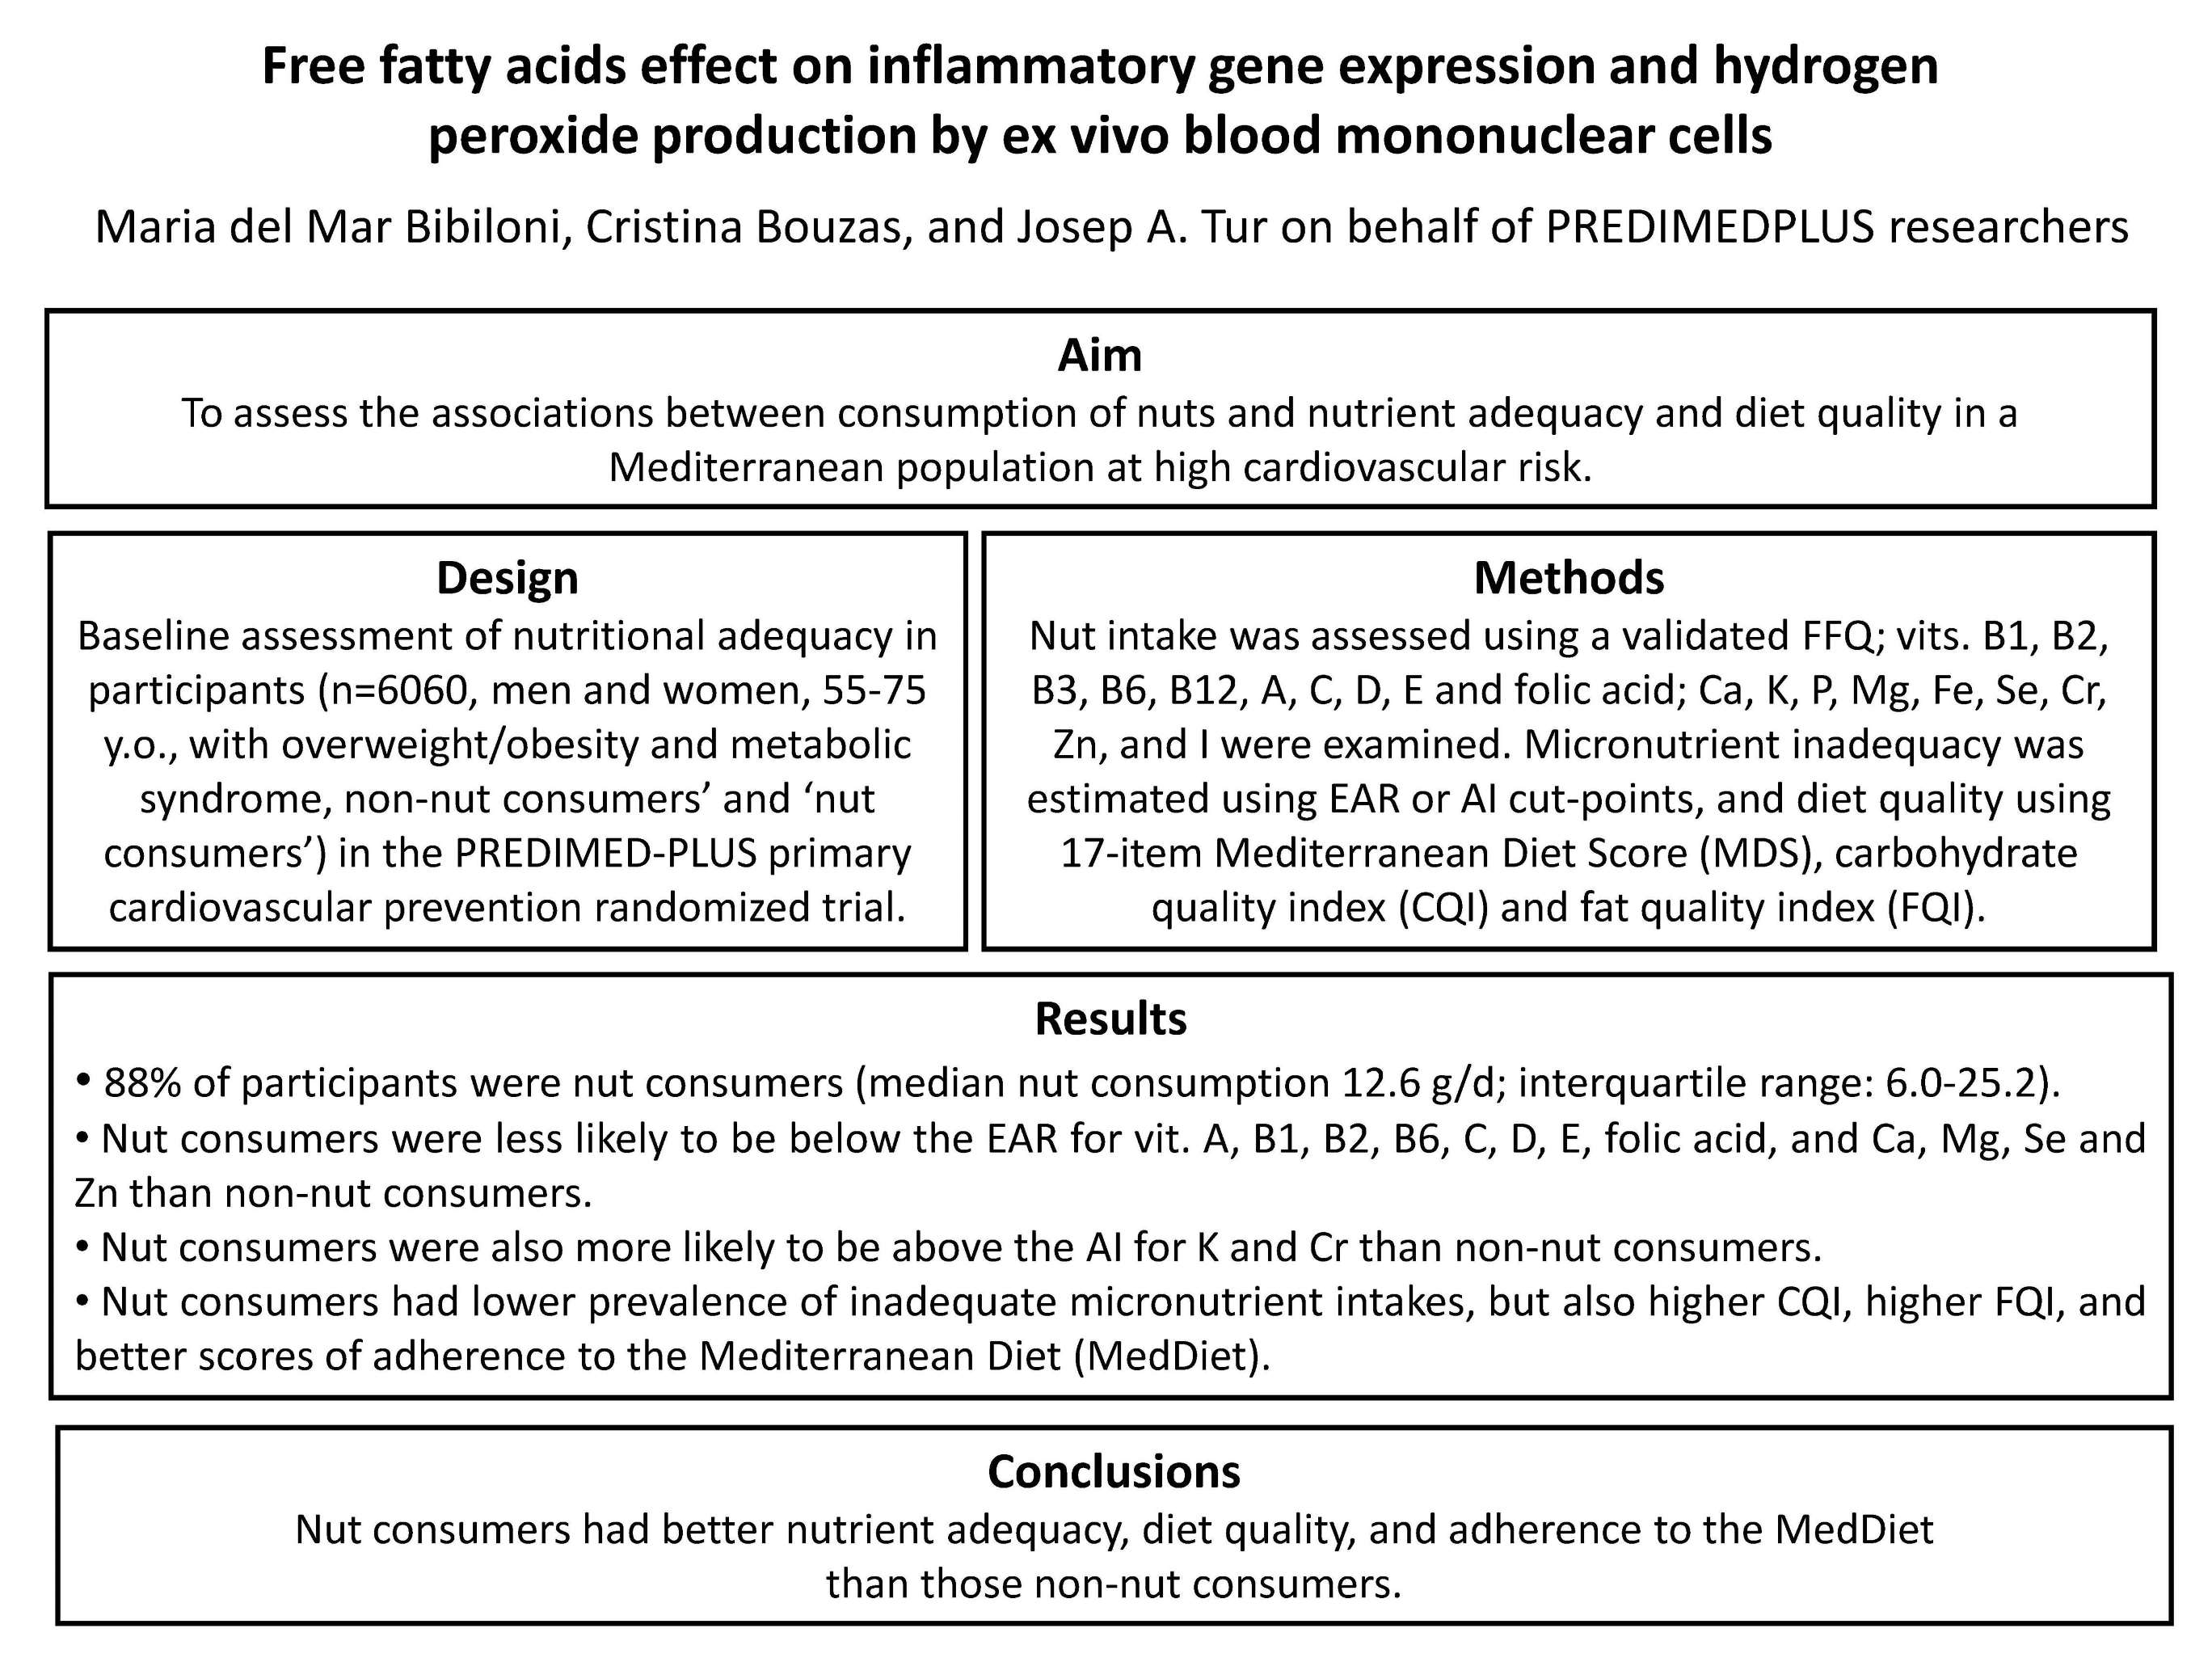
 remove Hide full author list
1
CIBER Fisiopatología de la Obesidad y Nutrición (CIBEROBN), Instituto de Salud Carlos III (ISCIII), 28029 Madrid, Spain
2
Research Group on Community Nutrition and Oxidative Stress, University of Balearic Islands, 07122 Palma de Mallorca, Spain
3
Health Research Institute of the Balearic Islands (IdISBa), 07120 Palma de Mallorca, Spain
4
Department of Preventive Medicine and Public Health, University of Navarra-IDISNA, 31008 Pamplona, Spain
5
Department of Nutrition, Harvard T. H. Chan School of Public Health, Boston, MA 02115, USA
6
Department of Preventive Medicine, University of Valencia, 46010 Valencia, Spain
7
Human Nutrition Unit, Biochemistry and Biotechnology Department, IISPV, Universitat Rovira i Virgili, 43201 Reus, Spain
8
Cardiovascular Risk and Nutrition Research Group (CARIN), Hospital del Mar Medical Research Institute (IMIM), 08003 Barcelona, Spain
9
Human Nutrition Unit, Blanquerna-Ramon Llull University, 08022 Barcelona, Spain
10
Miguel Hernandez University, ISABIAL-FISABIO, 46020 Alicante, Spain
11
CIBER Epidemiología y Salud Pública (CIBERESP), Instituto de Salud Carlos III (ISCIII), 28029 Madrid, Spain
12
Department of Nutrition, Food Sciences, and Physiology, Center for Nutrition Research, University of Navarra, 31008 Pamplona, Spain
13
Cardiometabolics Nutrition Group, IMDEA Food, CEI UAM + CSIC, 28049 Madrid, Spain
14
School of Nursing, School of Health Sciences, University of Málaga-IBIMA, 29010 Málaga, Spain
15
Lipids and Atherosclerosis Unit, Department of Internal Medicine, Maimonides Biomedical Research Institute of Cordoba (IMIBIC), Reina Sofia University Hospital, University of Cordoba, 14004 Córdoba, Spain
16
Department of Internal Medicine, IDIBAPS, Hospital Clinic, University of Barcelona, 08036 Barcelona, Spain
17
Department of Preventive Medicine, University of Granada, 18016 Granada, Spain
18
Department of Cardiology, OSI ARABA, University Hospital Araba, University of the Basque Country UPV/EHU, 01006 Vitoria-Gasteiz, Spain
19
Department of Endocrinology, Virgen de la Victoria Hospital, University of Málaga, 29010 Málaga, Spain
20
Institute for Biomedical Research, University of Las Palmas de Gran Canaria, 35001 Las Palmas, Spain
21
Institute of Biomedicine (IBIOMED), University of León, 24071 León, Spain
22
Department of Family Medicine, Research Unit, Distrito Sanitario Atención Primaria Sevilla, 41013 Sevilla, Spain
23
Department of Endocrinology, Fundación Jiménez-Díaz, 28040 Madrid, Spain
24
Lipids and Vascular Risk Unit, Internal Medicine, Hospital Universitario de Bellvitge, Hospitalet de Llobregat, 08907 Barcelona, Spain
25
Department of Endocrinology, IDIBAPS, Hospital Clinic, University of Barcelona, 08036 Barcelona, Spain
26
CIBER Diabetes y Enfermedades Metabólicas (CIBERDEM), Instituto de Salud Carlos III (ISCIII), 28029 Madrid, Spain
27
Nutritional Genomics and Epigenomics Group, IMDEA Food, CEI UAM + CSIC, 28049 Madrid, Spain
28
Department of Health Sciences, University of Jaen, 23071 Jaen, Spain
29
Department of Endocrinology and Nutrition, Instituto de Investigación Sanitaria Hospital Clínico San Carlos (IdISSC), 28040 Madrid, Spain
30
Lipid Clinic, Department of Endocrinology and Nutrition, Institut d’Investigacions Biomèdiques August Pi Sunyer (IDIBAPS), Hospital Clínic, 08036 Barcelona, Spain
*
Author to whom correspondence should be addressed.
Nutrients 2019, 11(4), 754; https://doi.org/10.3390/nu11040754
Submission received: 13 February 2019 / Revised: 20 March 2019 / Accepted: 28 March 2019 / Published: 30 March 2019

Abstract

:
Background: Nut consumption has been associated with improved nutrient adequacy and diet quality in healthy adult populations but this association has never been explored in individuals at high cardiovascular risk. Objective: to assess the associations between consumption of nuts and nutrient adequacy and diet quality in a Mediterranean population at high cardiovascular risk. Design: baseline assessment of nutritional adequacy in participants (n = 6060, men and women, with ages 55–75 years old, with overweight/obesity and metabolic syndrome) in the PREDIMED-PLUS primary cardiovascular prevention randomized trial. Methods: nut intake was assessed using a validated food frequency questionnaire. Participants who reported consuming zero quantity of nuts were classified as ‘non-nut consumers’. ‘Nut consumers’ were participants who reported consuming any quantity of nuts. Nineteen micronutrients were examined (vitamins B1, B2, B3, B6, B12, A, C, D, E and folic acid; Ca, K, P, Mg, Fe, Se, Cr, Zn, and iodine). The proportion of micronutrient inadequacy was estimated using the estimated average requirements (EAR) or adequate intake (AI) cut-points. Diet quality was also assessed using a 17-item Mediterranean dietary questionnaire (Mediterranean diet score, MDS), a carbohydrate quality index (CQI) and a fat quality index (FQI). Results: eighty-two percent of participants were nut consumers (median of nut consumption 12.6 g/day; interquartile range: 6.0–25.2). Nut consumers were less likely to be below the EAR for vitamins A, B1, B2, B6, C, D, E, folic acid, and Ca, Mg, Se and Zn than non-nut consumers. Nut consumers were also more likely to be above the AI for K and Cr than non-nut consumers. Nut consumers had lower prevalence of inadequate micronutrient intakes, but also higher CQI, higher FQI, and better scores of adherence to the Mediterranean diet (Mediterranean diet score, MDS). Conclusions: nut consumers had better nutrient adequacy, diet quality, and adherence to the MedDiet than those non-nut consumers.

Graphical Abstract

1. Introduction

The Mediterranean diet (MedDiet) is a pattern with high nutritional quality. It has been demonstrated that higher levels of adherence to a Mediterranean dietary pattern are associated with a reduced risk of inadequate nutrient intake [1,2]. Recently, nut consumption (i.e., peanuts, almonds, hazelnuts, walnuts, pine nuts, pistachios, Brazil nuts, macadamia and cashews), a key food of the MedDiet, has been reported to be associated with an improvement in nutrient intakes but also with better overall nutrient adequacy and diet quality in adult populations [3,4,5,6]. In particular, in the National Health and Nutrition Examination Survey (NHANES) 1999–2004 data, the diets of tree nut consumers contained greater amounts of dietary fiber, vitamin E, Ca, Mg and K and lower amounts of Na compared to non-consumers [3]. In addition, in the NHANES 2005–2010, using the Healthy Eating Index-2005, diet quality was found to be higher in nut consumers [6]. In the New Zealand Adult Nutrition Survey (NZANS) 2008/09 data, the diets of whole nut consumers contained greater energy and percentage of energy total fat, monounsaturated fatty acids (MUFA) and polyunsaturated fatty acids (PUFA), and greater amounts of dietary fiber, vitamin E, folate, Cu, Mg, K, P and Zn, whereas energy from saturated fatty acid (SFA) and carbohydrate, and intakes of cholesterol and vitamin B12 were significantly lower compared with non-whole nut consumers [6].
Nuts have high contentof MUFA and PUFA, soluble fiber, vitamins (e.g., folate and vitamin E), minerals (e.g., Ca, Mg, Cu, Zn, Se and K) and bioactive compounds (e.g., phytosterols, antioxidants and phenolic compounds), which independently or jointly confer health benefits, and frequent consumption was associated to a lower risk of all-cause and cause-specific mortality, with the strongest reduction for coronary heart disease mortality [7]. Frequent nut consumption could play a role in reducing the risk of cardiovascular risk disease [8,9,10,11]. However, a limited number of studies have examined associations between nut consumption and nutrient intakes or diet quality [3,4,5,6]. None have investigated these associations in a Mediterranean population at high cardiovascular risk. Our hypothesis is that consumption of nuts is going to increase nutrient adequacy, diet quality and adherence to Mediterranean diet. Then, our aim was to assess the associations between consumption of nuts and nutrient adequacy and diet quality in a Mediterranean population at high cardiovascular risk.

2. Materials and Methods

2.1. Study Design

The present study was a cross-sectional analysis on baseline data within the frame of the PREDIMED-PLUS study, a six-year multicentre, parallel-group, randomised trial conducted in Spain to assess the effect on cardiovascular disease morbimortality of an intensive weight loss intervention programme based on an energy-restricted traditional MedDiet (erMedDiet), physical activity promotion and behavioural support, in comparison with an usual care intervention only with energy-unrestricted MedDiet (control group). Details on the study protocol can be found elsewhere [12] and at http://predimedplus.com/. The trial was registered in 2014 at the International Standard Randomized Controlled Trial (ISRCT; http://www.isrctn.com/ISRCTN89898870) with number 89898870.

2.2. Participants, Recruitment and Randomization

Eligible participants were community-dwelling adults (aged 55–75 in men; 60–75 in women), who were overweight or obese (body mass index (BMI) ≥ 27 and <40 kg/m2) and met at least three criteria for the metabolic syndrome (MetS) according to the updated harmonized criteria of the International Diabetes Federation and the American Heart Association and National Heart, Lung and Blood Institute [13].
From 5 September 2013 to 31 October 2016, a total of 6874 participants were recruited in 23 Spanish centres (universities, hospitals and research institutes).
All participants provided written informed consent, and the study protocol and procedures were approved according to the ethical standards of the Declaration of Helsinki by all the participating institutions.

2.3. Dietary Assessment

Registered dietitians collected data on dietary intake at baseline with a semiquantitative 137-item food frequency questionnaire (FFQ), repeatedly validated in Spain [14]. Detailed information about the development, reproducibility and validity of FFQ in the PREDIMED cohort has been previously reported [15,16]. For each item, a typical portion size was included and consumption frequencies were registered in nine categories that ranged from “never or almost never” to “≥6 times/day”. Energy and nutrient intakes were calculated as frequency multiplied by nutrient composition of specified portion size for each food item, using a computer program based on available information in Spanish food composition tables [17,18,19]. We also considered for the total nutrient intake the average intake of micronutrients from dietary supplements, declared by participants in the FFQ. Participants reporting extreme total energy intakes (<500 or >3.500 kcal/day in women or <800 or >4.000 kcal/day in men) or outliers for micronutrient intake (at three or more standard deviations (SD) from both sides of the mean) were excluded from the analysis [2]. The final sample in the present study included 6060 subjects (3118 men and 2942 women) who had available data on nutrient intake.

2.4. Determination of Nut Consumption

For the purpose of this study, nut consumption was assessed using the FFQ data, and total nut consumption comprised of the following four categories: almonds, pistachios, walnuts, and other nuts. Participants who reported consuming zero quantity of nuts in their FFQ were classified as ‘non-nut consumers’ (n = 1091), and ‘nut-consumers’ (n = 4969) were participants who reported consuming any quantity of nuts. ‘Nut-consumers’ were also categorized into quintiles (Q1: <4.2 g/day, n = 911; Q2: 4.2–8.3 g/day, n = 1058; Q3: 8.4–14.5 g/day, n = 868; Q4: 14.6–29.3, n = 1093; Q5: ≥29.4 g/day, n = 1039).

2.5. Determination of Micronutrients Intake

The micronutrients examined were vitamins B1, B2, B3, B6, B12, C, A, D, E and folic acid, and Zn, iodine, Se, Fe, Ca, K, P, Mg, and Cr. We used the dietary references intakes (DRIs) values proposed by Institute of Medicine [17], that are quantitative estimates of nutrient intakes to be used for assessing and planning diets for healthy people and included four different values: estimated average requirements (EAR), recommended daily allowances (RDA), adequate intake (AI) (i.e., values for nutrients having undetermined RDA), and tolerable upper level (UL) values. We estimated the prevalence of inadequate micronutrients intake according to sex and age by using the EAR cut-point, except for K and Cr intakes, whose prevalence was evaluated based on AI cut-point [18,19].
The carbohydrate (CHO) quality index (CQI) and the fat quality index (FQI) were calculated as previously described [2,20]. Briefly, the CQI was defined summing up quintiles of the following four criteria: dietary fiber intake (g per day, positively weighted), glycemic index (negatively weighted), ratio whole grains/total grains (positively weighted), and finally, ratio solid CHO/(solid CHO + liquid CHO) (positively weighted). Solid CHO intake included all CHO containing solid foods, and liquid CHO intake included sugar-sweetened beverages and fruit juice. For each of these four components, we categorized participants into quintiles and received a value (ranging from one to five) according to each quintile (for GI, those in the fifth quintile received one point and those in the first quintile received five points). Finally, we constructed the CQI summing all values. All criteria had the same weighting, and the CQI ranged from four to 20. On the other hand, the FQI was calculated using the ratio (MUFA + PUFA)/(SFA + trans fatty acid [TFA]) as a continuous variable.
Registered dietitians also administered a 17-item Mediterranean dietary questionnaire, a modified version of the previously validated questionnaire used in the PREDIMED trial [21], designed to assess adherence to the Mediterranean diet. Compliance with each of the 17 food habits reflecting a Mediterranean diet was scored with one point, and zero points otherwise. Therefore, a score ranging from 0–17 points, with 0 meaning no adherence and 17 meaning maximum adherence to the Mediterranean diet (Mediterranean diet score (MDS)) was developed.

2.6. Physical Activity

Physical activity was measured using the validated Minnesota-REGICOR short physical activity questionnaire [22,23,24] and the validated Spanish version of the nurses’ health study questionnaire to assess sedentary behaviours [25]. In dietary assessment according to physical activity variables, participants who had not responded to all of the physical activity questionnaires (n = 14) and participants reporting outliers for total physical activity expressed as MET·min/week (at three or more SD from the mean for each sex) were excluded and 5742 participants were included in the analysis (2981 men and 2761 women).

2.7. Anthropometric and Blood Pressure Measurements

Anthropometric variables were measured by trained personnel according to the PREDIMED-PLUS protocol. Weight and height were measured with high-quality electronic calibrated scales and a wall-mounted stadiometer, respectively. The body mass index was calculated as weight in kilograms divided by the square of height in meters. Waist circumference was measured halfway between the last rib and the iliac crest by using an anthropometric tape. Blood pressure was measured in triplicate with a validated semi-automatic oscillometer (Omron HEM-705CP, the Netherlands) after five minutes of rest in-between measurements while the participant was in a seated position. All anthropometric variables were determined in duplicate, except for blood pressure (in triplicate).

2.8. Blood Collection and Analysis

Blood samples were collected after an overnight fast and biochemical analyses were performed on fasting plasma glucose, total cholesterol, high density lipoprotein (HDL)-cholesterol and triglyceride concentrations in local laboratories using standard enzymatic methods.

2.9. Other Health Variables

Information related to individual medical history, current medication use and smoking status were also obtained.

2.10. Statistical Analyses

Analyses were performed with the SPSS statistical software package version 25.0 (SPSS Inc., Chicago, IL, USA). Data are shown as mean, standard deviation (SD) or, median and interquartile range (IQR). Difference in means between the two comparison groups were tested by an unpaired Students’ t-test. Differences in means between the quintiles of nut consumption were tested by one-way ANOVA with Bonferroni post-hoc test. The difference in prevalence across nut consumers and non-nut consumers was examined using χ2 (all p values are two-tailed). We have also defined the cut-off ≥6 and ≥8 unmet DRI according to the number of nutrients unmet. Thus, six and eight unmet DRI of all nutrients examined as previously described. Logistic regression analyses with the calculation of corresponding odds ratio (OR) and the 95% confidence interval (95% CI) were used to examine the association between unmet DRI in ≥6 or ≥8 items (dependent variables) and nut consumption (independent variable). Univariate analysis was first carried out for the two different cut-offs (crude OR). Secondly, results were adjusted for sex, energy intake (continuous variable) and physical activity (continuous variable, expressed as MET·min/week) to control for potential confounding. Thirdly, results were adjusted for sex, energy intake (continuous variable), total fat intake (continuous variable, expressed as % of total energy intake), MDS (continuous variable) and physical activity (continuous variable, expressed as MET·min/week). Results were considered statistically significant if p-value (two-tailed) <0.05.

3. Results

Overall, 82.0% of participants were nut consumers (83.6% of men and 80.3% of women, p = 0.001); the median of nut consumption was 12.6 g/day (IQR: 6.0, 25.2). Table 1 shows the comparison of diet quality and lifestyle characteristics between the two study groups. Nut consumers had higher intakes of energy, solid CHO, total fat, PUFA, MUFA, cholesterol and fibre intake, but lower intakes of total CHO than non-nut consumers. No statistically significant differences were found in intakes of liquid CHO, SFA and TFA. Usual intake of fruits, vegetables, legumes, olive oil, total fish and total meat were all higher in nut consumers compared with non-nut consumers. Nut consumers had also lower usual intake of dairy products than non-nut consumers. No statistically significant differences were found in usual intake of total cereals, cookies and alcohol between the two comparison groups. Nut consumers had lower glycaemic index and higher CQI and FQI than non-nut consumers. They also had a higher MDS (even when nuts were not included in the MDS: 7.7 ± 2.6 g/day for non-nut consumers and 8.1 ± 2.5 g/day for not consumers, p < 0.001; data not shown). On the other hand, nut consumers had lower BMI and reported higher total physical activity (expressed as MET·min/week). Statistically significant differences in smoking habit were also found between the two nut groups. Finally, no statistically significant differences in MetS components were found between the two groups.
Table 2 shows usual intake of vitamins and minerals. Nut consumers had higher intakes of all vitamins (B1, B2, B3, B6, B12, C, A, D, E and folic acid) and minerals (Zn, Se, Fe, Ca, K, P, Mg, and Cr) examined in the present study, except for iodine. Table 2 also shows that nut consumers were less likely to be below the EAR for vitamins A, B1, B2, B6, C, D, E and folic acid, Ca, Mg, Se and Zn than non-nut consumers. Furthermore, results showed a percent below the EAR equal or below 10% for vitamins B1, B2, B3, B6, B12 and C, and P, Fe, Se, Zn and iodine (only in nut consumers); a prevalence between 11 and 20% for vitamin A and Mg in nut consumers, and for iodine in non-nut consumers; a prevalence above 21% for vitamin D, vitamin E, folic acid and Ca in both groups, and for vitamin A and Mg in non-nut consumers. Nut consumers were also more likely to be above the AI for K and Cr than non-nut consumers. No statistically significant differences in vitamin B3, vitamin B12, P or Fe were found between the two groups.
Usual intake of vitamins and minerals of the nut consumers as per quintiles of nut consumption were also assessed (Table 3). Intakes of all vitamins and minerals (except for iodine) increased when increased quintiles of nut consumption. Participants in the highest quintile of nut consumption were less likely to be below the EAR for vitamins A, B1, B2, B6, C, D, E and folic acid, Ca, Mg, and Zn. Participants in the highest quintile of nut consumption were also more likely to be above the AI for K and Cr. No statistically significant differences in vitamins B3 and B12, P, Fe, Se and iodine were found between the quintiles of nut consumption.
Finally, the average number of nutrients for which the DRIs were unmet was 4.4 (SD: 1.7) in nut-consumers and 5.2 (SD: 2.0) in non-nut consumers (p < 0.001) (difference = 0.9, 95% CI: 0.7, 1.0). Moreover, the average number of nutrients for which the DRIs were unmet was also lower for participants in the fifth quintile (Q5, n = 1039) of nut consumption (3.6, SD: 1.3) than for participants in the first quintile (Q1, n = 911) of nut consumption (5.0, SD: 1.9) (difference = 1.4, 95% CI: 1.2, 1.5) (Figure 1). Nut consumers were also less likely to have unmet DRI ≥6 and ≥8 than non-nut consumers in crude and multivariable-adjusted analyses (except for DRI ≥8 analysis when results were adjusted for sex, energy intake, MDS, and physical activity; p = 0.132) (Table 3). The nut consumption median for unmet ≥6 and ≥8 DRIs was 8.0 (IQR: 4.0, 14.6) in both cases; and for unmet <6 and <8 DRIs was 12.6 g/day in both cases (IQR: 6.0, 27.4 and 6.0, 25.2, respectively) (Table 4).

4. Discussion

In the present study nutrient adequacy and diet quality was better in nut consumers than in non-consumers. This study also confirmed that nut consumption was associated with better adherence to the MedDiet (MDS) than that observed in their non-consumers counterparts. Furthermore, nut consumers had lower BMI [26], were more likely to be physically active and less likely to smoke than non-nut consumers. A novelty of the present study is that it investigated these associations in a Mediterranean population at high cardiovascular risk. Moreover, nut consumers (82%) were higher in this study than in previous reports, such as the NHANES 2005–2010 (n = 14386; nut consumers: 5.2%) [4], the NHANES 2001–2010 (n = 24,808; almond consumers: 1.6%) [5] and the NZANS 2008/09 (n = 4721; nut consumers: 28.9%) [6]; however, the median of nut consumption was only 12.6 g/day (IQR: 6.0, 25.2).
This study showed that nut consumers were less likely to be below the EAR for some nutrients and above the AI for others than non-nut consumers. Moreover, higher nut consumers showed better compliance with the nutritional recommendations for micronutrients. Previously, Roman–Viñas et al. [27] analyzed the prevalence of inadequate intakes of several micronutrients (vitamins B12, C, and D; folic acid, Ca, Fe, Se, iodine and Cu) in European adult (19–64 years) and elderly (>64 years) populations. In their study, Roman–Viñas et al. [27] showed a prevalence of inadequacy equal or below 10% for Zn, Fe, and vitamin B12 (only in the elderly population); a prevalence between 11–20% for Cu in the adult and elderly populations, for vitamin B12 in the adult population, and for vitamin C in the elderly Europeans; and a prevalence above 21% for vitamin D, vitamin C (only in the adult population), folic acid, Ca, Se, and iodine [27]. Nevertheless, to our knowledge, only two studies conducted by O’Neil et al. [4,5] using NHANES data have previously examined associations between nut consumption and nutrient adequacy.
O’Neil et al. [4] analyzing data from the NHANES 2005–2010 found a lower prevalence of inadequacy for vitamins A, C and E, folate, Ca, Mg, Fe, Zn and K in nut-consumers than in non-nut consumers. Lately, O’Neil et al. [5] also examined the prevalence of inadequate intakes of a number of micronutrients between almond and non-almond consumers from the NHANES 2001–2010 and found a lower prevalence of inadequacy for vitamins A, B2, C and E, Ca, Mg, P, Zn and Cu in almond consumers than in non-almond consumers [5]. Accordingly, in our study the prevalence of inadequate intakes of vitamins A, B1, B2, B6, C, D and E, folate, Ca, Mg, Se and Zn were lower in nut consumers than in non-nut consumers.
Nuts are rich in vitamin E, folate, Ca and Mg, and in our study the proportions of inadequate intakes for these four micronutrients were high, especially in non-nut consumers, in which the proportions with intakes below the EAR were 37–92%, in comparison with nut consumers, in which the proportions were 20–72%. Accordingly, O’Neil et al. [6] also found a high proportion of non-nut consumers with intakes below the EAR for vitamin E, Ca and Mg (i.e., 94.2%, 44.3% and 60.1%, respectively) in comparison with nut consumers (37.7%, 26.9% and 8.2%, respectively). Previously, Serra-Majem et al. [28], assessing the relationship between nutrient adequacy and a posteriori defined Mediterranean and Western dietary pattern in the Seguimiento Universidad de Navarra (SUN) cohort, also found that 89–94% of participants did not comply with recommended vitamin E intakes. Moreover, the proportions of inadequate intakes for folic acid and Mg were also higher in the first quintile of adherence to the Mediterranean dietary pattern (19% and 21%, respectively) than in the fifth quintile (10% and 2%, respectively) [27]. Recently, Zazpe et al. [2] also found an inverse association between the risk of failing to meet ≥4 DRIs and deciles of adherence to the MedDiet (Mediterranean diet score, MDS) in participants of the SUN cohort.
Most species of nuts have high contents of K (e.g., almonds, pine nuts, pecans). While O’Neil et al. [4,5] studies found a proportion of inadequate intake for K below 12% in both nut and non-nut consumers, in our study the prevalence of inadequacy for K was above 21% in both groups. However, K intake is still below the recommended intakes in our population [17]. Moreover, not only nuts but also fruits, vegetables and dairy products, which were more frequently consumed by nut consumers than non-nut consumers, are high K foods.
Nuts are poor sources of vitamin D. However, in Mediterranean countries, it can be obtained from conversion through the skin stimulated by UV radiation. Therefore, the proportion that should be obtained from food is unknown [1,29]. According to O’Neil’s studies [4,5], its prevalence of inadequacy was also exceptionally very high in both groups (i.e., 86% in nut consumers and 90% in non-nut consumers).
Finally, nut consumers had lower prevalence of inadequate micronutrient intakes (≥6 and ≥8 DRI), but also higher CQI, adherence to the MedDiet (Mediterranean diet score, MDS) and FQI than non-nut consumers. In this line, Sánchez–Tainta et al. [2] have also recently reported lower prevalence of inadequate micronutrient intakes (≥8 DRI) in the highest quintile of CQI or adherence to the MedDiet (Mediterranean Diet Score, MDS), and in the lowest quintile of FQI. Nevertheless, in Spain there is a general thought that nuts can decrease the cardiovascular risk, and nut consumers may also be more conscious of having a MedDiet. Nevertheless, the median consumption of nuts for which the DRIs were unmet <6 and <8 was only 12.6 g/day in both cases (IQR: 6.0, 27.4 and 6.0, 25.2, respectively).

5. Strengths and Limitations of the Study

The strengths of this study are that it used a large Mediterranean sample at high cardiovascular risk and that, the contribution of supplements to micronutrient intake was considered. The main limitation of this study is that it is a cross-sectional study; thus, we fully acknowledge that causal inferences cannot be drawn but only observations. A second limitation is that all nutritional data presented here is self-reported, as well as most of nutritional assessment methods. Another limitation is that the same source of information was used to assess nut intake and nutritional adequacy. Moreover, the self-reported FFQ could overestimate the intake of certain food groups even having been validated. Nevertheless, it is likely to be similar in both compared groups and therefore could only contribute to the increase of the measurement error and to dilute the true differences. Furthermore, in order address such a possible error and avoid information bias we excluded participants with energy or micronutrient intake out of predefined ranges [2]. Previously, in the PREDIMED study, 827 participants who had extreme values for total energy intake or any micronutrient intake out of the predefined values were also excluded in the nutritional adequacy analysis [2]. Nonetheless, plasma concentrations of vitamins and micronutrients were not determined in our study. Finally, nut consumers may simply be more health conscious than non-nut consumers [6]. Nevertheless, this is a cross-sectional study and therefore we acknowledge that we are not able to draw causal conclusions but only observations.

6. Conclusions

In conclusion, a high proportion of individuals at high cardiovascular risk consumed nuts. The rate was higher than in previous similar studies; however, the average amount of daily nut consumption was low among them. Nevertheless, consumption of nuts was associated with nutrient adequacy, better diet quality, and higher adherence to the MedDiet (Mediterranean diet score, MDS) than those seen in non-nut consumers. Nuts contributed to these results and to an overall healthier diet. Thus, consumption of nuts should be encouraged by health professionals, including registered dietitians. Moreover, nutrition education programs that increase awareness, health benefits, and consumption of nuts should be designed for the general adult population at high cardiovascular risk to attain nutrient adequacy. This study also raises the possibility that future research should include a categorized nut consumption amount to assess health benefits in interventional programs encouraging nut consumption.

Author Contributions

All authors contributed to obtain data from the participants recruited in the PREDIMEDPLUS survey. J.A.T., M.M.B., A.J. and C.B. wrote the first draft of the manuscript and all other authors gave additional suggestions. All authors approve final version of the manuscript.

Funding

The PREDIMED-Plus trial was supported by the official funding agency for biomedical research of the Spanish government, ISCIII through the Fondo de Investigación para la Salud (FIS), which is co-funded by the European Regional Development Fund (four coordinated FIS projects led by Jordi Salas-Salvadó and Josep Vidal, including the following projects: PI13/00673, PI13/00492, PI13/00272, PI13/01123, PI13/00462, PI13/00233, PI13/02184, PI13/00728, PI13/01090, PI13/01056, PI14/01722, PI14/00636, PI14/00618, PI14/00696, PI14/01206, PI14/01919, PI14/00853, PI14/01374, PI16/00473, PI16/00662, PI16/01873, PI16/01094, PI16/00501, PI16/00533, PI16/00381, PI16/00366, PI16/01522, PI16/01120, PI17/00764, PI17/01183, PI17/00855, PI17/01347, PI17/00525, PI17/01827, PI17/00532, PI17/00215, PI17/01441, PI17/00508, PI17/01732, PI17/00926), the Especial Action Project entitled: Implementación y evaluación de una intervención intensive sobre la actividad física Cohorte PREDIMED-PLUS grant to Jordi Salas-Salvadó, the European Research Council (Advanced Research Grant 2013–2018; 340918) grant to Miguel Ángel Martínez–Gonzalez, the Recercaixa grant to Jordi Salas–Salvadó (2013ACUP00194), the grant from the Consejería de Salud de la Junta de Andalucía (PI0458/2013; PS0358/2016), the PROMETEO/2017/017 grant from the Generalitat Valenciana, the SEMERGEN grant, and CIBEROBN and FEDER funds (CB06/03), ISCIII. Josep A. Tur, Maria del Mar Bibiloni, Alicia Julibert and Cristina Bouzas are granted by Grant of support to research groups no. 35/2011 (Balearic Islands Gov.; FEDER funds) and EU-COST ACTION CA16112. None of the funding sources took part in the design, collection, analysis or interpretation of the data, or in the decision to submit the manuscript for publication. The corresponding authors had full access to all the data in the study and had final responsibility to submit for publication.

Acknowledgments

The authors especially thank the PREDIMED-Plus participants for their enthusiastic collaboration, the PREDIMED-Plus personnel for their outstanding support, and the personnel of all associated primary care centers for their exceptional effort. Centros de Investigación Biomédica en Red: Obesidad y Nutrición (CIBEROBN), Centros de Investigación Biomédica en Red: Epidemiología y Salud Pública (CIBERESP) and Centros de Investigación Biomédica en Red: Diabetes y Enfermedades Metabólicas asociadas (CIBERDEM) are initiatives of Instituto de Salud Carlos III (ISCIII), Madrid, Spain. Food companies, Hojiblanca and Patrimonio Comunal Olivarero, donated extra-virgin olive oil and Almond Board of California, American Pistachio Growers and Paramount Farms donated nuts for the pilot study. We thank the PREDIMED-Plus Biobank Network as a part of the National Biobank Platform of the ISCIII for storing and managing the PREDIMED-Plus biological samples.

Conflicts of Interest

J.S.-S. reports serving on the board of and receiving grant support through his institution from International Nut and Dried Fruit Council; receiving consulting personal fees from Danone, Font Vella Lanjaron, Nuts for Life, and Eroski; and receiving grant support through his institution from Nut and Dried Fruit Foundation and Eroski. ER reports grants, non-financial support, and other fees from California Walnut Commission and Alexion; personal fees and non-financial support from Merck, Sharp and Dohme; personal fees, non-financial support and other fees from Aegerion, and Ferrer International; grants and personal fees from Sanofi Aventis; grants from Amgen and Pfizer and; personal fees from Akcea, outside of the submitted work. X.P. reports serving on the board of and receiving consulting personal fees from Sanofi Aventis, Amgen, and Abbott laboratories; receiving lecture personal fees from Esteve, Lacer and Rubio laboratories. M.D.-R. reports receiving grants from the Diputación Provincial de Jaén and the Caja Rural de Jaén. L.D. reports grants from Fundación Cerveza y Salud. All other authors declare no competing interests.

Abbreviations

AIAdequate intake
CHOCarbohydrate
CQICarbohydrate quality index
EAREstimated average requirements
erMedDietEnergy-restricted traditional MedDiet
FFQFood frequency questionnaire
FQIFat quality index
MedDietMediterranean diet
METMetabolic equivalents
MetSMetabolic syndrome
NHANESNational Health and Nutrition Examination Survey
NENiacin equivalents
NZANSNew Zealand Adult Nutrition Survey
RAERetinol activity equivalents
RAPARapid assessment of physical activity questionnaire
RDARecommended daily allowances
DRIDietary reference intake
TFATrans fatty acid
ULTolerable upper level

References

  1. Castro-Quezada, I.; Román-Viñas, B.; Serra-Majem, L. The Mediterranean diet and nutritional adequacy: A review. Nutrients 2014, 6, 231–248. [Google Scholar] [CrossRef] [PubMed]
  2. Sánchez-Tainta, A.; Zazpe, I.; Bes-Rastrollo, M.; Salas-Salvadó, J.; Bullo, M.; Sorlí, J.V.; Corella, D.; Covas, M.I.; Arós, F.; Gutierrez-Bedmar, M.; et al. PREDIMED studyinvestigators. Nutritional adequacy according to carbohydrates and fat quality. Eur. J. Nutr. 2016, 55, 93–106. [Google Scholar] [CrossRef]
  3. O’Neil, C.E.; Keast, D.R.; Fulgoni, V.L., 3rd; Nicklas, T.A. Tree nut consumption improves nutrient intake and diet quality in US adults: An analysis of National Health and Nutrition Examination Survey (NHANES) 1999–2004. Asia Pac. J. Clin. Nutr. 2010, 19, 142–150. [Google Scholar]
  4. O’Neil, C.E.; Nicklas, T.A.; Fulgoni, V.L., 3rd. Tree nut consumption is associated with better nutrient adequacy and diet quality in adults: National Health and Nutrition Examination Survey 2005–2010. Nutrients 2015, 7, 595–607. [Google Scholar] [CrossRef]
  5. O’Neil, C.E.; Nicklas, T.A.; Fulgoni, V.L., 3rd. Almond Consumption Is Associated with Better Nutrient Intake, Nutrient Adequacy, and Diet Quality in Adults: National Health and Nutrition Examination Survey 2001–2010. Food Nutr. Sci. 2016, 7, 504–515. [Google Scholar]
  6. Brown, R.C.; Tey, S.L.; Gray, A.R.; Chisholm, A.; Smith, C.; Fleming, E.; Parnell, W. Nut consumption is associated with better nutrient intakes: Results from the 2008/09 New Zealand Adult Nutrition Survey. Br. J. Nutr. 2016, 115, 105–112. [Google Scholar] [CrossRef] [PubMed]
  7. Chen, C.G.; Zhang, R.; Martínez-González, M.A.; Zhang, Z.L.; Bonaccio, M.; van Dam, R.M.; Qin, L.Q. Nut consumption in relation to all-cause and cause-specific mortality: A meta-analysis 18 prospective studies. Food Funct. 2017, 8, 3893–3905. [Google Scholar] [CrossRef] [PubMed]
  8. Ros, E. Nuts and, C.V.D. Br. J. Nutr. 2015, 113 (Suppl. 2), S111–S120. [Google Scholar] [CrossRef]
  9. Kim, Y.; Keogh, J.B.; Clifton, P.M. Benefits of Nut Consumption on Insulin Resistance and Cardiovascular Risk Factors: Multiple Potential Mechanisms of Actions. Nutrients 2017, 9, 1271. [Google Scholar] [CrossRef]
  10. Relja, A.; Miljković, A.; Gelemanović, A.; Bošković, M.; Hayward, C.; Polašek, O.; Kolčić, I. Nut Consumption and Cardiovascular Risk Factors: A Cross-Sectional Study in a Mediterranean Population. Nutrients 2017, 9, 1296. [Google Scholar] [CrossRef]
  11. Guasch-Ferré, M.; Liu, X.; Malik, V.S.; Sun, Q.; Willett, W.C.; Manson, J.E.; Rexrode, K.M.; Li, Y.; Hu, F.B.; Bhupathiraju, S.N. Nut Consumption and Risk of Cardiovascular Disease. J. Am. Coll. Cardiol. 2017, 70, 2519–2532. [Google Scholar] [CrossRef]
  12. Martínez-González, M.A.; Buil-Cosiales, P.; Corella, D.; Bulló, M.; Fitó, M.; Vioque, J.; Romaguera, D.; Martínez, J.A.; Wärnberg, J.; López-Miranda, J.; et al. Cohort Profile: Design and methods of the PREDIMED-PLUS randomised trial. Int. J. Epidemiol. 2018. [Google Scholar] [CrossRef]
  13. Alberti, K.G.; Eckel, R.H.; Grundy, S.M.; Zimmet, P.Z.; Cleeman, J.I.; Donato, K.A. Harmonizing the metabolic syndrome: A joint interim statement of the International Diabetes Federation Task Force on Epidemiology and Prevention; National Heart, Lung, and Blood Institute; American Heart Association; World Heart Federation; International. Circulation 2009, 120, 1640–1645. [Google Scholar] [CrossRef]
  14. Fernández-Ballart, J.D.; Piñol, J.L.; Zazpe, I.; Corella, D.; Carrasco, P.; Toledo, E.; Perez-Bauer, M.; Martínez-González, M.A.; Salas-Salvadó, J.; Martín-Moreno, J.M. Relative validity of a semi-quantitative food-frequency questionnaire in an elderly Mediterranean population of Spain. Br. J. Nutr. 2010, 103, 1808–1816. [Google Scholar] [CrossRef] [Green Version]
  15. Martin-Moreno, J.M.; Boyle, P.; Gorgojo, L.; Maisonneuve, P.; Fernandez-Rodriguez, J.C.; Salvini, S.; Willett, W.C. Development and validation of a food frequency questionnaire in Spain. Int. J. Epidemiol. 1993, 22, 512–519. [Google Scholar] [CrossRef] [PubMed]
  16. De la Fuente-Arrillaga, C.; Ruiz, Z.V.; Bes-Rastrollo, M.; Sampson, L.; Martinez-González, M.A. Reproducibility of an FFQ validated in Spain. Public Health Nutr. 2010, 13, 1364–1372. [Google Scholar] [CrossRef]
  17. The National Academies of Sciences Engineering Medicine, Institute of Medicine (US), Food and Nutrition Board. Dietary Reference Intakes (DRIs): Estimated Average Requirements Values. Available online: http://nationalacademies.org/hmd/Activities/Nutrition/SummaryDRIs/DRI-Tables.aspx (accessed on 9 April 2018).
  18. Institute of Medicine (US) Committee to Review Dietary Reference Intakes for Vitamin D and Calcium. Dietary Reference Intakes for Calcium and Vitamin, D; National Academies Press (US): Washington, DC, USA, 2011. Available online: https://www.ncbi.nlm.nih.gov/books/NBK56070/ (accessed on 9 April 2018).
  19. Institute of Medicine (US) Subcommittee on Interpretation and Uses of Dietary Reference Intakes; Institute of Medicine (US) Standing Committee on the Scientific Evaluation of Dietary Reference Intakes. DRI Dietary Reference Intakes: Applications in Dietary Assessment; National Academies Press (US): Washington, DC, USA, 2000. Available online: https://www.ncbi.nlm.nih.gov/books/NBK222872/ (accessed on 9 April 2018).
  20. Zazpe, I.; Sánchez-Taínta, A.; Santiago, S.; de la Fuente-Arrillaga, C.; Bes-Rastrollo, M.; Martínez, J.A.; Martínez-González, M.Á. SUN Project Investigators. Association between dietary carbohydrate intake quality and micronutrient intake adequacy in a Mediterranean cohort: The SUN (Seguimiento Universidad de Navarra) Project. Br. J. Nutr. 2014, 111, 2000–2009. [Google Scholar] [CrossRef] [PubMed]
  21. Schröder, H.; Fitó, M.; Estruch, R.; Martínez-González, M.A.; Corella, D.; Salas-Salvadó, J.; Lamuela-Raventós, R.; Ros, E.; Salaverría, I.; Fiol, M.; et al. A short screener is valid for assessing Mediterranean diet adherence among older Spanish men and women. J. Nutr. 2011, 141, 1140–1145. [Google Scholar] [CrossRef]
  22. Molina, L.; Sarmiento, M.; Peñafiel, J.; Donaire, D.; Garcia-Aymerich, J.; Gomez, M.; Ble, M.; Ruiz, S.; Frances, A.; Schröder, H.; et al. Validation of the Regicor Short Physical Activity Questionnaire for the Adult Population. PLoS ONE 2017, 12, e0168148. [Google Scholar] [CrossRef] [PubMed]
  23. Elosua, R.; Garcia, M.; Aguilar, A.; Molina, L.; Covas, M.I.; Marrugat, J. Validation of the Minnesota Leisure Time Physical Activity Questionnaire in Spanish Women. Investigators of the MARATDON Group. Med. Sci. Sports Exerc. 2000, 32, 1431–1437. [Google Scholar] [CrossRef]
  24. Elosua, R.; Marrugat, J.; Molina, L.; Pons, S.; Pujol, E. Validation of the Minnesota Leisure Time Physical Activity Questionnaire in Spanish men. The MARATHOM Investigators. Am. J. Epidemiol. 1994, 139, 1197–1209. [Google Scholar] [CrossRef] [PubMed]
  25. Martínez-González, M.A.; López-Fontana, C.; Varo, J.J.; Sánchez-Villegas, A.; Martinez, J.A. Validation of the Spanish version of the physical activity questionnaire used in the Nurses’ Health Study and the Health Professionals’ Follow-up Study. Public Health Nutr. 2005, 8, 920–927. [Google Scholar] [CrossRef] [PubMed]
  26. Celis-Morales, C.; Livingstone, K.M.; Affleck, A.; Navas-Carretero, S.; San-Cristobal, R.; Martinez, J.A.; Marsaux, C.F.M.; Saris, W.H.M.; O’Donovan, C.B.; Forster, H.; et al. Food4Me Study. Correlates of overall and central obesity in adults from seven European countries: Findings from the Food4Me Study. Eur. J. Clin. Nutr. 2018, 72, 207–219. [Google Scholar] [CrossRef] [PubMed]
  27. Roman Viñas, B.; Ribas Barba, L.; Ngo, J.; Gurinovic, M.; Novakovic, R.; Cavelaars, A.; de Groot, L.C.; van’t Veer, P.; Matthys, C.; Serra Majem, L. Projected prevalence of inadequate nutrient intakes in Europe. Ann. Nutr. Metab. 2011, 59, 84–95. [Google Scholar] [CrossRef]
  28. Serra-Majem, L.; Bes-Rastrollo, M.; Román-Viñas, B.; Pfrimer, K.; Sánchez-Villegas, A.; Martínez-González, M.A. Dietary patterns and nutritional adequacy in a Mediterranean country. Br. J. Nutr. 2009, 101 (Suppl. 2), S21–S28. [Google Scholar] [CrossRef]
  29. Mensink, G.B.; Fletcher, R.; Gurinovic, M.; Huybrechts, I.; Lafay, L.; Serra-Majem, L.; Szponar, L.; Tetens, I.; Verkaik-Kloosterman, J.; Baka, A.; et al. Mapping low intake of micronutrients across Europe. Br. J. Nutr. 2013, 110, 755–773. [Google Scholar] [CrossRef] [PubMed] [Green Version]
Figure 1. Mean (with standard deviation (SD)) number of nutrients with intakes not meeting the recommended levels across quintiles of nut consumption (g/day). Nut consumption range in each of the quintiles: Q1: <4.2 g/day, n = 911; Q2: 4.2–8.3 g/day, n = 1058; Q3: 8.4–14.5 g/day, n = 868; Q4: 14.6–29.3, n = 1093; Q5: ≥29.4 g/day, n = 1039. DRI, dietary reference intake; Q, quintile. Differences in means between quintiles were tested by one-way ANOVA (p < 0.001) with Bonferroni’s post-hoc test. Different letters indicate statistically significant differences between quintile groups.
Nutrients 11 00754 g001
Table 1. Lifestyle and dietary characteristics according to nut consumption.
Non-Nut Consumers (n = 1091)Nut Consumers (n = 4969)p
Mean (SD)Median (IQR)Mean (SD)Median (IQR)
Subject characteristics
 Age (years) †65.2 (4.9)65.0 (61.0, 69.0)65.0 (4.9)65.0 (61.0, 69.0)0.222
 Body mass index (kg/m2)33.2 (3.5)32.9 (30.4, 35.8)32.6 (3.4)32.2 (29.9, 34.9)<0.001
 Total physical activity (MET·min/week) *,†2074 (1845)1573 (707, 3019)2487 (1952)2014 (1007, 3476)<0.001
  Males †2402 (2079)1958 (888, 3357)2837 (2174)2294 (1147, 4091)<0.001
  Females †1780 (1552)1386 (559, 2587)2093 (1577)1734 (839, 2946)<0.001
 Smoking habit ‡
  Current smoker173 (16.2) 567 (11.7) <0.001
  Former smoker432 (40.4) 2128 (43.8)
  Never smoked463 (43.4) 2167 (44.6)
Nutrients
 Energy intake (kcal/day) †2141 (555)2096 (1729, 2495)2360 (518)2333 (1996, 2692)<0.001
 Carbohydrate intake (% total energy)42.3 (7.6)42.2 (37.3, 47.6)40.5 (6.6)40.5 (35.9, 45.0)<0.001
  Solid carbohydrate (g/day)200.6 (69.1)191.0 (152.1, 243.0)214.6 (64.9)209.6 (166.3, 254.5)<0.001
  Liquid carbohydrate (g/day)8.6 (13.8)1.6 (0.0, 11.4)8.9 (12.4)3.3 (0.0, 12.3)0.641
  Glycemic index53.7 (5.6)54.1 (50.5, 57.7)53.3 (5.1)53.7 (50.1, 57.0)0.015
 Protein intake (% total energy)16.8 (3.1)16.6 (14.7, 18.6)16.5 (2.7)16.3 (14.6, 18.1)0.002
 Fat intake (% total energy)37.6 (7.1)37.2 (32.7, 42.3)39.9 (6.3)39.9 (35.5, 44.2)<0.001
  PUFA (% total energy)5.1 (1.3)5.0 (4.3, 5.7)6.6 (1.7)6.3 (5.3, 7.5)<0.001
  MUFA (% total energy)19.3 (4.7)19.0 (15.8, 22.4)20.9 (4.5)20.7 (17.6, 23.8)<0.001
  SFA (% total energy)9.9 (2.2)9.8 (8.5, 11.3)9.9 (1.9)9.8 (8.6, 11.1)0.543
  Trans fatty acid (g/d)0.6 (0.4)0.5 (0.3, 0.7)0.6 (0.4)0.5 (0.3, 0.8)0.901
 Cholesterol (mg/d) 352.9 (114.5)341.2 (278.9, 422.1)374.9 (106.7)365.8 (304.1, 433.4)<0.001
 Fibre intake (g/d)21.9 (7.4)21.2 (16.8, 26.3)25.9 (7.8)24.8 (20.3, 30.4)<0.001
Food groups
 Fruits (g/day) †309.4 (189.9)281.3 (175.2, 414.1)352.5 (186.2)326.6 (217.6, 456.2)<0.001
 Vegetables (g/day) †291.7 (129.6)269.8 (202.1, 365.5)322.0 (128.8)304.4 (230.2, 398.1)<0.001
 Legumes (g/day) †18.9 (11.2)16.4 (12.1, 24.8)20.3 (10.1)16.8 (16.1, 24.8)<0.001
 Olive oil (g/day) †38.0 (17.5)35.0 (25.0, 50.0)40.4 (16.8)50.0 (25.0, 50.0)<0.001
 Nuts (g/day) †0.0 (0.0)0.0 (0.0, 0.0)17.1 (15.8)12.6 (6.0, 25.2)<0.001
 Total fish (g/day) †89.1 (44.4)84.6 (56.6, 119.0)101.0 (44.2)96.1 (68.1, 128.6)<0.001
 Total cereals (g/day) †144.6 (80.1)114.9 (87.4, 202.0)148.1 (74.4)122.1 (91.8, 204.3)0.182
 Dairy products (g/day) †346.7 (195.0)306.9 (220.6, 518.7)331.3 (182.3)298.0 (216.6, 418.1)0.017
 Total meat (g/day) †138.9 (58.3)134.1 (101.6, 171.9)144.9 (54.6)139.6 (109.2, 177.2)0.002
 Cookies (g/day) †26.5 (31.3)14.6 (4.2, 39.4)26.6 (29.1)17.4 (6.7, 37.8)0.938
 Alcohol (g/day) †10.9 (16.0)4.3 (0.0, 12.9)11.0 (14.8)5.0 (0.7, 14.7)0.826
Diet Quality Measures (units)
 17-item MDS †7.7 (2.6)8.0 (6.0, 10.0)8.6 (2.6)9.0 (7.0, 10.0)<0.001
 CQI †11.1 (3.4)11.0 (8.0, 14.0)12.1 (3.4)12.0 (9.0, 15.0)<0.001
 FQI †2.5 (0.6)2.4 (2.1, 2.8)2.8 (0.6)2.7 (2.3, 3.1)<0.001
MetS components: n (%)
 High blood pressure ‡1012 (92.8) 4577 (92.1) 0.469
 Hyperglycemia ‡839 (76.9) 3738 (75.2) 0.244
 Hypertriglyceridemia ‡ 613 (56.2) 2781 (56.0) 0.895
 Low HDL-cholesterol ‡459 (42.1) 2130 (42.9) 0.631
 Abdominal obesity ‡1053 (96.5) 4771 (96.0) 0.438
  Males ‡476 (93.0) 2424 (93.0) 0.969
  Females ‡577 (99.7) 2347 (99.3) 0.490
Abbreviations: MDS, Mediterranean diet score; CQI, carbohydrates quality index; FQI, fat quality index; HDL-cholesterol, high density lipoprotein cholesterol; MET, metabolic equivalent of task. * Participants who not responded the physical activity questionnaires and participants reporting outliers for total physical activity expressed as MET·min/week (at 3 or more standard deviations from the mean) were excluded from the analysis (i.e., 79 participants ‘non-nut consumers’ and 239 participants ‘nut consumers’). † Difference in means between non-nut consumers and nut consumers were tested by unpaired Students’ t-test. ‡ The difference in prevalence across the two comparison groups was examined using χ2.
Table 2. Usual intake and percentage of population below the estimated average requirement (EAR) or above adequate intake (AI) in nut-consumers (n = 4969) compared with non-nut consumers (n = 1091).
Usual IntakePercentileEAR% Below EAR
VariableGroupMean (SD)P11025507590 %P2
Vitamin A RAE (µg/day)Non-nut consumers940.6 (517.0)<0.001439.7564.9783.61171.91692.4M: 625.0 µg/day23.9<0.001
Nut-consumers1064.0 (533.6) 521.2662.6913.21387.21826.7W: 500.0 µg/day15.1
Vitamin B1 (mg/day)Non-nut consumers1.4 (0.4)<0.0011.01.21.41.71.9M: 1.0 mg/day8.7<0.001
Nut-consumers1.6 (0.4) 1.21.41.61.82.1W: 0.9 mg/day2.5
Vitamin B2 (mg/day)Non-nut consumers1.8 (0.5)<0.0011.21.41.72.12.5M: 1.1 mg/day4.5<0.001
Nut-consumers1.9 (0.5) 1.31.61.92.32.6W: 0.9 mg/day2.0
Vitamin B3 NE (mg/day)Non-nut consumers36.3 (9.1)<0.00125.230.135.642.348.0M: 12.0 mg/day0.01.000
Nut-consumers39.8 (8.8) 28.833.739.645.751.4W: 11.0 mg/day0.0
Vitamin B6 (mg/day)Non-nut consumers2.0 (0.5)<0.0011.41.72.02.42.7M: 1.4 mg/day6.2<0.001
Nut-consumers2.3 (0.5) 1.71.92.32.63.0W: 1.3 mg/day2.6
Vitamin B12 (µg/day)Non-nut consumers8.7 (3.8)<0.0014.55.98.010.914.1M: 2.0 µg/day0.40.088
Nut-consumers9.7 (3.8) 5.36.79.012.015.1W: 2.0 µg/day0.1
Folic acid (µg/day)Non-nut consumers303.7 (86.7)<0.001200.2242.0295.0354.3419.1M: 320.0 µg/day60.6<0.001
Nut-consumers345.8 (89.4) 238.8283.0335.5400.9470.2W: 320.0 µg/day42.5
Vitamin C (mg/day)Non-nut consumers175.0 (74.6)<0.00185.5120.8165.6217.3277.3M: 75.0 mg/day4.6<0.001
Nut-consumers197.5 (76.6) 108.4142.5184.4243.5304.0W: 60.0 mg/day1.9
Vitamin D (µg/day)Non-nut consumers5.2 (3.2)<0.0011.93.04.36.810.2M: 10.0 µg/day89.60.001
Nut-consumers6.1 (3.2) 2.63.85.18.810.8W: 10.0 µg/day85.7
Vitamin E (mg/day)Non-nut consumers8.3 (2.7)<0.0015.36.57.99.511.5M: 12 mg/day91.8<0.001
Nut-consumers10.6 (3.2) 6.98.310.012.315.0W: 12 mg/day71.9
Ca (mg/day)Non-nut consumers950.9 (325.3)<0.001572.5708.8909.91144.11391.5M 51–70 y-o: 800.0 mg/day
M >70 y-o: 1000.0 mg/day
W: 1000.0 mg/day
50.6<0.001
Nut-consumers1008.4 (306.1) 637.7789.4977.01208.71418.440.2
Mg (mg/day)Non-nut consumers344.4 (86.2)<0.001245.4284.7331.1393.7461.7M: 350.0 mg/day36.7<0.001
Nut-consumers402.9 (94.5) 288.9333.8394.8463.2533.8W: 265.0 mg/day18.8
P (mg/day)Non-nut consumers1580.8 (388.3)<0.0011109.01291.81541.21827.12099.9M: 580.0 mg/day0.20.086
Nut-consumers1728.7 (374.9) 1253.31465.51714.31985.12225.5W: 580.0 mg/day0.0
Fe (mg/day)Non-nut consumers14.6 (3.6)<0.00110.212.114.316.819.5M: 6.0 mg/day0.20.086
Nut-consumers16.4 (3.6) 12.013.916.218.821.3W: 5.0 mg/day0.0
Se (µg/day)Non-nut consumers106.1 (32.1)<0.00166.983.1102.7126.8148.8M: 45.0 µg/day1.4<0.001
Nut-consumers116.5 (30.5) 78.794.8114.9136.1157.0W: 45.0 µg/day0.3
Zn (mg/day)Non-nut consumers12.0 (3.1)<0.0018.49.811.713.916.3M: 9.4 mg/day9.4<0.001
Nut-consumers13.1 (3.0) 9.411.012.915.017.1W: 6.8 mg/day5.0
Iodine (µg/day)Non-nut consumers282.5 (153.8)0.21392.9176.4252.2328.0531.0M: 95.0 µg/day10.40.577
Nut-consumers276.1 (143.5) 95.5181.5258.2298.2531.9W: 95.0 µg/day9.8
K (g/day)Non-nut consumers4.0 (1.0)<0.0012.93.33.94.65.4M: 4.7 g/day23.5<0.001
Nut-consumers4.4 (1.0) 3.33.84.45.15.7W: 4.7 g/day37.7
Cr (µg/day)Non-nut consumers76.7 (46.1)<0.00137.446.761.489.7140.1M: 30.0 µg/day98.80.046
Nut-consumers83.8 (44.2) 42.151.870.6103.7144.5W: 20.0 µg/day99.4
Abbreviations: EAR, estimated average requirement; AI, adequate intake; SD, standard deviation; RAE, retinol activity equivalents; NE, niacin equivalents; vitamin E (i.e., α-tocopherol); M: men; W: women; Ca, calcium; Mg, magnesium; P, phosphorous; Fe, iron; Se, selenium; Zn, zinc; K, potassium; Cr, chromium; y-o: years-old. 1 Difference in means between non-nut consumers and nut consumers were tested by unpaired Students’ t-test. 2 The difference in prevalence across the two comparison groups was examined using χ2.
Table 3. Usual intake of vitamins and minerals of the nut consumers (n = 4969).
Quintiles of Nut Consumption
VariablesQ1 (n = 1182)Q2 (n = 980)Q3 (n = 848)Q4 (n = 987)Q5 (n = 972)p *
Vitamin A RAE (µg/day)
  Mean ± SD980.5 ± 520.2 a,b,c,d1055.1 ± 519.9 a,g1069.9 ± 532.6 b,h,i1096.2 ± 525.9 c1136.8 ± 558.2 d,h,i<0.001
  % below EAR20.813.214.613.312.1<0.001
Vitamin B1 (mg/day)
  Mean ± SD1.5 ± 0.4 a,b,c,d1.6 ± 0.4 a,f,g1.6 ± 0.4 b,h,i1.7 ± 0.3 c,f,h,j1.8 ± 0.3 d,g,i,j<0.001
  % below EAR4.72.92.51.30.4<0.001
Vitamin B2 (mg/day)
  Mean ± SD1.8 ± 0.5 b,c,d1.9 ± 0.5 f,g1.9 ± 0.5 b,h,i2.0 ± 0.5 c,f,h,j2.1 ± 0.5 d,g,i,j<0.001
  % below EAR3.21.92.01.21.40.009
Vitamin B3 NE (mg/day)
  Mean ± SD37.8 ± 8.8 a,b,c,d39.3 ± 8.7 a,f,g39.3 ± 8.6 b,h,i41.0 ± 8.6 c,f,h42.1 ± 8.6 d,g,i<0.001
  % below EAR0.00.00.00.00.01.000
Vitamin B6 (mg/day)
  Mean ± SD2.1 ± 0.5 a,b,c,d2.2 ± 0.5 a,f,g2.3 ± 0.5 b,h,i2.4 ± 0.5 c,f,h,j2.5 ± 0.5 d,g,i,j<0.001
  % below EAR6.62.61.81.00.3<0.001
Vitamin B12 (µg/day)
  Mean ± SD9.2 ± 3.8 a,c,d9.7 ± 3.8 a9.6 ± 3.810.0 ± 3.9 c10.0 ± 3.9 d<0.001
  % below EAR0.10.10.20.20.00.590
Folic acid (µg/day)
  Mean ± SD316.6 ± 83.9 a,b,c,d332.1 ± 87.5 a,f,g340.5 ± 82.4 b,h,i358.3 ± 86.7 c,f,h,j387.1 ± 89.1 d,g,i,j<0.001
  % below EAR57.348.145.435.124.2<0.001
Vitamin C (mg/day)
  Mean ± SD181.5 ± 75.5 a,b,c,d194.3 ± 77.2 a,g195.2 ± 73.1 b,i202.6 ± 74.4 c,j216.9 ± 78.1 d,g,i,j<0.001
  % below EAR3.81.41.91.20.9<0.001
Vitamin D (µg/day)
  Mean ± SD5.5 ± 3.1 a,b,c,d6.0 ± 3.1 a,f,g5.9 ± 3.1 b,h,i6.5 ± 3.3 c,f,h6.6 ± 3.3 d,g,i<0.001
  % below EAR89.187.688.182.181.1<0.001
Vitamin E (mg/day)
  Mean ± SD8.9 ± 2.7 a,b,c,d9.9 ± 2.5 a,f,g10.0 ± 2.6 b,h,i11.4 ± 2.7 c,f,h,j13.1 ± 3.7 d,g,i,j<0.001
  % below EAR89.084.880.862.539.7<0.001
Ca (mg/day)
  Mean ± SD961.6 ± 296.8 b,c,d983.4 ± 295.5 f,g1000.4 ± 310.9 b,i1027.3 ± 307.2 c,f,j1078.6 ± 308.6 d,g,i,j<0.001
  % below EAR46.743.441.438.230.3<0.001
Mg (mg/day)
  Mean ± SD355.7 ± 83.5 a,b,c,d379.1 ± 84.6 a,e,f,g392.5 ± 81.8 b,e,h,i424.5 ± 87.0 c,f,h,j471.7 ± 88.9 d,g,i,j<0.001
  % below EAR32.423.018.512.54.7<0.001
P (mg/day)
  Mean ± SD1609.6 ± 358.8 a,b,c,d1671.7 ± 358.8 a,f,g1706.7 ± 360.7 b,h,i1785.8 ± 367.9 c,f,h,j1891.9 ± 361.9 d,g,i,j<0.001
  % below EAR0.10.00.00.00.00.524
Fe (mg/day)
  Mean ± SD15.2 ± 3.5 a,b,c,d16.0 ± 3.5 a,f,g16.2 ± 3.4 b,h,i16.9 ± 3.4 c,f,h,j18.0 ± 3.4 d,g,i,j<0.001
  % below EAR0.10.00.00.00.00.524
Se (µg/day)
  Mean ± SD111.3 ± 31.5 b,c,d114.8 ± 29.8 f,g115.6 ± 30.6 b,i119.2 ± 29.7 c,f122.7 ± 29.54 d,g,i<0.001
  % below EAR0.50.40.40.20.00.251
Zn (mg/day)
  Mean ± SD12.4 ± 3.0 a,b,c,d12.8 ± 3.0 a,f,g12.9 ± 3.0 b,h,i13.4 ± 2.9 c,f,h,j13.9 ± 2.8 d,g,i,j<0.001
  % below EAR7.45.35.44.41.9<0.001
Iodine (µg/day)
  Mean ± SD280.7 ± 144.9266.4 ± 135.5279.4 ± 146.8274.4 ± 145.1279.3 ± 144.80.148
  % below EAR10.29.010.09.510.20.862
K (g/day)
  Mean ± SD4135.7 ± 927.2 a,b,c,d4290.8 ± 923.2 a,e,f,g4424.5 ± 891.3 b,e,h,i4597.0 ± 957.3 c,f,h,j4855.8 ± 954.2 d,g,i,j<0.001
  % above AI25.230.736.143.955.1<0.001
Cr (µg/day)
  Mean ± SD77.4 ± 44.0 c,d79.3 ± 41.8 f,g82.7 ± 42.2 h,i88.8 ± 45.3 c,f,h92.2 ± 45.6 d,g,i<0.001
  % above AI98.799.699.499.599.80.020
Abbreviations: AI: adequate intake. EAR: estimated average requirements. Nut consumption range in each of the quintiles: Q1: <4.2 g/day, n = 911; Q2: 4.2–8.3 g/day, n = 1058; Q3: 8.4–14.5 g/day, n = 868; Q4: 14.6–29.3 g/day, n = 1093; Q5: ≥29.4 g/day, n = 1039. * Differences in means between quintiles were tested by one-way ANOVA with Bonferroni’s post-hoc test. Different letters indicate statistically significant differences between quintile groups.
Table 4. Unmet dietary reference intakes (DRI) ≥6 and ≥8 number of nutrients in nut-consumers (n = 4969) compared with non-nut consumers as reference value (n = 1091).
Unmet DRINon-Nut Consumers (n = 1091)Nut Consumers (n = 4969)P1
Failing to meet 6 or more recommendations
<664.480.6<0.001
≥635.619.4
Crude OR 2 (95% CI)1.00 (ref.)0.44 (0.38, 0.50) **
Adjusted OR 3 (95% CI)1.00 (ref.)0.58 (0.49, 0.69) **
Adjusted OR 4 (95% CI)1.00 (ref.)0.59 (0.49, 0.71) **
Failing to meet 8 or more recommendations
<889.295.0<0.001
≥810.85.0
Crude OR 2 (95% CI)1.00 (ref.)0.43 (0.34, 0.54) **
Adjusted OR 3 (95% CI)1.00 (ref.)0.73 (0.55, 0.97) *
Adjusted OR 4 (95% CI)1.00 (ref.)0.80 (0.59, 1.07) NS
Abbreviations: OR, odds ratio; CI, confidence interval; ref., reference. Values are expressed as n (%) and OR (95% CI). 1 Significant differences in prevalence were calculated by means of χ2. 2 Logistic regression analysis comparing the two different cut-offs (independent variables) between nut-consumers and non-nut consumers as reference value (dependent variable). 3 Logistic regression analysis after adjustment for sex, energy intake (continuous variable) and total physical activity (continuous variable, expressed as MET·min/week). 4 Logistic regression analysis after additional adjustment for total fat intake (continuous variable, expressed as % of total energy intake), and Mediterranean diet score (MDS) (continuous variable). 3,4 Participants who not responded the physical activity questionnaires and participants reporting outliers for total physical activity expressed as MET·min/week (at 3 or more standard deviations from the mean) were excluded from the analysis (i.e., 79 participants ‘non-nut consumers’ and 239 participants ‘nut consumers’). * p <0.05; ** p <0.001; NS: no significant.

