Next Article in Journal
Lycopene Inhibits Reactive Oxygen Species-Mediated NF-κB Signaling and Induces Apoptosis in Pancreatic Cancer Cells
Previous Article in Journal
The Early Introduction of Complementary (Solid) Foods: A Prospective Cohort Study of Infants in Chengdu, China
 
 
nutrients-logo
Article Menu

Article Menu

Communication

Sleep Duration is Inversely Associated with Serum Uric Acid Concentrations and Uric Acid to Creatinine Ratio in an Elderly Mediterranean Population at High Cardiovascular Risk

by
Christopher Papandreou
1,2,3,4,
Nancy Babio
1,2,3,4,
Andrés Díaz-López
1,2,3,4,
Miguel Á. Martínez-González
3,5,6,
Nerea Becerra-Tomas
1,2,3,4,
Dolores Corella
3,7,
Helmut Schröder
8,10,
Dora Romaguera
3,9,
Jesús Vioque
10,11,
Ángel M. Alonso-Gómez
3,12,
Julia Wärnberg
3,13,
Alfredo J. Martínez
3,14,
Lluís Serra-Majem
3,15,
Ramon Estruch
3,16,
Araceli Muñoz-Garach
3,17,
José Lapetra
3,18,
Xavier Pintó
3,19,
Josep A. Tur
3,20,
Antonio Garcia-Rios
3,21,
Aurora Bueno-Cavanillas
10,22,
Miguel Delgado-Rodríguez
10,23,
Pilar Matía-Martín
24,
Lidia Daimiel
25,
Vicente Martín-Sánchez
10,26,
Josep Vidal
27,28,
Clotilde Vázquez
3,29,
Emilio Ros
3,30,
Miguel Ruiz-Canela
3,5,
Mónica Bulló
1,2,3,4,
Jose V. Sorli
3,7,
Mireia Quifer
3,8,
Antoni Colom
3,9,
Alejandro Oncina-Canovas
10,11,
Lucas Tojal-Sierra
3,12,
Javier Barón-López
3,31,
Napoleón Pérez-Farinós
3,31,
Itziar Abete
3,14,
Almudena Sanchez-Villegas
3,15,
Rosa Casas
3,16,
José C. Fernández-Garcia
3,17,
José M. Santos-Lozano
3,18,
Emili Corbella
3,19,
Maria del M. Bibiloni
3,20,
Javier Diez-Espino
3,5,
Eva M. Asensio
3,7,
Laura Torras
3,8,
Marga Morey
3,9,
Laura Compañ-Gabucio
10,11,
Itziar Salaverria-Lete
3,12,
Juan C. Cenoz-Osinaga
3,5,
Olga Castañer
3,8 and
Jordi Salas-Salvadó
1,2,3,4,*
add Show full author list remove Hide full author list
1
Universitat Rovira i Virgili, Departament de Bioquímica i Biotecnologia, Unitat de Nutrició, 43201 Reus, Spain
2
Institut d’Investigació Sanitària Pere Virgili (IISPV), 43007 Reus, Spain
3
Centro de Investigación Biomédica en Red Fisiopatologia de la Obesidad y la Nutrición (CIBEROBN), InstituteofHealth Carlos III, 28029 Madrid, Spain
4
University Hospital of Sant Joan de Reus, Nutrition Unit, 43204 Reus, Spain
5
Department of Preventive Medicine and Public Health, University of Navarra, IDISNA, 31009 Pamplona, Spain
6
Department of Nutrition, Harvard T.H. Chan School of Public Health, Boston, MA 02115, USA
7
Department of Preventive Medicine, University of Valencia, 46010 Valencia, Spain
8
Cardiovascular Risk and Nutrition research group (CARIN), Hospital del Mar Research Institute (IMIM), 08003 Barcelona, Spain
9
Clinical Epidemiology and Public Health Department, Health Research Institute of the Balearic Islands (IdISBa), 07120 Palma de Mallorca, Spain
10
CIBER de Epidemiología y Salud Pública (CIBERESP), Instituto de Salud Carlos III, 28009 Madrid, Spain
11
Miguel Hernandez University, ISABIAL-FISABIO, 03202 Alicante, Spain
12
Department of Cardiology, Organización Sanitaria Integrada (OSI) ARABA, University Hospital Araba, 01009 Vitoria-Gasteiz, Spain
13
Department of Nursing, School of Health Sciences, University of Málaga-IBIMA, 29016 Málaga, Spain
14
Department of Nutrition, Food Science and Physiology, University of Navarra, IDISNA, 43204 Pamplona, Spain
15
University of Las Palmas de Gran Canaria, Research Institute of Biomedical and Health Sciences (IUIBS), Preventive Medicine Service, Centro Hospitalario Universitario Insular Materno Infantil (CHUIMI), Canarian Health Service, 35001 Las Palmas, Spain
16
Department of Internal Medicine, IDIBAPS, Hospital Clinic, University of Barcelona, 08007 Barcelona, Spain
17
Virgen de la Victoria Hospital, Department of Endocrinology (IBIMA), University of Málaga, 29016 Málaga, Spain
18
Department of Family Medicine, Research Unit, Distrito Sanitario Atención Primaria Sevilla, 41013 Sevilla, Spain
19
Lipids and Vascular Risk Unit, Internal Medicine, Hospital Universitario de Bellvitge, Hospitalet de Llobregat, 08907 Barcelona, Spain
20
Research Group on Community Nutrition & Oxidative Stress, University of Balearic Islands & Health Research Institute of the Balearic Islands (IdISBa), 07120 Palma de Mallorca, Spain
21
Department of Internal Medicine, Maimonides Biomedical Research Institute of Cordoba (IMIBIC), Reina Sofia University Hospital, University of Cordoba, 14071 Cordoba, Spain
22
Department of Preventive Medicine, University of Granada, 18071 Granada, Spain
23
Division of Preventive Medicine, Faculty of Medicine, University of Jaén, 23071 Jaén, Spain
24
Department of Endocrinology and Nutrition, Instituto de Investigación Sanitaria Hospital Clínico San Carlos (IdISSC), 28040 Madrid, Spain
25
Nutritional Genomics and Epigenomics Group, IMDEA Food, CEI UAM + CSIC, 28049 Madrid, Spain
26
Institute of Biomedicine (IBIOMED), University of León, 24071 León, Spain
27
CIBER Diabetes y enfermedades Metabólicos (CIBERDEM), Instituto de Salud Carlos III (ISCIII), 28029 Madrid, Spain
28
Endocrinology and Nutrition Department, Hospital Clinic Universitari, Barcelona, Spain; Institut d’Investigacions Biomèdiques August Pi Sunyer (IDIBAPS), 08036 Barcelona, Spain
29
Department of Endocrinology and Nutrition, University Hospital Fundación Jimenez Díaz, 28040 Madrid, Spain
30
Lipid Clinic, Endocrinology and Nutrition Service, Institut d’Investigacions Biomediques August Pi Sunyer (IDIBAPS), Hospital Clinic, University of Barcelona, 08007 Barcelona, Spain
31
Department of Public Health, University of Málaga-IBIMA, 29016 Málaga, Spain
*
Author to whom correspondence should be addressed.
Nutrients 2019, 11(4), 761; https://doi.org/10.3390/nu11040761
Submission received: 7 March 2019 / Revised: 27 March 2019 / Accepted: 29 March 2019 / Published: 1 April 2019

Abstract

:
The aim of the study was to evaluate sleep duration and sleep variability in relation to serum uric acid (SUA) concentrations and SUA to creatinine ratio. This is a cross-sectional analysis of baseline data from 1842 elderly participants with overweight/obesity and metabolic syndrome in the (Prevención con Dieta Mediterránea) PREDIMED-Plus trial. Accelerometry-derived sleep duration and sleep variability were measured. Linear regression models were fitted to examine the aforementioned associations. A 1 hour/night increment in sleep duration was inversely associated with SUA concentrations (β = −0.07, p = 0.047). Further adjustment for leukocytes attenuated this association (p = 0.050). Each 1-hour increment in sleep duration was inversely associated with SUA to creatinine ratio (β = −0.15, p = 0.001). The findings of this study suggest that longer sleep duration is associated with lower SUA concentrations and lower SUA to creatinine ratio.

1. Introduction

Uric acid is a terminal product of purine degradation, and high levels of circulating uric acid have been associated with gout, type 2 diabetes (T2D), and renal and cardiovascular diseases [1]. Recently, a higher serum uric acid (SUA) to creatinine ratio was associated with an increased risk of metabolic syndrome [2], and predicted chronic kidney disease incidence in T2D patients [3] and chronic obstructive pulmonary disease as compared to uric acid alone [4]. Growing evidence also suggests that elevated SUA levels are frequently identified in patients with obstructive sleep apnea [5], possibly due to elevations in catecholamine levels [6] and intermittent hypoxia. Loss of sleep may also contribute to raised nocturnal catecholamine levels [7].
Sleep is a crucial determinant for metabolic homeostasis, and loss of sleep or disruptions of sleep–wake patterns have been associated with metabolic impairments. Sleep deprivation and sleep–wake cycle disturbances have been shown to activate proteolytic pathways which may affect the balance between protein synthesis and degradation, favoring catabolism [8,9]. As a result, proteins are broken down into their by-products, such as purines, which are metabolized to uric acid. To date, only one study without significant results has examined associations between subjective sleep duration and SUA levels [10].
No previous epidemiologic study has examined the association of objectively measured sleep characteristics with SUA and uric acid to creatinine ratio. Therefore, in the present cross-sectional study nested in the framework of the PREDIMED-Plus trial we tested the following two hypotheses: (1) shorter sleep duration is associated with higher SUA concentrations and higher SUA to creatinine ratio; and (2) higher sleep variability is associated with higher SUA concentrations and higher SUA to creatinine ratio.

2. Methods

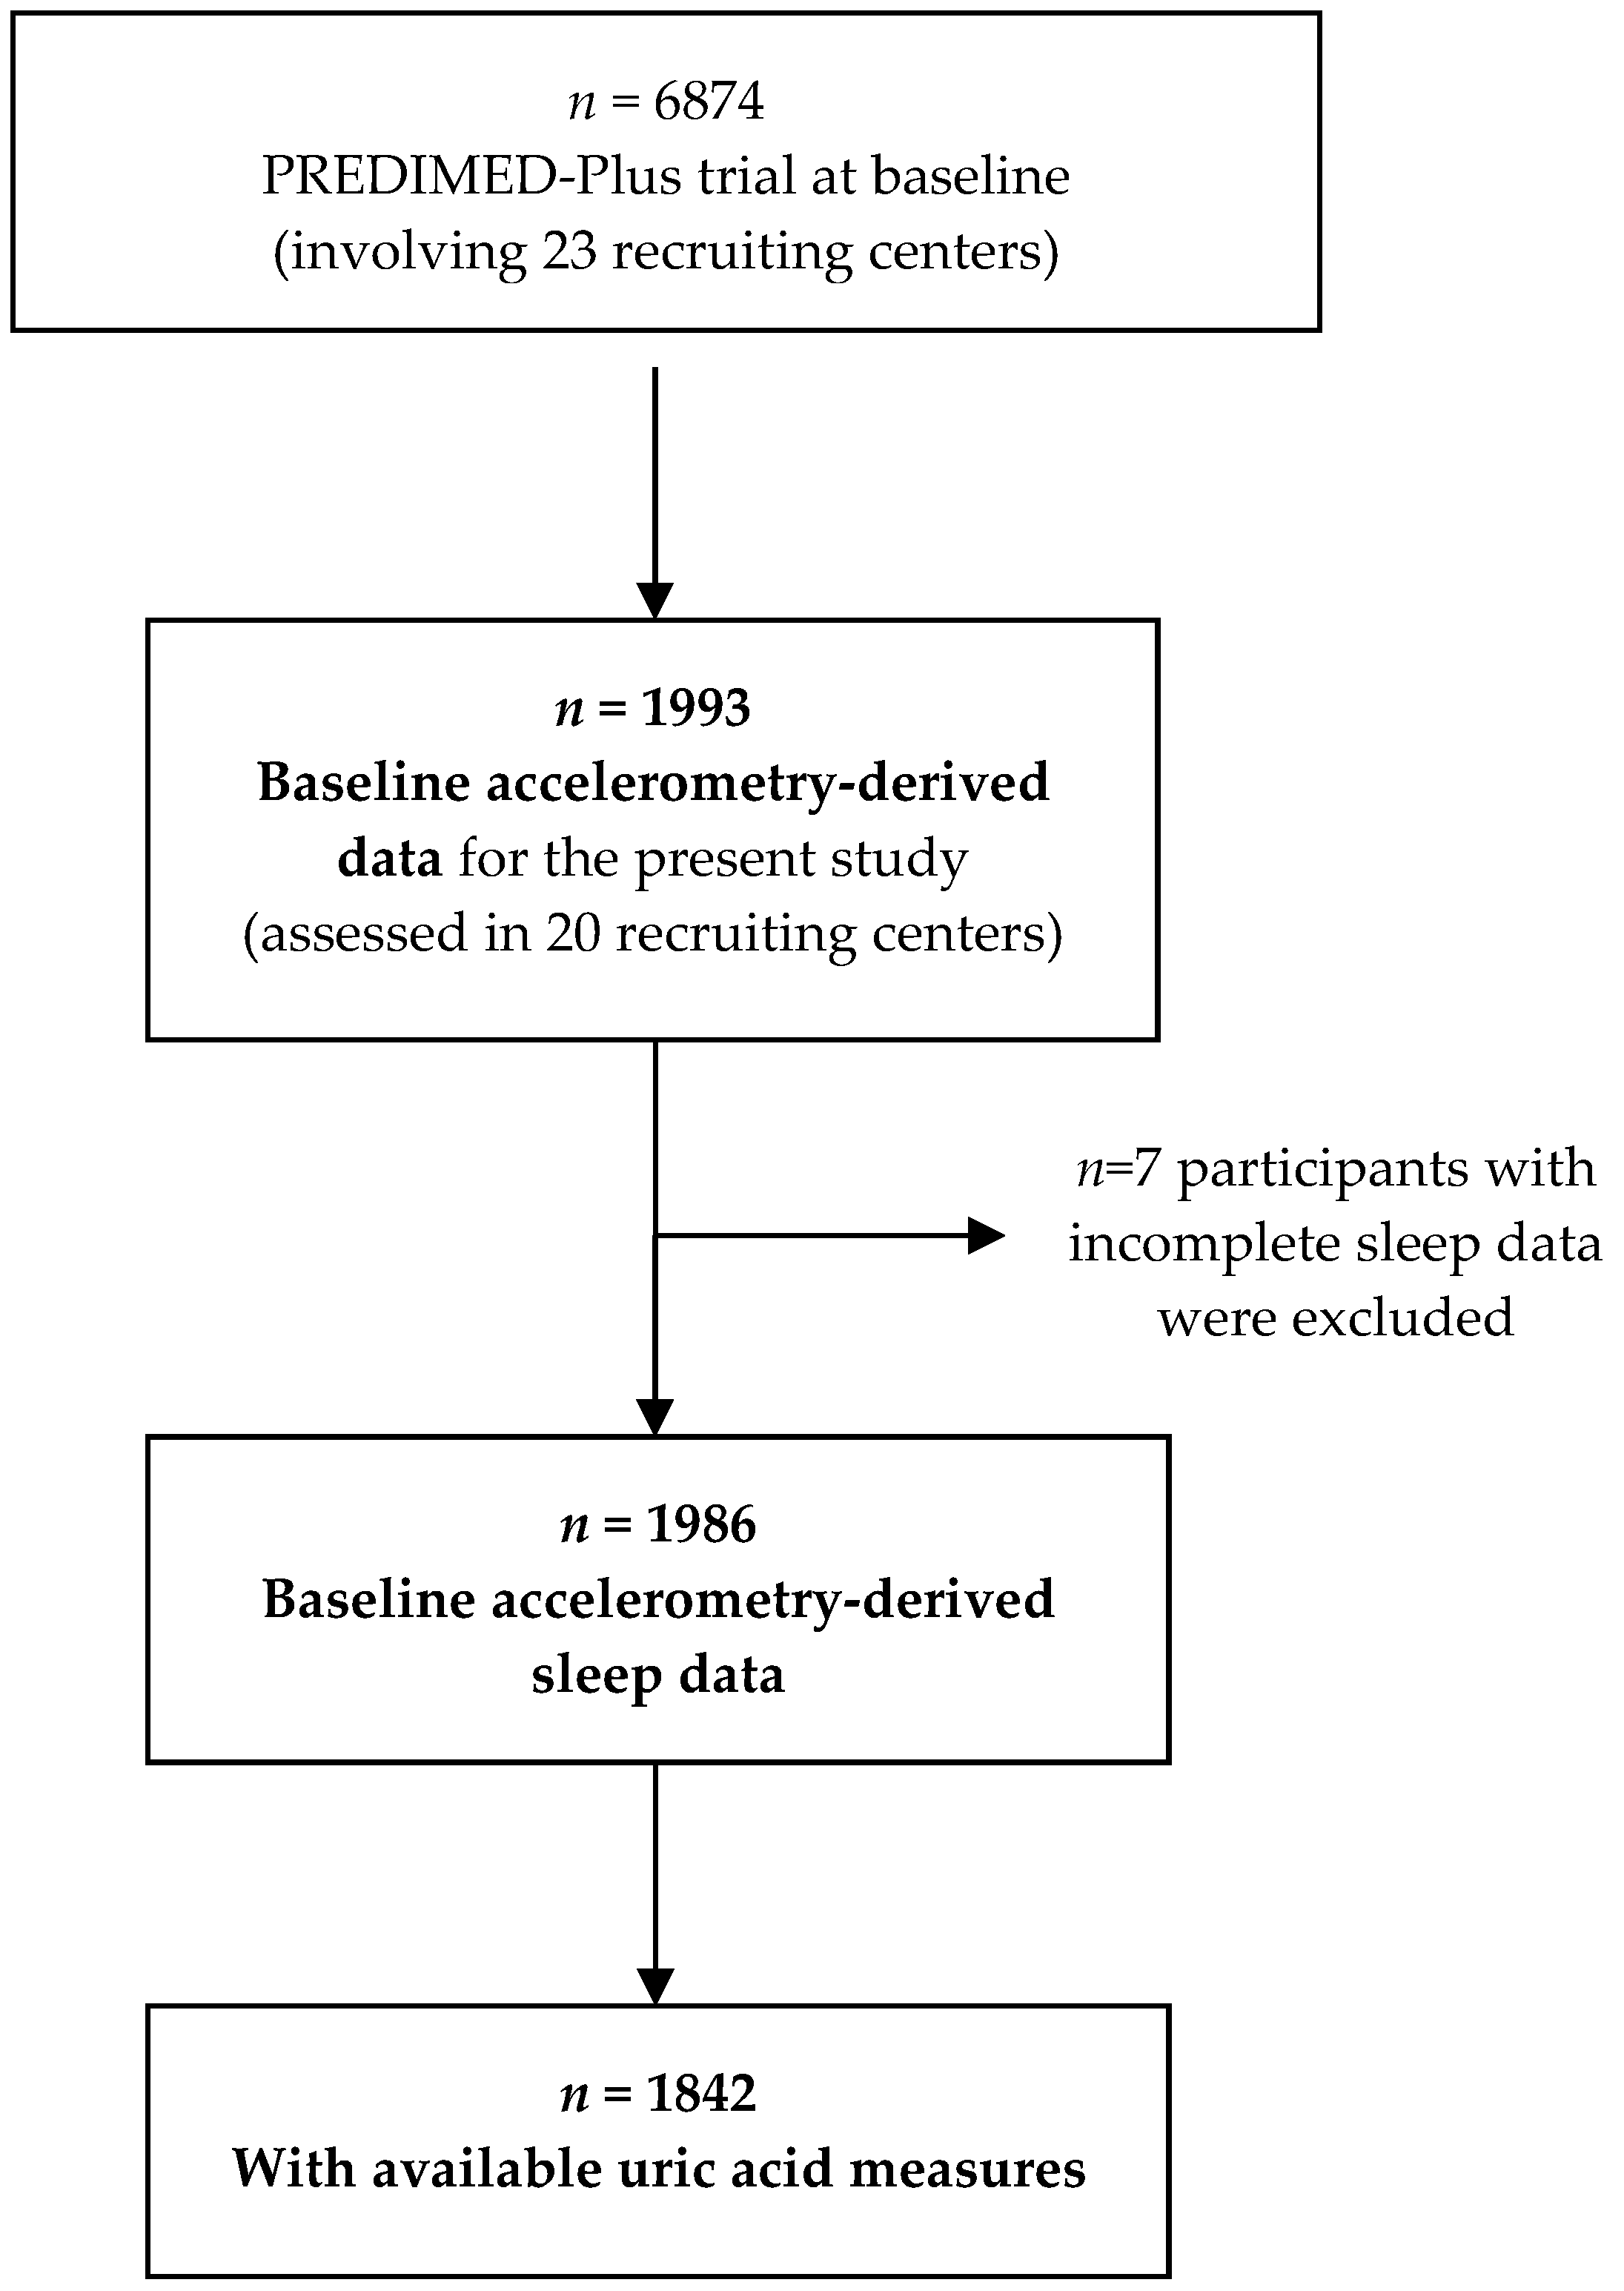
2.1. Study Design and Population

We cross-sectionally analyzed data from the PREDIMED-Plus trial, a 6-year parallel-group, multicenter lifestyle intervention study involving 6874 participants recruited in 23 Spanish recruiting centers. Our analysis was performed before the implementation of the energy-restricted diet. The design of the PREDIMED-Plus trial has been described in detail elsewhere [11]. Community-dwelling adults (aged 55–75 years) with body mass index (BMI) ≥27 and <40 kg/m2, and meeting ≥3 metabolic syndrome individual components were included [12]. As previous studies have shown, females have a higher life expectancy than males, and since the main outcomes of PREDIMED-Plus study are cardiovascular diseases and mortality, we decided to recruit females aged at least 60 years and males aged equal or more than 55 in order to account for sex differences in life expectancy. We included participants with a BMI above 27 kg/m2 following the classification used by the Nutrition Screening Initiative [13] and adopted by Lipschitz [14], in which seniors with a BMI above 27 kg/m2 are classified as overweight. Out of the 6874 participants, data derived from accelerometry were available in a subsample of participants (n = 1993). Seven participants were excluded due to incomplete sleep data, resulting in a sample size of 1986 (Figure 1). Of these, 1842 participants had available uric acid measures (Figure 1). All participants provided written informed consent, and the study protocol and procedures were approved according to the ethical standards of the Declaration of Helsinki by all the participating institutions: El Comité de Ética de la Investigación (CEI) Provincial de Málaga, CEI de los Hospitales Universitarios Virgen Macarena y Virgen del Rocío, CEI de la Universidad de Navarra, CEI de las Illes Balears, El Comitè d’Ètica d’Investigació Clínica (CEIC) del Hospital Clínic de Barcelona, CEIC del Parc de Salut Mar, CEIC del Hospital Universitari Sant Joan de Reus, CEI del Hospital Universitario San Cecilio, CEIC de la Fundación Jiménez Díaz, CEIC Euskadi, CEI en Humanos de la Universidad de Valencia, CEIC del Hospital Universitario de Gran Canaria Doctor Negrín, CEIC del Hospital Universitario de Bellvitge, CEI de Córdoba, CEI de Instituto Madrileño De Estudios Avanzados, CEIC del Hospital Clínico San Carlos, CEI Provincial de Málaga, CEI de las Illes Balears, El Comité Coordinador de Ética d’Investigació (CCEI) de la Investigación Biomédica de Andalucía, and CEIC de León.

2.2. Biochemical Analyses

Fasting blood samples were collected, and laboratory technicians, who were blinded to the intervention group, performed biochemical analyses on fasting SUA using standard enzymatic procedures. Serum creatinine was measured by enzymatic reaction using the Jaffe method. Leukocyte counts were measured using an automated analyzer.

2.3. Sleep Assessment by Accelerometry

Participants were asked to wear a wrist-worn triaxial accelerometer (GENEActiv, ActivInsights Ltd, Kimbolton, United Kingdom) on their nondominant wrist for 8 consecutive days. Detailed methods of accelerometer data analysis are reported elsewhere [15]. The average nocturnal sleep duration, and intra-subject standard deviation of the sleep duration were calculated.

2.4. Covariate Assessment

Information about age, sex, education, marital and employment status, smoking habits, depression, sleep apnea, and use of sedatives was provided by structured interviews. Adherence to an energy-restricted Mediterranean diet (MedDiet) was assessed using a 17-item questionnaire. A systolic and/or diastolic blood pressure ≥130/85 mmHg or antihypertensive drug usage were used to define high blood pressure. Moderate to vigorous physical activity (MVPA) was calculated and a new binary variable was created according to compliance of the WHO recommendations for MVPA set in ≥150 min/week [16]. T2D was defined as previous clinical diagnosis of diabetes, hemoglobin A1C (HbA1c) ≥ 6.5%, use of antidiabetic medication, or fasting plasma glucose >126 mg/dL.

2.5. Statistical Analysis

The normal distribution of the variables was evaluated using the Kolmogorov–Smirnov test. Participants’ characteristics according to categories of sleep duration are presented as means (±SD) or median (interquartile range) for quantitative variables, and percentages (%) and numbers (n) for categorical variables. These characteristics were examined across five categories of night sleep duration (<6 h, 6 to <7 h, 7 to <8 h, 8 to <9 h, and ≥9 h) [17]. One-way ANOVA (Bonferroni post hoc analysis for pairwise comparisons) or Kruskal–Wallis (Mann–Whitney tests in the post-hoc multiple comparisons) and chi-squared tests were used, as appropriate, to examine between-categories differences. Linear regression models were fitted to examine the associations of 1 h/day increment in sleep duration and sleep variability with SUA and SUA to creatinine ratio. A number of models were examined. For both outcomes, Model 1 was adjusted for sex and age (continuous). Model 2 was further adjusted for BMI (continuous), marital status (single/divorced, married, widower), employment (working, nonworking, retired), education (primary education, secondary education, academic/graduate), smoking habit (current smoker, past smoker, never smoked), sedative treatment (yes/no), sleep apnea (yes/no), T2D (yes/no), uric acid agents (allopurinol, febuxostat) (yes/no), hypertension (yes/no), depression (yes/no), 17-item energy-restricted Mediterranean diet (continuous), compliance with MVPA recommendations set at ≥150 min/week (yes/no), time spent in sustained inactivity bouts (“daytime napping”, min/day), and intervention center. A third model was fitted by including variables from Model 2 plus leukocytes in order to account for possible influence of this indirect inflammatory marker in the aforementioned associations [18,19,20]. The variables (sleep variability and daytime napping) that did not present a normal pattern were transformed logarithmically prior to these analyses. We used multiple imputation methods using the Stata “MI” module (the number of imputation was set to 20) to replace the missing values of leukocytes in 42 participants. Significance was set at p-values < 0.05.

3. Results

General characteristics as well as sleep and biochemical parameters for the entire population and by categories of nocturnal sleep duration are displayed in Table 1 and Table 2. The mean age of participants was 65.0 ± 5 years and mean nocturnal sleep duration was 6.9 ± 1.1 h, while the median sleep variability was 0.8 0.6; 1.1h, According to categories of sleep duration, those participants sleeping less than 6 hours were more likely to be younger and male compared to all the other sleep duration categories. They were also more likely to have a higher BMI, adhere less to an energy-restricted MedDiet, have higher education, and be currently employed. Regarding SUA and SUA to creatinine ratio, their values were higher in those participants sleeping less than 6 h. Spearman correlation coefficients among uric acid, creatinine, and leukocytes are shown in Supplementary Table S1. SUA was positively correlated with leukocytes (r = 0.11, p < 0.001).
In the fully adjusted model, a 1 hour/night increment in sleep duration was inversely associated with SUA concentrations (β = −0.07, p = 0.047) (Table 3). Further adjustment for leukocytes attenuated this association (p = 0.050). Furthermore, each 1-hour increment in sleep duration was inversely associated with the ratio of SUA to creatinine (β = −0.15, p = 0.001) and remained significant even after adjusting for leukocytes.

4. Discussion

In the present cross-sectional study of 1842 elderly participants from the PREDIMED-Plus trial, we observed inverse associations of sleep duration with SUA concentrations and the ratio of SUA to creatinine.
Elevations in catecholamine levels have been reported in participants with sleep loss [7], which may increase nucleotide turnover, thus enhancing endogenous uric acid production [21]. Furthermore, sleep deprivation may activate proteolytic pathways [8,9], leading to the production of purines and uric acid. Our results also suggest that the association between sleep duration and uric acid may be mediated by inflammation. Sleep deprivation may worsen systemic inflammation, as shown in two experimental studies in which the white blood cell and neutrophil counts were significantly higher after sleep restriction [18,19], leading to an increase in serum uric acid concentrations. Given the cross-sectional nature of this study, we cannot exclude the possibility that raised uric acid concentrations may cause inflammation by increasing leukocytes [20]. A previous study has observed that when levels of cytokines were compared between insomniacs and normal sleepers, there was a significant increase of cytokines in those with low sleep quality [22]. Another study found that chronic inflammation from any cause can lead to insomnia [23]. Whether both SUA and sleep loss can increase inflammatory markers requires further investigation. The increase in SUA to creatinine ratio in short sleepers may reflect the uric acid loading and/or a reduction in creatinine levels in circulation due to increased diuresis [24].
The current findings should be interpreted on the basis of the study’s limitations. First, the cross-sectional design does not allow any causal inference of the observed associations to be made. Second, the participants were elderly Mediterranean individuals with metabolic syndrome, thus, results cannot be extrapolated to other populations. Third, even though we adjusted for several potential confounders, residual confounding may remain. Fourth, we cannot exclude accuracy issues related to the derived sleep data. Using actigraphy in concert with complementary subjective methods such as sleep diaries may reduce these uncertainties.
In conclusion, “cross-sectional” evidence is useful to support the hypothesis that longer sleep duration is associated with lower SUA concentrations and lower SUA to creatinine ratio in elderly participants at high cardiovascular risk. Further longitudinal studies are required to clarify the temporal nature of this relationship and elucidate possible mechanisms underlying these observations.

Supplementary Materials

The following are available online at https://www.mdpi.com/2072-6643/11/4/761/s1, Table S1: Spearman’s correlation analysis between uric acid, creatinine, and leukocytes.

Author Contributions

M.Á.M.-G., D.C., D.R., J.V., Á.M.A.-G., J.W., J.A.M., J.L.-M., R.E., X.P., J.A.T., A.B.-C., M.D.-R., P.M.-M., L.D., V.M., J.V., C.V., E.R., and J.S.-S. designed the PREDIMED-Plus study. C.P., N.B., and J.S.-S., designed the research. C.P., N.B., A.D.-L., M.Á.M.-G., N.B.-T., D.C., H.S., M.F., J.V., D.R., J.V., Á.M.A.-G., J.W., A.J.M., J.A.M., J.L.-M., R.E., A.B.-C., F.A., J.A.T., F.J.T., L.S.-M., R.E., A.M.-G., V.M., J.L., C.V., X.P., J.A.T., A.G.-R., A.B.-C., M.D.-D., P.M.-M., J.V., L.D., V.M.-S., J.V., C.V., M.D-R., E.R., M.R.-C., I.A., J.B.-L., A.G.-A., M.B., J.V.S., M.Q., A.C., A.O.-C., L.T.-S., J.B.-L., N.P.-F., I.A., A.S.-V., R.C., J.C.F.-G., J.M.S.-L., E.C., M.M.B., J.D.-E., E.M.A., L.T., M.M., L.C.-G., I.S.-L., J.C.C.-O., O.C., H.S., E.T., A.A.-G., and J.S.-S., conducted the research. C.P. and J.S.-S., analyzed the data. C.P. and J.S.-S., wrote the article. C.P and J.S.-S., are the guarantors of this work and, as such, had full access to all the data in the study and take responsibility for the integrity of the data and the accuracy of the data analysis. All authors revised the manuscript for important intellectual content and read and approved the final manuscript.

Funding

The PREDIMED-Plus trial was supported by the official funding agency for biomedical research of the Spanish government, ISCIII, through the Fondo de Investigación para la Salud (FIS), which is co-funded by the European Regional Development Fund (three coordinated FIS projects led by Jordi Salas-Salvadó and Josep Vidal, including the following projects: PI13/00673, PI13/00492, PI13/00272, PI13/01123, PI13/00462, PI13/00233, PI13/02184, PI13/00728, PI13/01090, PI13/01056, PI14/01722, PI14/00636, PI14/00618, PI14/00696, PI14/01206, PI14/01919, PI14/00853, PI14/01374, PI16/00473, PI16/00662, PI16/01873, PI16/01094, PI16/00501, PI16/00533, PI16/00381, PI16/00366, PI16/01522, PI16/01120, PI17/00764, PI17/01183, PI17/00855, PI17/01347, PI17/00525, PI17/01827, PI17/00532, PI17/00215, PI17/01441, PI17/00508, PI17/01732, PI17/00926), the Especial Action Project entitled: Implementación y evaluación de una intervención intensives obre la actividad física Cohorte PREDIMED-PLUS grant to Jordi Salas-Salvadó, the European Research Council (Advanced Research Grant 2013–2018; 340918) grant to Miguel Ángel Martínez-Gonzalez, the Recercaixa grant to Jordi Salas-Salvadó (2013ACUP00194), the grant from the Consejería de Salud de la Junta de Andalucía (PI0458/2013; PS0358/2016), grants from the Consejería de Salud de la Junta de Andalucía (PI0458/2013; PS0358/2016; PI0137/2018), the PROMETEO/2017/017 grant from the Generalitat Valenciana, the SEMERGEN grant, and FEDER funds (CB06/03). Olga Castaner was granted by the JR17/00022, ISCIII. Christopher Papandreou is supported by a postdoctoral fellowship granted by the Autonomous Government of Catalonia (PERIS 2016–2020 Incorporació de Científics I Tecnòlegs, SLT002/0016/00428). José C. Fernández-García is supported by a research contract from Servicio Andaluz de Salud (SAS) (B-0003-2017). None of the funding sources took part in the design, collection, analysis, or interpretation of the data, or in the decision to submit the manuscript for publication. The corresponding authors had full access to all the data in the study and had final responsibility forsubmitting for publication.

Acknowledgments

The authors especially thank the PREDIMED-Plus participants for their enthusiastic collaboration, the PREDIMED-Plus personnel for their outstanding support, and the personnel of all associated primary care centers for their exceptional effort. Centros de Investigación Biomédica en Red: Obesidad y Nutrición (CIBEROBN), Centros de Investigación Biomédica en Red: Epidemiología y Salud Pública (CIBERESP), and Centros de Investigación Biomédica en Red: Diabetes y Enfermedades Metabólicas asociadas (CIBERDEM) are initiatives of the Instituto de Salud Carlos III (ISCIII), Madrid, Spain. We thank the PREDIMED-Plus Biobank Network, part of the National Biobank Platform of ISCIII, for storing and managing biological samples. The food companies Hojiblanca and Patrimonio Comunal Olivarero donated extra-virgin olive oil, and the Almond Board of California, American Pistachio Growers, and Paramount Farms donated nuts.

Conflicts of Interest

J.S.-S. reports serving on the board of and receiving grant support through his institution from the International Nut and Dried Fruit Council; receiving consulting personal fees from Danone, Font Vella Lanjaron, Nuts for Life, and Eroski; and receiving grant support through his institution from the Nut and Dried Fruit Foundation and Eroski. E.R. reports grants, non-financial support, and other fees from the California Walnut Commission and Alexion; personal fees and non-financial support from Merck, Sharp & Dohme; personal fees, non-financial support, and other fees from Aegerion and Ferrer International; grants and personal fees from Sanofi Aventis; grants from Amgen and Pfizer; and personal fees from Akcea, outside of the submitted work. X.P. reports serving on the board of and receiving consulting personal fees from Sanofi Aventis, Amgen, and Abbott laboratories; and receiving personal lecture fees from Esteve, Lacer, and Rubio laboratories. M.D.-R. reports receiving grants from the Diputación Provincial de Jaén and the Caja Rural de Jaén. L.D. reports grants from Fundación Cerveza y Salud. All other authors declare no conflict of interest.

References

  1. Ekpenyong, C.A.E. Abnormal Serum Uric Acid Levels in Health and Disease: A Double-Edged Sword. Am. J. Intern. Med. 2014, 2, 113–130. [Google Scholar] [CrossRef]
  2. Al-Daghri, N.M.; Al-Attas, O.S.; Wani, K.; Sabico, S.; Alokail, M.S. Serum Uric Acid to Creatinine Ratio and Risk of Metabolic Syndrome in Saudi Type 2 Diabetic Patients. Sci. Rep. 2017, 7, 12104. [Google Scholar] [CrossRef] [PubMed] [Green Version]
  3. Gu, L.; Huang, L.; Wu, H.; Lou, Q.; Bian, R. Serum uric acid to creatinine ratio: A predictor of incident chronic kidney disease in type 2 diabetes mellitus patients with preserved kidney function. Diab. Vasc. Dis. Res. 2017, 14, 221–225. [Google Scholar] [CrossRef] [PubMed] [Green Version]
  4. Kocak, D.N.; Sasak, G.; Akturk, A.U.; Akgun, M.; Boga, S.; Sengul, A.; Gungor, S.; Arinc, S. Serum Uric Acid Levels and Uric Acid/Creatinine Ratios in Stable Chronic Obstructive Pulmonary Disease (COPD) Patients: Are These Parameters Efficient Predictors of Patients at Risk for Exacerbation and/or Severity of Disease? Med. Sci. Monit. 2016, 22, 4169–4176. [Google Scholar] [CrossRef] [Green Version]
  5. Hirotsu, C.; Tufik, S.; Guindalini, C.; Mazzotti, D.R.; Bittencourt, L.R.; Andersen, M.L. Association between uric acid levels and obstructive sleep apnea syndrome in a large epidemiological sample. PLoS ONE 2013, 8, e66891. [Google Scholar] [CrossRef] [PubMed]
  6. Kohler, M.; Stradling, J.R. Mechanisms of vascular damage in obstructive sleep apnea. Nat. Rev. Cardiol. 2010, 7, 677–685. [Google Scholar] [CrossRef]
  7. Irwin, M.; Thompson, J.; Miller, C.; Gillin, J.C.; Ziegler, M. Effects of sleep and sleep deprivation on catecholamine and interleukin-2 levels in humans: Clinical implications. J. Clin. Endocrinol. Metab. 1999, 84, 1979–1985. [Google Scholar] [CrossRef] [PubMed]
  8. Mônico-Neto, M.; Antunes, H.K.M.; Dattilo, M.; Medeiros, A.; Souza, H.S.; Lee, K.S.; de Melo, C.M.; Tufik, S.; de Mello, M.T. Resistance exercise: A non-pharmacological strategy to minimize or reverse sleep deprivation-induced muscle atrophy. Med. Hypotheses 2013, 80, 701–705. [Google Scholar] [CrossRef] [Green Version]
  9. Adam, K.; Oswald, I. Protein synthesis, bodily renewal and the sleep-wake cycle. Clin. Sci. (Lond.) 1983, 65, 561–567. [Google Scholar] [CrossRef]
  10. Wiener, R.C.; Shankar, A. Association between Serum Uric Acid Levels and Sleep Variables: Results from the National Health and Nutrition Survey 2005–2008. Int. J. Inflam. 2012. [Google Scholar] [CrossRef] [PubMed]
  11. Martínez-González, M.A.; Buil-Cosiales, P.; Corella, D.; Bullo, M.; Fito, M.; Vioque, J.; Romaguera, D.; Martinez, J.A.; Warnberg, J.; Lopez-Miranda, J.; et al. Cohort Profile: Design and methods of the PREDIMED-Plus randomized trial. Int. J. Epidemiol. 2018. [Google Scholar] [CrossRef] [PubMed]
  12. Alberti, K.G.; International Diabetes Federation Task Force on Epidemiology and Prevention; Hational Heart, Lung, and Blood Institute; American Heart Association; World Heart Federation; International Atherosclerosis Society; International Association for the Study of Obesity. Harmonizing the metabolic syndrome: A joint interim statement of the International Diabetes Federation Task Force on Epidemiology and Prevention; National Heart, Lung, and Blood Institute; American Heart Association; World Heart Federation; International Atherosclerosis Society; and International Association for the Study of Obesity. Circulation 2009, 120, 1640–1645. [Google Scholar] [PubMed]
  13. Nutrition Screening Initiative. Nutrition Interventions Manual for Professionals Caring for Older Americans; NSI: Washington, DC, USA, 1992. [Google Scholar]
  14. Lipschitz, D.A. Screening for nutritional status in the elderly. Prim. Care 1994, 21, 55–67. [Google Scholar] [PubMed]
  15. Rosique-Esteban, N.; Papandreou, C.; Romaguera, D.; Warnberg, J.; Corella, D.; Martínez-González, M.A.; Díaz-López, A.; Estruch, R.; Vioque, J.; Arós, F.; et al. Cross-sectional associations of objectively-measured sleep characteristics with obesity and type 2 diabetes in the PREDIMED-Plus trial. Sleep 2018, 41. [Google Scholar] [CrossRef]
  16. World Health Organization. Global Recommendations on Physical Activity for Health. 2010. Available online: http://www.who.int/dietphysicalactivity/factsheet_olderadults/en/ (accessed on 3 April 2018).
  17. Hirshkowitz, M.; Whiton, K.; Albert, S.M.; Alessi, C.; Bruni, O.; DonCarlos, L.; Hazen, N.; Herman, J.; Hillard, P.J.A.; Katz, E.S.; et al. National Sleep Foundation’s updated sleep duration recommendations: Final report. Sleep Health 2015, 1, 233–243. [Google Scholar] [CrossRef]
  18. Liu, H.; Wang, G.; Luan, G.; Liu, Q. Effects of sleep and sleep deprivation on blood cell count and hemostasis parameters in healthy humans. J. Thromb. Thrombolysis 2009, 28, 46–49. [Google Scholar] [CrossRef]
  19. Boudjeltia, K.Z.; Faraut, B.; Stenuit, P.; Esposito, M.J.; Dyzma, M.; Brohée, D.; Ducobu, J.; Vanhaeverbeek, M.; Kerkhofs, M. Sleep restriction increases white blood cells, mainly neutrophil count, in young healthy men: A pilot study. Vasc. Health Risk Manag. 2008, 4, 1467–1470. [Google Scholar] [CrossRef] [PubMed]
  20. Ruggiero, C.; Cherubini, A.; Ble, A.; Bos, A.J.G.; Maggio, M.; Dixit, V.D.; Lauretani, F.; Bandinelli, S.; Senin, U.; Ferrucci, L. Uric acid and inflammatory markers. Eur. Heart J. 2006, 27, 1174–1181. [Google Scholar] [CrossRef] [PubMed] [Green Version]
  21. Glantzounis, G.K.; Tsimoyiannis, E.C.; Kappas, A.M.; Galaris, D.A. Uric acid and oxidative stress. Curr. Pharm. Des. 2005, 11, 4145–4151. [Google Scholar] [CrossRef] [PubMed]
  22. Vgontzas, A.N.; Zoumakis, M.; Papanicolaou, D.A.; Bixler, E.O.; Prolo, P.; Lin, H.-M.; Vela-Bueno, A.; Kales, A. Chronic insomnia is associated with a shift of interleukin-6 and tumor necrosis factor secretion from nighttime to daytime. Metabolism 2002, 51, 887–892. [Google Scholar] [CrossRef] [PubMed]
  23. Raison, C.L.; Rye, D.B.; Woolwine, B.J.; Vogt, G.J.; Bautista, B.M.; Spivey, J.R.; Miller, A.H. Chronic interferon-alpha administration disrupts sleep continuity and depth in patients with hepatitis C: Association with fatigue, motor slowing, and increased evening cortisol. Biol. Psychiatry 2010, 68, 942–949. [Google Scholar] [CrossRef] [PubMed]
  24. Kamperis, K.; Hagstroem, S.; Radvanska, E.; Rittig, S.; Djurhuus, J.C. Excess diuresis and natriuresis during acute sleep deprivation in healthy adults. Am. J. Physiol. Renal Physiol. 2010, 299, 404–411. [Google Scholar] [CrossRef] [PubMed]
Figure 1. Flow-chart of study participants.
Nutrients 11 00761 g001
Table 1. General characteristics of the study population from Prevención con Dieta Mediterránea-Plus trial across categories of nocturnal sleep duration.
Categories of Nocturnal Sleep Duration (h)
Total
n = 1842
<6 h
n = 308
6–<7 h
n = 618
7–<8 h
n = 654
8–<9 h
n = 225
≥9 h
n = 37
p-Value
Age, mean ± SD, years65 ± 564 ± 565 ± 565 ± 566 ± 468 ± 4<0.001
Male, n (%)979(53)229(74)348(56)305(46)85(38)12(32)<0.001
BMI, mean ± SD, kg/m232.6 ± 3.433.1 ± 3.532.5 ± 3.532.3 ± 3.432.6 ± 3.232.5 ± 3.40.031
Type 2 diabetes, n (%)505(27)95(31)174(28)170(26)51(22)15(40)0.156
Sleep apnea, n (%)237(13)49(16)73(12)89(13)23(10)3(8)0.229
Depression, n (%)389(21)59(19)113(17)153(23)65(29)11(30)0.001
Sedative treatment, n (%)442(24)53(17)114(18)175(27)86(38)14(38)<0.001
Uric acid agents, n (%)168(9)27(9)62(10)66(10)10(4)3(8)0.117
Smoking, n (%)
Never795(43)91(29)254(41)314(48)114(51)22(61)<0.001
Former828(45)168(55)289(47)280(43)82(36)9(25)
Current212(11)48(15)73(12)58(9)28(12)5(14)
Adherence to energy-restricted MedDiet
(score from 0 to 17 items), mean ± SD
8.6 ± 2.78.2 ± 2.78.7 ± 2.78.5 ± 2.78.7 ± 2.79.6 ± 2.90.017
Compliance of MVPA recommendations a, n (%)352(19)51(16)133(21)134(20)33(13)4(11)0.027
Education status, n (%)
Primary education909(49)136(44)278(45)338(52)132(59)25(67)<0.001
Secondary education494(27)76(25)175(28)185(28)52(23)6(16)
Academic/graduate413(22)92(30)157(25)124(18)35(15)5(13)
Employment status, n (%)
Working376(20)92(30)148(24)110(17)25(11)1(2)<0.001
Non-working441(25)62(18)147(23)182(26)71(29)10(26)
Retired1017(55)160(53)331(54)363(55)136(60)27(73)
Marital status, n (%)
Single/divorced267(14)49(16)95(15)93(14)22(10)8(21)0.029
Married1369(75)227(74)471(77)477(73)170(76)24(65)
Widower196(11)31(10)46(7)82(12)32(14)5(13)
Data is presented as mean ± SD unless otherwise indicated. Abbreviations: BMI, body mass index; MedDiet, Mediterranean Diet; MVPA, moderate to vigorous physical activity. a Recommendations for MVPA set at ≥150 min/week for elderly persons, based on accelerometry-derived 10-min bout MVPA.The p-value for differences between categories of nocturnal sleep duration was calculated by chi-squared or one-way analysis of variance test using the Bonferroni rule to correct for type I error in the post-hoc multiple comparisons for categorical and continuous variables, respectively.
Table 2. Sleep and biochemical parameters of the study population from Prevención con Dieta Mediterránea-Plus trial across categories of nocturnal sleep duration.
Categories of Nocturnal Sleep Duration (h)
Total
n = 1842
<6 h
n = 308
6–<7 h
n = 618
7–<8 h
n = 654
8–<9 h
n = 225
≥9 h
n = 37
p-Value
Sleep parameters
Sleep duration, mean ± SD, h6.9 ± 1.15.3 ± 0.76.5 ± 0.37.4 ± 0.38.4 ± 0.29.3 ± 0.3<0.001
Sleep variability, median interquartile range, h0.8 0.6; 1.10.90.6; 1.20.8 0.6; 1.00.8 0.6; 1.10.7 0.6; 1.00.8 0.6; 0.9<0.001
Napping duration, median interquartile range, min76.749.7; 109.864.842.3; 91.167.742.9; 97.178.8 53.5; 108.6113.4 79.9; 145.2163.9 109.8; 203.5<0.001
Biochemical parameters
Serum uric acid, mean ± SD, mg/dL6.0 ± 1.46.3 ± 1.56.1 ± 1.55.9 ± 1.45.7 ± 1.45.4 ± 1.5<0.001
Creatinine, mean ± SD, mg/dL0.83 ± 0.20.85 ± 0.20.82 ± 0.20.83 ± 0.20.83 ± 0.20.80 ± 0.20.165
Serum uric acid to creatinine ratio7.4 ± 1.97.6 ± 1.97.7 ± 1.97.4 ± 1.87.1 ± 1.86.9 ± 2.2<0.001
Leukocytes, mean ± SD, counts6.7 ± 1.76.9 ± 1.86.7 ± 1.76.5 ± 1.66.8 ± 1.86.7 ± 1.40.090
Data is presented as mean ± SD or median interquartile range. The p-value for differences between categories of nocturnal sleep duration was calculated by chi-squared or one-way analysis of variance test using the Bonferroni rule to correct for type I error in the post-hoc multiple comparisons for categorical and continuous variables, respectively. In case of non-normally distributed variables we performed Kruskal–Wallis test with Mann–Whitney tests in the post-hoc multiple comparisons.
Table 3. β-coefficients (95% Confidence Interval (CI)) for association between serum uric acid, serum uric acid to creatinine ratio, and sleep measures (sleep duration, sleep variability (log-transformed)).
Model 1p-ValueModel 2p-ValueModel 3p-Value
SUA
Sleep duration (h)−0.08 (−0.14, −0.02)0.008−0.07 (−0.13, −0.01)0.047−0.06 (−0.13, 0.01)0.050
Sleep variability (h)−0.29 (−0.60, 0.01)0.056−0.26 (−0.56, 0.05)0.100−0.25 (−0.56, 0.05)0.101
SUA/Cr
Sleep duration (h)−0.20 (−0.29, −0.12)<0.001−0.15 (−0.24, −0.06)0.001−0.15 (−0.24, −0.06)0.001
Sleep variability (h)−0.30 (−0.72, 0.12)0.163−0.23 (−0.66, 0.19)0.279−0.24 (−0.67, 0.19)0.272
Abbreviations: SUA, serum uric acid; Cr, creatinine. Model 1 adjusted for sex, age (years). Model 2 adjusted for Model 1 plus body mass index (kg/m2), marital status (single/divorced, married, widower), employment (working, nonworking, retired), education (primary education, secondary education, academic/graduate), smoking habit (current smoker, past smoker, never smoked), sedative treatment (yes/no), sleep apnea (yes/no), type 2 diabetes (yes/no), uric acid agents (yes/no), hypertension (yes/no), depression (yes/no), 17-item energy-restricted Mediterranean diet, compliance to MVPA recommendations set at ≥150 min/week (yes/no), time spent in sustained inactivity bouts (“daytime napping”, min/day) and intervention center. Model 3 adjusted for Model 2 plus leukocytes.

