Zinc Intake and Status and Risk of Type 2 Diabetes Mellitus: A Systematic Review and Meta-Analysis

 , ,
, ,  , and
, and 
Abstract
:
1. Introduction
2. Materials and Methods
2.1. Search Strategy
2.2. Study Eligibility Criteria
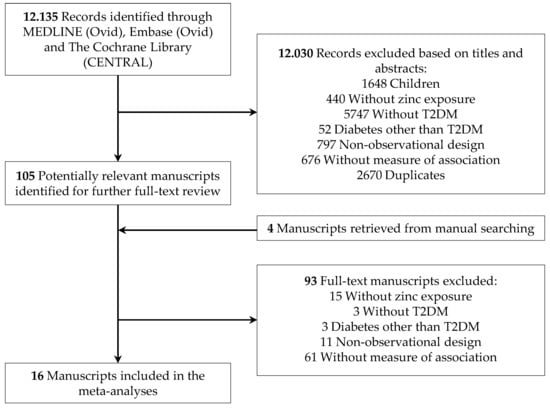
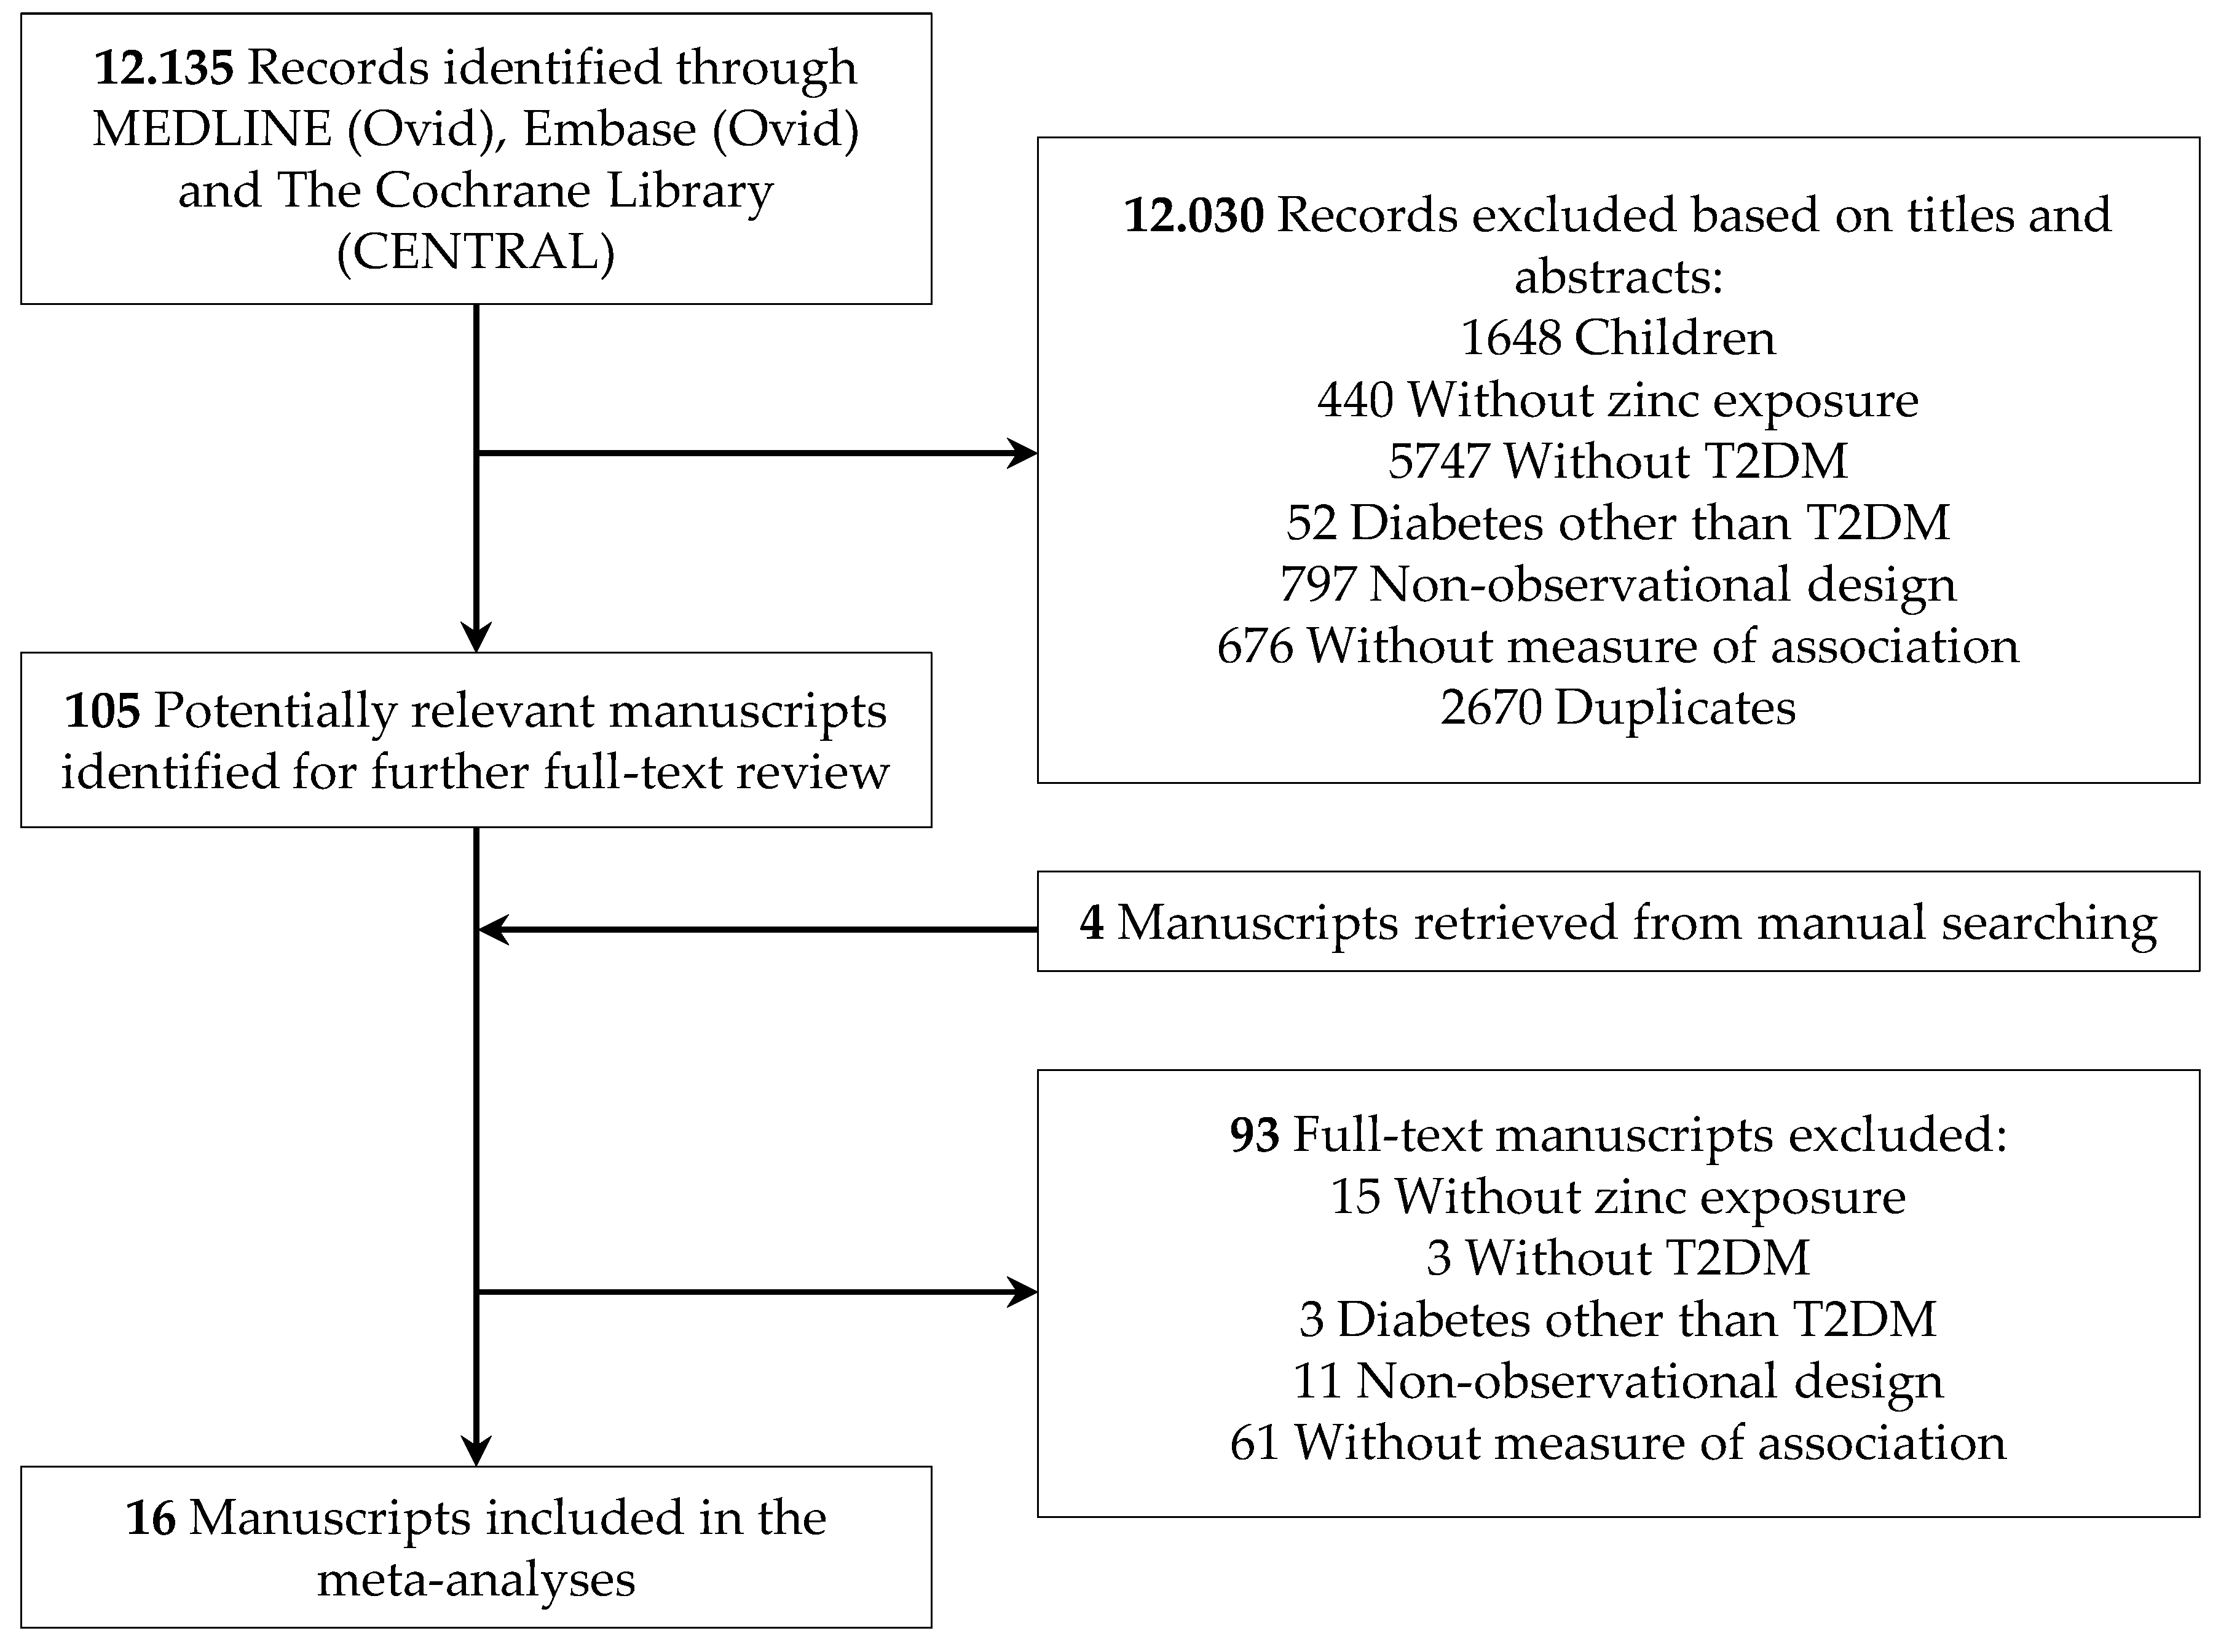
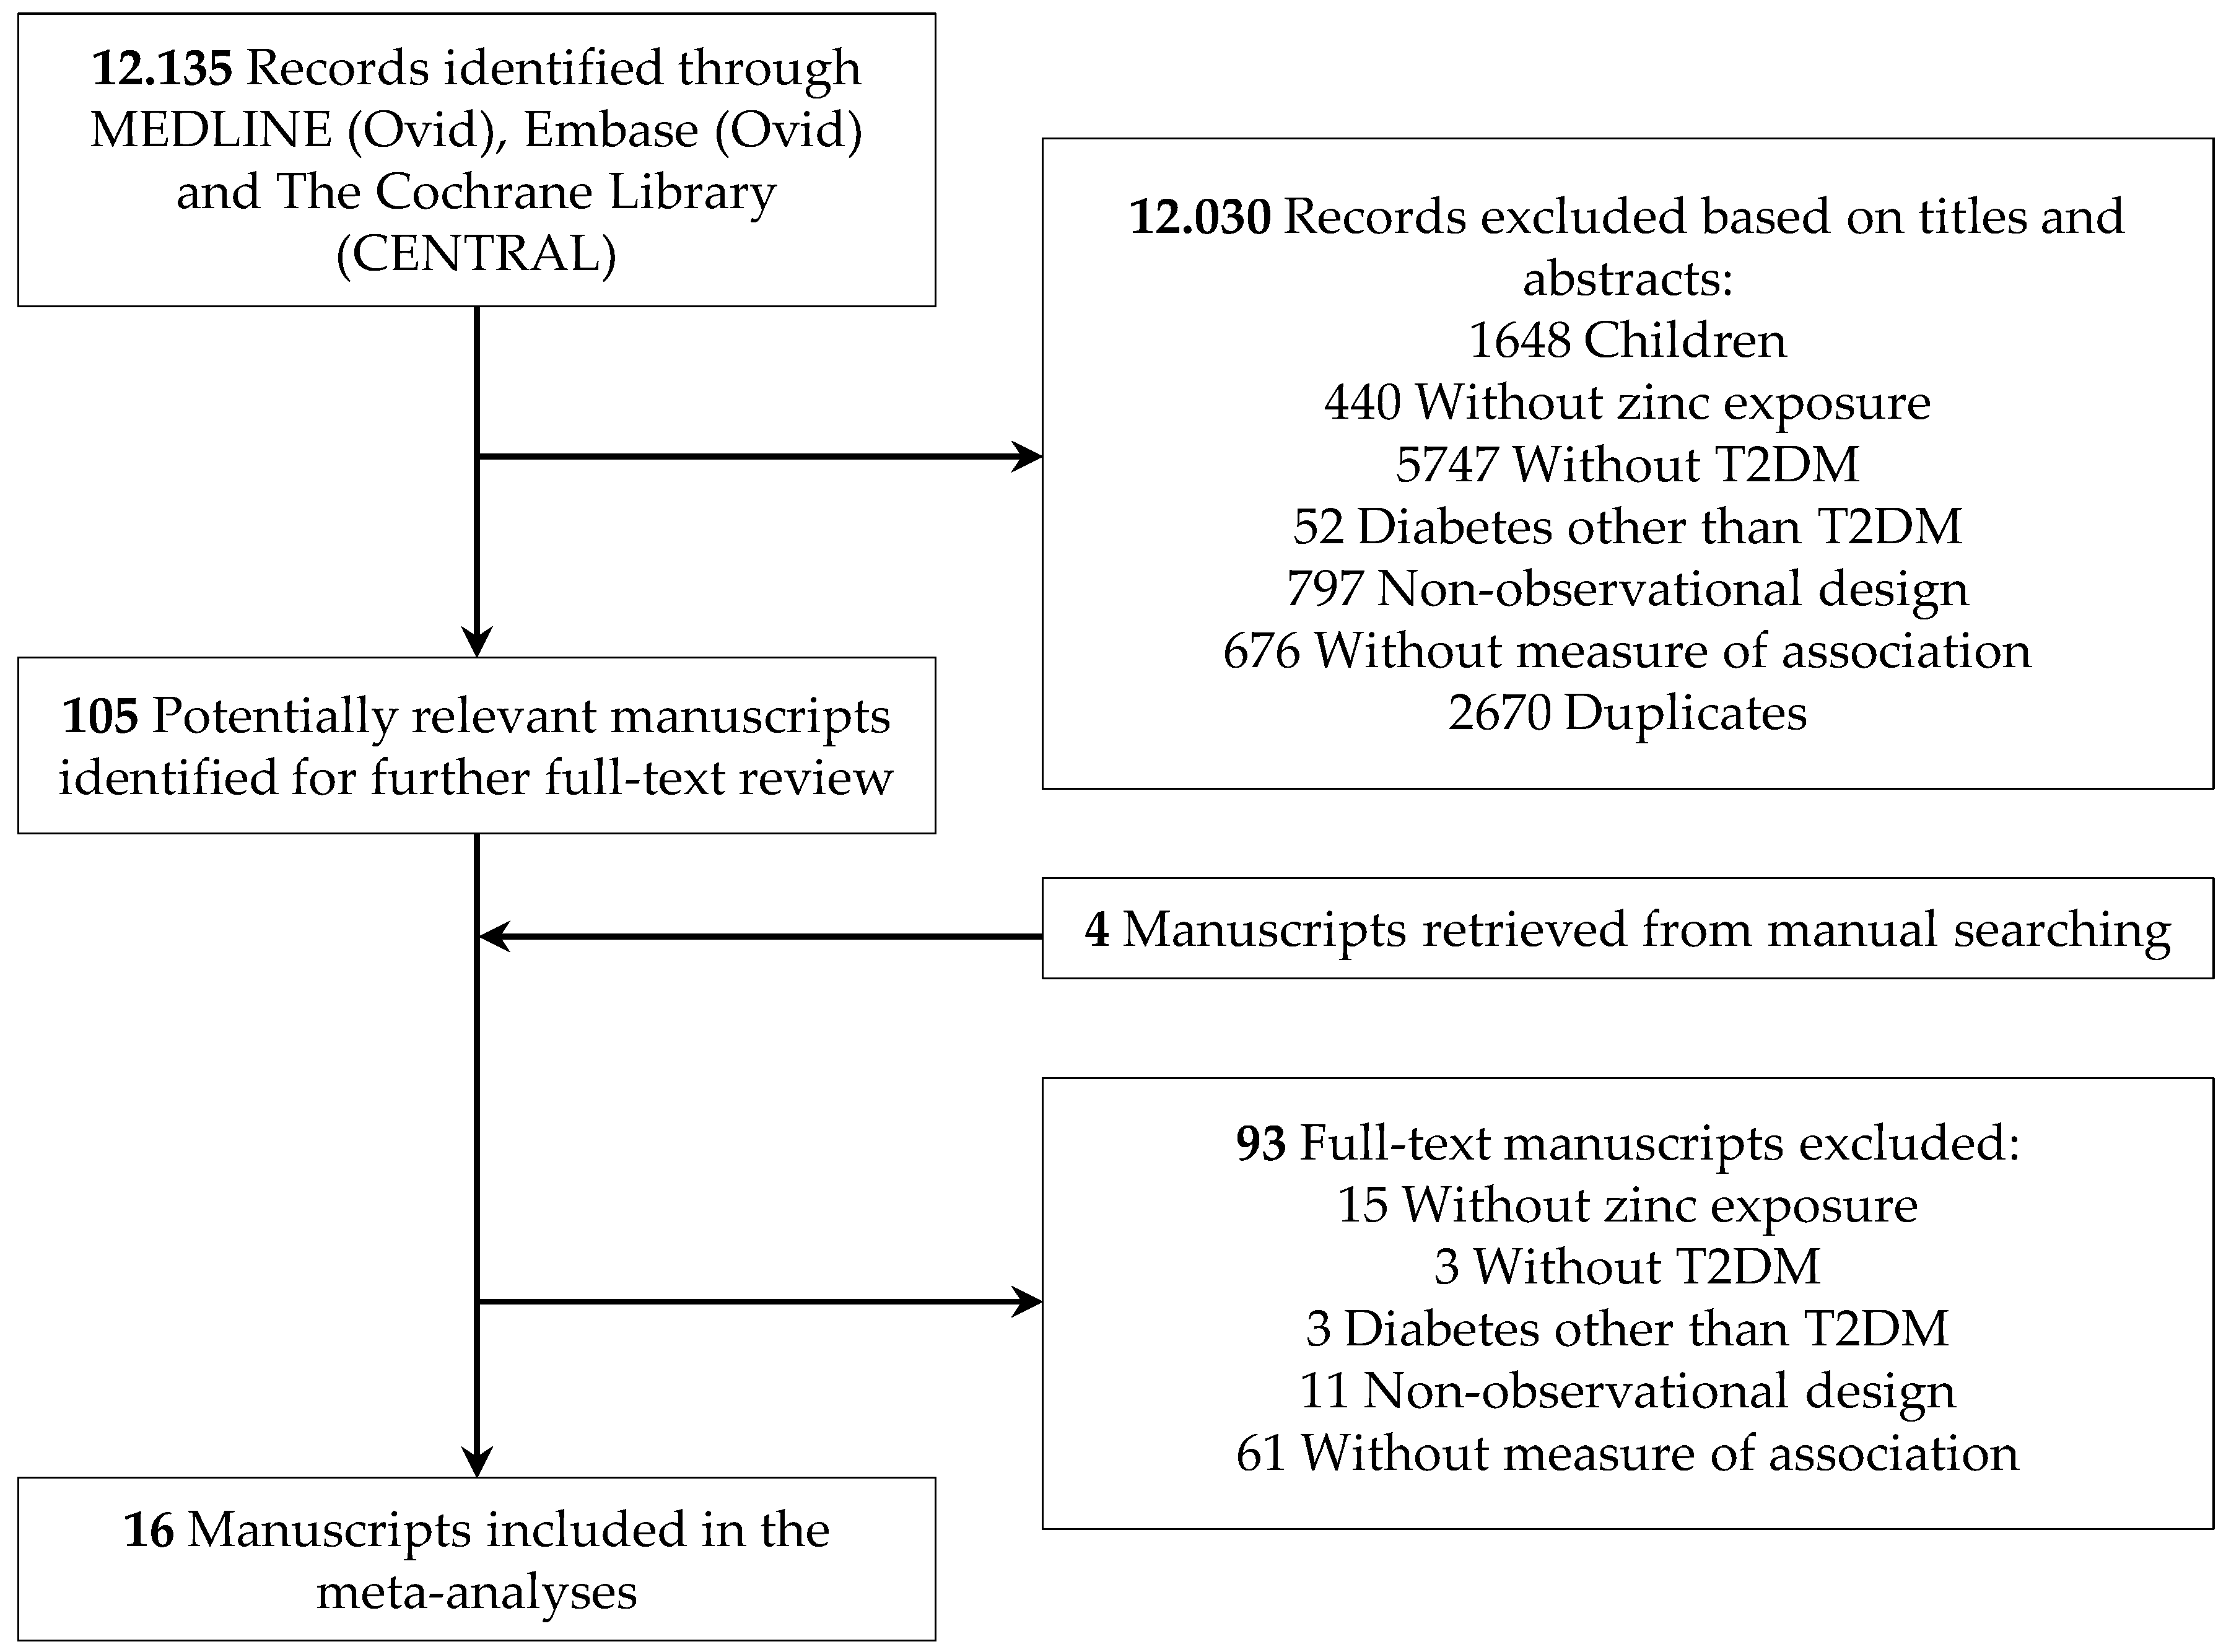
2.3. Study Selection
2.4. Data Extraction and Study Quality Assessment
2.5. Statistical Analysis
3. Results
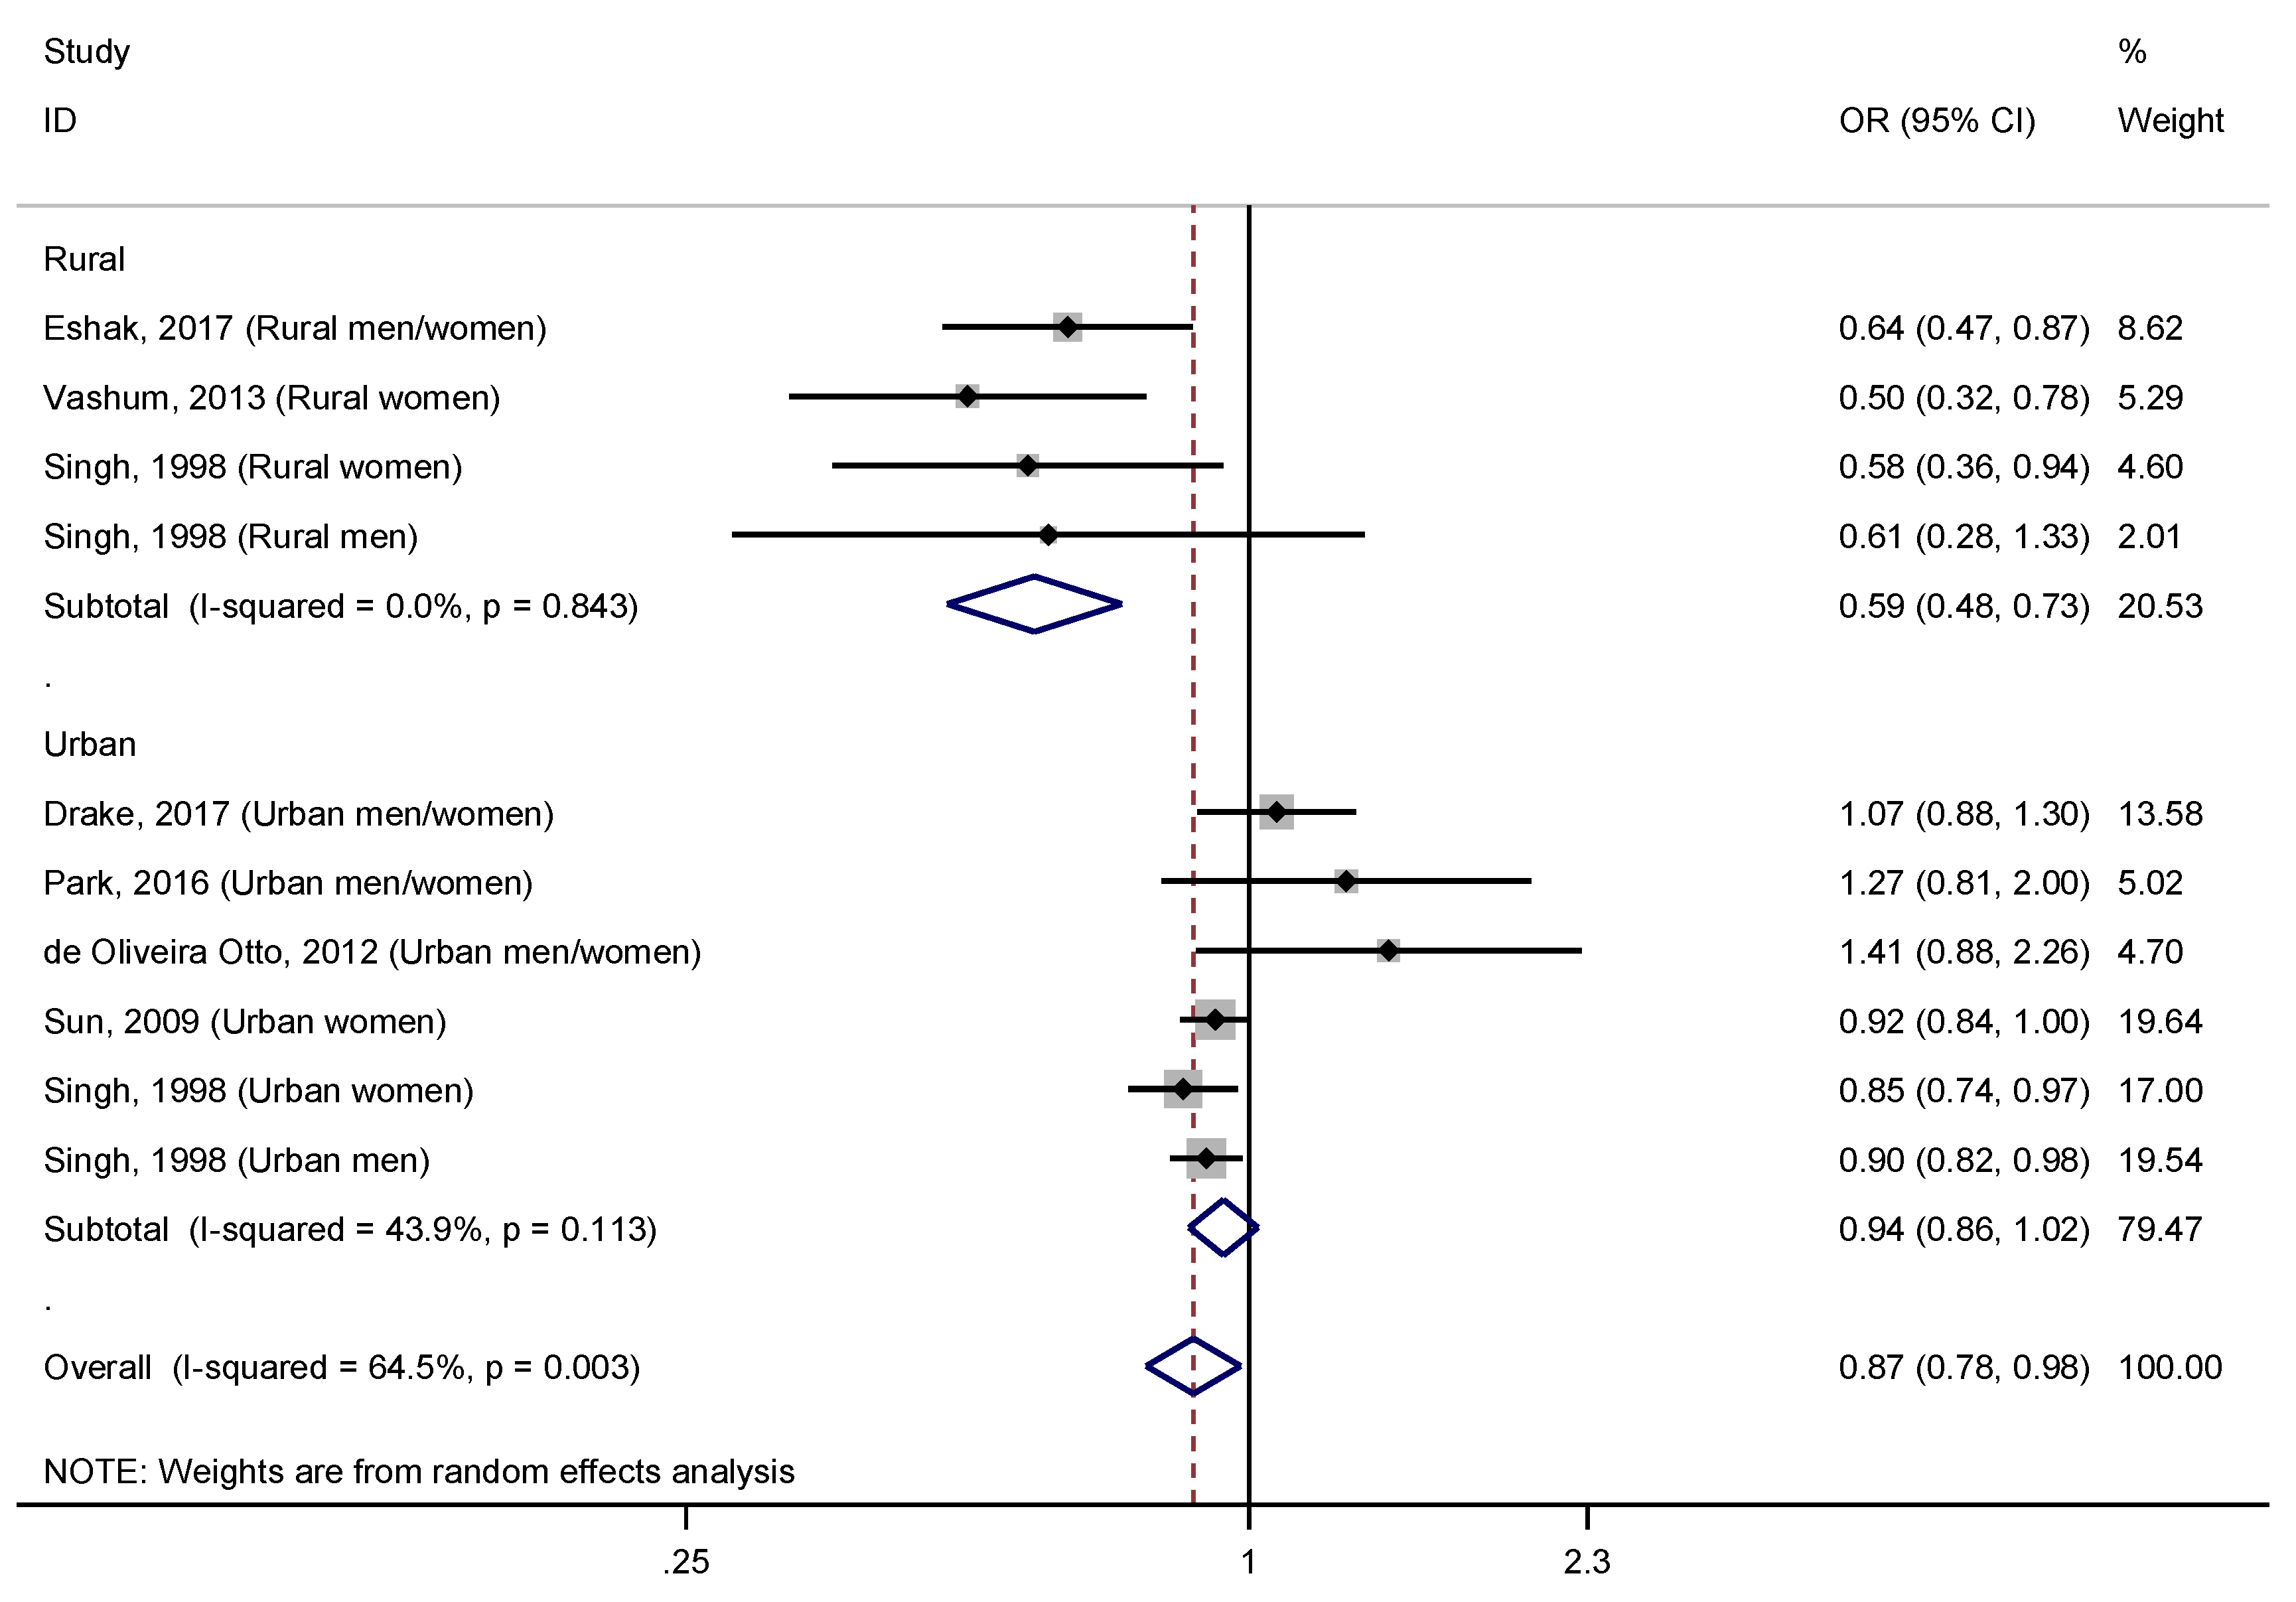
3.1. Dietary Zinc Intake and T2DM
3.2. Supplementary Zinc Intake and T2DM
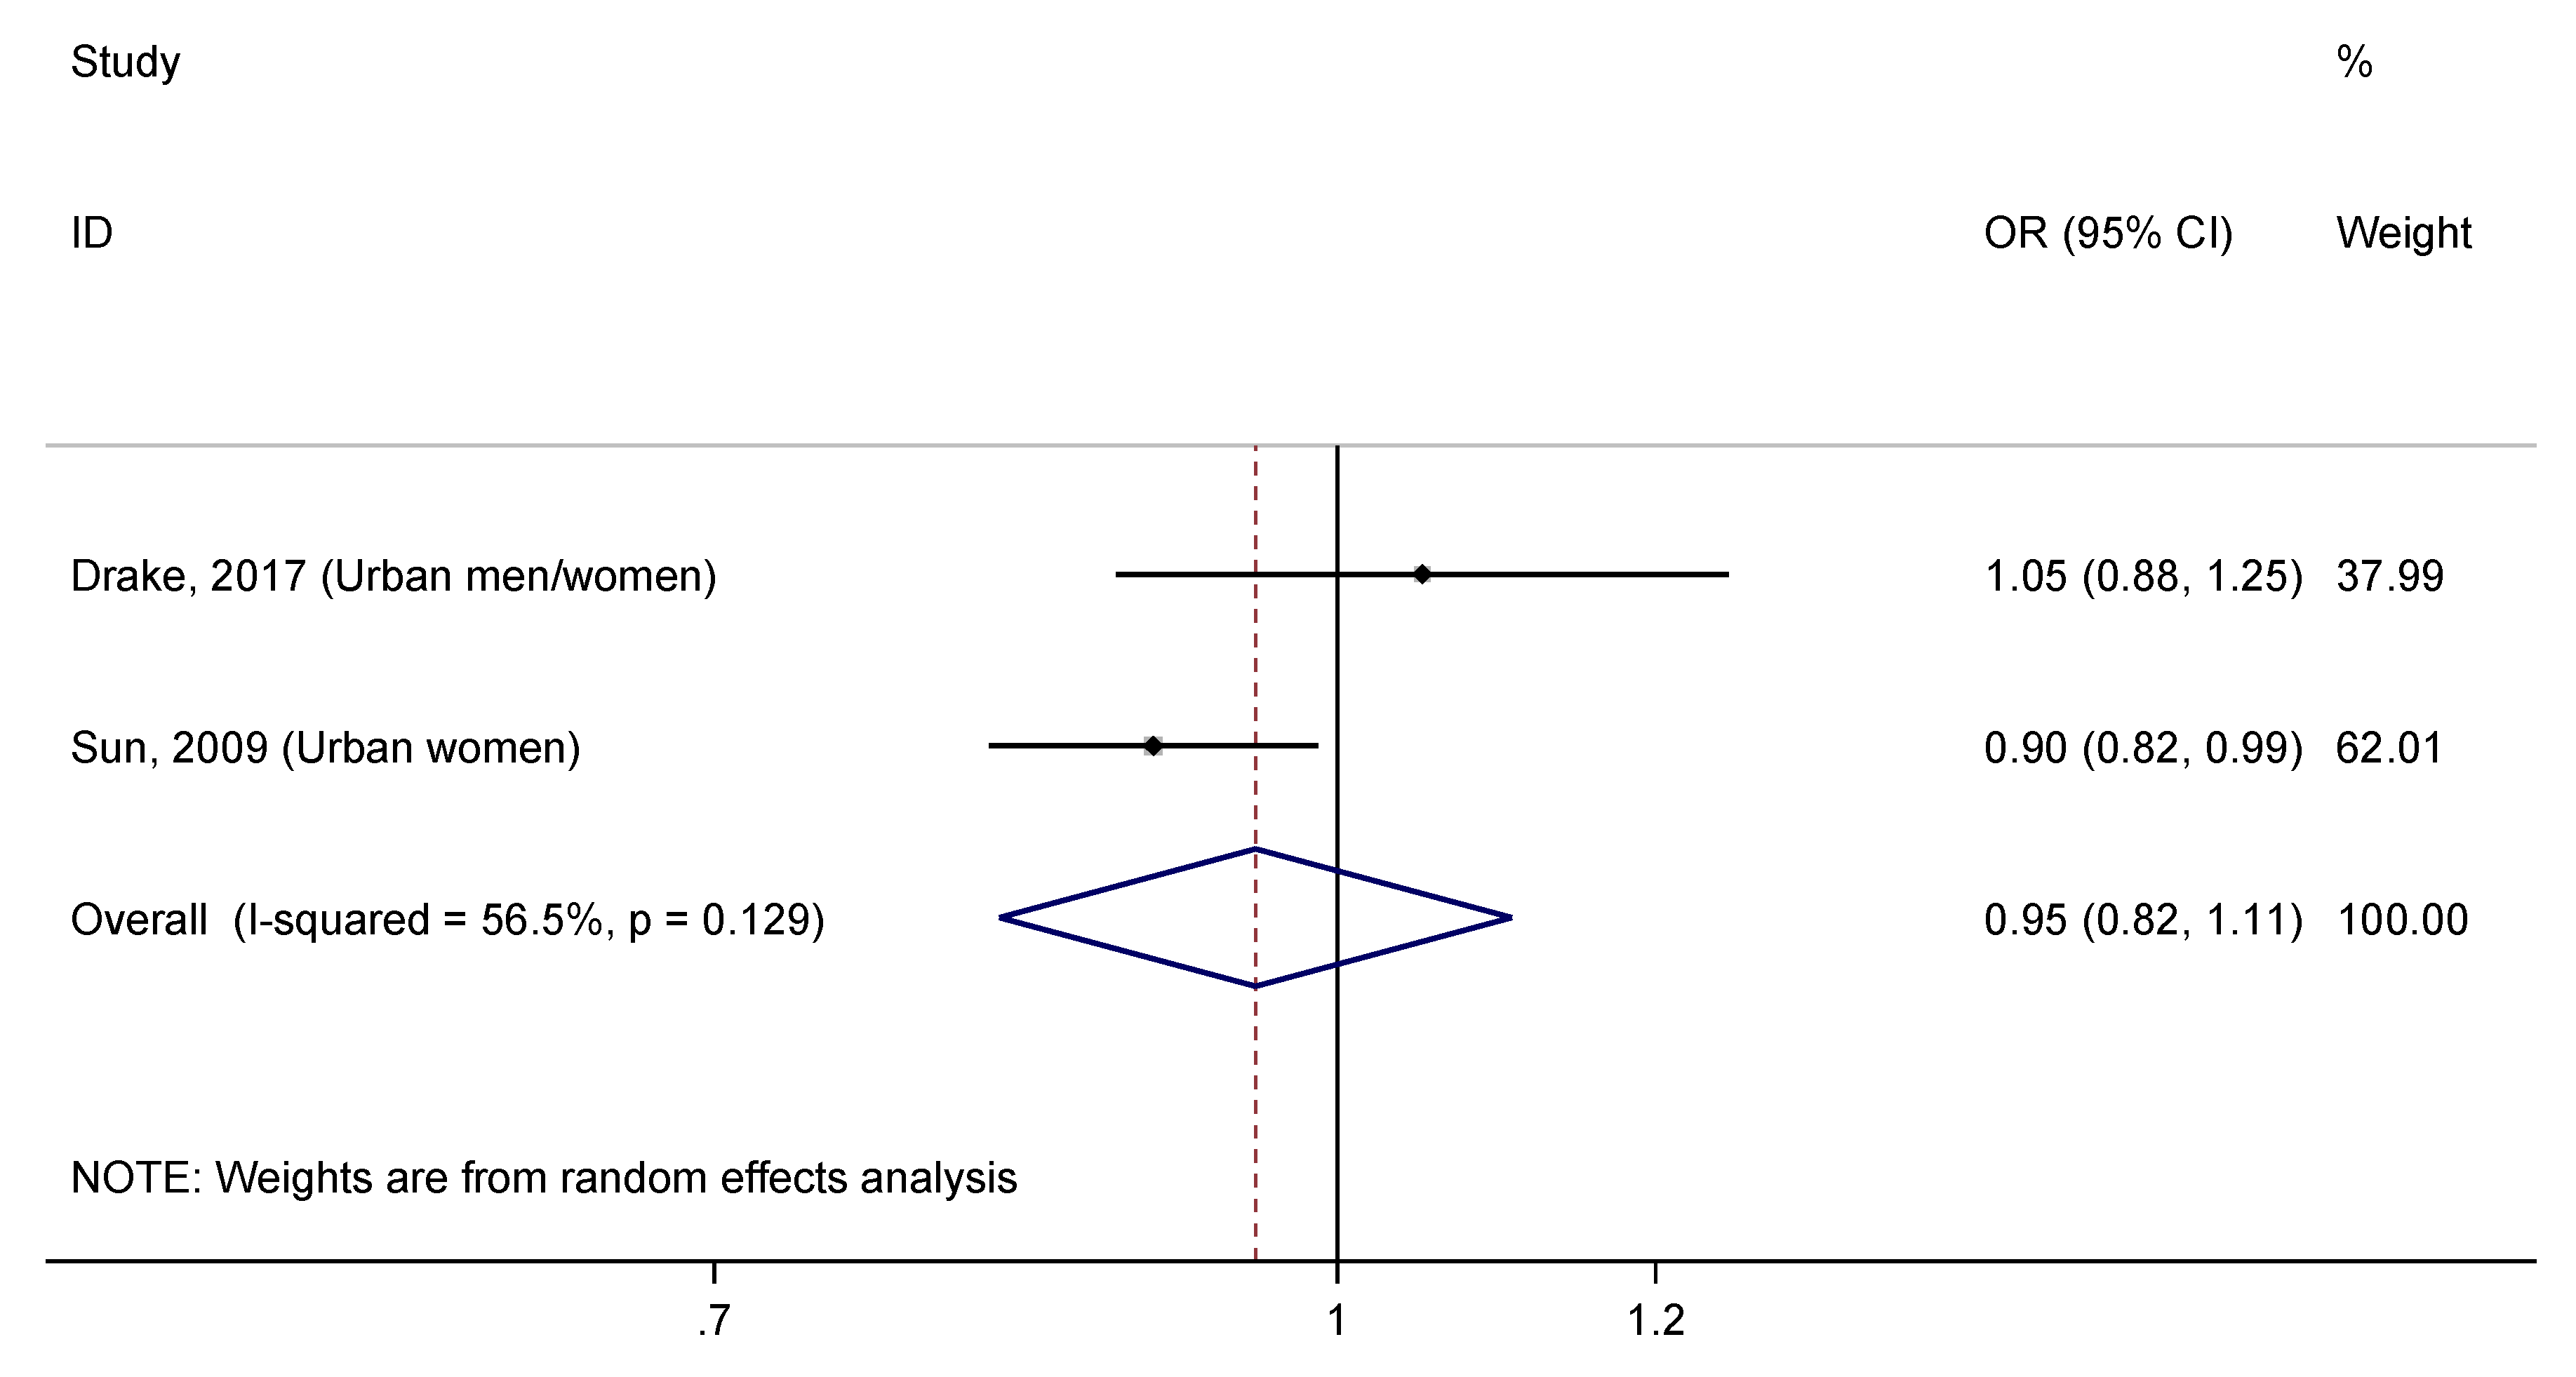
3.3. Total Zinc Intake and T2DM
3.4. Whole Blood Zinc Concentration and T2DM
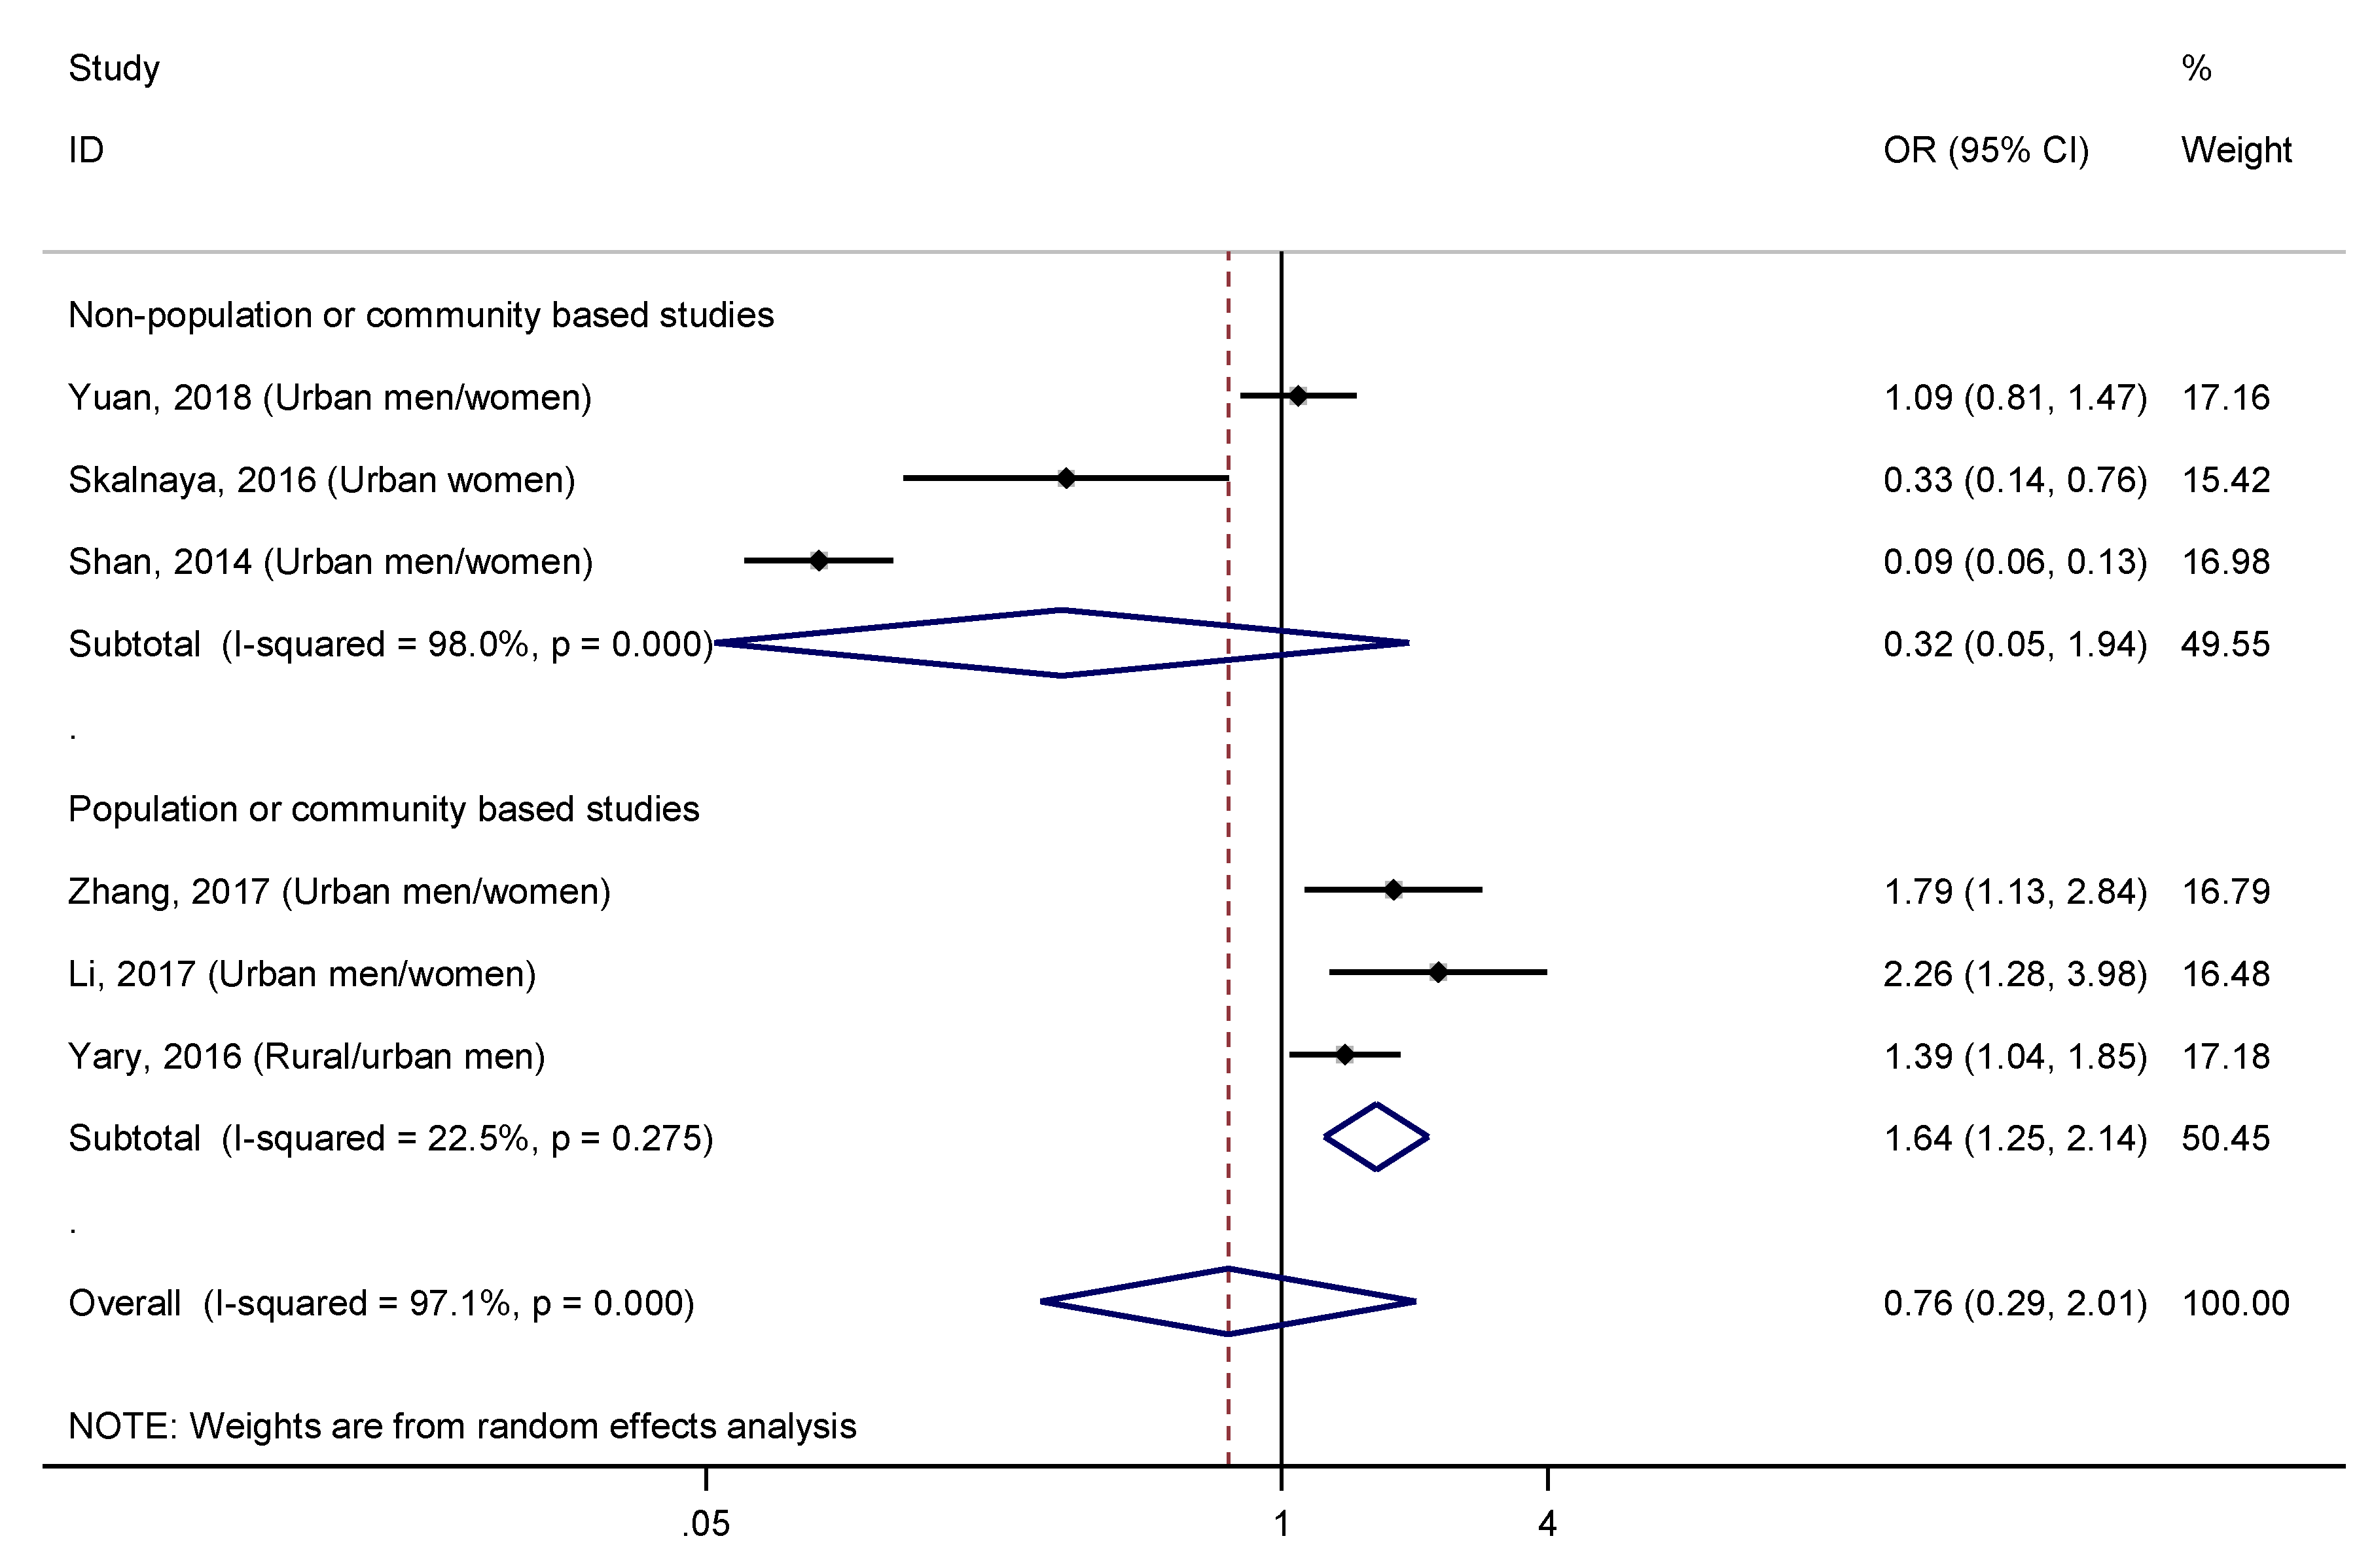
3.5. Serum/Plasma Zinc Concentration and T2DM
4. Discussion
5. Conclusions
Supplementary Materials
Author Contributions
Funding
Acknowledgments
Conflicts of Interest
References
- World Health Organization Noncommunicable Diseases: Key Facts. Available online: http://www.who.int/news-room/fact-sheets/detail/noncommunicable-diseases (accessed on 7 February 2019).
- International Diabetes Federation (IDF) IDF Diabetes Atlas 8th Edition. Available online: http://www.diabetesatlas.org/ (accessed on 7 February 2019).
- Qi, L.; Hu, F.B.; Hu, G. Genes, environment, and interactions in prevention of type 2 diabetes: A focus on physical activity and lifestyle changes. Curr. Mol. Med. 2008, 8, 519–532. [Google Scholar] [CrossRef] [PubMed]
- Sun, Q.; Van Dam, R.M.; Willett, W.C.; Hu, F.B. Prospective study of zinc intake and risk of type 2 diabetes in women. Diabetes Care 2009, 32, 629–634. [Google Scholar] [CrossRef]
- Vashum, K.P.; McEvoy, M.; Shi, Z.; Milton, A.H.; Islam, M.R.; Sibbritt, D.; Patterson, A.; Byles, J.; Loxton, D.; Attia, J. Is dietary zinc protective for type 2 diabetes? Results from the Australian longitudinal study on women’s health. BMC Endocr. Disord. 2013, 13, 40. [Google Scholar] [CrossRef] [PubMed]
- Drake, I.; Hindy, G.; Ericson, U.; Orho-Melander, M. A prospective study of dietary and supplemental zinc intake and risk of type 2 diabetes depending on genetic variation in SLC30A8. Genes Nutr. 2017, 12, 30. [Google Scholar] [CrossRef] [PubMed]
- Eshak, E.S.; Iso, H.; Maruyama, K.; Muraki, I.; Tamakoshi, A. Associations between dietary intakes of iron, copper and zinc with risk of type 2 diabetes mellitus: A large population-based prospective cohort study. Clin. Nutr. 2018, 37, 667–674. [Google Scholar] [CrossRef]
- El Dib, R.; Gameiro, O.L.F.; Ogata, M.S.P.; Módolo, N.S.P.; Braz, L.G.; Jorge, E.C.; do Nascimento, P.; Beletate, V. Zinc supplementation for the prevention of type 2 diabetes mellitus in adults with insulin resistance. Cochrane Database Syst. Rev. 2015, CD005525. [Google Scholar] [CrossRef]
- Ranasinghe, P.; Wathurapatha, W.S.; Galappatthy, P.; Katulanda, P.; Jayawardena, R.; Constantine, G.R. Zinc supplementation in prediabetes: A randomized double-blind placebo-controlled clinical trial. J. Diabetes 2018, 10, 386–397. [Google Scholar] [CrossRef] [PubMed]
- De Oliveira Otto, M.C.; Alonso, A.; Lee, D.-H.; Delclos, G.L.; Bertoni, A.G.; Jiang, R.; Lima, J.A.; Symanski, E.; Jacobs, D.R.; Nettleton, J.A. Dietary Intakes of Zinc and Heme Iron from Red Meat, but Not from Other Sources, Are Associated with Greater Risk of Metabolic Syndrome and Cardiovascular Disease. J. Nutr. 2012, 142, 526–533. [Google Scholar] [CrossRef]
- Park, J.S.; Xun, P.; Li, J.; Morris, S.J.; Jacobs, D.R.; Liu, K.; He, K. Longitudinal association between toenail zinc levels and the incidence of diabetes among American young adults: The CARDIA Trace Element Study. Sci. Rep. 2016, 6, 23155. [Google Scholar] [CrossRef] [PubMed] [Green Version]
- Song, Y.; Xu, Q.; Park, Y.; Hollenbeck, A.; Schatzkin, A.; Chen, H. Multivitamins, Individual Vitamin and Mineral Supplements, and Risk of Diabetes Among Older U.S. Adults. Diabetes Care 2011, 34, 108–114. [Google Scholar] [CrossRef]
- Chu, A.; Foster, M.; Samman, S. Zinc status and risk of cardiovascular diseases and type 2 diabetes mellitus--A systematic review of prospective cohort studies. Nutrients 2016, 8, 707. [Google Scholar] [CrossRef]
- Yary, T.; Virtanen, J.K.; Ruusunen, A.; Tuomainen, T.-P.; Voutilainen, S. Serum zinc and risk of type 2 diabetes incidence in men: The Kuopio Ischaemic Heart Disease Risk Factor Study. J. Trace Elem. Med. Biol. 2016, 33, 120–124. [Google Scholar] [CrossRef]
- Yuan, Y.; Xiao, Y.; Yu, Y.; Liu, Y.; Feng, W.; Qiu, G.; Wang, H.; Liu, B.; Wang, J.; Zhou, L.; et al. Associations of multiple plasma metals with incident type 2 diabetes in Chinese adults: The Dongfeng-Tongji Cohort. Environ. Pollut. 2018, 237, 917–925. [Google Scholar] [CrossRef]
- Shan, Z.; Bao, W.; Zhang, Y.; Rong, Y.; Wang, X.; Jin, Y.; Song, Y.; Yao, P.; Sun, C.; Hu, F.B.; et al. Interactions Between Zinc Transporter-8 Gene ( SLC30A8 ) and Plasma Zinc Concentrations for Impaired Glucose Regulation and Type 2 Diabetes. Diabetes 2014, 63, 1796–1803. [Google Scholar] [CrossRef]
- Skalnaya, M.G.; Skalny, A.V.; Yurasov, V.V.; Demidov, V.A.; Grabeklis, A.R.; Radysh, I.V.; Tinkov, A.A. Serum Trace Elements and Electrolytes Are Associated with Fasting Plasma Glucose and HbA1c in Postmenopausal Women with Type 2 Diabetes Mellitus. Biol. Trace Elem. Res. 2017, 177, 25–32. [Google Scholar] [CrossRef]
- Hansen, A.F.; Simić, A.; Åsvold, B.O.; Romundstad, P.R.; Midthjell, K.; Syversen, T.; Flaten, T.P. Trace elements in early phase type 2 diabetes mellitus—A population-based study. The HUNT study in Norway. J. Trace Elem. Med. Biol. 2017, 40, 46–53. [Google Scholar] [CrossRef] [PubMed]
- Simić, A.; Hansen, A.F.; Åsvold, B.O.; Romundstad, P.R.; Midthjell, K.; Syversen, T.; Flaten, T.P. Trace element status in patients with type 2 diabetes in Norway: The HUNT3 Survey. J. Trace Elem. Med. Biol. 2017, 41, 91–98. [Google Scholar] [CrossRef]
- Fernández-Cao, J.C.; Warthon-Medina, M.; Hall Moran, V.; Arija, V.; Doepking, C.; Lowe, N.M. Dietary zinc intake and whole blood zinc concentration in subjects with type 2 diabetes versus healthy subjects: A systematic review, meta-analysis and meta-regression. J. Trace Elem. Med. Biol. 2018. [Google Scholar] [CrossRef] [PubMed]
- Coffman, F.D.; Dunn, M.F. Insulin-metal ion interactions: The binding of divalent cations to insulin hexamers and tetramers and the assembly of insulin hexamers. Biochemistry 1988, 27, 6179–6187. [Google Scholar] [CrossRef]
- Keller, S.R. Role of the insulin-regulated aminopeptidase IRAP in insulin action and diabetes. Biol. Pharm. Bull. 2004, 27, 761–764. [Google Scholar] [CrossRef]
- Meyer, J.A.; Spence, D.M. A perspective on the role of metals in diabetes: Past findings and possible future directions. Metallomics 2009, 1, 32–41. [Google Scholar] [CrossRef]
- Moore, W.T.; Bowser, S.M.; Fausnacht, D.W.; Staley, L.L.; Suh, K.-S.; Liu, D. Beta Cell Function and the Nutritional State: Dietary Factors that Influence Insulin Secretion. Curr. Diabetes Rep. 2015, 15, 76. [Google Scholar] [CrossRef]
- Tang, X.; Shay, N.F. Zinc has an insulin-like effect on glucose transport mediated by phosphoinositol-3-kinase and Akt in 3T3-L1 fibroblasts and adipocytes. J. Nutr. 2001, 131, 1414–1420. [Google Scholar] [CrossRef]
- Chabosseau, P.; Rutter, G.A. Zinc and diabetes. Arch. Biochem. Biophys. 2016, 611, 79–85. [Google Scholar] [CrossRef] [Green Version]
- Von Bülow, V.; Rink, L.; Haase, H. Zinc-mediated inhibition of cyclic nucleotide phosphodiesterase activity and expression suppresses TNF-alpha and IL-1 beta production in monocytes by elevation of guanosine 3’,5’-cyclic monophosphate. J. Immunol. 2005, 175, 4697–4705. [Google Scholar] [CrossRef]
- Prasad, A.S.; Bao, B.; Beck, F.W.J.; Kucuk, O.; Sarkar, F.H. Antioxidant effect of zinc in humans. Free Radic. Biol. Med. 2004, 37, 1182–1190. [Google Scholar] [CrossRef]
- Stroup, D.F.; Berlin, J.A.; Morton, S.C.; Olkin, I.; Williamson, G.D.; Rennie, D.; Moher, D.; Becker, B.J.; Sipe, T.A.; Thacker, S.B. Meta-analysis of observational studies in epidemiology: A proposal for reporting. Meta-analysis Of Observational Studies in Epidemiology (MOOSE) group. JAMA 2000, 283, 2008–2012. [Google Scholar] [CrossRef]
- Greenland, S. Quantitative methods in the review of epidemiologic literature. Epidemiol. Rev. 1987, 9, 1–30. [Google Scholar] [CrossRef]
- Knapp, G.; Hartung, J. Improved tests for a random effects meta-regression with a single covariate. Stat. Med. 2003. [Google Scholar] [CrossRef]
- Huedo-Medina, T.B.; Sánchez-Meca, J.; Marín-Martínez, F.; Botella, J. Assessing heterogeneity in meta-analysis: Q statistic or I2 index? Psychol. Methods 2006, 11, 193–206. [Google Scholar] [CrossRef]
- Higgins, J.P.T.; Thompson, S.G. Quantifying heterogeneity in a meta-analysis. Stat. Med. 2002, 21, 1539–1558. [Google Scholar] [CrossRef]
- Higgins, J.P.T. Measuring inconsistency in meta-analyses. BMJ 2003, 327, 557–560. [Google Scholar] [CrossRef] [Green Version]
- Thompson, S.G.; Higgins, J.P.T. How should meta-regression analyses be undertaken and interpreted? Stat. Med. 2002, 21, 1559–1573. [Google Scholar] [CrossRef]
- Patsopoulos, N.A.; Evangelou, E.; Ioannidis, J.P.A. Sensitivity of between-study heterogeneity in meta-analysis: Proposed metrics and empirical evaluation. Int. J. Epidemiol. 2008, 37, 1148–1157. [Google Scholar] [CrossRef]
- Egger, M.; Davey Smith, G.; Schneider, M.; Minder, C. Bias in meta-analysis detected by a simple, graphical test. BMJ 1997, 315, 629–634. [Google Scholar] [CrossRef] [Green Version]
- Begg, C.B.; Mazumdar, M. Operating Characteristics of a Rank Correlation Test for Publication Bias. Biometrics 1994, 50, 1088. [Google Scholar] [CrossRef]
- Singh, R.B.; Niaz, M.A.; Rastogi, S.S.; Bajaj, S.; Gaoli, Z.; Shoumin, Z. Current Zinc Intake and Risk of Diabetes and Coronary Artery Disease and Factors Associated with Insulin Resistance in Rural and Urban Populations of North India. J. Am. Coll. Nutr. 1998, 17, 564–570. [Google Scholar] [CrossRef]
- Li, X.T.; Yu, P.F.; Gao, Y.; Guo, W.H.; Wang, J.; Liu, X.; Gu, A.H.; Ji, G.X.; Dong, Q.; Wang, B.S.; et al. Association between Plasma Metal Levels and Diabetes Risk: A Case-control Study in China. Biomed. Environ. Sci. 2017, 30, 482–491. [Google Scholar] [CrossRef]
- Zhang, H.; Yan, C.; Yang, Z.; Zhang, W.; Niu, Y.; Li, X.; Qin, L.; Su, Q. Alterations of serum trace elements in patients with type 2 diabetes. J. Trace Elem. Med. Biol. 2017, 40, 91–96. [Google Scholar] [CrossRef]
- Von Elm, E.; Altman, D.G.; Egger, M.; Pocock, S.J.; Gøtzsche, P.C.; Vandenbroucke, J.P. The Strengthening the Reporting of Observational Studies in Epidemiology (STROBE) statement: Guidelines for reporting of observational studies. Der Internist 2008, 49, 688–693. [Google Scholar] [CrossRef]
- Panel on Micronutrients: Subcommittee on Upper Reference Levels of Nutrients; Subcommittee on Interpretation and Uses of Dietary Reference Intakes; Standing Committee on the Scientific Evaluation of Dietary Reference Intakes; Food and Nutrition Board, Institute of Medicine. Dietary Reference Intakes for Vitamin A, Vitamin K, Arsenic, Boron, Chromium, Copper, Iodine, Iron, Manganese, Molybdenum, Nickel, Silicon, Vanadium, and Zinc; National Academies Press: Washington, DC, USA, 2001. [Google Scholar]
- Suarez-Ortegón, M.F.; Ordoñez-Betancourth, J.E.; Aguilar-de Plata, C. Dietary zinc intake is inversely associated to metabolic syndrome in male but not in female urban adolescents. Am. J. Hum. Biol. 2013, 25, 550–554. [Google Scholar] [CrossRef]
- Al-Daghri, N.; Khan, N.; Alkharfy, K.; Al-Attas, O.; Alokail, M.; Alfawaz, H.; Alothman, A.; Vanhoutte, P. Selected Dietary Nutrients and the Prevalence of Metabolic Syndrome in Adult Males and Females in Saudi Arabia: A Pilot Study. Nutrients 2013, 5, 4587–4604. [Google Scholar] [CrossRef] [Green Version]
- Bo, S.; Lezo, A.; Menato, G.; Gallo, M.-L.; Bardelli, C.; Signorile, A.; Berutti, C.; Massobrio, M.; Pagano, G.F. Gestational hyperglycemia, zinc, selenium, and antioxidant vitamins. Nutrition 2005, 21, 186–191. [Google Scholar] [CrossRef]
- Eshak, E.S.; Iso, H.; Yamagishi, K.; Maruyama, K.; Umesawa, M.; Tamakoshi, A. Associations between copper and zinc intakes from diet and mortality from cardiovascular disease in a large population-based prospective cohort study. J. Nutr. Biochem. 2018, 56, 126–132. [Google Scholar] [CrossRef]
- Bates, C.J.; Hamer, M.; Mishra, G.D. Redox-modulatory vitamins and minerals that prospectively predict mortality in older British people: The National Diet and Nutrition Survey of people aged 65 years and over. Br. J. Nutr. 2011, 105, 123–132. [Google Scholar] [CrossRef]
- Shi, Z.; Yuan, B.; Qi, L.; Dai, Y.; Zuo, H.; Zhou, M. Zinc intake and the risk of hyperglycemia among Chinese adults: The prospective Jiangsu Nutrition Study (JIN). J. Nutr. Health Aging 2010, 14, 332–335. [Google Scholar] [CrossRef]
- Milton, A.H.; Vashum, K.P.; McEvoy, M.; Hussain, S.; McElduff, P.; Byles, J.; Attia, J. Prospective Study of Dietary Zinc Intake and Risk of Cardiovascular Disease in Women. Nutrients 2018, 10, 38. [Google Scholar] [CrossRef]
- Shi, Z.; Chu, A.; Zhen, S.; Taylor, A.W.; Dai, Y.; Riley, M.; Samman, S. Association between dietary zinc intake and mortality among Chinese adults: Findings from 10-year follow-up in the Jiangsu Nutrition Study. Eur. J. Nutr. 2018, 57, 2839–2846. [Google Scholar] [CrossRef]
- McDade, T.W.; Adair, L.S. Defining the “urban” in urbanization and health: A factor analysis approach. Soc. Sci. Med. 2001, 53, 55–70. [Google Scholar] [CrossRef]
- Pretorius, S.; Sliwa, K. Perspectives and perceptions on the consumption of a healthy diet in Soweto, an urban African community in South Africa. SA Hear. 2017, 8, 178–183. [Google Scholar] [CrossRef] [Green Version]
- Lopez, A.D.; Mathers, C.D.; Ezzati, M.; Jamison, D.T.; Murray, C.J.L. Global and regional burden of disease and risk factors, 2001: Systematic analysis of population health data. Lancet (London, England) 2006, 367, 1747–1757. [Google Scholar] [CrossRef]
- Ezzati, M.; Lopez, A.D.; Rodgers, A.; Vander Hoorn, S.; Murray, C.J.L. Comparative Risk Assessment Collaborating Group Selected major risk factors and global and regional burden of disease. Lancet (London, England) 2002, 360, 1347–1360. [Google Scholar] [CrossRef]
- Al-Moosa, S.; Allin, S.; Jemiai, N.; Al-Lawati, J.; Mossialos, E. Diabetes and urbanization in the Omani population: An analysis of national survey data. Popul. Health Metr. 2006, 4, 5. [Google Scholar] [CrossRef]
- Jayawardena, R.; Ranasinghe, P.; Galappatthy, P.; Malkanthi, R.; Constantine, G.; Katulanda, P. Effects of zinc supplementation on diabetes mellitus: A systematic review and meta-analysis. Diabetol. Metab. Syndr. 2012, 4, 13. [Google Scholar] [CrossRef]
- Forte, G.; Bocca, B.; Peruzzu, A.; Tolu, F.; Asara, Y.; Farace, C.; Oggiano, R.; Madeddu, R. Blood metals concentration in type 1 and type 2 diabetics. Biol. Trace Elem. Res. 2013, 156, 79–90. [Google Scholar] [CrossRef]
- Lowe, N.M.; Fekete, K.; Decsi, T. Methods of assessment of zinc status in humans: A systematic review. Am. J. Clin. Nutr. 2009, 89, 2040S–2051S. [Google Scholar] [CrossRef]
- Sanjeevi, N.; Freeland-Graves, J.; Beretvas, S.N.; Sachdev, P.K. Trace element status in type 2 diabetes: A meta-analysis. J. Clin. Diagn. Res. 2018, 12, OE01–OE08. [Google Scholar] [CrossRef]
- Liu, B.; Feng, W.; Wang, J.; Li, Y.; Han, X.; Hu, H.; Guo, H.; Zhang, X.; He, M. Association of urinary metals levels with type 2 diabetes risk in coke oven workers. Environ. Pollut. 2016, 210, 1–8. [Google Scholar] [CrossRef]
- Carlson, M.D.A.; Morrison, R.S. Study design, precision, and validity in observational studies. J. Palliat. Med. 2009, 12, 77–82. [Google Scholar] [CrossRef]
- Chu, A.; Foster, M.; Hancock, D.; Petocz, P.; Samman, S. Interrelationships among mediators of cellular zinc homeostasis in healthy and type 2 diabetes mellitus populations. Mol. Nutr. Food Res. 2017, 61. [Google Scholar] [CrossRef]
- Ranasinghe, P.; Pigera, S.; Galappatthy, P.; Katulanda, P.; Constantine, G.R. Zinc and diabetes mellitus: Understanding molecular mechanisms and clinical implications. Daru 2015, 23, 44. [Google Scholar] [CrossRef]
- Tamaki, M.; Fujitani, Y.; Hara, A.; Uchida, T.; Tamura, Y.; Takeno, K.; Kawaguchi, M.; Watanabe, T.; Ogihara, T.; Fukunaka, A.; et al. The diabetes-susceptible gene SLC30A8/ZnT8 regulates hepatic insulin clearance. J. Clin. Investig. 2013, 123, 4513–4524. [Google Scholar] [CrossRef] [Green Version]
- Myers, S.A.; Nield, A.; Chew, G.-S.; Myers, M.A. The Zinc Transporter, Slc39a7 (Zip7) Is Implicated in Glycaemic Control in Skeletal Muscle Cells. PLoS ONE 2013, 8, e79316. [Google Scholar] [CrossRef]
- Skalnaya, M.G.; Skalny, A.V.; Tinkov, A.A. Serum copper, zinc, and iron levels, and markers of carbohydrate metabolism in postmenopausal women with prediabetes and type 2 diabetes mellitus. J. Trace Elem. Med. Biol. 2017, 43, 46–51. [Google Scholar] [CrossRef]


| Author, Year (Study) | Location (Area) | Study Design | Follow-Up (Years) | Ethnicity | Gender | Age (Years) in Cases at Baseline (mean ± SD) | Age (Years) in Controls at Baseline (mean ± SD) | Sample Size (T2DM) | T2DM (%) | Ascertainment of T2DM | Zinc Assessment Method | Zinc Intake (mg/day) in Cases (mean ± SD) | Zinc Intake (mg/day) in Controls (mean ± SD) | Effect Size (95% CI) |
|---|---|---|---|---|---|---|---|---|---|---|---|---|---|---|
| Drake, 2017 (MDCS) | Sweden (urban) | Prospective cohort | Median: 19 | White | Men/Women | 58.0 ± 7.0 | 57.8 ± 7.7 | 26,132 (3676) | 14.1 | FPG ≥ 7.0 mmol/L (twice), or registries | VDHQ | 11.6 ± 3.6 | 11.1 ± 3.3 | HR: 1.07 (0.88–1.30) |
| Eshak, 2017 (JACC) | Japan (rural, mostly) | Prospective cohort | 5 | Japanese | Men/Women | Range: 40–65 | 16,160 (396) | 2.5 | Self-report | VFFQ | 7.3 ± 0.8 | OR: 0.64 (0.54–1.00) | ||
| Park, 2016 (CARDIA) | USA (urban) | Prospective cohort | 23 | African American, Caucasian | Men/Women | Range: 18–30; 27.03 ± 3.61 | 3960 (418) | 10.6 | FPG ≥ 7.0 mmol/L, or 2-h 75-g OGTT ≥ 11.1 mmol/L, or HbA1c ≥ 6.5%, or drugs | VDHQ | 16.7 | HR: 1.27 (0.81–2.01) | ||
| Vashum, 2013 (ALSWH) | Australia (rural, mostly) | Prospective cohort | 6 | Australian | Women | Range: 45–50 | 8921 (333) | 3.7 | Self-report | VFFQ | 10.7 | OR: 0.50 (0.32–0.77) | ||
| de Oliveira Otto, 2012 (MESA) | USA (urban) | Prospective cohort | Mean: 4.8 | White, Asian, African American, Hispanic | Men/Women | Range: 45–84 61.8 ± 10.3 | 4982 (499) | 10.0 | FPG ≥ 6.99 mmol/L, or self-reported, or drugs | VFFQ | Median (standard error) 8.3 (4.4) | HR: 1.41 (0.88–2.27) | ||
| Sun, 2009 (NHS) | USA (urban) | Prospective cohort | 24 | White | Women | Range: 33–60 | 82,297 (6030) | 7.3 | Self-report | VFFQ | N/A | N/A | RR: 0.92 (0.84–1.00) | |
| Singh, 1998 | India (rural) | Cross-sectional study | N/A | South Asian | Men | 25–64 | 894 (27) | 3.0 | FPG > 7.7 mmol/L, or 2-h 75-g OGTT > 11.1 mmol/L | 7-day dietary record | 8.8 ± 2.2 | OR: 0.61 (0.35–1.66) | ||
| Women | 875 (24) | 2.7 | 8.1 ± 2.1 | OR: 0.58 (0.44–1.15) | ||||||||||
| India (urban) | Men | 904 (63) | 7.0 | 7.0 ± 2.0 | OR: 0.90 (0.82–0.98) | |||||||||
| Women | 902 (45) | 5.0 | 5.6 ± 1.6 | OR: 0.85 (0.71–0.93) | ||||||||||
| Author, Year (Study) | Location (Area) | Study Design | Follow-Up (Years) | Ethnicity | Gender | Age (Years) in Cases at Baseline (mean ± SD) | Age (Years) in Controls at Baseline (mean ± SD) | Sample Size (T2DM) | T2DM (%) | Ascertainment of T2DM | Zinc Assessment Method | Zinc Intake (mg/day) in Cases (mean ± SD) | Zinc Intake (mg/day) in Controls (mean ± SD) | Effect Size (95% CI) |
|---|---|---|---|---|---|---|---|---|---|---|---|---|---|---|
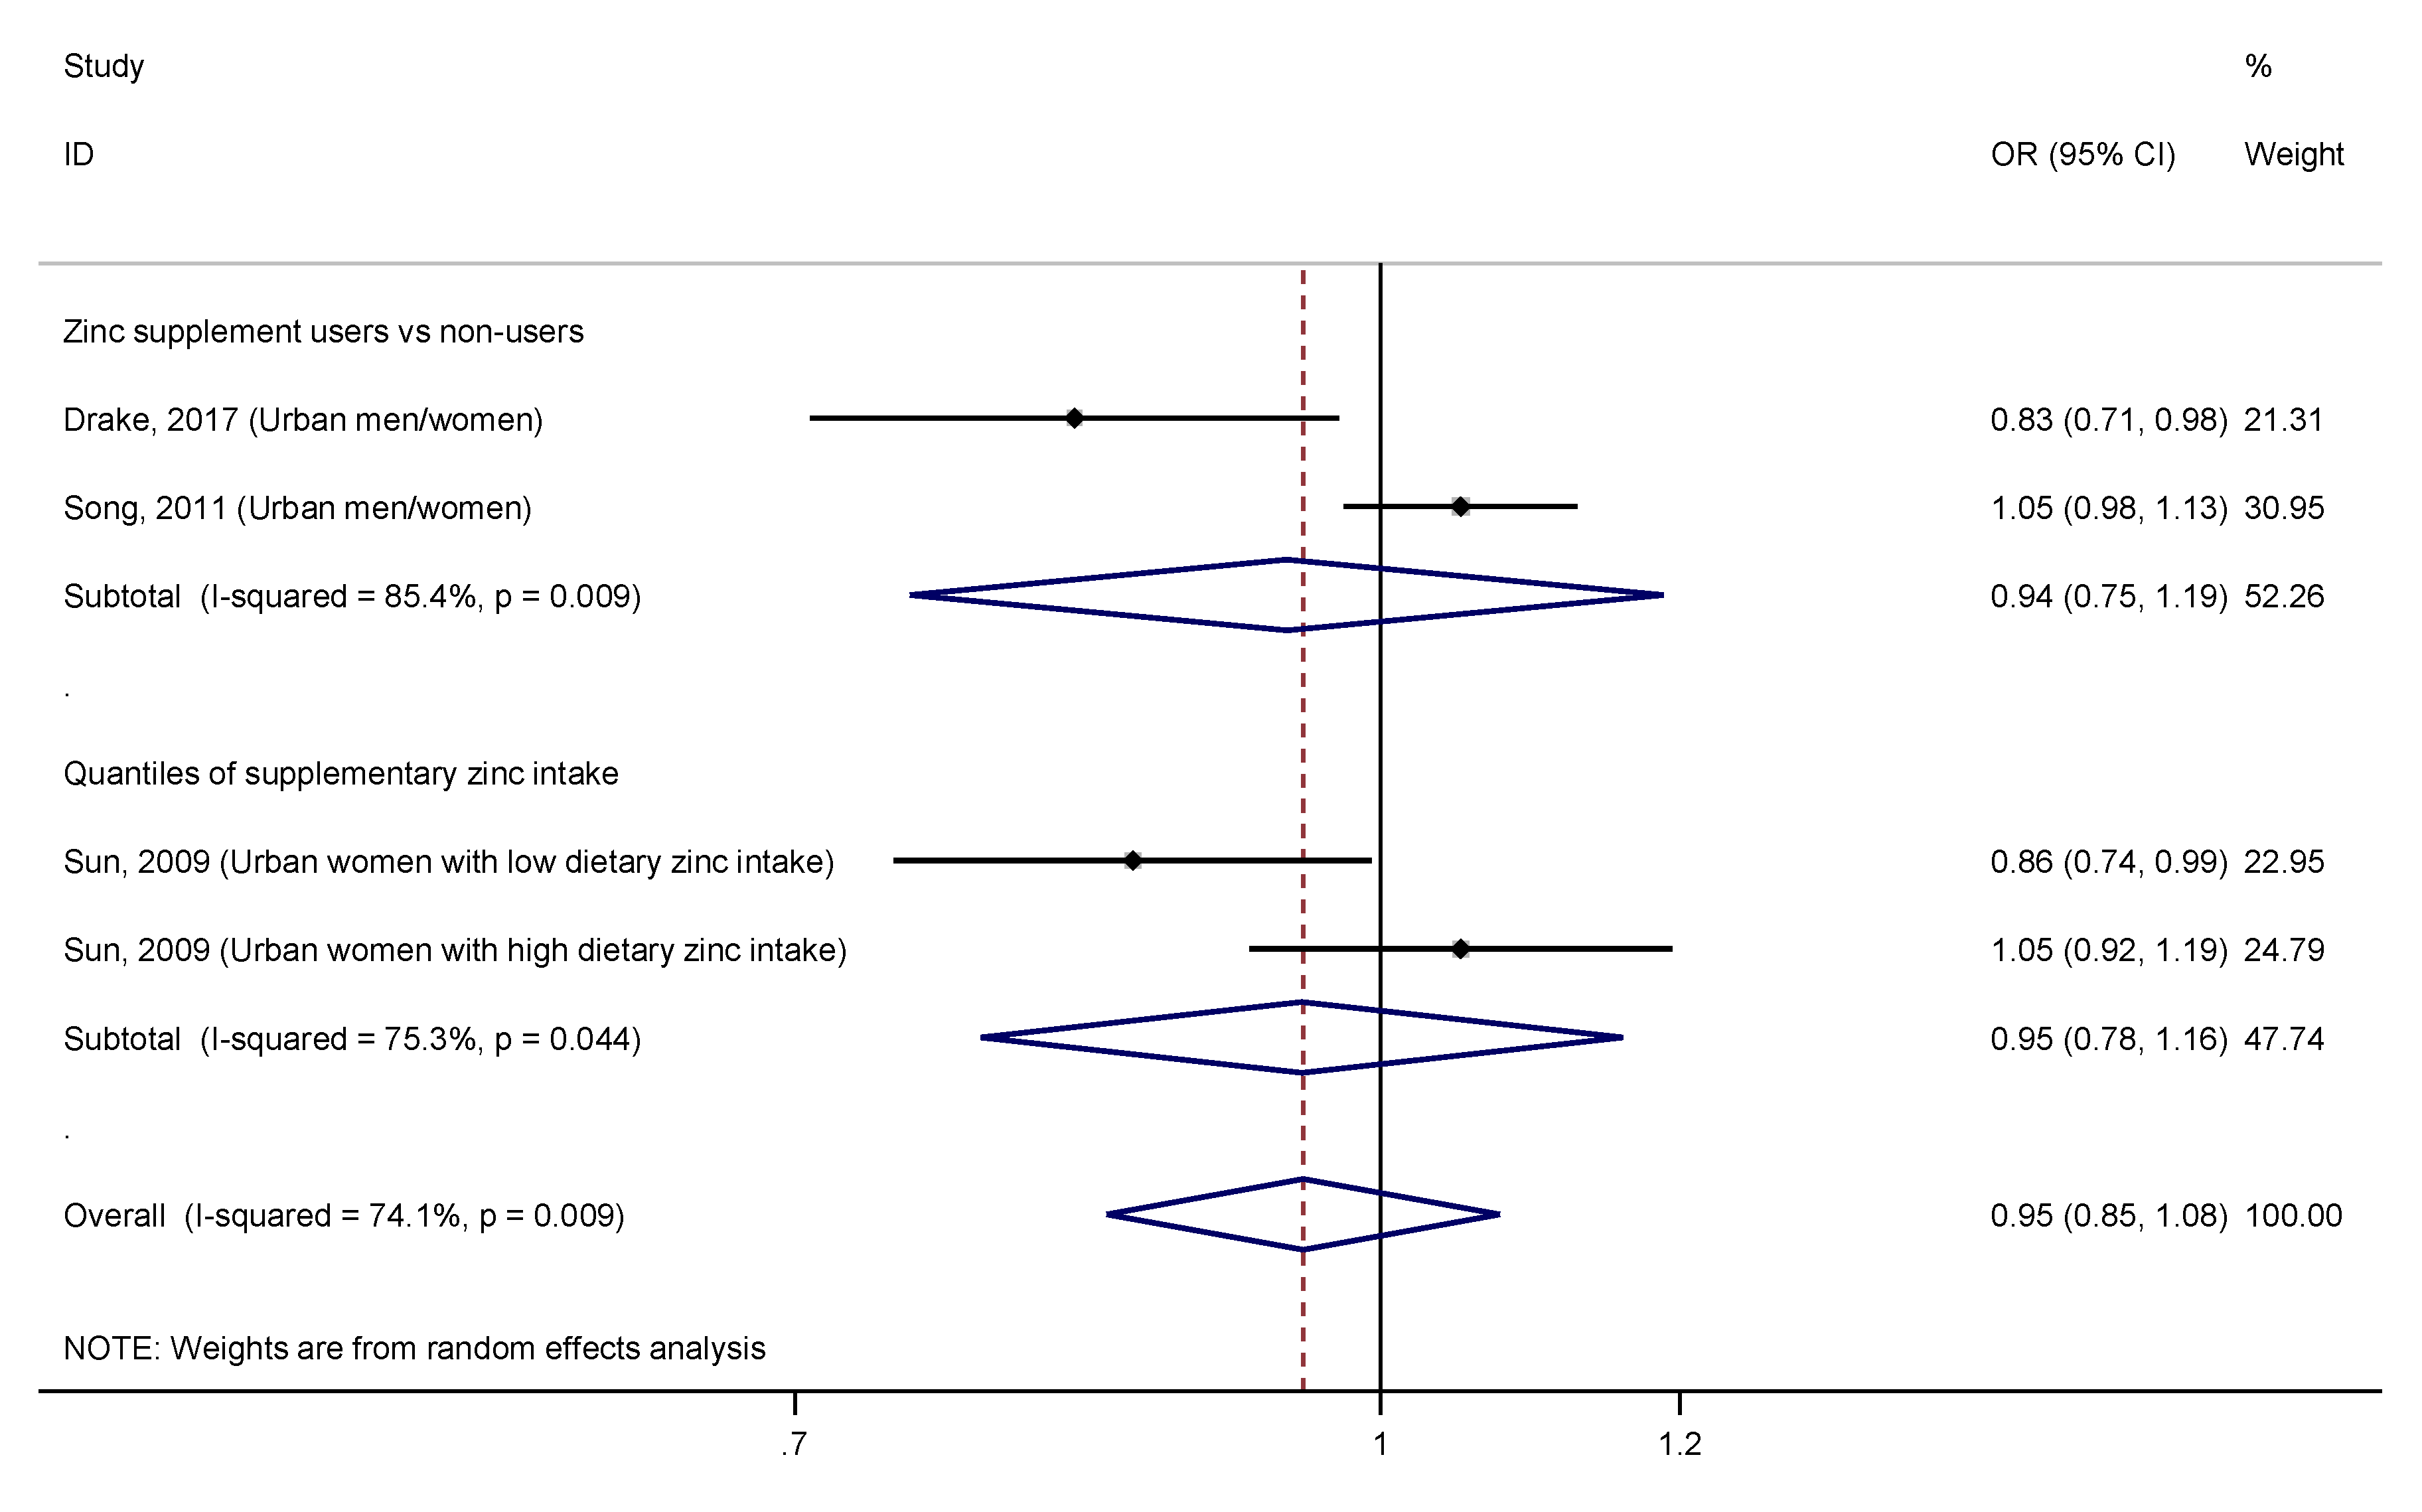
| Supplementary zinc intake | ||||||||||||||
| Drake, 2017 (MDCS) | Sweden (urban) | Prospective cohort | Median: 19 | White | Men/Women | 58.0 ± 7.0 | 57.8 ± 7.7 | 26,132 (3676) | 14.1 | FPG ≥ 7.0 mmol/L (twice), or registries | VDHQ | 12.3% user | 17.7% user | HR: 0.83 (0.71–0.98) |
| Song, 2011 (NIH-AARP) | USA (urban) | Prospective cohort | 10 | White, mostly | Men/Women | Range: 50–71 | 232,007 (14,130) | 6.1 | Self-report | Dietary survey | 12.5% user | 5.7% user | OR: 1.05 (0.98–1.13) | |
| Sun, 2009 (NHS) | USA (urban) | Prospective cohort | 24 | White | Women with low dietary zinc intake | Range: 33–60 | 27,432 (2002) | 7.3 | Self-report | VFFQ | 6.3% user in 1980–48.6% user in 2004 | RR: 0.86 (0.74–0.99) | ||
| Prospective cohort | Women with high dietary zinc intake | 27,432 (2002) | RR: 1.05 (0.92–1.19) | |||||||||||
| Total zinc intake | ||||||||||||||
| Drake, 2017 (MDCS) | Sweden (urban) | Prospective cohort | Median: 19 | White | Men/Women | 58.0 ± 7.0 | 57.8 ± 7.7 | 26,132 (3676) | 14.1 | FPG ≥ 7.0 mmol/L (twice), or registries | VDHQ | 12.9 ± 5.4 | 13.0 ± 6.2 | HR: 1.05 (0.88–1.25) |
| Sun, 2009 (NHS) | USA (urban) | Prospective cohort | 24 | White | Women | Range: 33–60 | N/A | 82,297 (6030) | 7.3 | Self-report | VFFQ | Median range: 4.9–18.0 | N/A | RR: 0.90 (0.82–0.99) |
| Author, Year | Location | Study Design | Follow-Up (Years) | Ethnicity | Gender | Age (Years) in Cases at Baseline (mean ± SD) | Age (Years) in Controls at Baseline (mean ± SD) | Sample Size (T2DM) | T2DM (%) | Ascertainment of T2DM | Zinc Assessment Method | Zinc Levels (µg/dL) in Diabetic Subjects (mean ± SD) | Zinc Levels (µg/dL) in Controls (mean ± SD) | Effect Size (95% CI) |
|---|---|---|---|---|---|---|---|---|---|---|---|---|---|---|
| Serum/plasma zinc concentration | ||||||||||||||
| Yuan, 2018 (DFTJ) | China (urban) | Nested case-control | 4.6 | Chinese | Men/Women | 62.8 ± 7.2 | 62.9 ± 7.3 | 2078 (1039) | N/A | FPG ≥ 7.0 mmoL/L, or HbA1c ≥ 6.5%, or self-reported, or drugs | ICP-MS | 169.6 ± 142.4 | 156.1 ± 126.5 | OR: 1.09 (0.81–1.48) |
| Li, 2017 | China (urban) | Cross-sectional | N/A | Chinese Han | Men/Women | Range: 40–92, mean: 66.3 | Range: 40–92, mean: 66.5 | 551 (122) | N/A | RPG ≥ 11.1 mmol/L and symptoms, 2-h OGTT ≥ 11.1 mmol/L, or FPG ≥ 7.0 mmol/L, or HbA1c ≥ 6.5% | ICP-MS | Median: 63.4 | Median: 57.5 | OR: 2.26 (1.29–3.98) |
| Zhang, 2017 (REACTION) | China (urban) | Cross-sectional | N/A | Chinese | Men/Women | 57.7 ± 7.4 | 55.2 ± 7.9 | 1837 (510) | N/A | Self-reported, or FPG > 7.0 mmol/L, or 2-h 75-g OGTT > 11.1 mmol/L | ICP-MS | 109.0 ± 26.0 | 105.0 ± 25.0 | OR: 1.79 (1.13–2.84) |
| Yary, 2016 (KIHD) | Finland (rural / urban) | Prospective cohort | 20 | N/A | Men | Range: 42–60 | 2220 (416) | 18.7 | Self-reported, or FPG ≥ 7.0 mmol/L or 2-h OGTT ≥ 11.1 mmol/L | AAS | 95.0 ± 10.0 | 93.0 ± 12.0 | HR: 1.39 (1.04–1.85) | |
| Skalnaya, 2016 | Russia (urban) | Cross-sectional | N/A | N/A | Women | 55.8 ± 5.3 | 56.7 ± 6.1 | 128 (64) | N/A | HbA1c≥6.5% | ICP-MS | 96.0 ± 0.2 | 105.0 ± 0.2 | OR: 0.33 (0.14–0.76) |
| Shan, 2014 | China (urban) | Cross-sectional | N/A | Chinese Han | Men/Women | 51.0 ± 10.8 | 42.5 ± 11.6 | 1578 (785) | N/A | WHO 1999 criteria | ICP-MS | 115.0 ± 45.0 | 172.5 ± 73.0 | OR: 0.09 (0.06–0.13) |
| Whole blood zinc concentration | ||||||||||||||
| Simic, 2017 (HUNT3) | Norway (rural, mostly) | Cross-sectional | N/A | Caucasian, mostly | Men/Women | 65.4 ± 10.6 | 59.2 ± 12.2 | 876 (267) | N/A | Self-reported | ICP-MS | Median: 764.3 Range (10–90%): 643.6–893.3 | Median: 751.2 Range (10–90%): 623.5–878.2 | OR: 1.08 (0.59–1.97) |
| Hansen, 2017 (HUNT3) | Norway (rural, mostly) | Cross-sectional | N/A | Caucasian, mostly | Men/Women | 65.2 ± 10.3 | 61.4 ± 14.1 | 883 (128) | N/A | FPG ≥ 7.0 mmol/L and/or 2-h OGTT ≥ 11.1 mmol/L | ICP-MS | Median: 799.0 Range (10–90%): 675.0–881.0 | Median: 754.0 Range (10–90%): 628.0–885.0 | OR: 2.19 (1.05–4.59) |
| Subgroup | Studies (n) | Effect Size (95% CI) | Heterogeneity | Meta-Regressions | ||||||
|---|---|---|---|---|---|---|---|---|---|---|
| I2 (%) | p-Value | Regression Coefficients (95% CI) | Standard Error | p-Value | Tau2 | I2 Residual (%) | Adjusted R2 (%) | |||
| Geographic area | ||||||||||
| Western (1) | 5 | 0.97 (0.77–1.22) | 72.1% | 0.006 | −0.25 (−0.66; 0.17) | 0.18 | 0.208 | 0.04 | 64.05% | 6.68% |
| Eastern (2) | 5 | 0.80 (0.70–0.92) | 49.3% | 0.096 | ||||||
| Geographic regions | ||||||||||
| Oceania (1) | 1 | 0.50 (0.32–0.78) | - | - | 0.22 (0.04–0.39) | 0.08 | 0.022 | 0.02 | 50.38% | 67.68% |
| Asia (2) | 5 | 0.80 (0.70–0.92) | 49.3% | 0.096 | ||||||
| America (3) | 3 | 1.10 (0.82–1.47) | 57.7% | 0.094 | ||||||
| Europe (4) | 1 | 1.07 (0.88–1.30) | - | - | ||||||
| Area of residence | ||||||||||
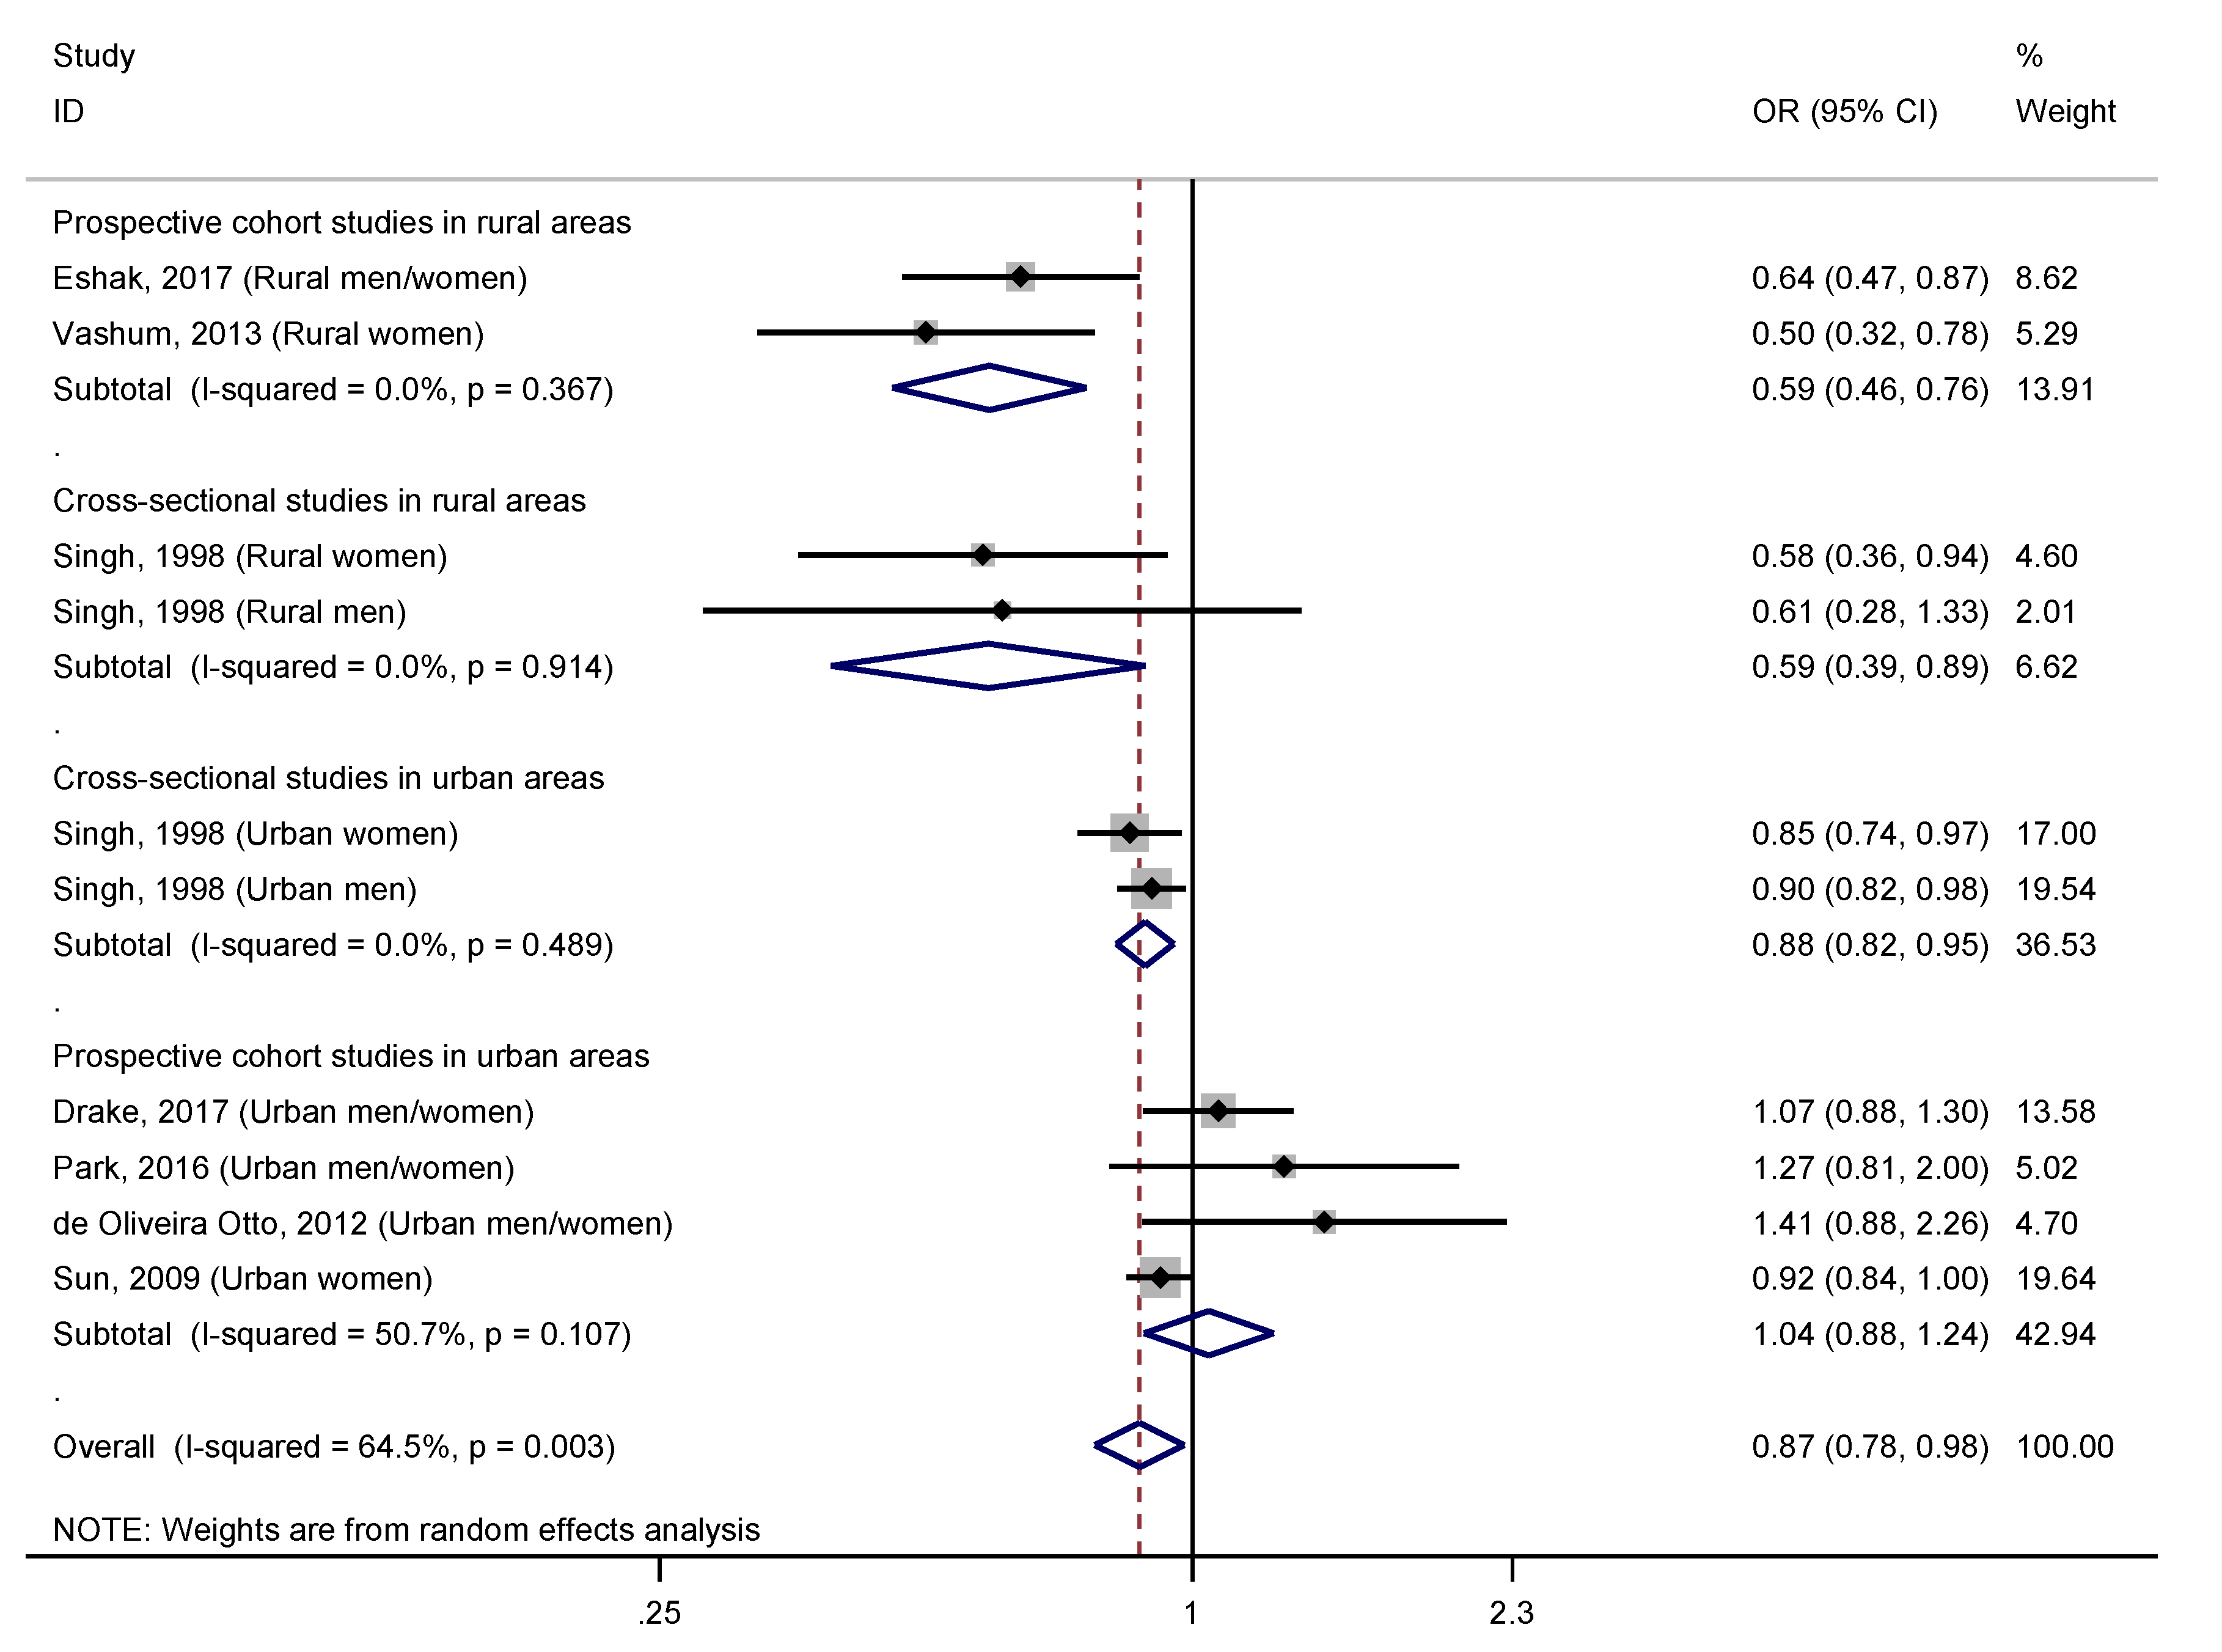
| Rural (1) | 4 | 0.59 (0.48–0.73) | 0.0% | 0.843 | 0.45 (0.16; 0.73) | 0.13 | 0.007 | 0.00 | 17.82% | 100.0% |
| Urban (2) | 6 | 0.94 (0.86–1.02) | 43.9% | 0.113 | ||||||
| Gender | ||||||||||
| Men (1) | 2 | 0.90 (0.82–0.98) | 0.0% | 0.331 | 0.14 (−0.17; 0.45) | 0.13 | 0.330 | 0.06 | 67.67% | −30.54% |
| Women (2) | 4 | 0.78 (0.65–0.95) | 71.4% | 0.015 | ||||||
| Men/Women (3) | 4 | 1.02 (0.73–1.42) | 74.1% | 0.009 | ||||||
| Ethnicity | ||||||||||
| White (1) | 3 | 0.86 (0.66–1.12) | 79.4% | 0.008 | 0.10 (−0.06; 0.26) | 0.07 | 0.194 | 0.06 | 68.30% | −17.63% |
| South Asian (2) | 4 | 0.86 (0.77–0.95) | 28.5% | 0.241 | ||||||
| Japanese (3) | 1 | 0.64 (0.47–0.87) | - | - | ||||||
| Several ethnic groups (4) | 2 | 1.34 (0.96–1.85) | 0.0% | 0.755 | ||||||
| Study design | ||||||||||
| Prospective Cohort (1) | 6 | 0.90 (0.73–1.12) | 75.1% | 0.001 | −0.07 (−0.31; 0.16) | 0.10 | 0.495 | 0.06 | 67.06% | −33.29% |
| Cross-sectional (2) | 4 | 0.86 (0.77–0.95) | 28.5% | 0.241 | ||||||
| Study design and area of residence | ||||||||||
| Prospective/Rural (1) | 2 | 0.59 (0.46–0.76) | 0.0% | 0.367 | 0.18 (0.08; 0.29) | 0.05 | 0.004 | 0.004 | 22.03% | 90.47% |
| Cross-sectional/Rural (2) | 2 | 0.58 (0.39–0.89) | 0.0% | 0.914 | ||||||
| Cross-sectional/Urban (3) | 2 | 0.88 (0.82–0.95) | 0.0% | 0.489 | ||||||
| Prospective/Urban (4) | 4 | 1.04 (0.88–1.24) | 50.7% | 0.107 | ||||||
| Measure of association | ||||||||||
| Odds ratio (1) | 5 | 0.75 (0.63–0.88) | 63.2% | 0.019 | 0.21 (0.05; 0.39) | 0.07 | 0.016 | 0.02 | 49.76% | 63.13% |
| Relative risk (2) | 1 | 0.92 (0.84–1.00) | - | - | ||||||
| Hazard ratio (3) | 4 | 1.13 (0.96–1.34) | 0.0% | 0.499 | ||||||
| Sample size | ||||||||||
| <1000 | 4 | 0.86 (0.77–0.95) | 28.5% | 0.241 | 0.03 (−0.09; 0.14) | 0.05 | 0.578 | 0.06 | 66.27% | −29.83% |
| 1000–4999 | 2 | 1.34 (0.96–1.85) | 0.0% | 0.755 | ||||||
| 5000–9999 | 2 | 0.59 (0.46–0.76) | 0.0% | 0.367 | ||||||
| ≥10,000 | 2 | 0.97 (0.84–1.11) | 47.9% | 0.166 | ||||||
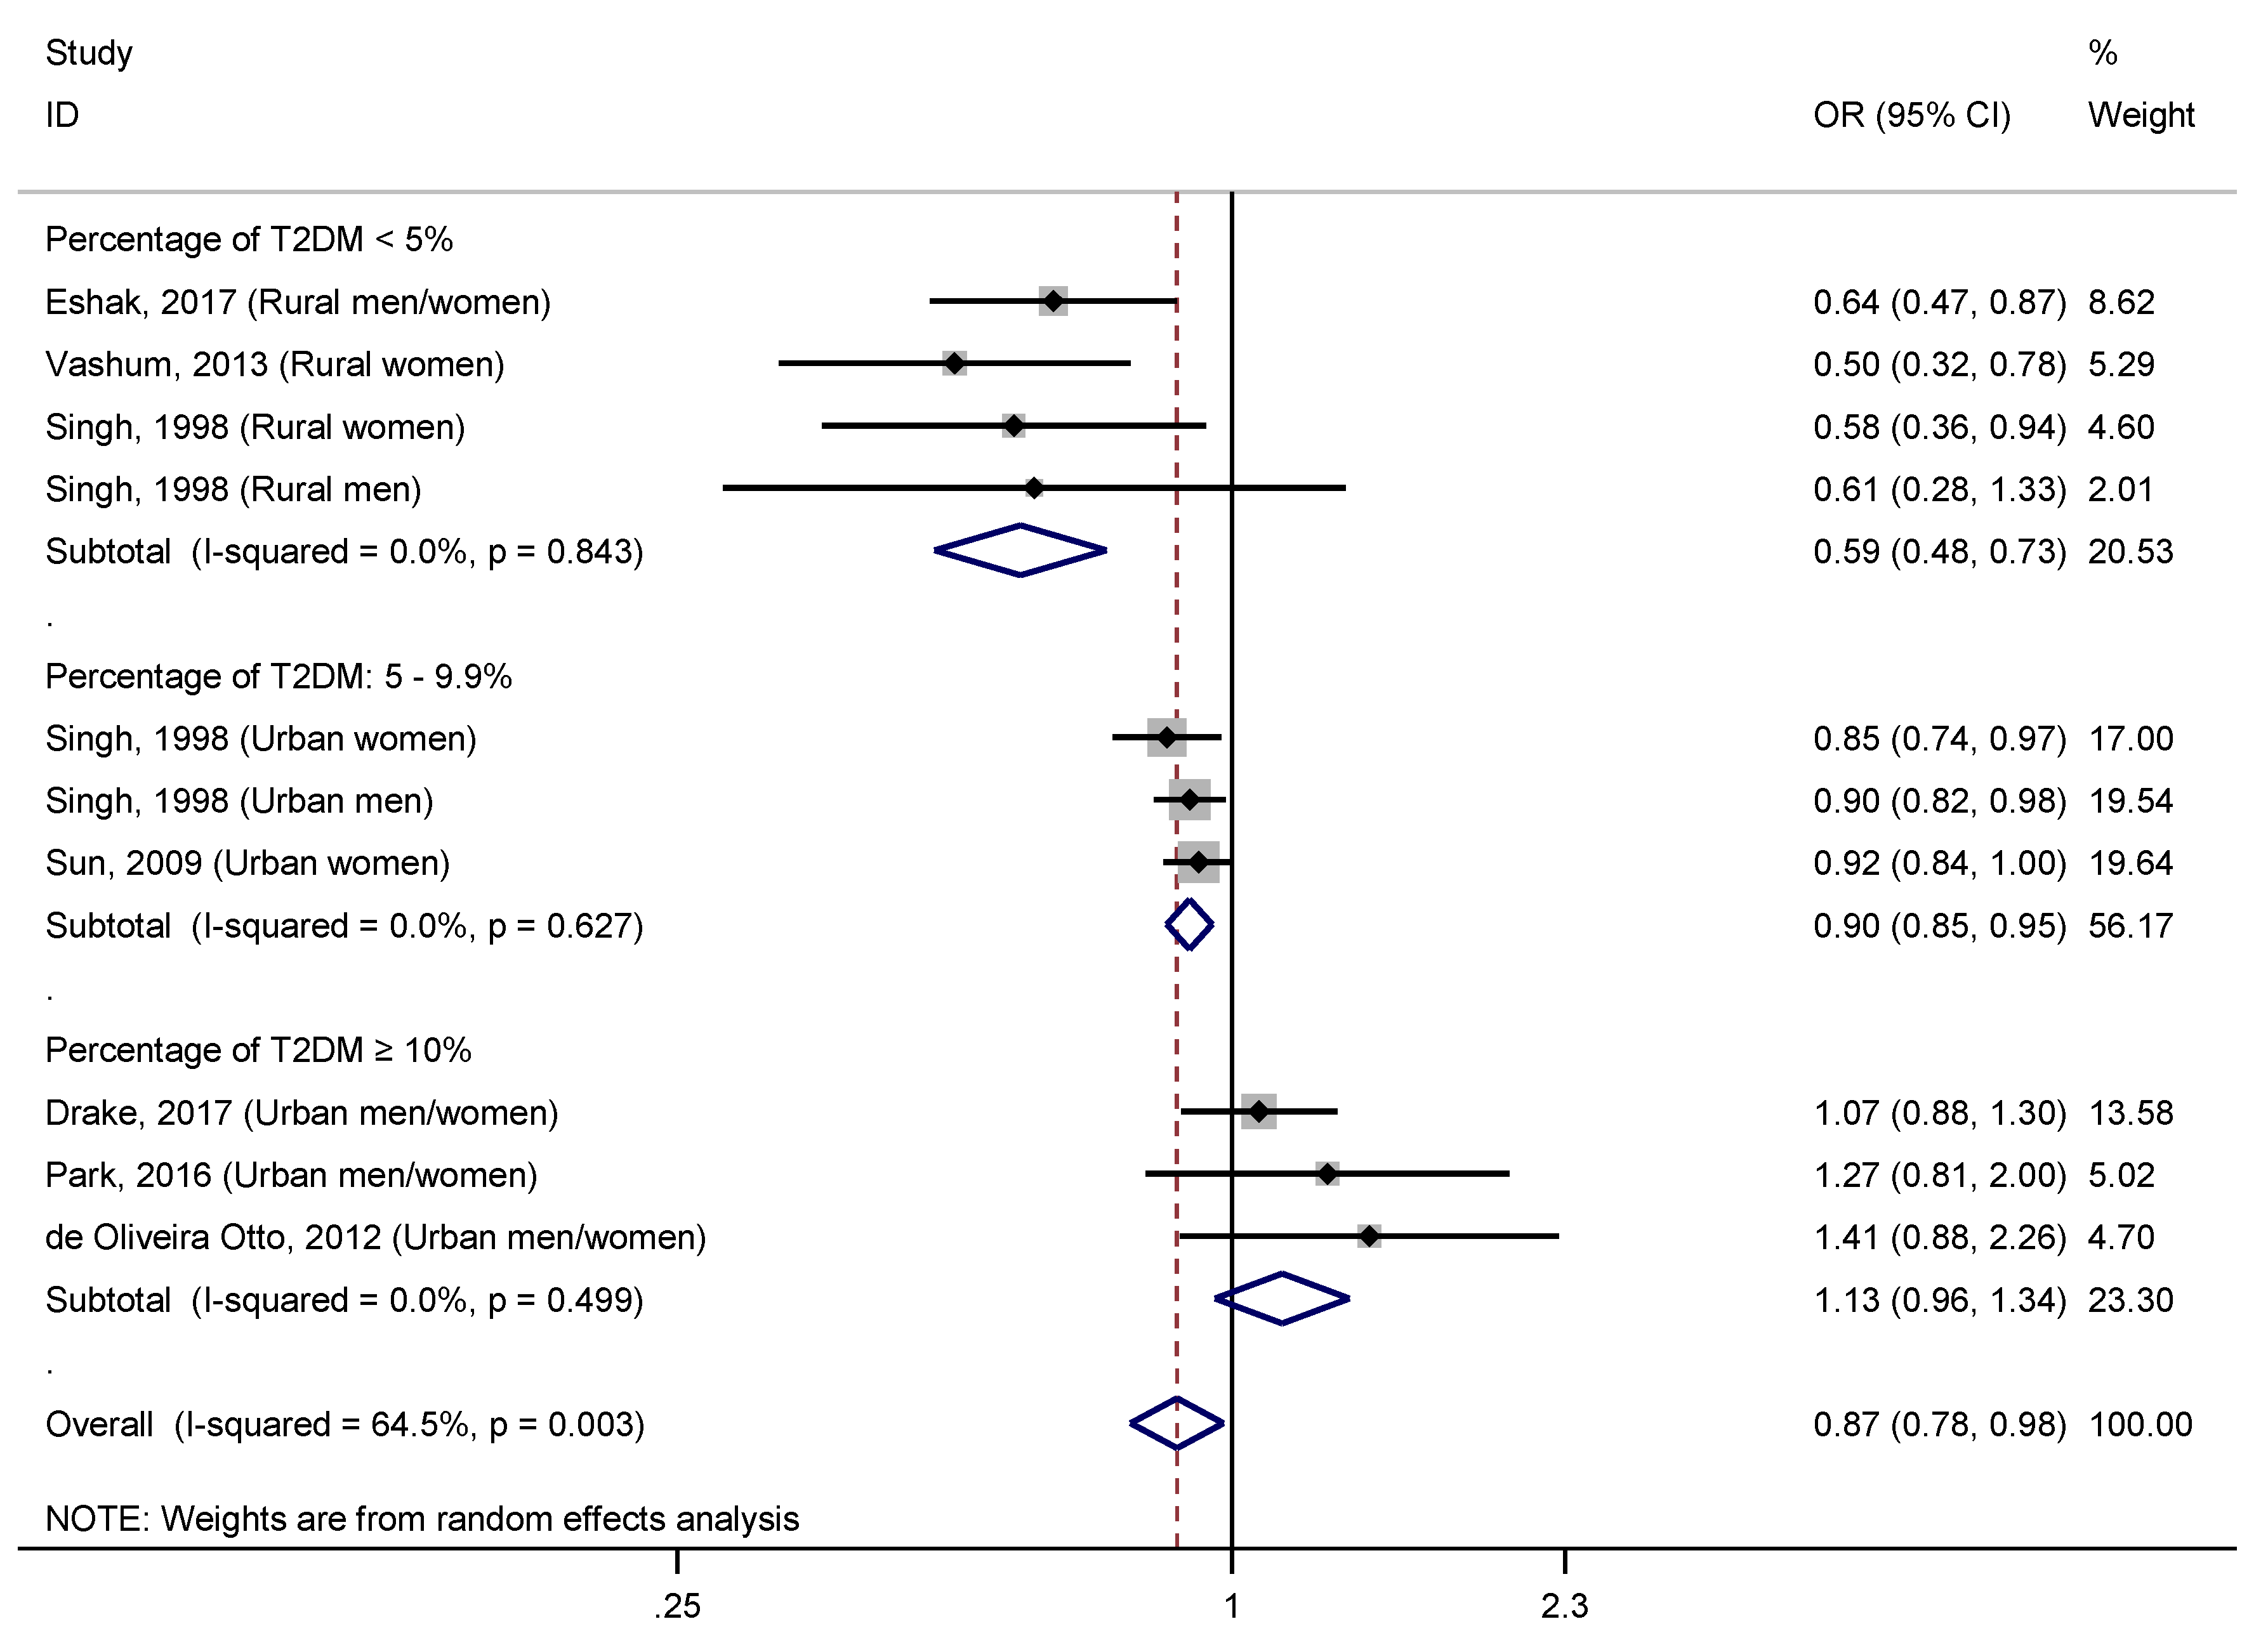
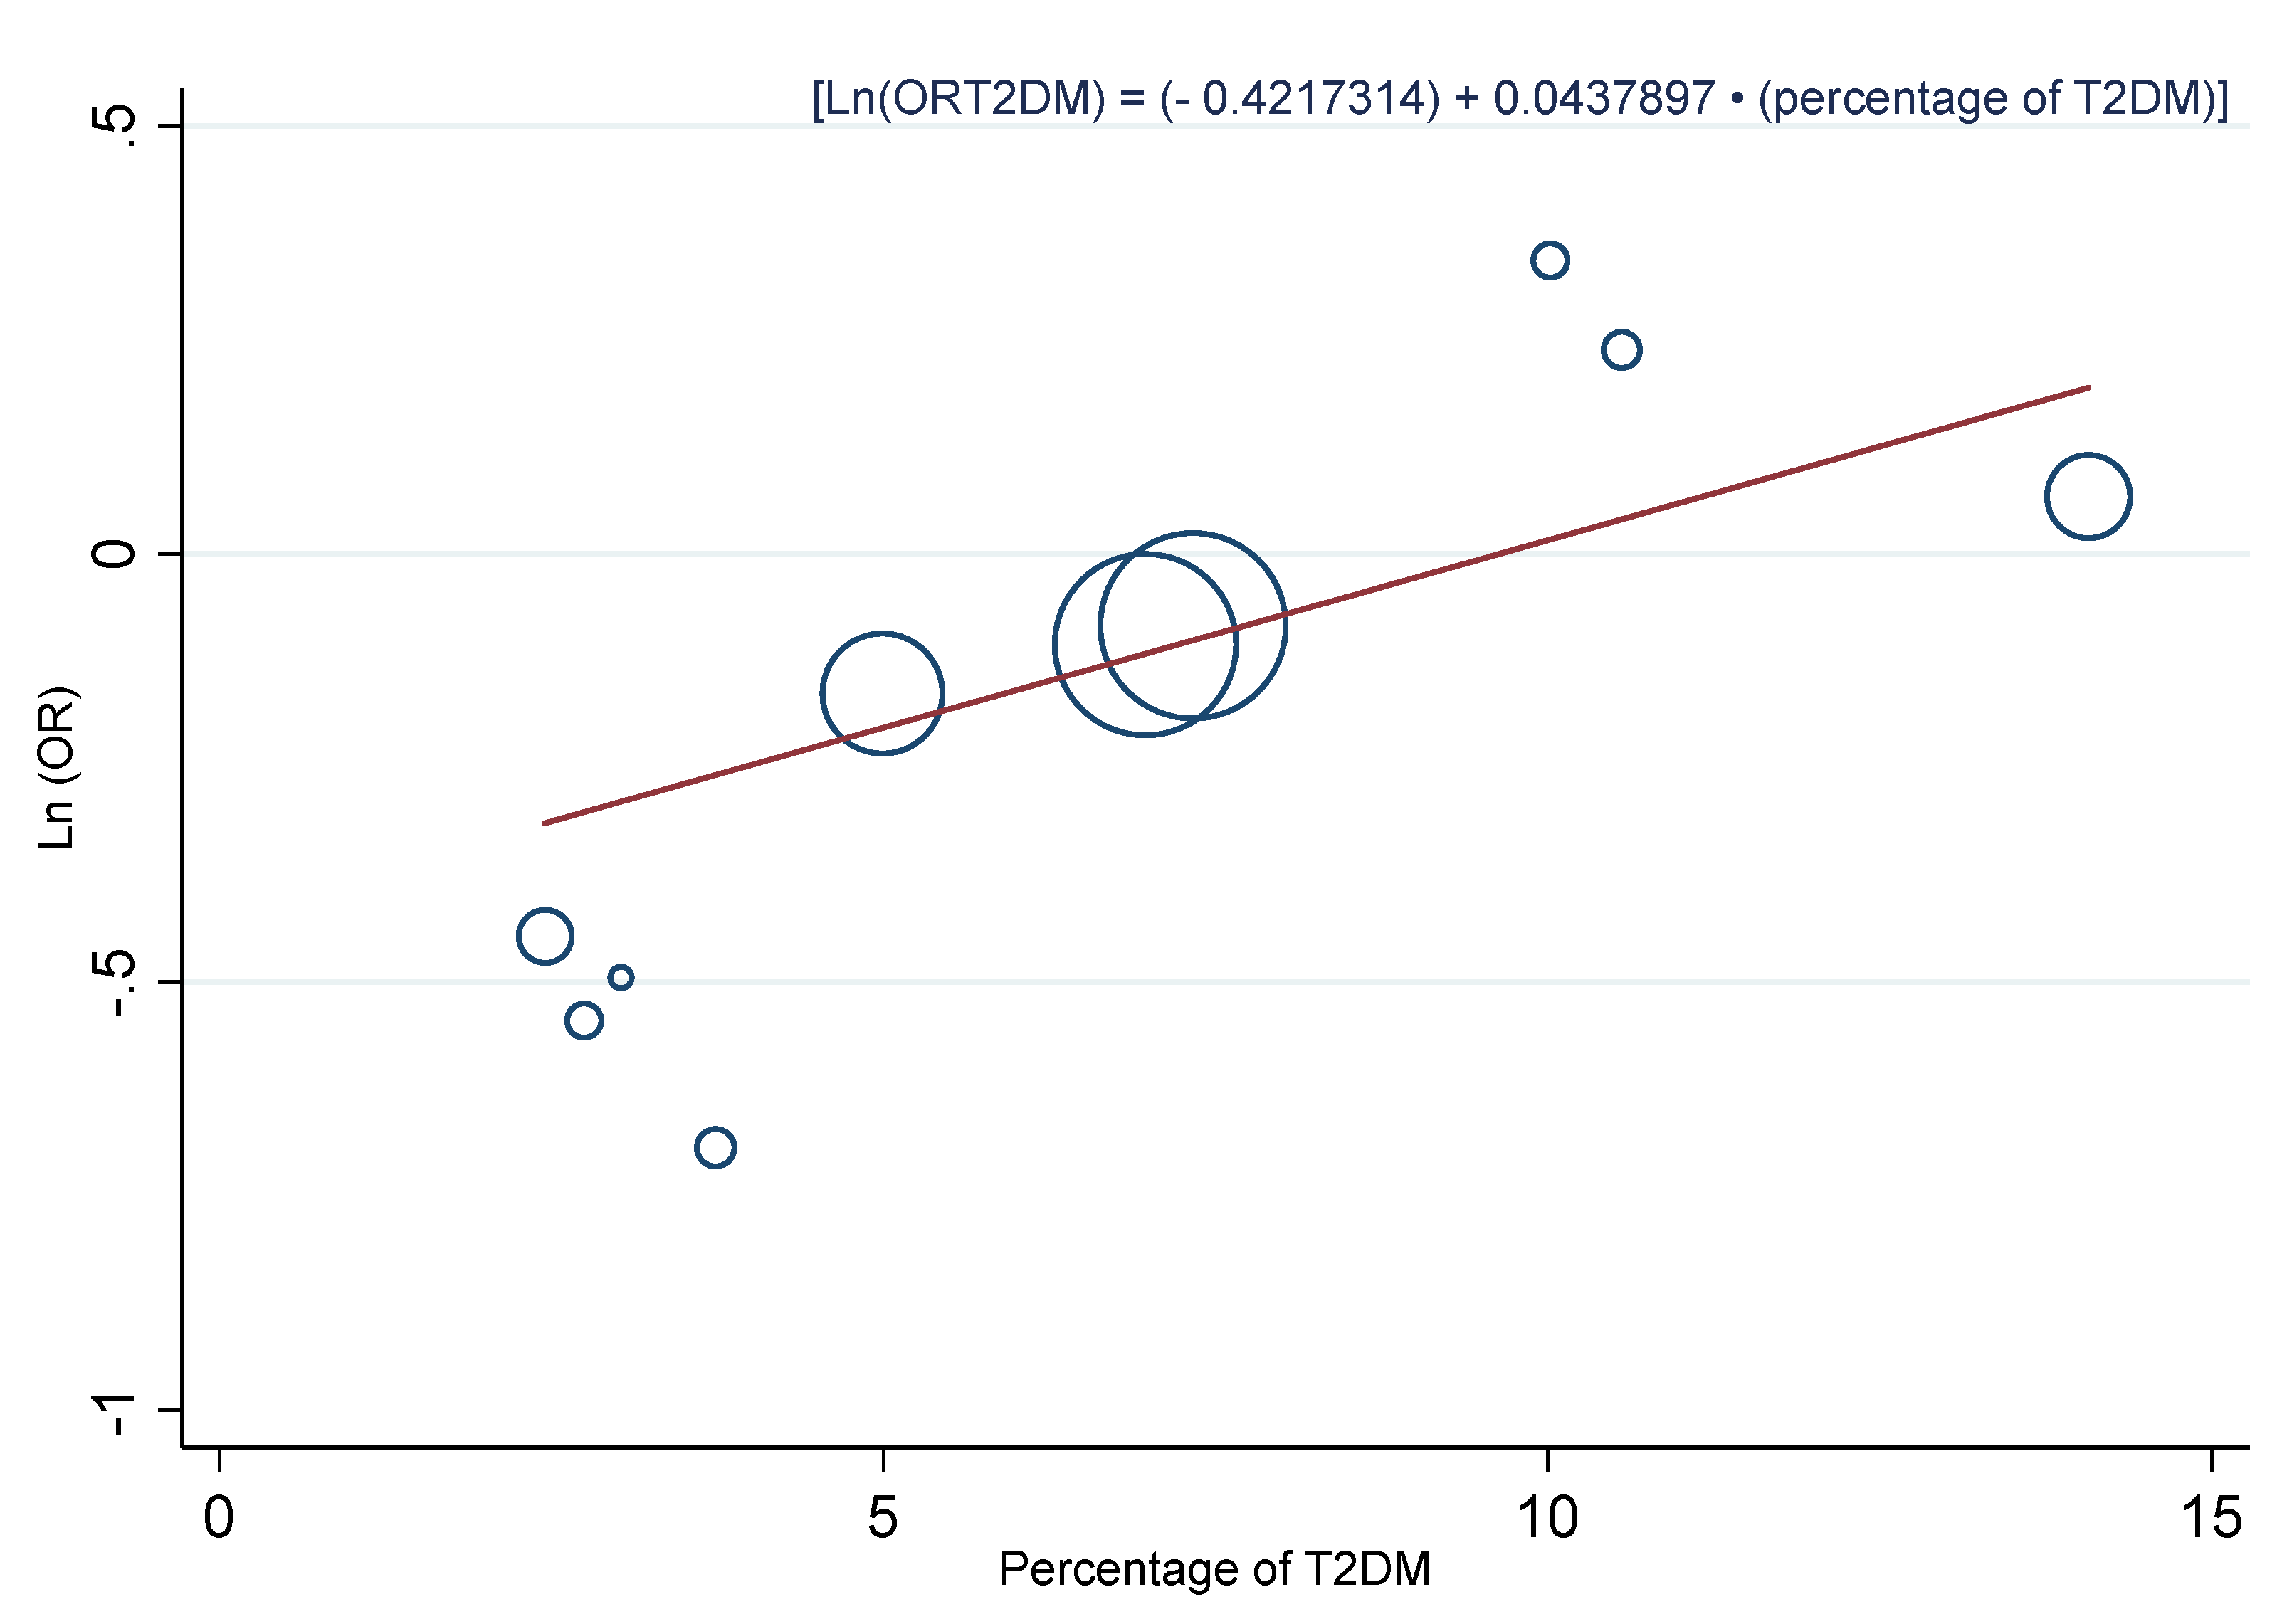
| Percentage of T2DM | ||||||||||
| <5% | 4 | 0.59 (0.48–0.73) | 0.0% | 0.843 | 0.31 (0.15; 0.46) | 0.07 | 0.002 | 0.00 | 0.00% | 100.0% |
| 5–9.9% | 3 | 0.90 (0.85–0.95) | 0.0% | 0.627 | ||||||
| ≥10% | 3 | 1.13 (0.96–1.34) | 0.0% | 0.499 | ||||||
| Zinc intake assessment method | ||||||||||
| VFFQ (1) | 4 | 0.80 (0.57–1.12) | 80.3% | 0.002 | −0.01 (−0.28; 0.26) | 0.12 | 0.906 | 0.07 | 68.24% | −40.61% |
| VDHQ (2) | 2 | 1.10 (0.92–1.31) | 0.0% | 0.497 | ||||||
| 7-day dietary record (3) | 4 | 0.86 (0.77–0.95) | 28.5% | 0.241 | ||||||
| Zinc quantiles adjusted for energy | ||||||||||
| Adjusted (1) | 9 | 0.86 (0.76–0.96) | 65.3% | 0.003 | 0.42 (−0.40; 1.25) | 0.36 | 0.271 | 0.04 | 65.34% | 6.11% |
| Not adjusted (2) | 1 | 1.27 (0.81–2.00) | - | - | ||||||
| Ascertainment of T2DM | ||||||||||
| FPG/OGTT (1) | 4 | 0.86 (0.77–0.95) | 28.5% | 0.241 | 0.19 (−0.05; 0.43) | 0.10 | 0.112 | 0.04 | 62.01% | 11.25% |
| Self-reported (2) | 3 | 0.70 (0.48–1.01) | 82.6% | 0.003 | ||||||
| Several criteria (3) | 3 | 1.13 (0.96–1.34) | 0.0% | 0.499 | ||||||
| Diagnostic pattern | ||||||||||
| One diagnostic pattern | 7 | 0.81 (0.72–0.91) | 61.7% | 0.016 | 0.41 (0.06; 0.77) | 0.15 | 0.027 | 0.02 | 53.12% | 51.60% |
| Several diagnostic pattern | 3 | 1.13 (0.96–1.34) | 0.0% | 0.499 | ||||||
| Study quality | ||||||||||
| 80–89 | 6 | 0.83 (0.71–0.97) | 58.4% | 0.035 | −0.11 (−0.36; 0.58) | 0.21 | 0.598 | 0.06 | 65.99% | −23.10% |
| ≥90 | 4 | 0.92 (0.73–1.16) | 74.0% | 0.009 | ||||||
© 2019 by the authors. Licensee MDPI, Basel, Switzerland. This article is an open access article distributed under the terms and conditions of the Creative Commons Attribution (CC BY) license (http://creativecommons.org/licenses/by/4.0/).
Share and Cite
Fernández-Cao, J.C.; Warthon-Medina, M.; H. Moran, V.; Arija, V.; Doepking, C.; Serra-Majem, L.; Lowe, N.M. Zinc Intake and Status and Risk of Type 2 Diabetes Mellitus: A Systematic Review and Meta-Analysis. Nutrients 2019, 11, 1027. https://doi.org/10.3390/nu11051027
Fernández-Cao JC, Warthon-Medina M, H. Moran V, Arija V, Doepking C, Serra-Majem L, Lowe NM. Zinc Intake and Status and Risk of Type 2 Diabetes Mellitus: A Systematic Review and Meta-Analysis. Nutrients. 2019; 11(5):1027. https://doi.org/10.3390/nu11051027
Chicago/Turabian StyleFernández-Cao, José C., Marisol Warthon-Medina, Victoria H. Moran, Victoria Arija, Carlos Doepking, Lluis Serra-Majem, and Nicola M. Lowe. 2019. "Zinc Intake and Status and Risk of Type 2 Diabetes Mellitus: A Systematic Review and Meta-Analysis" Nutrients 11, no. 5: 1027. https://doi.org/10.3390/nu11051027