Consumers’ Views on the Importance of Specific Front-of-Pack Nutrition Information: A Latent Profile Analysis

 ,
,  , and
, and
Abstract
:1. Introduction
2. Materials and Methods
2.1. Sample and Study Design
2.2. Measures
2.2.1. Socio-Demographics
2.2.2. Perceived Importance of Nutrient Information on Front of Pack
2.2.3. Self-Rated Nutrition Knowledge
2.2.4. Healthiness of Diet and Special Dietary Requirements
2.3. Statistical Analyses
3. Results
3.1. Descriptive Statistics
3.2. Fit Statistics
3.3. Five-Segment Latent Profile Solution
4. Discussion
Study Strengths and Limitations
5. Conclusions
Supplementary Materials
Author Contributions
Funding
Conflicts of Interest
References
- Haack, S.A.; Byker, C.J. Recent population adherence to and knowledge of United States federal nutrition guides, 1992–2013: A systematic review. Nutr. Rev. 2014, 72, 613–626. [Google Scholar] [CrossRef] [PubMed]
- Raulio, S.; Ovaskainen, M.L.; Männistö, S.; Tapanainen, H.; Virtanen, S.; Peltonen, M. Adherence to dietary guidelines in FINDIET2012. Eur. J. Public Health 2015, 25, ckv172-102. [Google Scholar] [CrossRef]
- Rodríguez-Rodríguez, E.; Aparicio, A.; Aranceta-Bartrina, J.; Gil, Á.; González-Gross, M.; Serra-Majem, L.; Varela-Moreiras, G.; Ortega, R.M. Low adherence to dietary guidelines in Spain, especially in the overweight/obese population: The ANIBES study. J. Am. Coll. Nutr. 2017, 36, 240–247. [Google Scholar] [CrossRef]
- Benziger, C.P.; Roth, G.A.; Moran, A.E. The global burden of disease study and the preventable burden of NCD. Glob. Heart 2016, 11, 393–397. [Google Scholar] [CrossRef] [PubMed]
- Imamura, F.; Micha, R.; Khatibzadeh, S.; Fahimi, S.; Shi, P.; Powles, J.; Mozaffarian, D. Dietary quality among men and women in 187 countries in 1990 and 2010: A systematic assessment. Lancet Glob. Health 2015, 3, e132–e142. [Google Scholar] [CrossRef]
- Lim, S.S.; Vos, T.; Flaxman, A.D.; Danaei, G.; Shibuya, K.; Adair-Rohani, H.; AlMazroa, M.A.; Amann, M.; Anderson, H.R.; Andrews, K.G.; et al. A comparative risk assessment of burden of disease and injury attributable to 67 risk factors and risk factor clusters in 21 regions, 1990–2010: A systematic analysis for the Global Burden of Disease Study 2010. Lancet 2012, 380, 2224–2260. [Google Scholar] [CrossRef]
- World Health Organization. Obesity and Overweight, fact Sheet. 2017. Available online: http://www.who.int/news-room/fact-sheets/detail/obesity-and-overweight/ (accessed on 11 March 2019).
- National Health and Medical Research Council. Australian Dietary Guidelines; National Health and Medical Research Council: Canberra, Australia, 2013. Available online: http://www.nutritionaustralia.org/national/resource/australian-dietary-guidelines-2013/ (accessed on 8 March 2019).
- Public Health England. The Eatwell Guide; Public Health England in association with the Welsh Government FSSatFSAiNI: UK, 2016. Available online: https://www.nhs.uk/live-well/eat-well/the-eatwell-guide (accessed on 8 March 2019).
- U.S. Department of Health and Human Services; U.S. Department of Agriculture. 2015–2020 Dietary Guidelines for Americans: Dietary guidelines and MyPlate, 8th ed.; USDA, Ed.; 2016. Available online: http://health.gov/dietaryguidelines/2015/guidelines/ (accessed on 27 February 2019).
- Brunner, T.A.; van der Horst, K.; Siegrist, M. Convenience food products. Drivers for consumption. Appetite 2010, 55, 498–506. [Google Scholar] [CrossRef]
- Smith, L.P.; Ng, S.W.; Popkin, B.M. Resistant to the recession: Low-income adults’ maintenance of cooking and away-from-home eating behaviors during times of economic turbulence. Am. J. Public Health 2014, 104, 840–846. [Google Scholar] [CrossRef] [PubMed]
- Wolfson, J.A.; Bleich, S.N.; Smith, K.C.; Frattaroli, S. What does cooking mean to you? Perceptions of cooking and factors related to cooking behavior. Appetite 2016, 97, 146–154. [Google Scholar] [CrossRef] [PubMed]
- Poti, J.M.; Mendez, M.A.; Ng, S.W.; Popkin, B.M. Is the degree of food processing and convenience linked with the nutritional quality of foods purchased by US households? Am. J. Clin. Nutr. 2015, 101, 1251–1262. [Google Scholar] [CrossRef] [Green Version]
- Poti, J.M.; Mendez, M.A.; Ng, S.W.; Popkin, B.M. Highly processed and ready-to-eat packaged food and beverage purchases differ by race/ethnicity among US households. J. Nutr. 2016, 146, 1722–1730. [Google Scholar] [CrossRef]
- Steele, E.M.; Baraldi, L.G.; da Costa Louzada, M.L.; Moubarac, J.-C.; Mozaffarian, D.; Monteiro, C.A. Ultra-processed foods and added sugars in the US diet: Evidence from a nationally representative cross-sectional study. BMJ Open 2016, 6, e009892. [Google Scholar] [CrossRef]
- Anderson, C.A.M.; Appel, L.J.; Okuda, N.; Brown, I.J.; Chan, Q.; Zhao, L.; Ueshima, H.; Kesteloot, H.; Miura, K.; Curb, J.D.; et al. Dietary sources of sodium in China, Japan, the United Kingdom, and the United States, women and men aged 40 to 59 Years: The INTERMAP study. J. Am. Diet. Assoc. 2010, 110, 736–745. [Google Scholar] [CrossRef]
- Forouzanfar, M.H.; Alexander, L.; Anderson, H.R.; Bachman, V.F.; Biryukov, S.; Brauer, M.; Burnett, R.; Casey, D.; Coates, M.M.; Cohen, A.; et al. Global, regional, and national comparative risk assessment of 79 behavioural, environmental and occupational, and metabolic risks or clusters of risks in 188 countries, 1990–2013: A systematic analysis for the Global Burden of Disease Study 2013. Lancet 2015, 386, 2287–2323. [Google Scholar] [CrossRef]
- World Health Organization. Global Status Report on Noncommunicable Diseases 2014; ISBN 9789241564854. 29/06/2018; 2014; p. 298. Available online: http://apps.who.int/iris/bitstream/handle/10665/148114/9789241564854_eng.pdf?sequence=1 (accessed on 14 March 2019).
- Tapsell, L.C.; Neale, E.P.; Satija, A.; Hu, F.B. Foods, nutrients, and dietary patterns: Interconnections and implications for dietary guidelines. Adv. Nutr. 2016, 7, 445–454. [Google Scholar] [CrossRef]
- Anderson, C.L.; O’Connor, E.L. The effect of the health star rating on consumer decision-making. Food Qual. Preference 2019, 73, 215–225. [Google Scholar] [CrossRef]
- Cecchini, M.; Warin, L. Impact of food labelling systems on food choices and eating behaviours: A systematic review and meta-analysis of randomized studies. Obes. Rev. 2016, 17, 201–210. [Google Scholar] [CrossRef]
- Egnell, M.; Talati, Z.; Hercberg, S.; Pettigrew, S.; Julia, C. Objective understanding of front-of-package nutrition labels: An international comparative experimental study across 12 countries. Nutrients 2018, 10, 1542. [Google Scholar] [CrossRef] [PubMed]
- Talati, Z.; Norman, R.; Pettigrew, S.; Neal, B.; Kelly, B.; Dixon, H.; Ball, K.; Miller, C.; Shilton, T. The impact of interpretive and reductive front-of-pack labels on food choice and willingness to pay. Int. J. Behav. Nutr. Phys. Act. 2017, 14, 171. [Google Scholar] [CrossRef] [PubMed]
- World Cancer Research Fund International. Building Momentum: Lessons on Implementing a rObust Front-Of-Pack Food Label. 2019. Available online: http://www.wcrf.org/buildingmomentum (accessed on 17 March 2019).
- Campos, S.; Doxey, J.; Hammond, D. Nutrition labels on pre-packaged foods: A systematic review. Public Health Nutr. 2011, 14, 1496–1506. [Google Scholar] [CrossRef] [PubMed]
- Graham, D.J.; Heidrick, C.; Hodgin, K. Nutrition label viewing during a food-selection task: Front-of-package labels vs nutrition facts labels. J. Acad. Nutr. Diet. 2015, 115, 1636–1646. [Google Scholar] [CrossRef]
- Graham, D.J.; Jeffery, R.W. Location, location, location: Eye-tracking evidence that consumers preferentially view prominently positioned nutrition information. J. Am. Diet. Assoc. 2011, 111, 1704–1711. [Google Scholar] [CrossRef]
- Wills, J.M.; Schmidt, D.B.; Pillo-Blocka, F.; Cairns, G. Exploring global consumer attitudes toward nutrition information on food labels. Nutr. Rev. 2009, 67, S102–S106. [Google Scholar] [CrossRef]
- Drewnowski, A.; Moskowitz, H.; Reisner, M.; Krieger, B. Testing consumer perception of nutrient content claims using conjoint analysis. Public Health Nutr. 2010, 13, 688–694. [Google Scholar] [CrossRef] [Green Version]
- Grunert, K.G.; Wills, J.M.; Fernández-Celemín, L. Nutrition knowledge, and use and understanding of nutrition information on food labels among consumers in the UK. Appetite 2010, 55, 177–189. [Google Scholar] [CrossRef] [Green Version]
- Kelly, B.; Hughes, C.; Chapman, K.; Louie, J.C.-Y.; Dixon, H.; Crawford, J.; King, L.; Daube, M.; Slevin, T. Consumer testing of the acceptability and effectiveness of front-of-pack food labelling systems for the Australian grocery market. Health Promot. Int. 2009, 24, 120–129. [Google Scholar] [CrossRef] [Green Version]
- Morley, B.; Scully, M.; Martin, J.; Niven, P.; Dixon, H.; Wakefield, M. What types of nutrition menu labelling lead consumers to select less energy-dense fast food? An experimental study. Appetite 2013, 67, 8–15. [Google Scholar] [CrossRef]
- Watson, W.; Kelly, B.; Hector, D.; Hughes, C.; King, L.; Crawford, J.; Sergeant, J.; Chapman, K. Can front-of-pack labelling schemes guide healthier food choices? Australian shoppers’ responses to seven labelling formats. Appetite 2014, 72, 90–97. [Google Scholar] [CrossRef]
- Sacks, G.; Veerman, J.L.; Moodie, M.; Swinburn, B. ‘Traffic-light’nutrition labelling and ‘junk-food’tax: A modelled comparison of cost-effectiveness for obesity prevention. Int. J. Obes. 2011, 35, 1001. [Google Scholar] [CrossRef]
- Hawkes, C.; Jewell, J.; Allen, K. A food policy package for healthy diets and the prevention of obesity and diet-related non-communicable diseases: The NOURISHING framework. Obes. Rev. 2013, 14, 159–168. [Google Scholar] [CrossRef]
- Van Wezemael, L.; Caputo, V.; Nayga, R.M.; Chryssochoidis, G.; Verbeke, W. European consumer preferences for beef with nutrition and health claims: A multi-country investigation using discrete choice experiments. Food Policy 2014, 44, 167–176. [Google Scholar] [CrossRef]
- Hoefkens, C.; Verbeke, W.; Van Camp, J. European consumers’ perceived importance of qualifying and disqualifying nutrients in food choices. Food Qual. Preference 2011, 22, 550–558. [Google Scholar] [CrossRef]
- World Health Organization. World Report on Ageing and Health; 2015; ISBN 9241565047. Available online: http://www.who.int/ageing/events/world-report-2015-launch/en/ (accessed on 5 March 2019).
- Jurado, F.; Gracia, A. Does the valuation of nutritional claims differ among consumers? Insights from Spain. Nutrients 2017, 9, 132. [Google Scholar] [CrossRef] [PubMed]
- Food Standards Australia New Zealand. Health Star Rating system style guideline (version 5). 2017. Available online: http://healthstarrating.gov.au/internet/healthstarrating/publishing.nsf/Content/style-guide (accessed on 15 March 2019).
- Food Standards Australia New Zealand. Nutrition information user guide: Standard 1.2.8—Nutrition information Requirements 2013. Available online: https://www.foodstandards.gov.au/code/userguide/Documents/Userguide_Prescribed%20Nutrition%20Information%20Nov%2013%20Dec%202013.pdf/ (accessed on 10 March 2019).
- Talati, Z.; Pettigrew, S.; Dixon, H.; Neal, B.; Hughes, C.; Shilton, T.; Miller, C. Protocol for a randomized trial assessing consumer evaluations of pre-packaged foods that systematically vary by nutrition information and product attributes. BMC Nutr. 2017, 3, 3. [Google Scholar] [CrossRef]
- Australian Institute of Health & Welfare. Australia’s Health 2016, Chapter 5; AIHW, Ed.; AIHW: Canberra, Australia, 2016. Available online: https://www.aihw.gov.au/reports/australias-health/australias-health-2016/contents/population-groups (accessed on 22 February 2019).
- Christoph, M.J.; Larson, N.; Laska, M.N.; Neumark-Sztainer, D. Nutrition facts panels: Who uses them, what do they use, and how does use relate to dietary intake? J. Acad. Nutr. Diet. 2018, 118, 217–228. [Google Scholar] [CrossRef]
- Australian Bureau of Statistics. 31010DO002_201612—Australian Demographic Statistics, Dec 2016: Age distribution, by sex, preliminary–30 June 2016, data cubes; ABS: Canberra, Australia, 2017. Available online: http://www.abs.gov.au/AUSSTATS/[email protected]/DetailsPage/3101.0Dec%202017?OpenDocument (accessed on 10 March 2019).
- Australian Bureau of Statistics. 2033.0.55.001—Census of Population and Housing: Socio-Economic Indexes for Areas (SEIFA), Australia, 2016; ABS: Canberra, Australia, 2018. Available online: http://www.abs.gov.au/ausstats/[email protected]/mf/2033.0.55.001 (accessed on 12 March 2019).
- Australian Bureau of Statistics. 1270.0.55.005—Australian Statistical Geography Standard (ASGS): Volume 5—Remoteness structure, July 2011; Statistics, A.B.o., Ed.; ABS: Canberra, Australia, 2013; Volume 5. Available online: http://www.abs.gov.au/ausstats/[email protected]/mf/1270.0.55.005?OpenDocument/ (accessed on 3 March 2019).
- Hagenaars, J.A.P.; McCutcheon, A.L. Applied Latent Class Analysis; Cambridge University Press: Cambridge, UK, 2002. [Google Scholar]
- Nylund, K.L.; Asparouhov, T.; Muthén, B.O. Deciding on the number of classes in latent class analysis and growth mixture modeling: A Monte Carlo Simulation study. Struct. Equ. Model. 2007, 14, 535–569. [Google Scholar] [CrossRef]
- Akaike, H. A new look at the statistical model identification. IEEE Trans. Autom. Control 1974, 19, 716–723. [Google Scholar] [CrossRef]
- DiStefano, C.; Kamphaus, R.W. Investigating subtypes of child development: A comparison of cluster analysis and latent class cluster analysis in typology creation. Educ. Psychol. Meas. 2006, 66, 778–794. [Google Scholar] [CrossRef]
- Marsh, H.W.; Lüdtke, O.; Trautwein, U.; Morin, A.J.S. Classical latent profile analysis of academic self-concept dimensions: Synergy of person- and variable-centered approaches to theoretical models of self-concept. Struct. Equ. Model. 2009, 16, 191–225. [Google Scholar] [CrossRef]
- Nagin, D.S. Group-Based Modeling of Development; Harvard University Press: Cambridge, MA, USA, 2005. [Google Scholar]
- StataCorp. Stata Statistical Software: Release 15.1; StataCorp LLC: College Station, TX, USA, 2017. [Google Scholar]
- Kamata, A.; Kara, Y.; Patarapichayatham, C.; Lan, P. Evaluation of analysis approaches for latent class analysis with auxiliary linear growth model. Front. Psychol. 2018, 9, 130. [Google Scholar] [CrossRef]
- Kahneman, D.; Tversky, A. Prospect theory: An analysis of decisions under risk. Econometrica 1979, 47, 263–291. [Google Scholar] [CrossRef]
- Carter, O.; Mills, B.; Phan, T. An independent assessment of the Australian food industry’s Daily Intake Guide’energy alone’label. Health Promot. J. Aust. 2011, 22, 63–67. [Google Scholar] [CrossRef]
- Watson, W.L.; Chapman, K.; King, L.; Kelly, B.; Hughes, C.; Louie, J.C.Y.; Crawford, J.; Gill, T.P. How well do Australian shoppers understand energy terms on food labels? Public Health Nutr. 2013, 16, 409–417. [Google Scholar] [CrossRef] [PubMed]
- Hughes, C.; Wellard, L.; Lin, J.; Suen, K.L.; Chapman, K. Regulating health claims on food labels using nutrient profiling: What will the proposed standard mean in the Australian supermarket? Public Health Nutr. 2013, 16, 2154–2161. [Google Scholar] [CrossRef]
- Frohlich, X. The informational turn in food politics: The US FDA’s nutrition label as information infrastructure. Soc. Stud. Sci. 2017, 47, 145–171. [Google Scholar] [CrossRef]
- Roberto, C.A.; Bragg, M.A.; Schwartz, M.B.; Seamans, M.J.; Musicus, A.; Novak, N.; Brownell, K.D. Facts up front versus traffic light food labels: A randomized controlled trial. Am. J. Prev. Med. 2012, 43, 134–141. [Google Scholar] [CrossRef]
- Roberto, C.A.; Khandpur, N. Improving the design of nutrition labels to promote healthier food choices and reasonable portion sizes. Int. J. Obes. 2014, 38, S25. [Google Scholar] [CrossRef] [PubMed]


| Sample % | Australian Adult Population [46,47] % | |
|---|---|---|
| Age (in years) | ||
| 18–35 | 33 | 33 |
| 36–55 | 33 | 34 |
| 56+ | 34 | 33 |
| Gender | ||
| Male | 50 | 49 |
| Female | 50 | 51 |
| Socio-economic status 1 | ||
| Low | 49 | 40 |
| Medium | 32 | 40 |
| High | 19 | 20 |
| Log-Log | Df 2 | AIC 3 | BIC 4 | SABIC 5 | Entropy | Segments Representing <5% of Total Sample | |
|---|---|---|---|---|---|---|---|
| Segment 1 | −15,040.34 | 14 | 30,108.68 | 30,183.59 | 30,139.11 | - | - |
| Segment 2 | −12,811.51 | 22 | 25,667.01 | 25,784.74 | 25,714.85 | 0.90 | 0 |
| Segment 3 | −12,213.48 | 30 | 24,486.95 | 24,647.49 | 24,552.21 | 0.87 | 0 |
| Segment 4 | −10,971.10 | 38 | 22,018.02 | 22,221.54 | 22,100.87 | 0.94 | 0 |
| Segment 5 1 | −10,640.68 | 46 | 21,373.36 | 21,619.51 | 21,473.47 | 0.95 | 0 |
| Segment 6 | −10,505.64 | 54 | 21,119.28 | 21,408.24 | 21,236.84 | 0.96 | 0 |
| Segment 7 | −10,320.25 | 62 | 20,764.50 | 21,096.27 | 20,899.51 | 0.96 | 1 |
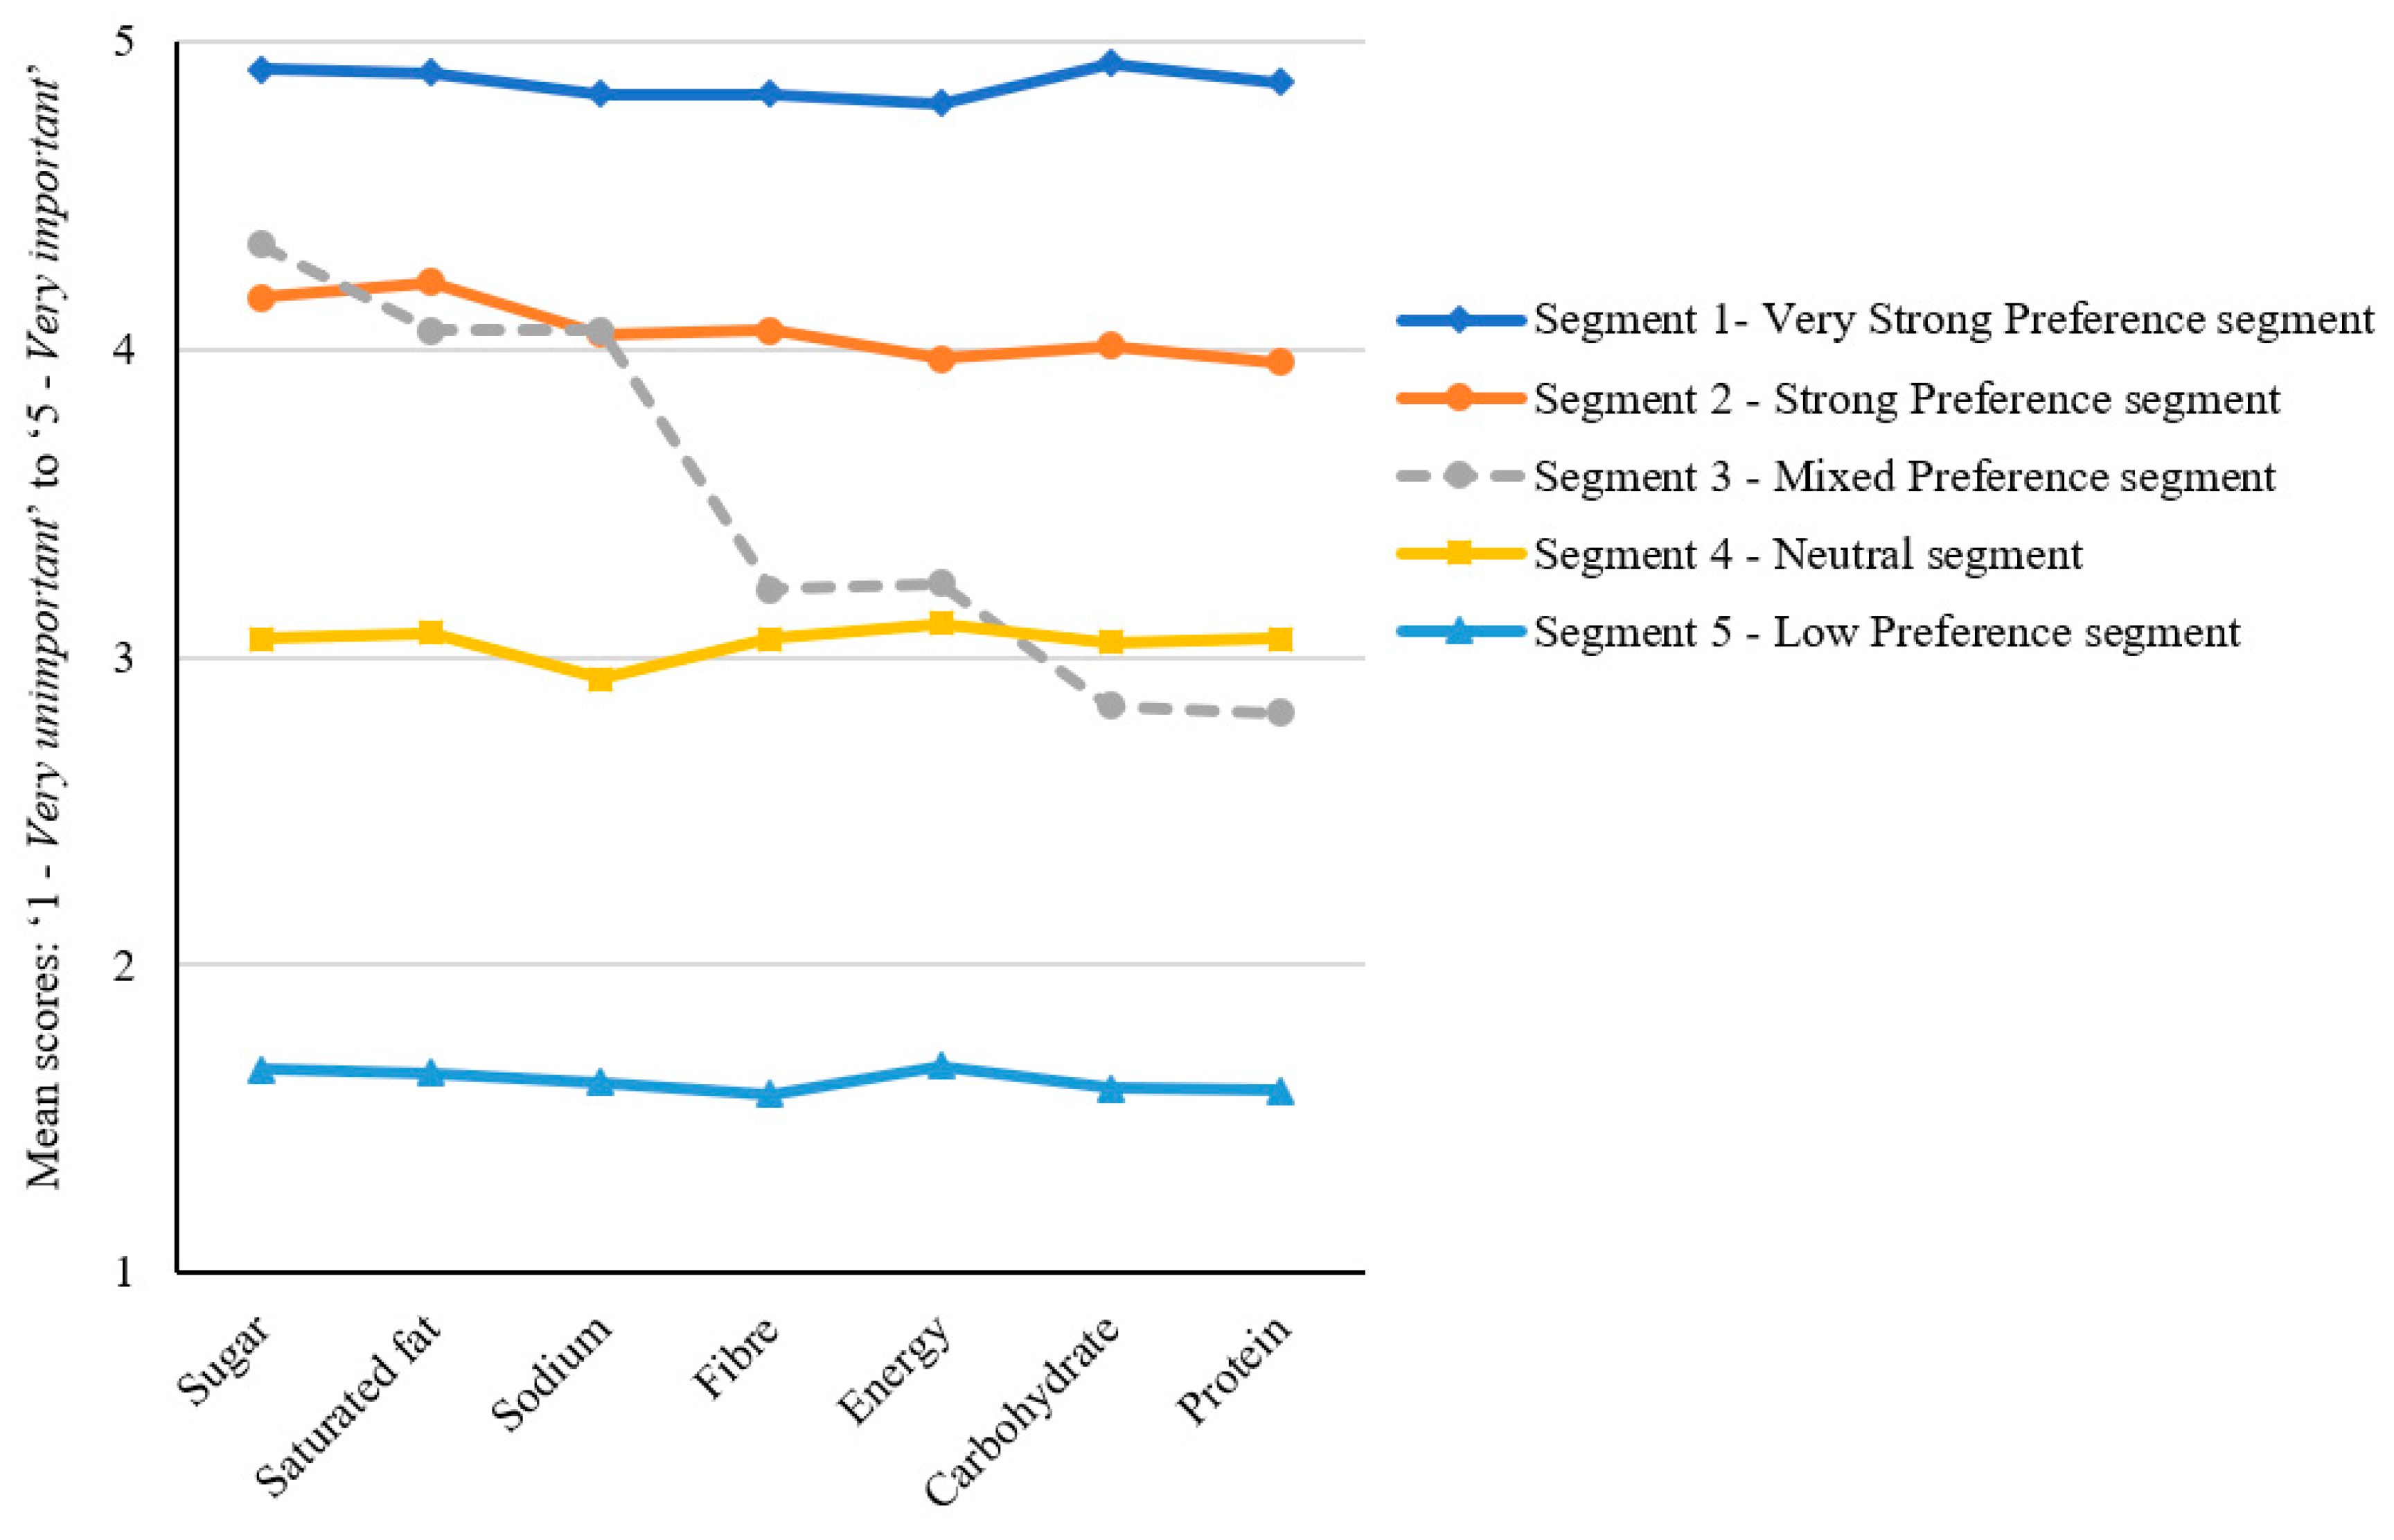
| Total Sample n = 1558 | Very Strong Preference Segment n = 213 13% of Sample | Strong Preference Segment n = 609 39% of Sample | Mixed Preference Segment n = 231 15% of Sample | Neutral Segment n = 419 27% of Sample | Low Preference Segment n = 86 6% of Sample | ||
|---|---|---|---|---|---|---|---|
| Indicator variables 1 | Mean (SD) | Mean (SD) | Mean (SD) | Mean (SD) | Mean (SD) | Mean (SD) | F (p-values) |
| Sugar | 3.86 (0.98) 1 | 4.91 (0.30) 1,3,a | 4.17 (0.61) 1,b | 4.34 (0.50)1,c | 3.06 (0.53) 1,d | 1.66 (0.64) 1,e | 870.03 (<0.001) |
| Saturated fat | 3.84 (1.00) 1 | 4.90 (0.40) 1,3,a | 4.22 (0.61) 1,b | 4.06 (0.74) 2,c | 3.08 (0.56) 1,d | 1.65 (0.66) 1,e | 691.97 (<0.001) |
| Sodium | 3.71 (0.99) 2 | 4.83 (0.43) 2,a | 4.05 (0.65) 2,b | 4.06 (0.66) 2,b | 2.93 (0.48) 2,c | 1.62 (0.58) 1,d | 750.57 (<0.001) |
| Fibre | 3.64 (0.95) 3 | 4.83 (0.42) 2,a | 4.06 (0.51) 2,b | 3.22 (0.76) 3,c | 3.06 (0.50) 1,d | 1.58 (0.52) 1,e | 814.42 (<0.001) |
| Energy | 3.62 (0.95) 3 | 4.80 (0.45) 2,a | 3.97 (0.57) 3,4,b | 3.24 (0.81) 3,c | 3.11 (0.57) 1,c | 1.67 (0.73) 1,d | 566.07 (0.001) |
| Carbohydrate | 3.57 (0.94) 4 | 4.93 (0.26) 3,a | 4.01 0.38) 2,3,b | 2.84 (0.54) 4,c | 3.05 (0.44) 1,d | 1.60 (0.52) 1,e | 1566.04 (<0.001) |
| Protein | 3.54 (0.93) 4 | 4.87 (0.33) 1,a | 3.96 (0.40) 4,b | 2.82 (0.52) 4,c | 3.06 (0.48) 1,d | 1.59 (0.49) 1,e | 1322.98 (<0.001) |
| Predictor variables | Mean (SD) | Mean (SD) | Mean (SD) | Mean (SD) | Mean (SD) | Mean (SD) | F (p-values) |
| Age (in years) | 46.01 (17.35) | 49.25 (17.09) a | 47.44 (17.36) a | 45.84 (16.54) a,b | 42.27 (17.15) b | 46.51 (18.20) a,b | 7.91 (<0.001) |
| BMI | 26.84 (6.24) | 27.26 (5.75) | 26.68 (6.27) | 26.40 (5.19) | 27.12 (7.23) | 27.01 (5.00) | 0.66 (0.621) |
| Perceived healthiness of diet 2 | 2.96 (0.49) | 3.11 (0.50) a | 3.02 (0.47) a,c | 2.94 (0.41) c | 2.81 (0.51) b | 2.87 (0.53) b,c | 19.23 (<0.001) |
| Nutritional knowledge 1 | 3.34 (0.85) | 3.60 (0.91) a | 3.48 (0.82) a | 3.20 (0.82) b | 3.11 (0.77) b | 3.16 (1.07) b | 19.70 (<0.001) |
| n (%) | n (%) | n (%) | n (%) | n (%) | n (%) | X2 (p-values) | |
| Gender | 6.20 (0.184) | ||||||
| Female | 782 (50) | 114 (54) | 318 (52) | 119 (52) | 193 (46) | 38 (44) | |
| Males | 776 (50) | 99 (46) | 291 (48) | 112 (48) | 226 (54) | 48 (56) | |
| SES | 37.73 (<0.001) | ||||||
| Low | 767 (49) | 115 (54) a | 320 (53) a | 112 (48) a,b | 180 (43) b | 40 (47) a,b | |
| Medium | 492 (32) | 65 (31) a,b | 196 (32) a,b | 85 (37) a | 120 (29) b | 26 (30) a,b | |
| High | 298 (19) | 33 (15) a | 92 (15) a | 34 (15) a | 119 (28) b | 20 (23) a,b | |
| Had a child (ren) (<18 years) | 411 (26) | 59 (28) | 159 (26) | 56 (24) | 114 (27) | 23 (27) | 0.92 (0.922) |
| Grocery buyer | 30.12 (<0.001) | ||||||
| Main grocery shopper | 1062 (68) | 161 (76) a | 441 (73) a | 145 (63) b | 263 (63) b | 52 (61) b | |
| Share shopping | 373 (24) | 41 (19) a | 129 (21) a | 71 (31) b | 106 (25) b | 26 (30) b | |
| Doesn’t shop | 123 (8) | 11 (5) a | 39 (6) a | 15 (6) a | 50 (12) b | 8 (9) a | |
| Special dietary requirement | |||||||
| High blood pressure | 172 (11) | 35 (16) a | 74 (12) a | 26 (11) a,b | 36 (8) b | 1 (1) c | 18.18 (0.001) |
| High cholesterol | 169 (11) | 19 (14) a | 79 (13) a | 20 (9) a,b | 38 (9) a,b | 3 (3) b | 11.86 (0.018) |
| Diabetes | 107 (7) | 26 (12) a | 42 (7) c | 8 (3) b | 26 (6) b,c | 5 (6) b,c | 14.12 (0.007) |
| Heart disease | 43 (3) | 9 (4) | 19 (3) | 6 (3) | 8 (2) | 1 (1) | 3.97 (0.410) |
© 2019 by the authors. Licensee MDPI, Basel, Switzerland. This article is an open access article distributed under the terms and conditions of the Creative Commons Attribution (CC BY) license (http://creativecommons.org/licenses/by/4.0/).
Share and Cite
Dana, L.M.; Chapman, K.; Talati, Z.; Kelly, B.; Dixon, H.; Miller, C.; Pettigrew, S. Consumers’ Views on the Importance of Specific Front-of-Pack Nutrition Information: A Latent Profile Analysis. Nutrients 2019, 11, 1158. https://doi.org/10.3390/nu11051158
Dana LM, Chapman K, Talati Z, Kelly B, Dixon H, Miller C, Pettigrew S. Consumers’ Views on the Importance of Specific Front-of-Pack Nutrition Information: A Latent Profile Analysis. Nutrients. 2019; 11(5):1158. https://doi.org/10.3390/nu11051158
Chicago/Turabian StyleDana, Liyuwork Mitiku, Kathy Chapman, Zenobia Talati, Bridget Kelly, Helen Dixon, Caroline Miller, and Simone Pettigrew. 2019. "Consumers’ Views on the Importance of Specific Front-of-Pack Nutrition Information: A Latent Profile Analysis" Nutrients 11, no. 5: 1158. https://doi.org/10.3390/nu11051158