Article

Treadmill Exercise before and during Pregnancy Improves Bone Deficits in Pregnant Growth Restricted Rats without the Exacerbated Effects of High Fat Diet

1
Department of Physiology, Anatomy and Microbiology, LaTrobe University, Bundoora, VIC 3083, Australia
2
Department of Physiology, The University of Melbourne, Parkville, VIC 3010, Australia
3
Department of Medicine, The University of Melbourne, Parkville, VIC 3010, Australia
4
Bone and Mineral Medicine, Royal Melbourne Hospital, Parkville, VIC 3050, Australia
*
Author to whom correspondence should be addressed.
Joint senior authors.
Current address: Department of Neuroscience, Central Clinical School, Monash University, Melbourne, VIC 3004, Australia.
Nutrients 2019, 11(6), 1236; https://doi.org/10.3390/nu11061236
Submission received: 29 March 2019 / Revised: 28 May 2019 / Accepted: 29 May 2019 / Published: 30 May 2019
(This article belongs to the Special Issue Nutritional Status and Bone Health)

Abstract

:
Growth restriction programs adult bone deficits and increases the risk of obesity, which may be exacerbated during pregnancy. We aimed to determine if high-fat feeding could exacerbate the bone deficits in pregnant growth restricted dams, and whether treadmill exercise would attenuate these deficits. Uteroplacental insufficiency was induced on embryonic day 18 (E18) in Wistar Kyoto (WKY) rats using bilateral uterine vessel ligation (restricted) or sham (control) surgery. The F1 females consumed a standard or high-fat (HFD) diet from 5 weeks, commenced treadmill exercise at 16 weeks, and they were mated at 20 weeks. Femora and plasma from the pregnant dams were collected at post-mortem (E20) for peripheral quantitative computed tomography (pQCT), mechanical testing, histomorphometry, and plasma analysis. Sedentary restricted females had bone deficits compared to the controls, irrespective of diet, where such deficits were prevented with exercise. Osteocalcin increased in the sedentary restricted females compared to the control females. In the sedentary HFD females, osteocalcin was reduced and CTX-1 was increased, with increased peak force and bending stress compared to the chow females. Exercise that was initiated before and continued during pregnancy prevented bone deficits in the dams born growth restricted, whereas a HFD consumption had minimal bone effects. These findings further highlight the beneficial effects of exercise for individuals at risk of bone deficits.

1. Introduction

Pregnancy is associated with changes in the maternal skeleton to meet the needs of the developing fetal skeleton [1,2]. Dysregulation of these normal physiological adaptations to pregnancy occur in maternal undernutrition [3,4] and uteroplacental insufficiency [5,6,7,8,9,10]. Maternal undernutrition and uteroplacental insufficiency both lead to the development of a low birth weight baby, weighing less than 2.5 kg at term [11,12,13], with uteroplacental insufficiency affecting ~10% of pregnancies in the developed world [14]. Low birth weight individuals are at an increased risk of poor bone health (reduced bone mineral content (BMC) and density (BMD)), as well as obesity in adulthood, which is observed in both human [15,16] and animal models [8,9,17].
Our rat model of uteroplacental insufficiency, induced by bilateral uterine vessel ligation late in gestation to reduce fetal oxygen and nutrient transfer, mimics the 10–15% reduction in birth weight observed in humans [14,18,19], and it programs poor bone health in F0 dams and their F1 offspring. Specifically, rat dams (initial generation, F0) whose pregnancies were complicated by uteroplacental insufficiency did not lose bone during late gestation, which was required for mineralization of the fetal skeleton [7]. Consequently, the F1 male and female growth restricted offspring had reduced total body calcium on postnatal day 6 [20], and at 6 months of age, they have shorter femora with reduced trabecular and cortical content, as well as bending strength [6,8,9]. Interestingly, we have reported that F1 growth restricted females have normal skeletal adaptations during late gestation, with their F2 offspring having normal bone health [18]. This highlights that the programmed bone effects of growth restriction only influence the F1 generation.
Studies in both humans and animals have reported clear links between a low birth weight and increased obesity risk [16,17]. Obesity has been reported to have beneficial effects on bone health in humans [21,22,23] and animals [24,25]. However, these findings are controversial with other studies reporting impaired bone health in obese humans [26,27,28], and in high-fat fed animal models [29,30,31]. On the other hand, some experimental models report no changes in bone health following high-fat feeding [32]. These discrepancies, especially in animal models, were likely due to differences in diet composition (fat and carbohydrate content), the timing and duration of dietary intervention, sex, and animal strain. Currently, the relationship between obesity and bone health in F1 growth restricted females, especially during pregnancy, remains to be elucidated.
Although several studies use weight-bearing exercise, since it promotes bone formation [33,34], treadmill exercise is an effective intervention to improve bone outcomes [35,36]. Specifically, treadmill exercise in female rats increases the cortical BMD and bone mass in the periosteal envelope of the tibia [35], and it increases femoral length and tibial BMC [37]. More recently, moderate treadmill exercise was reported to have anabolic effects on bone in healthy male rats by increasing the trabecular bone mass and reducing trabecular separation; suggesting that exercise favors bone formation [38]. However, exercise effects on bone in F1 pregnant growth restricted females has not been investigated. Therefore, it is possible that exercise initiated prior to and maintained throughout pregnancy could be an effective intervention to offset the negative effects of growth restriction on bone in F1 growth restricted females.
Therefore, this study aimed to determine whether high-fat feeding exacerbated the programmed bone deficits in growth restricted rat dams. We also aimed to characterize whether treadmill exercise initiated before and continued throughout pregnancy would prevent the bone deficits in growth restricted females during late pregnancy.

2. Materials and Methods

2.1. Animals

The University of Melbourne Animal Ethics Committee, (AEC number 1212639) approved all the animal experimental procedures. Female F0 Wistar-Kyoto rats (initial generation, F0) were purchased from the Biological Research Facility (The University of Melbourne) at 8 weeks of age, and they were cohoused (6 rats/box) in a temperature-controlled room (22 °C), with a 12 h light-dark cycle and access to standard rat chow and tap water ad libitum. At 16 weeks of age, the F0 females were mated with breeder males. On gestation day 18 (E18), the dams were allocated to either uteroplacental insufficiency (bilateral uterine vessel ligation; offspring termed: restricted) or sham (offspring termed: control) surgery, as previously described in Reference [19]. The dams delivered pups (F1, first generation) at term on E22. At 5 weeks of age, the F1 control and restricted sibling females (maximum 2 siblings/litter/diet) were randomly allocated to a chow diet (AIN93G containing 7% fat) or HFD (SF01-028 containing 23% fat, and SF03-020 containing 23% fat and 0.19% cholesterol) obtained from Specialty Feeds, Australia. The females consumed these allocated diets for the remainder of the experiment.

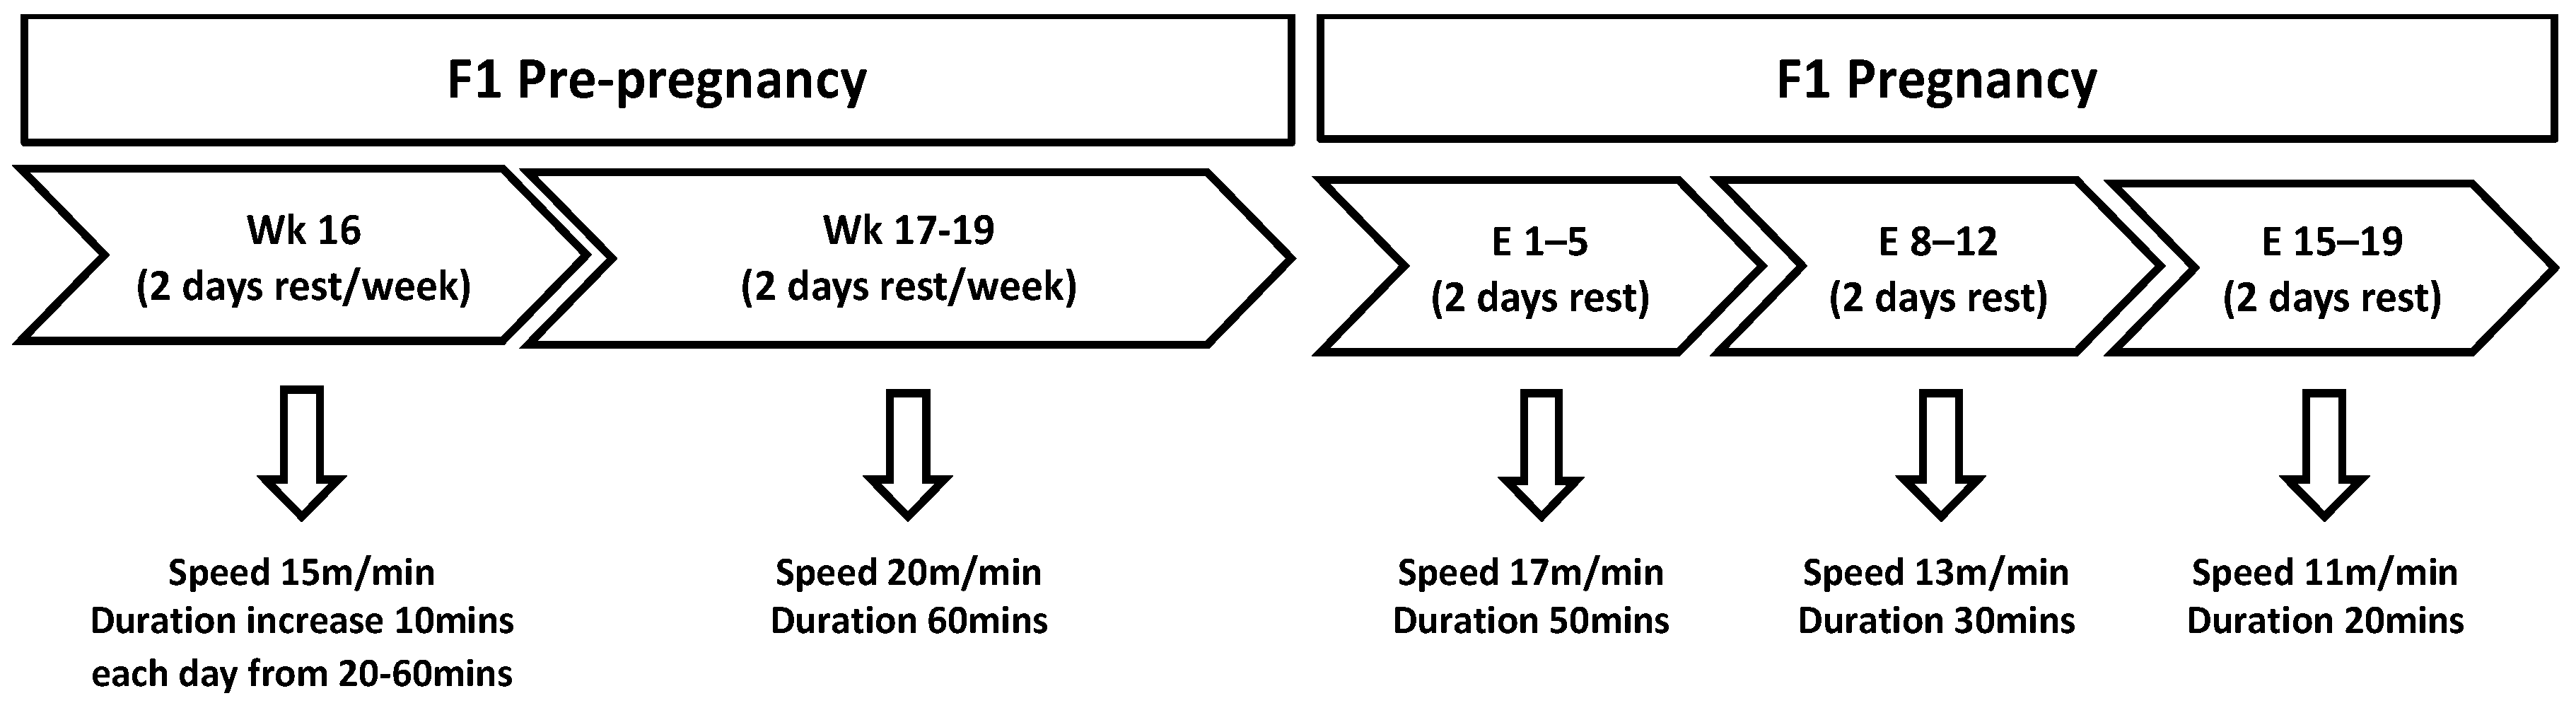
2.2. Exercise Protocol

At 16 weeks of age, the F1 control and restricted sibling females were randomly allocated to either remain sedentary or to commence treadmill exercises (exercise). This allocation gave rise to 8 experimental groups, each with 1 female sibling/group: control-chow-sedentary (n = 10), restricted-chow-sedentary (n = 12), control-HFD-sedentary (n = 10), restricted-HFD-sedentary (n = 10), control-chow-exercise (n = 8), restricted-chow-exercise (n = 9), control-HFD-exercise (n = 8), and restricted-HFD-exercise (n = 8). The treadmill exercise was performed as previously described in Reference [39]. Briefly, the females allocated to the exercise group ran for 5 days/week with 2 days of rest for 4 weeks on a motorized treadmill (Columbus Instruments, Columbus, OH, USA) at a 0° incline prior to pregnancy [39]. On day 1 of the exercise protocol, the F1 females ran for 20 min at a speed of 15 m/min, and on each subsequent day, the exercise duration was increased by 10 min such that on day 5 of the protocol, the rats were exercised for 60 min [39] (Figure 1). From week 2 of the protocol, the rats ran for 60 min at 20 m/min (Figure 1). Once pregnant, the exercise duration and intensity were decreased with each week of pregnancy [40]: In week 1, the rats ran for 50 min at 17 m/min; in week 2 rats, the rats ran for 30 min at 13 m/min; and in week 3, the rats ran for 20 min at 11 m/min (Figure 1).

2.3. Post-Mortem Blood and Tissue Collection

On E20, all the F1 dams were euthanized with an intraperitoneal injection of Ketamine (100 mg/kg body weight) and Ilium Xylazil-20 (30 mg/kg body weight). Major organs, tissues, and muscles were excised and weighed. The left and right femora were dissected and measured using digital calipers, and then stored at 4 °C in silicon oil and 0.1 M sodium cacodylate buffer, respectively. Blood was collected via cardiac puncture, followed by treatment with heparin, and then centrifuged for 15 min at 3000 rpm. Plasma was collected for bone marker, adiponectin, and leptin assays, and then stored at −20 °C.

2.4. Peripheral Quantitative Computed Tomography (pQCT)

Bone scans were performed on the right femora collected at E20 from all the F1 dams using pQCT (Stratec XCT-Research SA+. Stratec Research Pty. Ltd., Pforzheim, Germany), along with the accompanying software, as previously described in References [18,41]. Briefly, each femur was individually placed into a plastic tube (7.5 cm × 1.2 cm) for accurate alignment within the specimen holder of the pQCT. Prior to scanning, a low-resolution scout scan was performed and a reference line was placed at the upper border of the distal condyle of the femur. A 1 mm slice (voxel size 0.1000 mm3, peel mode 20, contour mode 1) was taken at distances from the reference line of 5% to quantify trabecular bone, and at 50% to quantify cortical bone. Automatic density thresholding (400 mg/cm3) was used to eliminate the effect of any soft tissue remaining on the femur after dissection. Tissue density of 280 mg/cm3 or less was classified as trabecular bone, and tissue density of 710 mg/cm3 or greater was classified as cortical bone.

2.5. Histological Processing, Staining, and Histomorphometry

Prior to histological processing, the scanned right femora of the F1 dams were fixed in 4% paraformaldehyde and 0.1 M sodium cacodylate fixative for 48 h, followed by 3 washes for 30 min, and then stored in a solution containing 0.1 M sodium cacodylate and 10% sucrose [42]. The femora were processed to plastic, then sectioned and stained. Briefly, the right femora were dehydrated using graded concentrations of ethanol (70%, 90%, and 100%), and the samples were infiltrated and embedded in LR White resin (London Resin Company limited, Reading, England) and polymerized in LR White resin at 60 °C for 24 h. Longitudinal plastic sections were cut at 5 µm, at the midpoint of the undecalcified femora using a tungsten carbide blade on a Leica RM 2155 Rotary Microtome (Leica, Wetzlar, Germany). Sections were stained with Light Green and then counter-stained with Safranin O to examine bone and cartilage content [42]. Stained sections were photographed at 25× magnification using Leica IM50 imaging software (Heerbrugg, Switzerland), and then viewed using a Leica DFC420 Light Microscope (Heerbrugg, Switzerland). The following parameters were measured: growth plate thickness (µm), trabecular bone area (percentage), and calcified cartilage (percentage), using the Leica Qwin V3 Standard software (Heerbrugg, Switzerland).

2.6. Mechanical Testing

Testing was performed as described previously in References [42,43]. Briefly, the left femora of the F1 dams were individually placed onto the three-point bending apparatus in a mediolateral position. The stabilizing platform consisted of a 16 mm gap. The fulcrum was kept at a constant rate of 100 mm/min, and peak stress was applied to the center of the femur in a mediolateral direction. The force measured (g) and deflection (mm) were recorded from the force transducer. These values were converted to Newton’s (N), and the displacement to meters (m).

2.7. Plasma Analysis

Rat-specific standard enzyme-linked immune-sorbent assays (ELISAs) were used to determine the plasma concentrations of osteocalcin (both uncarboxylated and carboxylated forms) (Rat-MID Osteocalcin ELISA, Immuno-Diagnostics Systems), C-terminal telopeptides of type 1 collagen (CTX-1 RatLaps ELISA, Immuno-Diagnostics Systems), leptin (Signosis Inc., Santa Carla, CA, USA), and adiponectin (R&D Systems, Minneapolis, MN, USA) in the F1 dams at E20. The intra-assay and inter-assay coefficients of osteocalcin were 4% and 6.7%, respectively, with a detection limit of 50.0 ng/mL. The intra-assay and inter-assay coefficients of CTX-1 were 6.8% and 12%, respectively, with a detection limit of 2.0 ng/mL. Plasma leptin intra-assay and inter-assay coefficients were 1.4–4.6% and 8.5–9.4%, respectively. Adiponectin intra-assay and inter-assay coefficients were 0.4–1.6% and 6.5–7.8%, respectively.

2.8. Statistical Analyses

Data are presented as mean ± standard error of mean (SEM), with n denoting the number of animals per group. A normality test was first performed on all the data sets to identify if they were normally distributed. Maternal F1 data were first analyzed using a two-way ANOVA (SPSS-X; SPSS, Armonk, NY, USA) to determine the main treatment (control and restricted) and diet (chow and HFD) effects within each exercise regime. If interactions were observed, the data was split to identify the treatment effects within each diet, and the diet effects within each treatment, using the Student’s unpaired t-tests. The data was then split by treatment and an additional two-way ANOVA was performed to report the main exercise (sedentary and exercise) and diet (chow and HFD) effects within each treatment. If an interaction was observed, the data was split to identify the exercise effects within each diet and the diet effects within each exercise using the Student’s unpaired t-tests. Statistical significance was set at p < 0.05.

3. Results

3.1. Body Weight

Unsurprisingly, the F1 restricted females were lighter at birth than the control females (p = 0.0001, −16%, Table 1). Restricted females remained lighter than the controls at postnatal days 7 (PN7), 14, and 35 (p = 0.0001, −10–19%, Table 1). Regardless of diet and exercise, the restricted females remained lighter at 15 and 19 weeks of age, at the time of mating (20 weeks), and at post-mortem (Table 2). Sedentary restricted females also gained less weight during pregnancy than the controls (Table 2), irrespective of diet. Sedentary females consuming a HFD, regardless of birth weight, were heavier than the chow-fed females at 19 weeks (Table 2) and at post-mortem (Table 2). Meanwhile, in the exercise cohort, the HFD fed females were heavier at 15 weeks, 19 weeks, mating, throughout pregnancy (Table 2), and post-mortem (p < 0.05, Table 2).

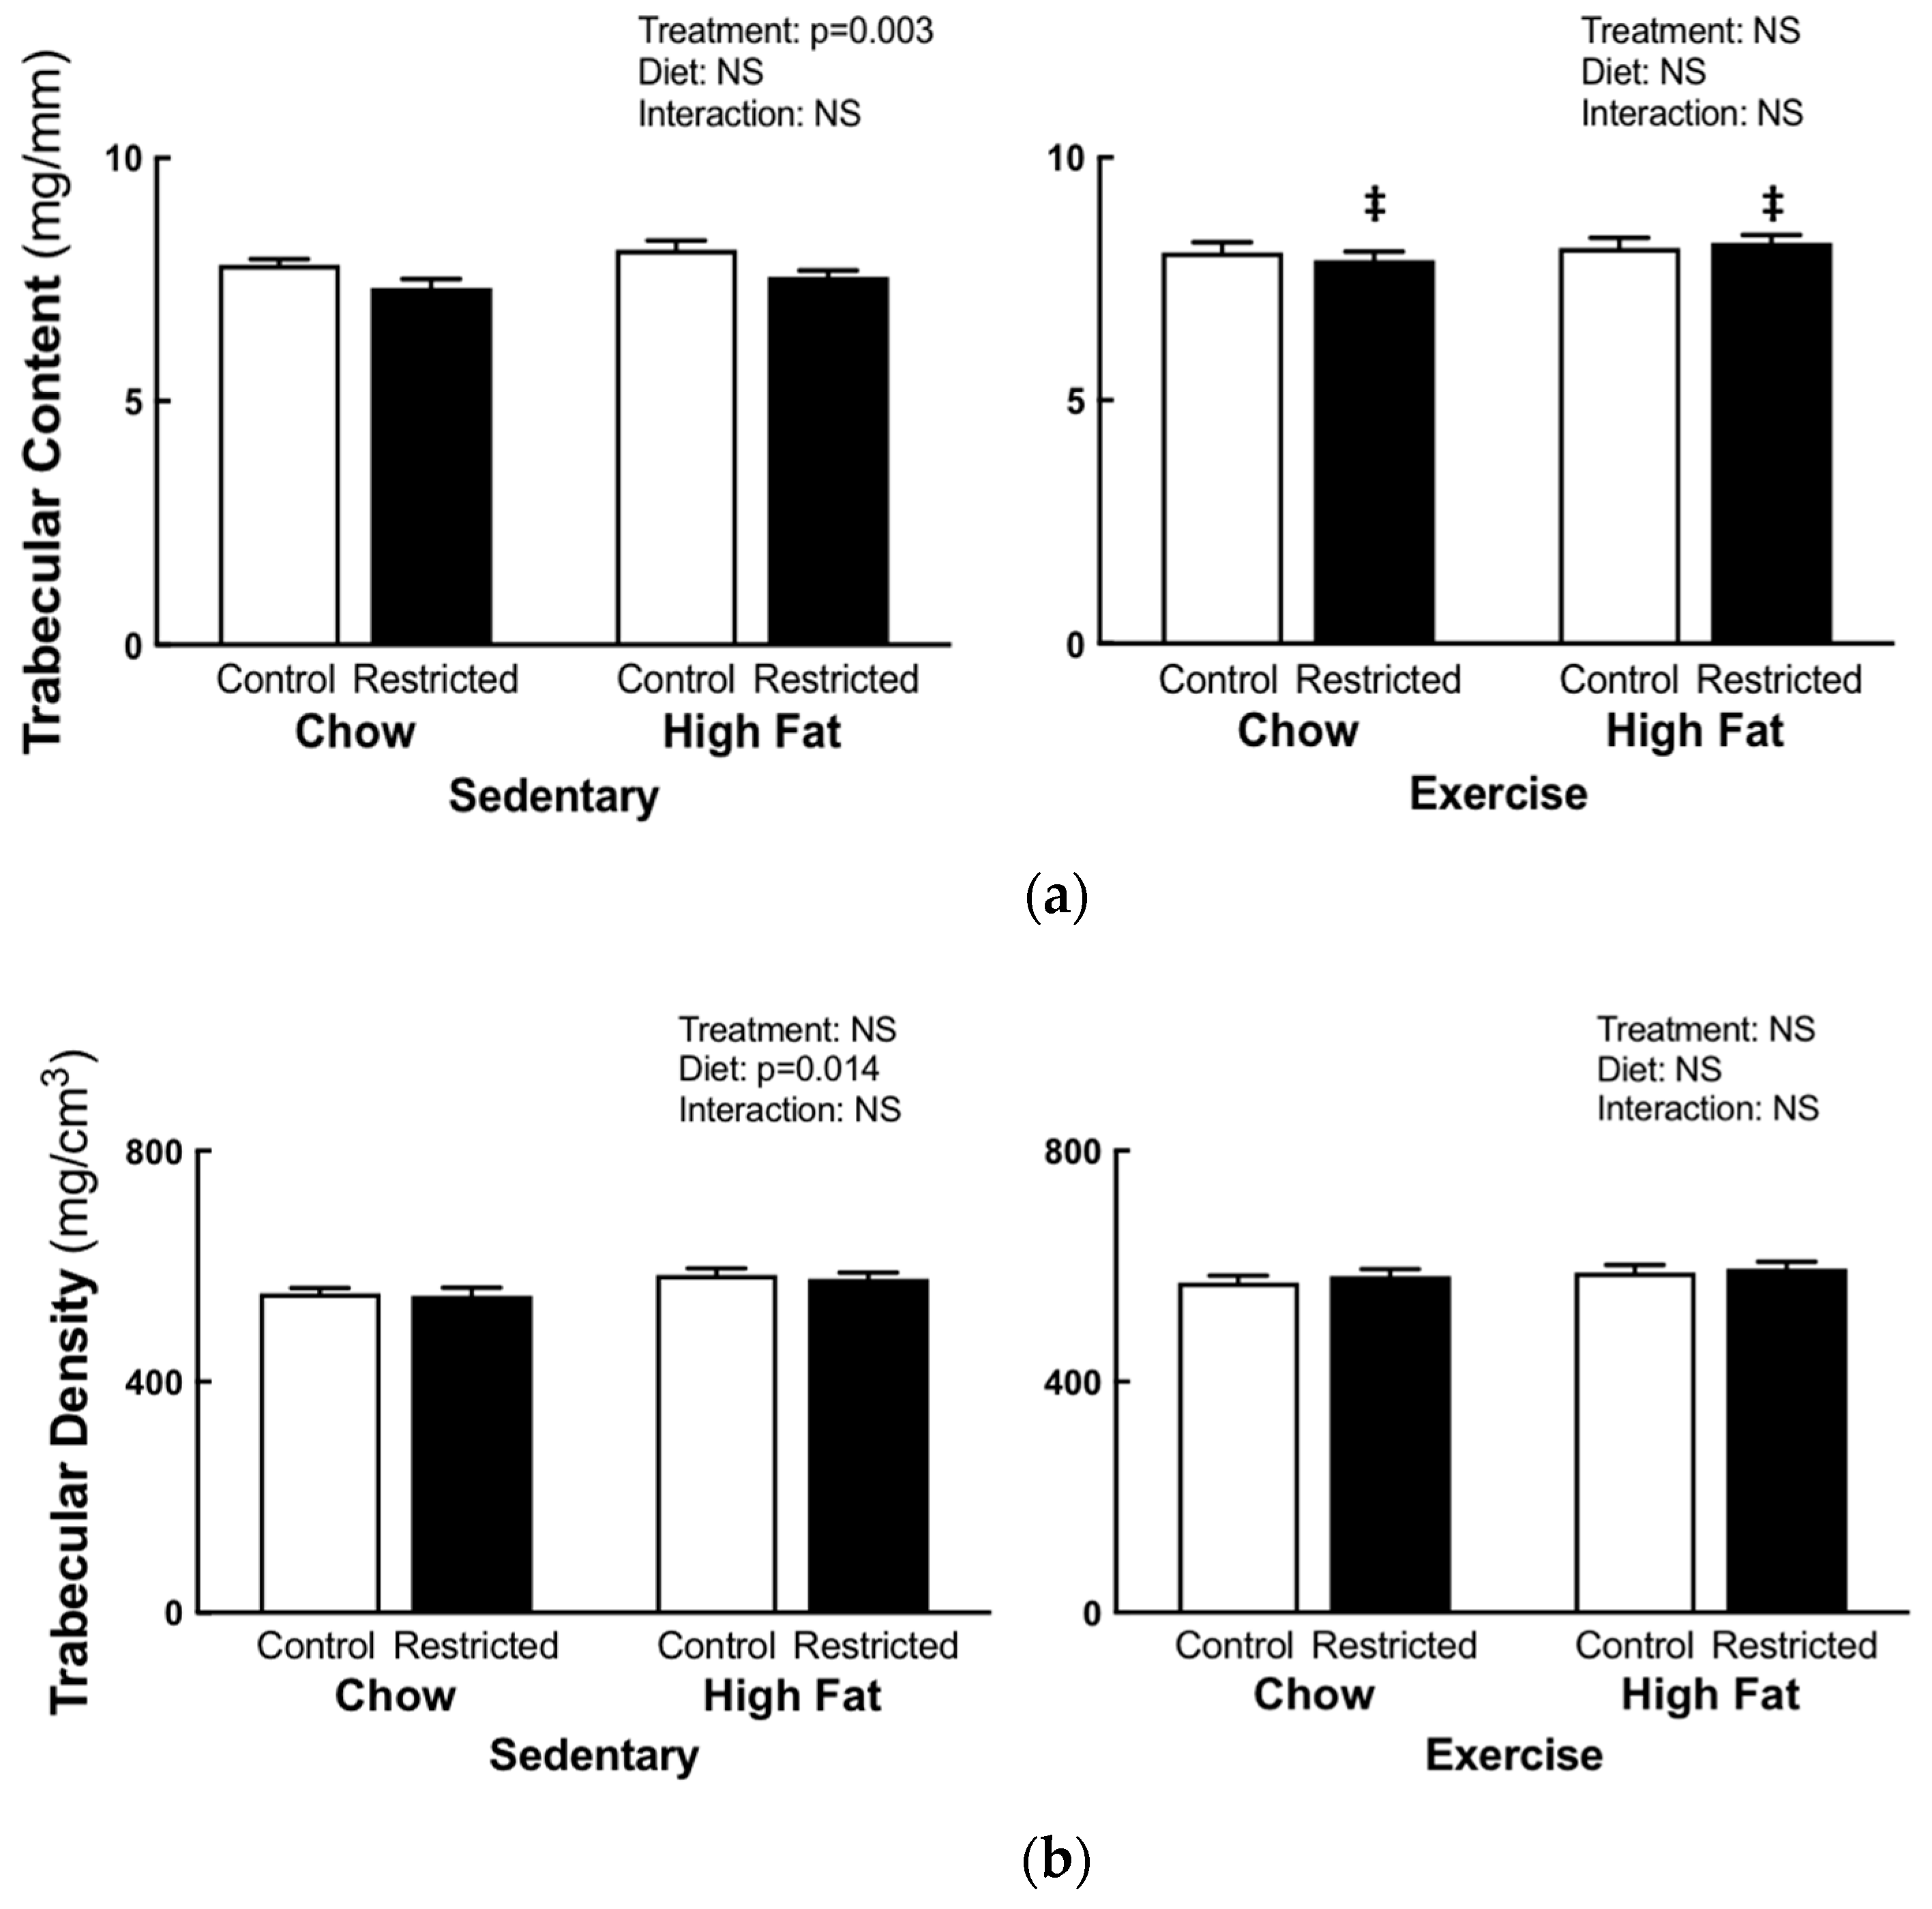
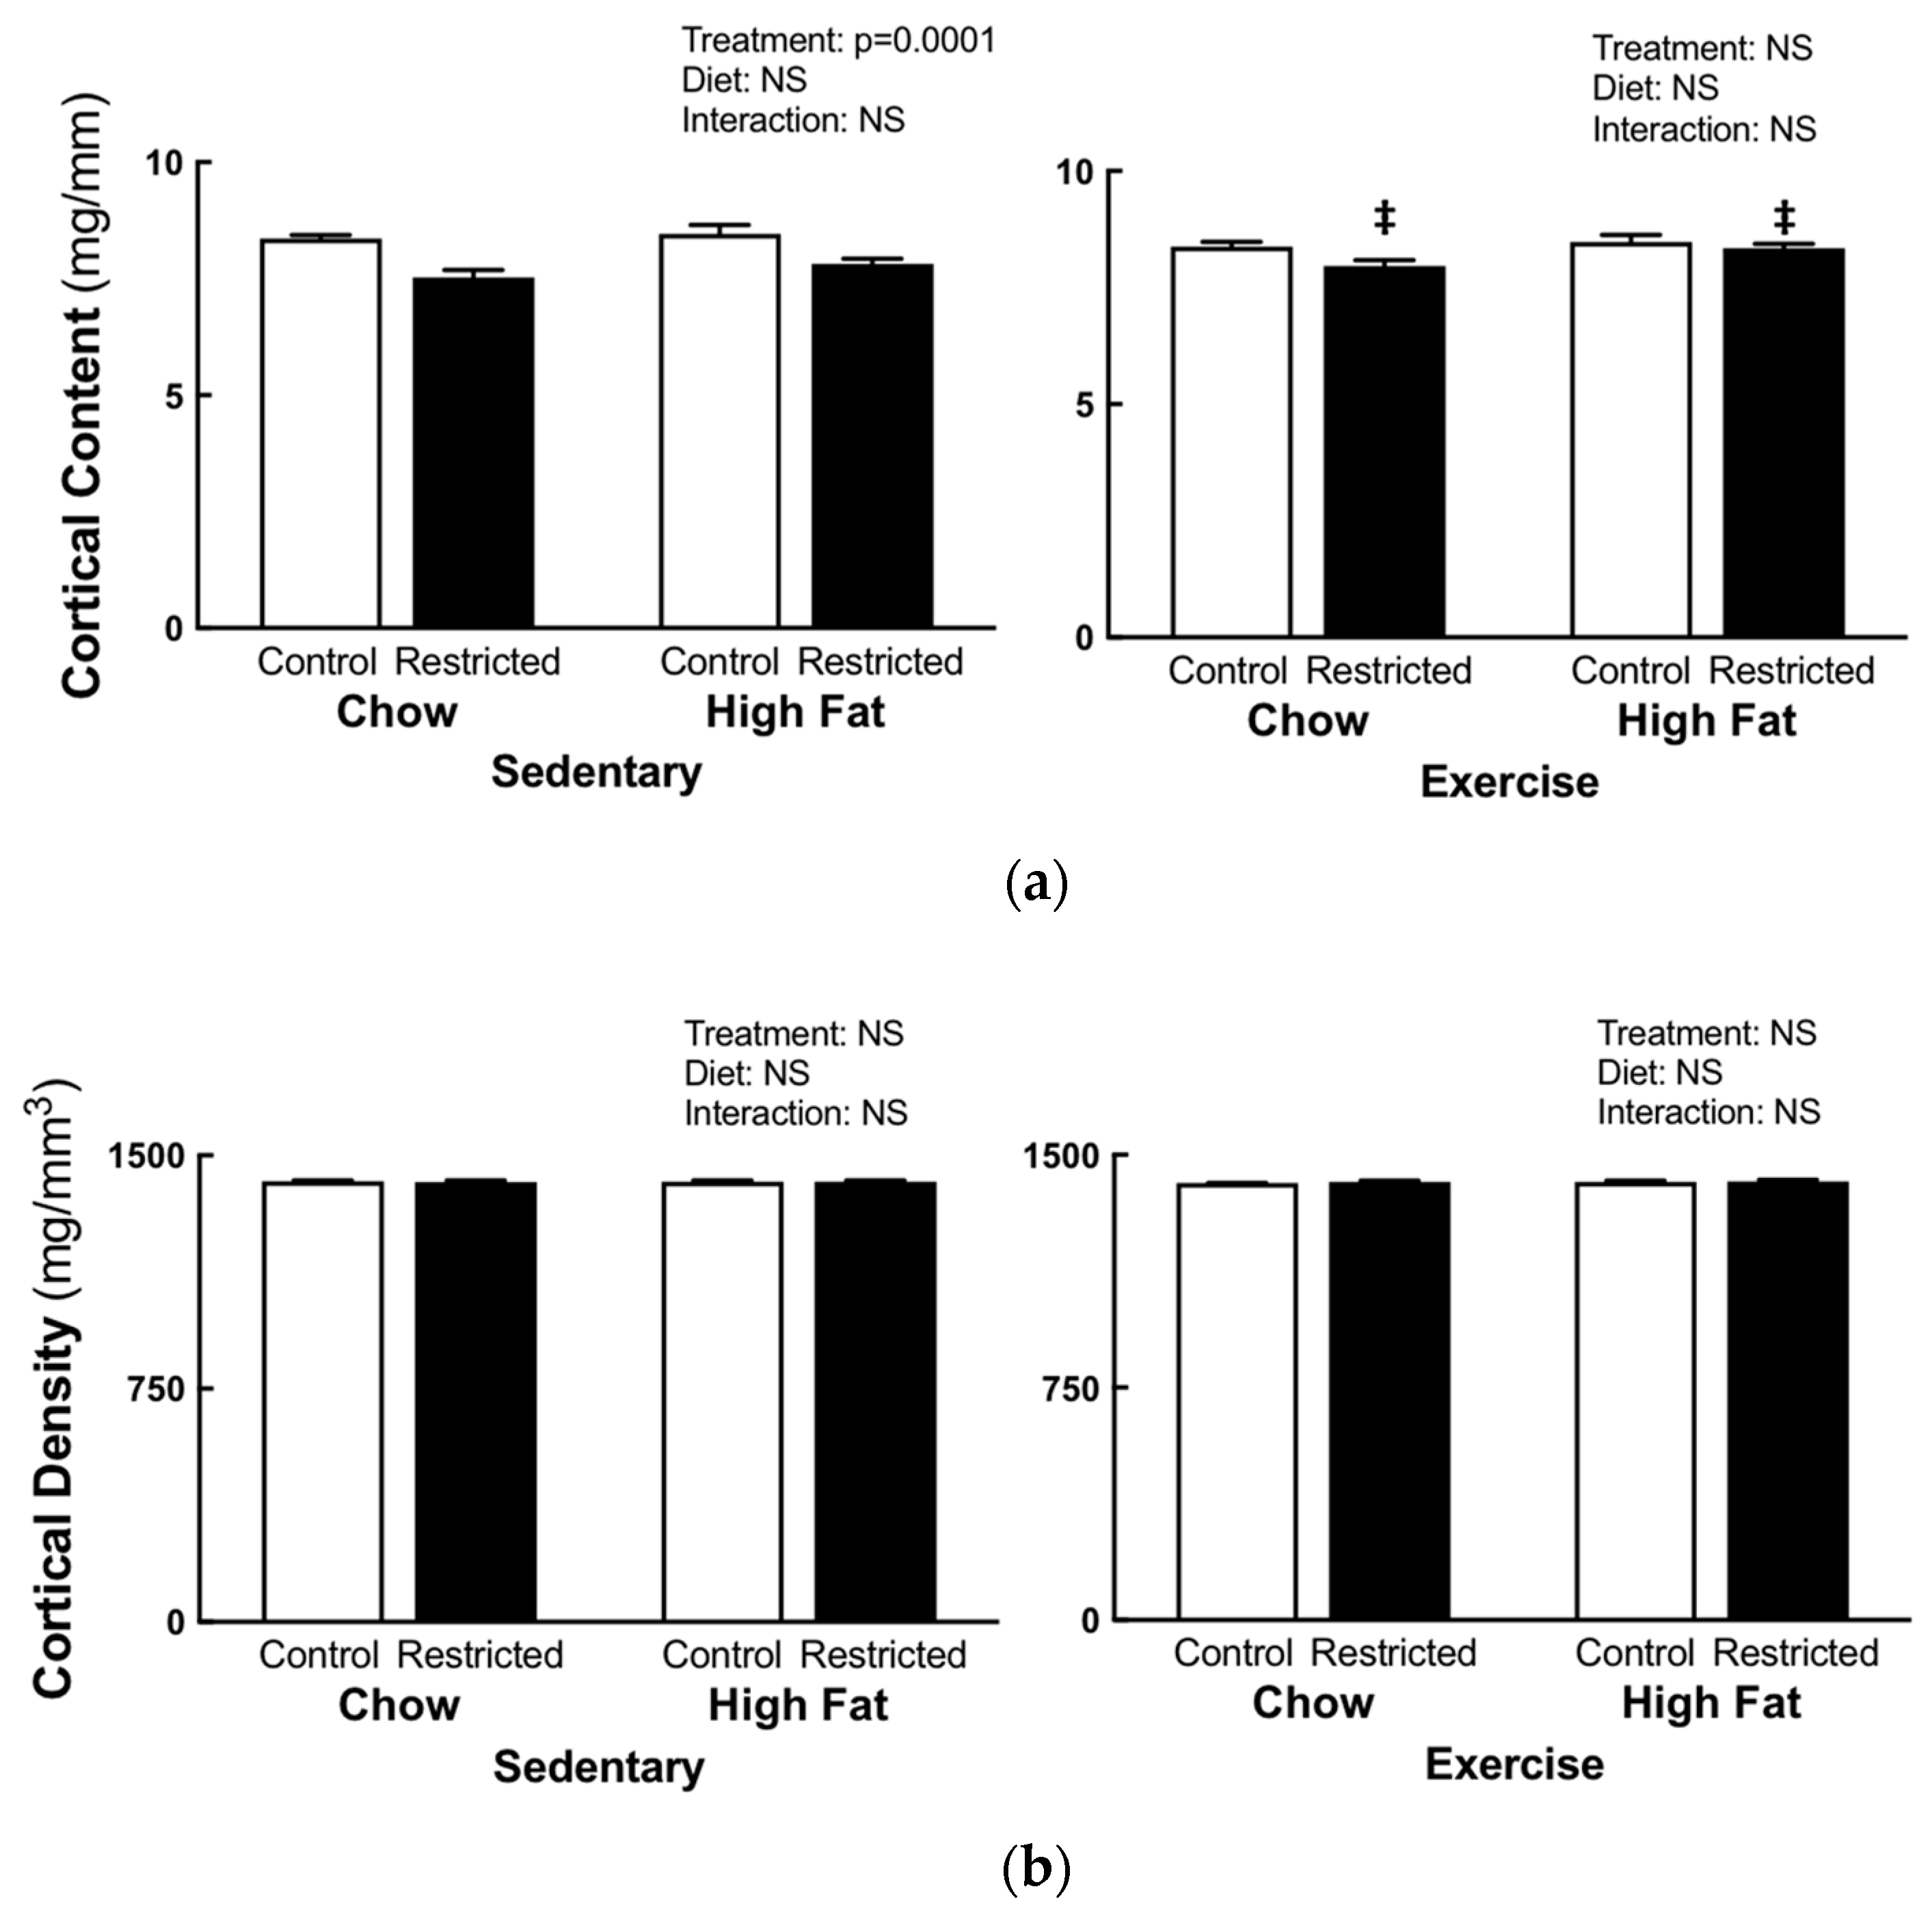
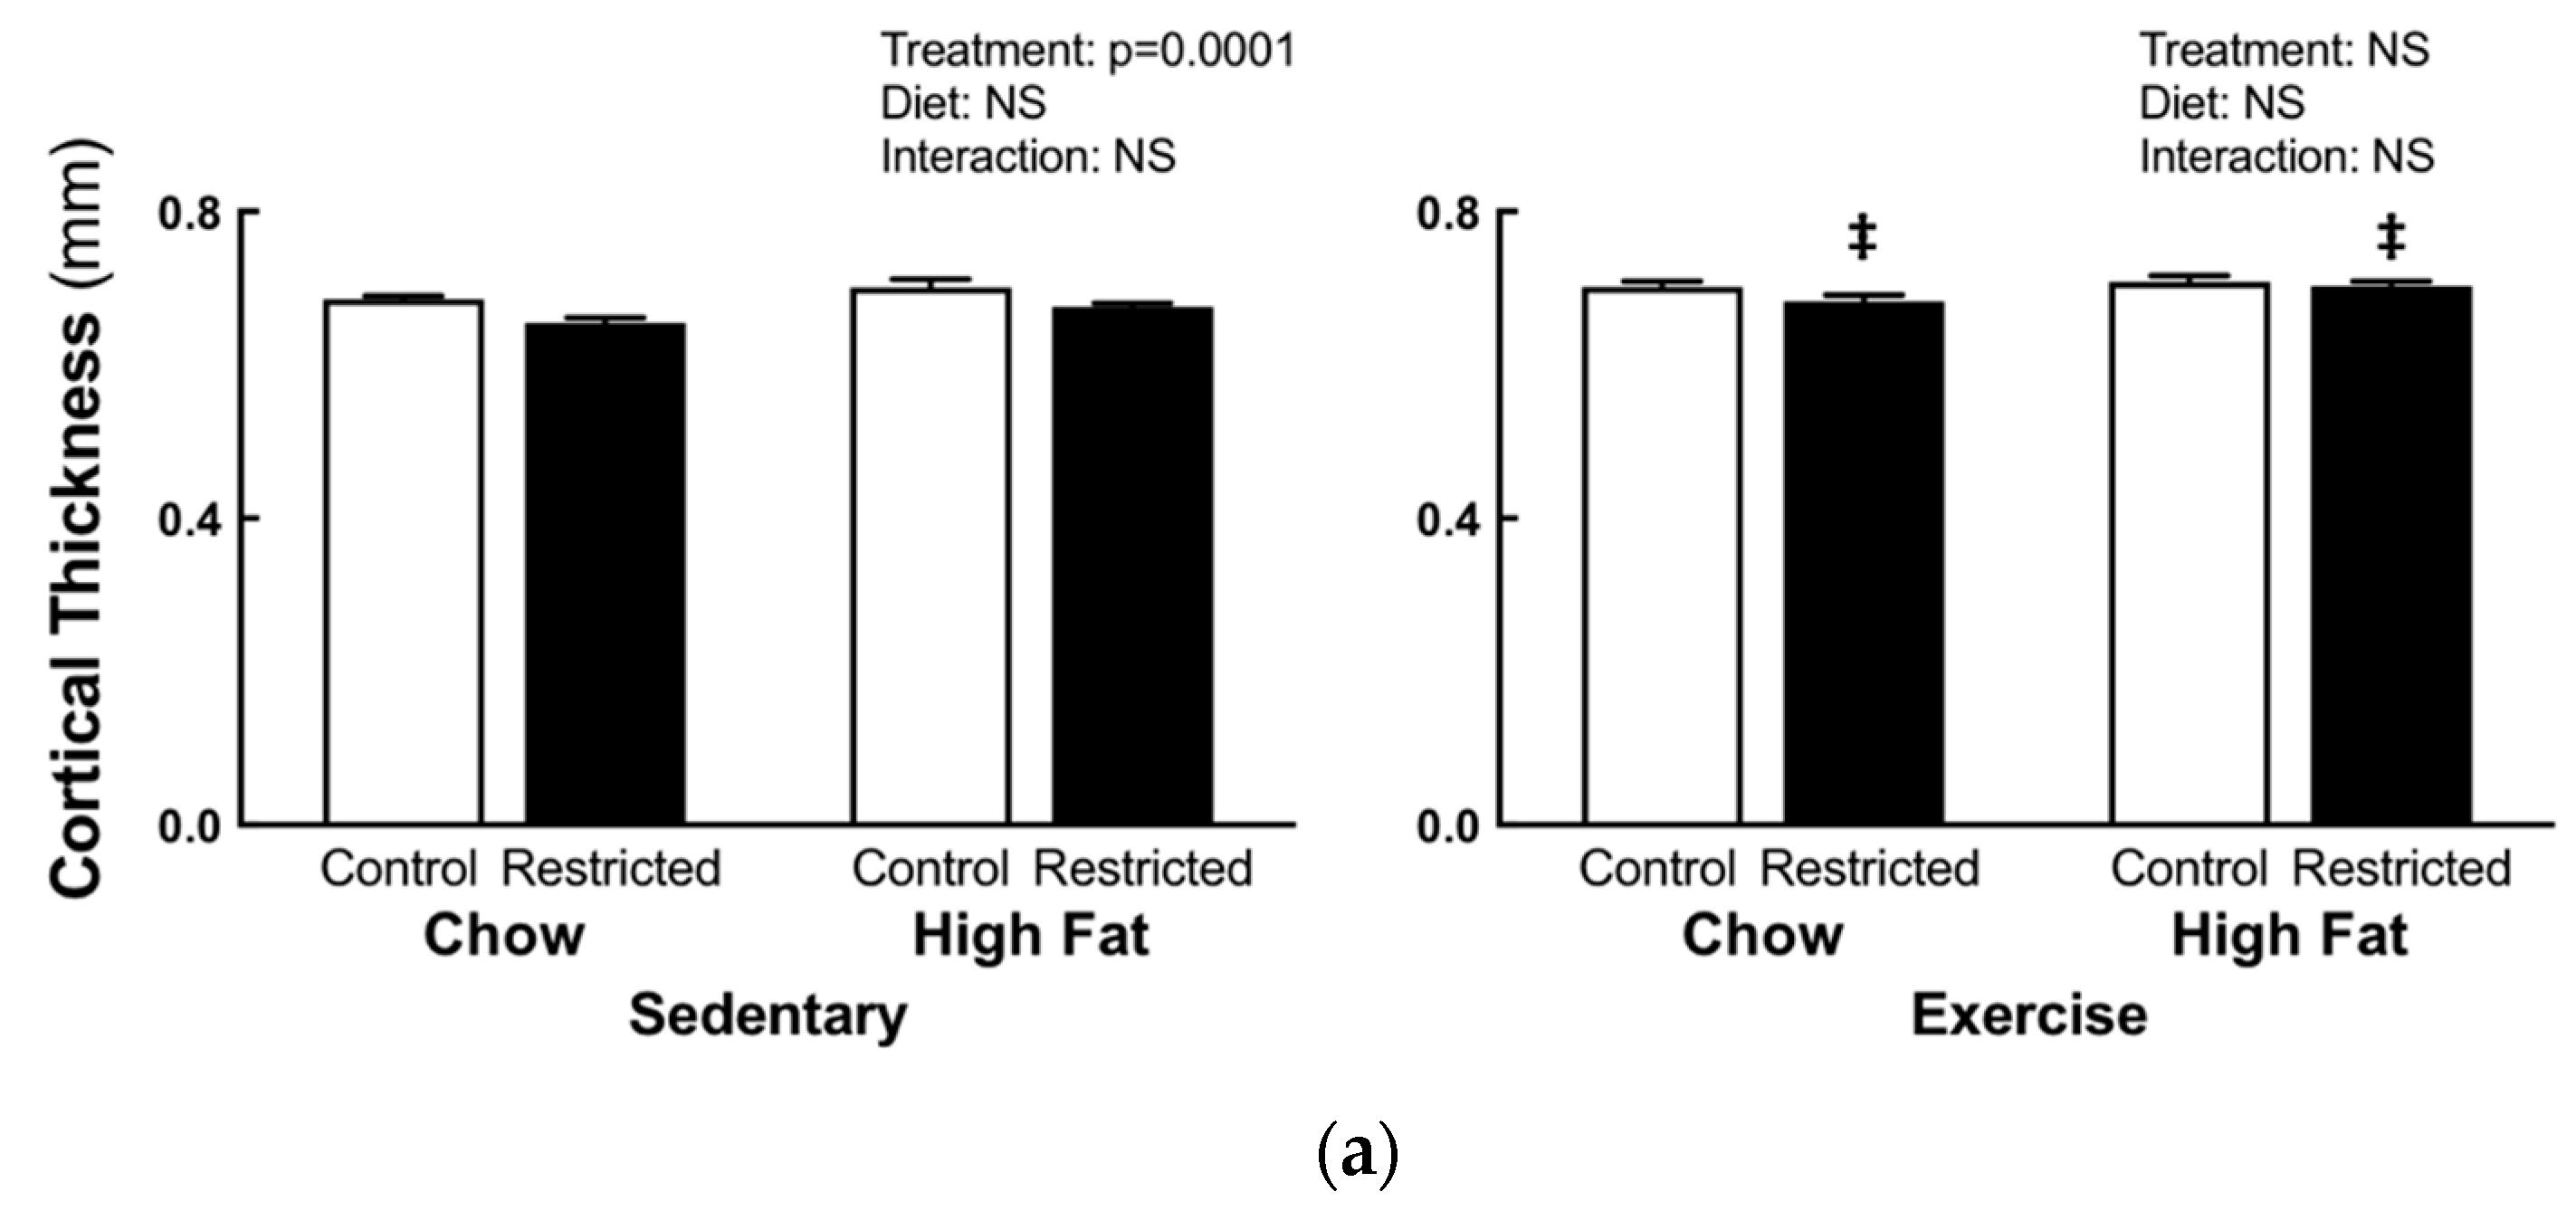
3.2. Peripheral Quantitative Computed Tomography

Sedentary restricted females, compared to the control, had decreased trabecular (−6.4%, Figure 2a) and cortical (−9%, Figure 3a) content, cortical thickness (−4%, Figure 4a), periosteal (−5%, Figure 4b), and endosteal (−5%, Figure 4c) circumference, and bending strength (−13%, Figure 4d), irrespective of diet. Sedentary HFD females had increased trabecular density compared to the sedentary chow females (+5.5%, Figure 2b); with no differences in cortical density (Figure 3b). Two-way ANOVA comparisons of the pQCT measures were not significantly different in the exercise groups. When comparing the restricted sedentary and exercise females, treadmill exercise increased the trabecular (p = 0.001, +8.4%, Figure 2a) and cortical (p = 0.0001, +6.3%, Figure 3a) content, cortical thickness (p = 0.0001, +4.2%, Figure 4b), periosteal circumference (p = 0.028, +2.5% Figure 4b) and, importantly, the bending strength (p = 0.001, +11.11%, Figure 4d).

3.3. Histomorphometric Analysis and Mechanical Testing

Data obtained from the histomorphometric analysis did not display differences in bone area, calcified cartilage, or growth plate size (Table 3). The three-point bending test yielded an increase in the peak force (p = 0.003, +15%) and bending stress (p = 0.003, +17%) in the HFD Sedentary females (Table 4), compared to the chow sedentary females, irrespective of their birth weight. There were no differences in the exercise cohort.

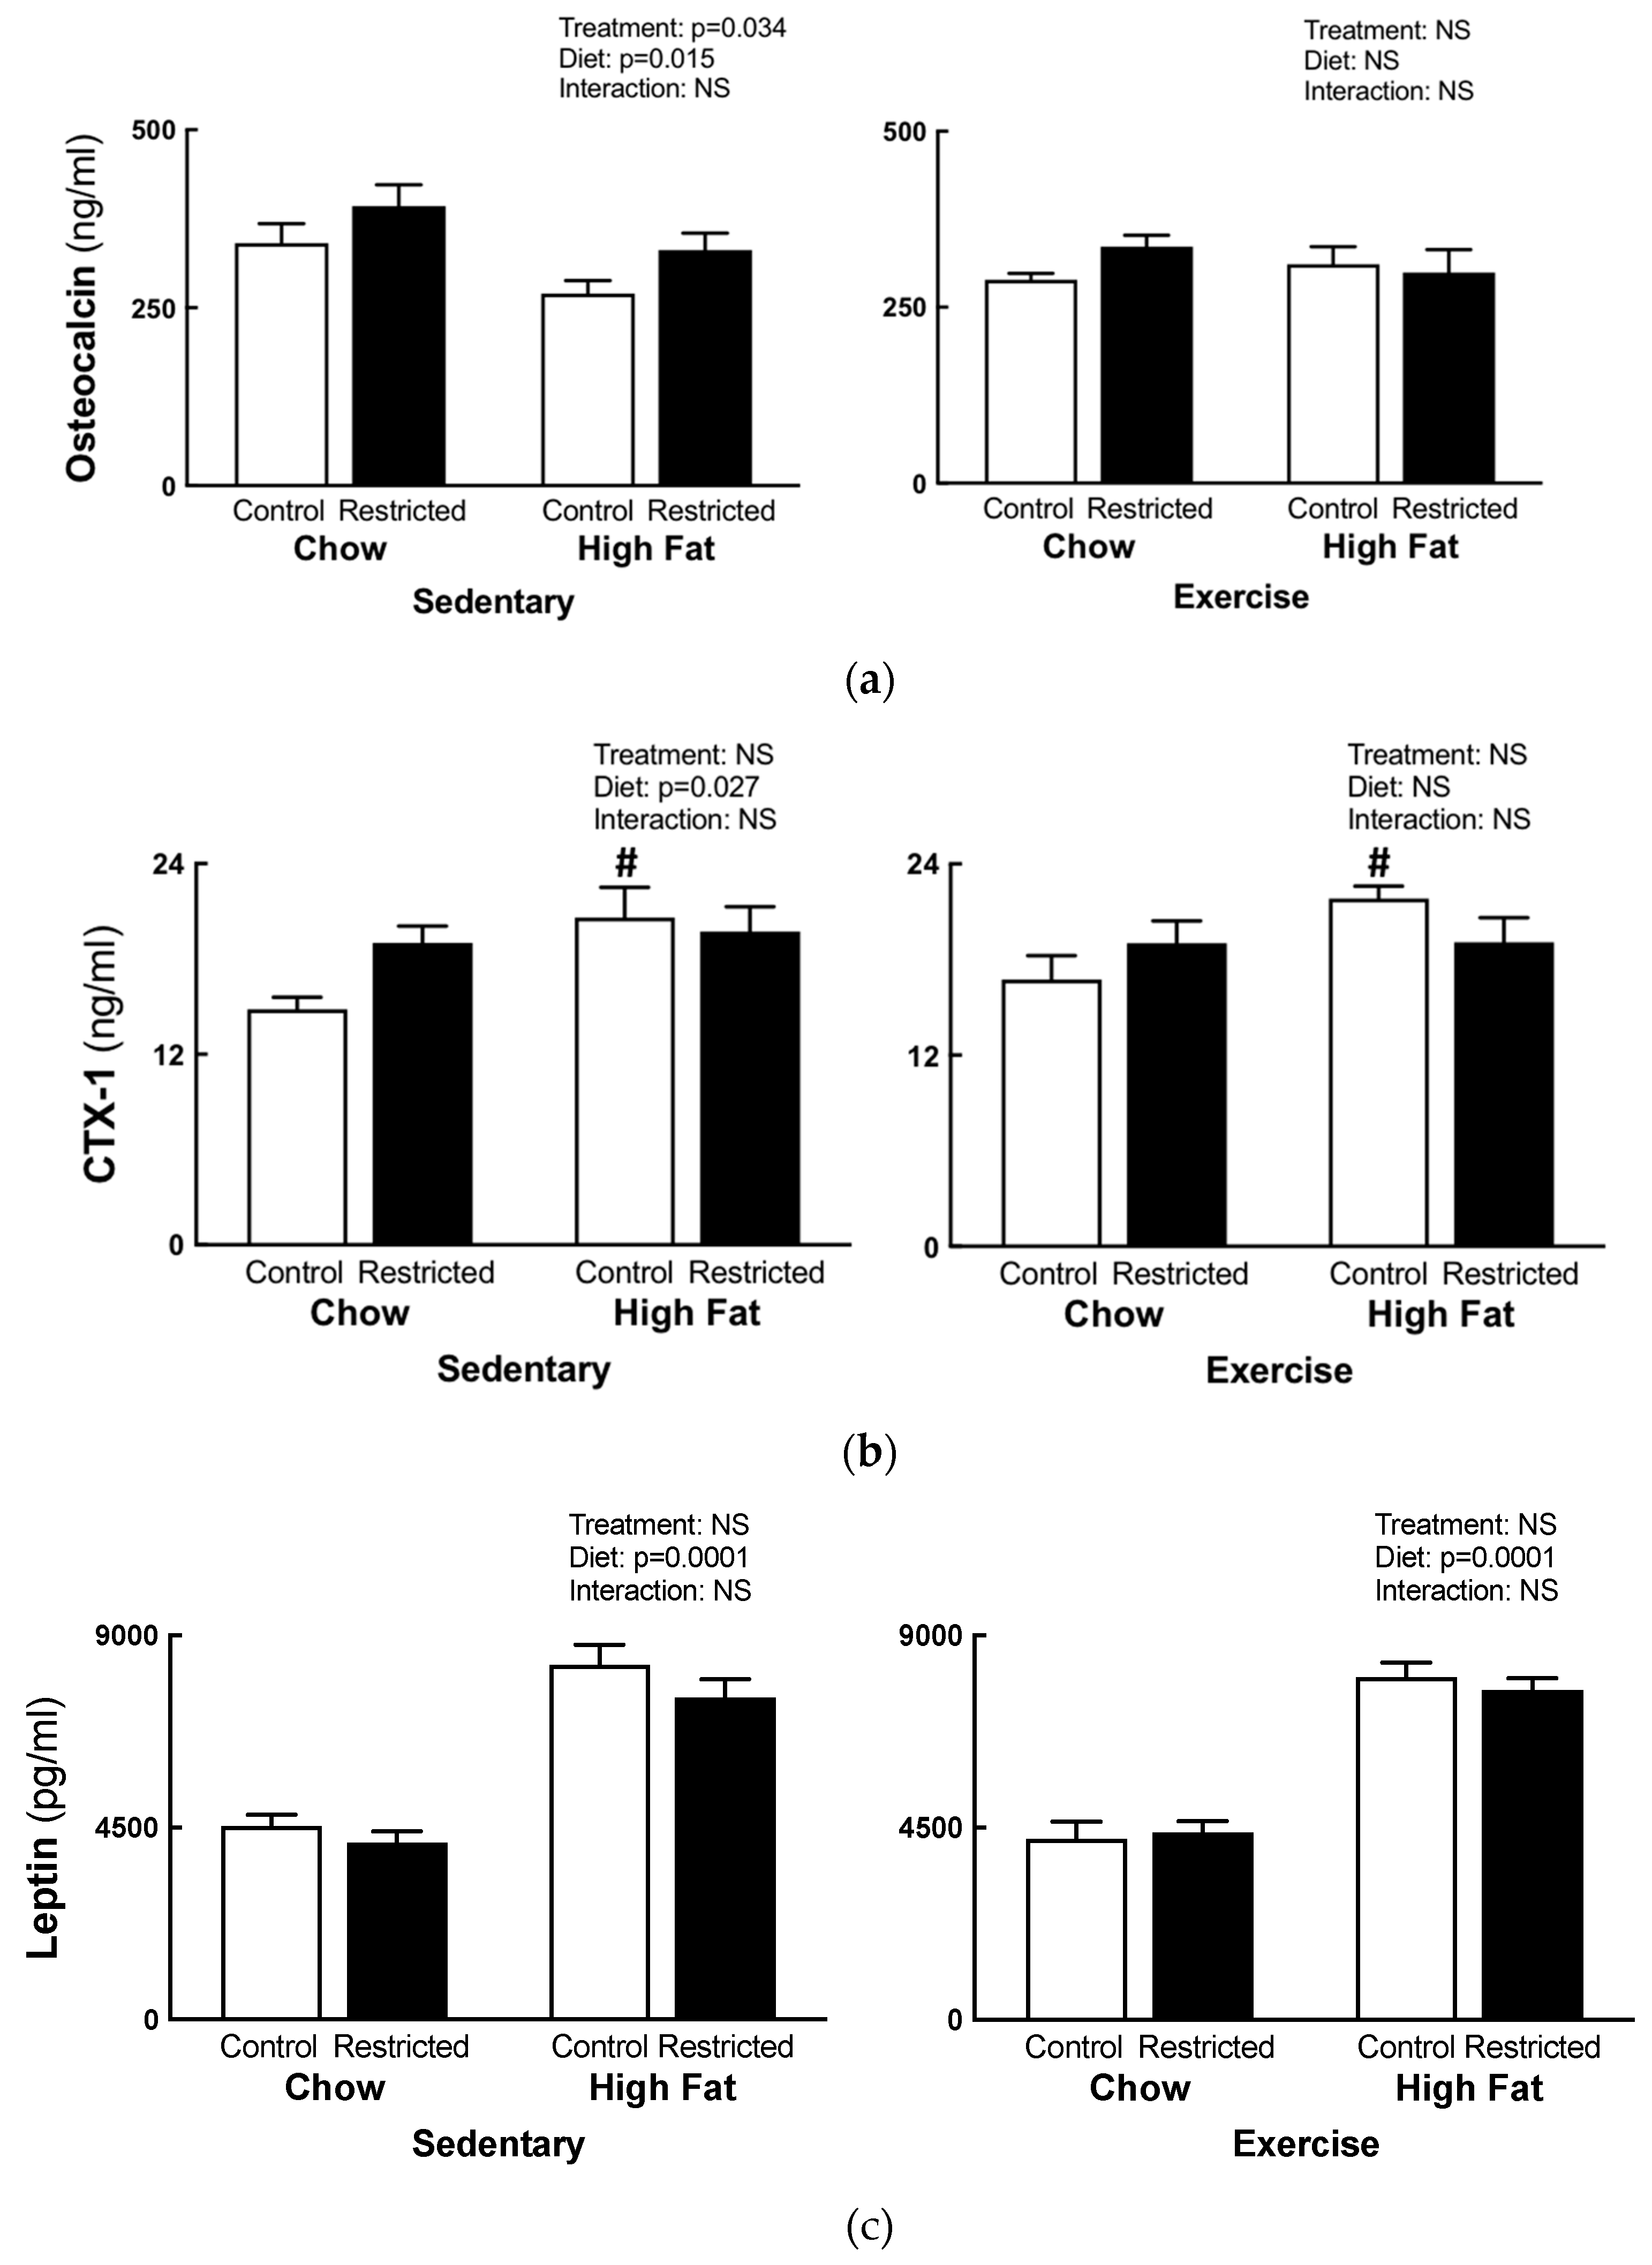
3.4. Plasma Analysis

Osteocalcin concentrations were increased in the sedentary restricted females (+18%, Figure 5a), irrespective of their diet. Sedentary HFD females had decreased osteocalcin concentrations (−18%, Figure 5a), irrespective of the maternal birth weight, with no differences observed in the exercise cohort. CTX-1 concentrations were increased in the sedentary HFD females compared to the chow females, irrespective of birth weight (+19%, Figure 5b), but they were not different in the exercise cohort. When the data was split by treatment, the control HFD females showed increased CTX-1 concentrations (p = 0.0001, +19%, Figure 5b) compared to the chow-fed controls. There were no differences in the plasma adiponectin concentrations (data not shown). The plasma leptin concentrations were increased in the sedentary HFD (p = 0.0001, +83%) and exercise HFD females (p = 0.0001, +83%) compared to their chow-fed counterparts (Figure 5c).

4. Discussion

To our knowledge, this was the first study to report that treadmill exercise performed before and continued throughout pregnancy increases trabecular and cortical content, cortical thickness, periosteal circumference, and bending strength in F1 growth restricted females. However, it is unclear whether these beneficial effects of exercise on the maternal skeleton can be sustained once exercise ceases or post-pregnancy. Furthermore, a HFD consumption did not cause an overt obesity phenotype in our model nor did it exacerbate the reported bone deficits in restricted females.

4.1. Bone Health in Pregnant Growth Restricted Females

Under normal circumstances, the ratio of bone formation and resorption is coupled to maintain bone integrity [44]. Hormones, such as leptin acting on the CNS [45] and osteocalcin, as well as other mediators (CTX-1), influence the maintenance of normal bone mass [44]. In the present study, osteocalcin and CTX-1 were measured to quantify bone formation and resorption, respectively. Despite bone deficits, as measured by pQCT, the sedentary restricted females had increased plasma osteocalcin concentrations. Prior studies have reported that during late gestation, on day 21 of a 22 day pregnancy, healthy Wistar rats had increased plasma osteocalcin concentrations [46], suggesting that this normal physiological adaptation was exaggerated in restricted dams. The exact mechanism for this increase is unknown; however, it may be driven by the developing fetuses’ need for skeletal mineralization or to maintain fetal development, since maternal osteocalcin can cross the placenta and influence fetal brain development [47]. Furthermore, osteocalcin is believed to be under the hormonal control of insulin and leptin [48]. Since leptin concentrations were not different between the control and restricted dams, it is unlikely to have been responsible for the increased osteocalcin concentrations observed in the current study. However, we cannot discount the alterations in leptin resistance on bone health [45,49] or the effect of insulin on osteocalcin concentrations, which requires further investigation.

4.2. Bone Health Following High-fat Feeding

With regards to high-fat feeding, the osteocalcin concentrations were reduced (sedentary only) and CTX-1 concentrations were increased (sedentary only and control dams). This finding was consistent with previous studies which have demonstrated that HFD consumption decreases plasma oesteocalcin concentrations and bone mass, and it increases plasma CTX-1 concentrations [50]. This indicates that there is an adverse effect of the HFD, which potentially favors bone breakdown as the CTX-1 concentrations are increased. A potential mechanism to explain these findings is the increased presence of adipocytes and pro-inflammatory cytokines causing the suppression of osteoblasts and increasing osteclastogenesis [21], which requires further investigation. However, in the present study, the plasma inflammatory cytokines could not be extrapolated as the plasma concentrations of TNF-α, IL-6, IL-1α, ILβ, and IFNγ were out of range of the assays (data not shown). It is important to note that despite these changes in response to high-fat feeding, it did not induce an obesity phenotype in our model. Therefore, it is likely that a diet with a higher fat content, closely mimicking a Western diet, is needed to further challenge the growth restricted dams to reveal the adverse effects of obesity on bone health. Despite these changes in bone markers following high-fat feeding, these changes were not reflected in our pQCT results; rather, the growth restricted females remained with bone deficits that were not further exacerbated by the high-fat feeding.
Of interest is the data from our mechanical testing, whereby sedentary HFD females had an increased peak force and bending stress, which was consistent with previous findings [51] and was contrary to a study in obese Zucker rats [52]. These differences were likely due to dietary intervention in an attempt to induce a model of obesity in the present study and in the study by Lau et al. [51], as compared to the genetic obesity model used by Mathey et al. [52]. Nevertheless, the mechanism behind the increased peak force and bending stress in the sedentary HFD females remains unknown. However, the aforementioned increase in the CTX-1 plasma concentrations in sedentary HFD dams suggests that bone turnover favors resorption. Moreover, there was no indication in the pQCT or histomorphometry data that high-fat feeding improved bone health. Nevertheless, our histomorphometry data was limited as we focused on the static measures of trabecular, rather than cortical, bone. Furthermore, fluorescent labelling for the dynamic histomorphometry of the dams was not possible as the study had separate fetal outcomes.

4.3. Exercise Effects on Bone Health

Many studies have reported the effects of treadmill exercise on bone [35,37,52,53,54]; however, there is limited evidence of the effects of exercise in any model of growth restriction. Importantly, this study demonstrates, for the first time that the bone deficits in sedentary restricted females were prevented with exercise, which was independent of the changes in osteocalcin and CTX-1 concentrations; suggesting that bone formation and resorption remain coupled. This improved bone health following exercise was consistent with other researchers who have demonstrated that treadmill exercise in healthy rats increases tibial trabecular bone volume [53], the periosteal bone formation rate of long bone [54], femoral length, and tibial BMC [37]. These previous studies also indicated that treadmill exercise increased plasma osteocalcin concentrations [37,54], which likely contributed to the improvements in bone outcomes in their models. However, in the present study, we report no changes in the plasma osteocalcin concentrations between the control and restricted exercise females. These differences in osteocalcin concentrations following exercise may be due to the increased energy expenditure [55] and exercise intensity [53] and duration [53,54] in the previous studies compared to the present study. Another potential cause for these differences is that osteocalcin concentrations would have increased at an earlier time point than that at measurement, which may have occurred during the pre-pregnancy exercise period when intensity and duration were consistent. However, it is important to note that despite exercise improving the bone deficits in restricted females, the bone mechanical properties were not increased, which was in contrast to studies that reported increased maximal load and moment of inertia following tower climbing exercises [56]. The exact mechanism causing the exercise improvements in the maternal skeleton of growth restricted females has yet to be clarified; however, it is likely that pre-pregnancy exercise plays an important role in restoring bone deficits. During late pregnancy, the growth restricted females that exercised had increased bone parameters, compared to their sedentary counterparts, indicating that exercise assisted in increasing the bone content and strength. Additionally, it is unknown whether the benefits of exercise training will persist or whether the maternal skeleton will revert to the phenotype observed in the sedentary restricted females post-pregnancy.

5. Conclusions

The novel aspect of this study is the improvement in the bone parameters of growth restricted females that exercised prior to and during pregnancy. These findings have the potential to be translated to human pregnancies that are at risk of adverse pregnancy adaptations, including females that were born growth restricted. Furthermore, our data demonstrates that endurance exercise is beneficial to the maternal skeleton, which can be a modifiable lifestyle factor adopted by females who experience adverse bone health.

Author Contributions

Conceptualization, M.E.W.; Methodology, M.E.W., K.A., D.M., J.D.W., B.L.G., S.J.M.; Validation, K.A., D.M., J.F.B., A.J.J., J.D.W., B.L.G., R.D.B., S.J.M., M.E.W., T.R.; Formal analysis, K.A., D.M., J.F.B., B.L.G., S.J.M., M.E.W., T.R.; Investigation, K.A., D.M., A.J.J.; Resources, M.E.W., J.D.W., T.R.; Data curation, K.A., D.M., M.E.W.; Original draft preparation, K.A.; Review and editing, K.A., D.M., J.F.B., A.J.J., J.D.W., B.L.G., R.D.B., S.J.M., M.E.W., T.R.; Visualization, K.A., M.E.W.; Supervision, M.E.W., T.R.; Funding acquisition, M.E.W., T.R.

Funding

This research was funded by the Diabetes Australia Research Trust awarded to M. E. Wlodek, and the National Health and Medical Research Council (NHMRC) of Australia (APP1025426) and (APP1045602) awarded to M. E. Wlodek. D. Mahizir received support from the Majlis Amanah Rakyat (MARA) Malaysian Government Agency. K. Anevska received support through the La Trobe University Postgraduate Research Scholarship. J.F. Briffa holds an MDHS Faculty Fellowship at the University of Melbourne.

Conflicts of Interest

The authors declare no conflict of interest.

References

  1. Tojo, Y.; Kurabayashi, T.; Honda, A.; Yamamoto, Y.; Yahata, T.; Takakuwa, K.; Tanaka, K. Bone structural and metabolic changes at the end of pregnancy and lactation in rats. Am. J. Obstet. Gynecol. 1998, 178, 180–185. [Google Scholar] [CrossRef]
  2. Miller, S.C.; Bowman, B.M. Comparison of bone loss during normal lactation with estrogen deficiency osteopenia and immobilization osteopenia in the rat. Anat. Rec. 1998, 251, 265–274. [Google Scholar] [CrossRef]
  3. Monteiro, A.C.T.; Paes, S.T.; Dos Santos, J.A.; De Lira, K.D.S.; De Moraes, S.R.A. Effects of physical exercise during pregnancy and protein malnutrition during pregnancy and lactation on the development and growth of the offspring’s femur. J. Pediatr. (Rio J.) 2010, 86, 233–238. [Google Scholar] [CrossRef]
  4. Kimura, T.; Hino, K.; Kono, T.; Takano, A.; Nitta, N.; Ushio, N.; Hino, S.; Takase, R.; Kudo, M.; Daigo, Y.; et al. Maternal undernutrition during early pregnancy inhibits postnatal growth of the tibia in the female offspring of rats by alteration of chondrogenesis. Comp. Endocrinol. 2018, 260, 58–66. [Google Scholar] [CrossRef] [PubMed]
  5. Romano, T.; Hryciw, D.H.; Westcott, K.T.; Wlodek, M.E. Puberty onset is delayed following uteroplacental insufficiency and occurs earlier with improved lactation and growth for pups born small. Reprod. Fertil. Dev. 2017, 29, 307. [Google Scholar] [CrossRef]
  6. Romano, T.; Wark, J.D.; Wlodek, M.E. Developmental programming of bone deficits in growth-restricted offspring. Reprod. Fertil. Dev. 2015, 27, 823–833. [Google Scholar] [CrossRef] [PubMed]
  7. Romano, T.; Wark, J.D.; Wlodek, M.E. Physiological skeletal gains and losses in rat mothers during pregnancy and lactation are not observed following uteroplacental insufficiency. Reprod. Fertil. Dev. 2014, 26, 385–394. [Google Scholar] [CrossRef]
  8. Romano, T.; Wark, J.D.; Wlodek, M.E. Calcium supplementation does not rescue the programmed adult bone deficits associated with perinatal growth restriction. Bone 2010, 47, 1054–1063. [Google Scholar] [CrossRef]
  9. Romano, T.; Wark, J.D.; Owens, J.A.; Wlodek, M.E. Prenatal growth restriction and postnatal growth restriction followed by accelerated growth independently program reduced bone growth and strength. Bone 2009, 45, 132–141. [Google Scholar] [CrossRef]
  10. Engelbregt, M.J.; Van Weissenbruch, M.M.; Lips, P.; Van Lingen, A.; Roos, J.C.; Waal, H.A.D.-V.D. Body composition and bone measurements in intra-uterine growth retarded and early postnatally undernourished male and female rats at the age of 6 months: comparison with puberty. Bone 2004, 34, 180–186. [Google Scholar] [CrossRef]
  11. Robinson, J.S.; Moore, V.M.; Owens, J.A.; McMillen, I. Origins of fetal growth restriction. Eur. J. Obstet. Gynecol. Reprod. Boil. 2000, 92, 13–19. [Google Scholar] [CrossRef]
  12. Berghella, V. Prevention of Recurrent Fetal Growth Restriction. Obstet. Gynecol. 2007, 110, 904–912. [Google Scholar] [CrossRef]
  13. Martin, J.A.; Hamilton, B.E.; Sutton, P.D.; Ventura, S.J.; Menacker, F.; Kimeyer, S.; Munson, M.L. Centers for Disease Control and Prevention National Center for Health Statistics National Vital Statistics System. Births: Final data for 2005. Natl. Vital Stat. Rep. 2007, 56, 1–103. [Google Scholar]
  14. Gallo, L.A.; Tran, M.; Master, J.S.; Moritz, K.M.; Wlodek, M.E. Maternal adaptations and inheritance in the transgenerational programming of adult disease. Cell Tissue Res. 2012, 349, 863–880. [Google Scholar] [CrossRef]
  15. Oliver, H.; Jameson, K.A.; Sayer, A.A.; Cooper, C.; Dennison, E.M. Growth in early life predicts bone strength in late adulthood: The Hertfordshire Cohort Study. Bone 2007, 41, 400–405. [Google Scholar] [CrossRef] [Green Version]
  16. Kensara, O.A.; Wootton, S.A.; Phillips, D.I.; Patel, M.; Jackson, A.A.; Elia, M.; Hertfordshire Study Group. Fetal programming of body composition: relation between birth weight and body composition measured with dual-energy X-ray absorptiometry and anthropometric methods in older Englishmen. Am. J. Clin. Nutr. 2005, 82, 980–987. [Google Scholar] [Green Version]
  17. Jimenez-Chillaron, J.C.; Isganaitis, E.; Charalambous, M.; Gesta, S.; Pentinat-Pelegfrin, T.; Faucette, R.R.; Otis, J.P.; Chow, A.; Diaz, R.; Ferguson-Smith, A.; et al. Intergenerational transmission of glucose intolerance and obesity by in utero undernutrition in mice. Diabetes 2009, 58, 460–468. [Google Scholar] [CrossRef] [PubMed]
  18. Anevska, K.; Gallo, L.A.; Tran, M.; Jefferies, A.J.; Wark, J.D.; Wlodek, M.E.; Romano, T. Pregnant growth restricted female rats have bone gains during late gestation which contributes to second generation adolescent and adult offspring having normal bone health. Bone 2015, 74, 199–207. [Google Scholar] [CrossRef]
  19. Wlodek, M.E.; Westcott, K.T.; O’Dowd, R.; Serruto, A.; Wassef, L.; Moritz, K.M.; Moseley, J.M. Uteroplacental restriction in the rat impairs fetal growth in association with alterations in placental growth factors including PTHrP. Am. J. Physiol. Integr. Comp. Physiol. 2005, 288, R1620–R1627. [Google Scholar] [CrossRef]
  20. O’Dowd, R.; Kent, J.C.; Moseley, J.M.; Wlodek, M.E. Effects of uteroplacental insufficiency and reducing litter size on maternal mammary function and postnatal offspring growth. Am. J. Physiol. Integr. Comp. Physiol. 2008, 294, R539–R548. [Google Scholar] [CrossRef]
  21. Cao, J.J. Effects of obesity on bone metabolism. J. Orthop. Surg. 2011, 6, 30. [Google Scholar] [CrossRef] [PubMed]
  22. Frost, H. Obesity, and bone strength and “mass”: A tutorial based on insights from a new paradigm. Bone 1997, 21, 211–214. [Google Scholar] [CrossRef]
  23. Villareal, D.T.; Apovian, C.M.; Kushner, R.F.; Klein, S. Obesity in older adults: technical review and position statement of the American Society for Nutrition and NAASO, The Obesity Society. Am. J. Clin. Nutr. 2005, 82, 923–934. [Google Scholar] [CrossRef] [PubMed]
  24. Malvi, P.; Piprode, V.; Chaube, B.; Pote, S.T.; Mittal, M.; Chattopadhyay, N.; Wani, M.R.; Bhat, M.K. High fat diet promotes achievement of peak bone mass in young rats. Biochem. Biophys. Commun. 2014, 455, 133–138. [Google Scholar] [CrossRef]
  25. Li, W.; Xu, P.; Wang, C.; Ha, X.; Gu, Y.; Wang, Y.; Zhang, J.; Xie, J. The effects of fat-induced obesity on bone metabolism in rats. Obes. Clin. Pr. 2017, 11, 454–463. [Google Scholar] [CrossRef]
  26. Goulding, A.; Grant, A.M.; Williams, S.M. Bone and Body Composition of Children and Adolescents With Repeated Forearm Fractures. J. Bone 2005, 20, 2090–2096. [Google Scholar] [CrossRef]
  27. Prieto-Alhambra, D.; Premaor, M.O.; Avilés, F.F.; Hermosilla, E.; Martinez-Laguna, D.; Carbonell-Abella, C.; Nogués, X.; Compston, J.E.; Diez-Perez, A.; Prieto-Alhambra, D.; et al. The association between fracture and obesity is site-dependent: A population-based study in postmenopausal women. J. Bone 2012, 27, 294–300. [Google Scholar] [CrossRef]
  28. Cohen, A.; Dempster, D.W.; Recker, R.R.; Lappe, J.M.; Zhou, H.; Zwahlen, A.; Müller, R.; Zhao, B.; Guo, X.; Lang, T.; et al. Abdominal Fat Is Associated With Lower Bone Formation and Inferior Bone Quality in Healthy Premenopausal Women: A Transiliac Bone Biopsy Study. J. Clin. Endocrinol. Metab. 2013, 98, 2562–2572. [Google Scholar] [CrossRef]
  29. Patsch, J.M.; Kiefer, F.W.; Varga, P.; Pail, P.; Rauner, M.; Stupphann, D.; Resch, H.; Moser, D.; Zysset, P.K.; Stulnig, T.M.; et al. Increased bone resorption and impaired bone microarchitecture in short-term and extended high-fat diet-induced obesity. Metabolism 2011, 60, 243–249. [Google Scholar] [CrossRef]
  30. Lu, X.M.; Zhao, H.; Wang, E.H. A high-fat diet induces obesity and impairs bone acquisition in young male mice. Mol. Med. Rep. 2013, 7, 1203–1208. [Google Scholar] [CrossRef]
  31. Cao, J.J.; Gregoire, B.R.; Shen, C.-L. A High-Fat Diet Decreases Bone Mass in Growing Mice with Systemic Chronic Inflammation Induced by Low-Dose, Slow-Release Lipopolysaccharide Pellets. J. Nutr. 2017, 147, 1909–1916. [Google Scholar] [CrossRef]
  32. Doucette, C.R.; Horowitz, M.C.; Berry, R.; MacDougald, O.A.; Koza, R.A.; Rosen, C.J.; Anunciado-Koza, R.; Anunciado-Koza, R. A high fat diet increases bone marrow adipose tissue (MAT) but does not alter trabecular or cortical bone mass in C57BL/6J mice. J. Cell. Physiol. 2015, 230, 2032–2037. [Google Scholar] [CrossRef]
  33. Saville, P.D.; Whyte, M.P. Muscle and bone hypertrophy. Positive effect of running exercise in the rat. Clin. Orthop. Relat. 1969, 65, 81–88. [Google Scholar]
  34. Woo, S.L.; Kuei, S.C.; Amiel, D.; Gomez, M.A.; Hayes, W.C.; White, F.C.; Akeson, W.H. The effect of prolonged physical training on the properties of long bone: A study of Wolff’s Law. J. Bone Jt. Surg. 1981, 63, 780–787. [Google Scholar] [CrossRef]
  35. Chen, M.M.; Yeh, J.K.; Aloia, J.F.; Tierney, J.M.; Sprintz, S. Effect of treadmill exercise on tibial cortical bone in aged female rats: A histomorphometry and dual energy X-ray absorptiometry study. Bone 1994, 15, 313–319. [Google Scholar] [CrossRef]
  36. Snyder, A.; Zierath, J.R.; Hawley, J.A.; Sleeper, M.D.; Craig, B.W. The effects of exercise mode, swimming vs. Running, upon bone growth in the rapidly growing female rat. Mech. Ageing Dev. 1992, 66, 59–69. [Google Scholar] [CrossRef]
  37. Iwamoto, J.; Shimamura, C.; Takeda, T.; Abe, H.; Ichimura, S.; Sato, Y.; Toyama, Y. Effects of treadmill exercise on bone mass, bone metabolism, and calciotropic hormones in young growing rats. J. Bone Miner. Metab. 2004, 22, 26–31. [Google Scholar] [CrossRef]
  38. Liu, S.Y.; Li, Z.; Xu, S.-Y.; Xu, L.; Yang, M.; Ni, G.-X. Intensity-dependent effect of treadmill running on differentiation of rat bone marrow stromal cells. Mol. Med. Rep. 2018, 17, 7746–7756. [Google Scholar] [CrossRef]
  39. Laker, R.C.; Wlodek, M.E.; Wadley, G.D.; Gallo, L.A.; Meikle, P.J.; McConell, G.K. Exercise early in life in rats born small does not normalize reductions in skeletal muscle pgc-1α in adulthood. Am. J. Physiol. Endocrinol. Metab. 2012, 302, E1221–E1230. [Google Scholar] [CrossRef]
  40. Mangwiro, Y.T.M.; Cuffe, J.S.M.; Briffa, J.F.; Mahizir, D.; Anevska, K.; Jefferies, A.J.; Hosseini, S.; Romano, T.; Moritz, K.M.; Wlodek, M.E. Maternal exercise in rats upregulates the placental insulin-like growth factor system with diet- and sex-specific responses: Minimal effects in mothers born growth restricted. J. Physiol. 2018, 596, 5947–5964. [Google Scholar] [CrossRef]
  41. Anevska, K.; Cheong, J.N.; Wark, J.D.; Wlodek, M.E.; Romano, T. Maternal stress does not exacerbate long-term bone deficits in female rats born growth restricted, with differential effects on offspring bone health. Am. J. Physiol. Regul. Integr. Comp. Physiol. 2018, 314, R161–R170. [Google Scholar] [CrossRef]
  42. Brady, R.D.; Grills, B.L.; Church, J.E.; Walsh, N.C.; McDonald, A.C.; Agoston, D.V.; Sun, M.; O’Brien, T.J.; Shultz, S.R.; McDonald, S.J. Closed head experimental traumatic brain injury increases size and bone volume of callus in mice with concomitant tibial fracture. Sci. Rep. 2016, 6, 34491. [Google Scholar] [CrossRef]
  43. Brady, R.D.; Grills, B.L.; Romano, T.; Wark, J.D.; O’Brien, T.J.; Shultz, S.R.; McDonald, S.J. Sodium selenate treatment mitigates reduction of bone volume following traumatic brain injury in rats. J. Musculoskelet. Neuronal Interact. 2016, 16, 369–376. [Google Scholar]
  44. Seibel, M.J. Biochemical markers of bone turnover part 1: Biochemistry and variability. Clin. Biochem. Rev. 2005, 26, 97–122. [Google Scholar]
  45. Krawczewski Carhuatanta, K.A.; Demuro, G.; Tschop, M.H.; Pfluger, P.T.; Benoit, S.C.; Obici, S. Voluntary exercise improves high-fat diet-induced leptin resistance independent of adiposity. Endocrinology 2011, 152, 2655–2664. [Google Scholar] [CrossRef]
  46. Verhaeghe, J.; Van Herck, E.; Van Bree, R.; Van Assche, F.A.; Bouillon, R. Osteocalcin during the reproductive cycle in normal and diabetic rats. J. Endocrinol. 1989, 120, 143–151. [Google Scholar] [CrossRef]
  47. Oury, F.; Khrimian, L.; Denny, C.A.; Gardin, A.; Chamouni, A.; Goeden, N.; Huang, Y.Y.; Lee, H.; Srinivas, P.; Gao, X.B.; et al. Maternal and offspring pools of osteocalcin influence brain development and functions. Cell 2013, 155, 228–241. [Google Scholar] [CrossRef]
  48. Ducy, P. The role of osteocalcin in the endocrine cross-talk between bone remodelling and energy metabolism. Diabetologia 2011, 54, 1291–1297. [Google Scholar] [CrossRef] [Green Version]
  49. Firth, E.C.; Gamble, G.D.; Cornish, J.; Vickers, M.H. Neonatal leptin treatment reverses the bone-suppressive effects of maternal undernutrition in adult rat offspring. Sci. Rep. 2017, 7, 7686. [Google Scholar] [CrossRef]
  50. Chen, J.R.; Lazarenko, O.P.; Wu, X.; Tong, Y.; Blackburn, M.L.; Shankar, K.; Badger, T.M.; Ronis, M.J.J. Obesity reduces bone density associated with activation of ppargamma and suppression of wnt/beta-catenin in rapidly growing male rats. PLoS ONE 2010, 5, e13704. [Google Scholar] [CrossRef]
  51. Lau, B.Y.; Fajardo, V.A.; McMeekin, L.; Sacco, S.M.; Roy, B.D.; Peters, S.J.; Ward, W.E.; Leblanc, P.J. Influence of high-fat diet from differential dietary sources on bone mineral density, bone strength, and bone fatty acid composition in rats. Appl. Physiol. Nutr. Metab. 2010, 35, 598–606. [Google Scholar] [CrossRef] [PubMed] [Green Version]
  52. Mathey, J.; Horcajada-Molteni, M.-N.; Chanteranne, B.; Picherit, C.; Puel, C.; Lebecque, P.; Cubizoles, C.; Davicco, M.-J.; Coxam, V.; Barlet, J.-P. Bone Mass in Obese Diabetic Zucker Rats: Influence of Treadmill Running. Calcif. Tissue Int. 2002, 70, 305–311. [Google Scholar] [CrossRef] [PubMed]
  53. Iwamoto, J.; Yeh, J.; Aloia, J. Differential effect of treadmill exercise on three cancellous bone sites in the young growing rat. Bone 1999, 24, 163–169. [Google Scholar] [CrossRef]
  54. Yeh, J.K.; Aloia, J.F.; Chen, M.; Ling, N.; Koo, H.C.; Millard, W.J. Effect of growth hormone administration and treadmill exercise on serum and skeletal igf-i in rats. Am. J. Physiol. Endocrinol. Metab. 1994, 266, E129–135. [Google Scholar] [CrossRef] [PubMed]
  55. Karsenty, G.; Ferron, M. The contribution of bone to whole-organism physiology. Nature 2012, 481, 314. [Google Scholar] [CrossRef] [PubMed]
  56. Notomi, T.; Okimoto, N.; Okazaki, Y.; Tanaka, Y.; Nakamura, T.; Suzuki, M. Effects of tower climbing exercise on bone mass, strength, and turnover in growing rats. J. Bone Miner. Res. 2001, 16, 166–174. [Google Scholar] [CrossRef] [PubMed]
Figure 1. Exercise protocol during pre-pregnancy: F1 females began exercising at 16 weeks, where the intensity and duration increased each day. From 17 weeks, the females ran for the same duration and time, for 5 days a week with 2 days rest until mating. During pregnancy, the exercise intensity and duration decreased, but the females continued to run for 5 days per week followed by 2 days of rest.
Nutrients 11 01236 g001
Figure 2. F1 maternal pQCT trabecular content and density. pQCT trabecular content (a) and density (b) at E20. Statistical significance (p < 0.05) determined by two-way ANOVA to identify the differences between treatments (control and restricted) and diets (Chow and HFD) within each exercise regime. A separate two-way ANOVA was then performed to identify the exercise and diet effects within each treatment (control and restricted). ‡ p < 0.05 vs. restricted sedentary. NS represents no statistical significance. Data is presented as mean ± SEM (n = 8–12/group).
Nutrients 11 01236 g002
Figure 3. F1 maternal pQCT cortical content and density. pQCT cortical content (a) and density (b) at E20. Statistical significance (p < 0.05) determined by two-way ANOVA to identify the differences between treatments (control and restricted) and diets (chow and HFD) within each exercise regime. A separate two-way ANOVA was then performed to identify the exercise and diet effects within each treatment (control and restricted). ‡ p < 0.05 vs. restricted sedentary. NS represents no statistical significance. Data is presented as mean ± SEM (n = 8–12/group).
Nutrients 11 01236 g003
Figure 4. F1 maternal pQCT bone geometry measures. pQCT bone geometry measures cortical thickness (a), periosteal circumference (b), endosteal circumference (c), and bending strength (d) at E20. Statistical significance (p < 0.05) determined by two-way ANOVA to identify the differences between treatments (control and restricted) and diets (chow and HFD) within each exercise regime. A separate two-way ANOVA was then preformed to identify the exercise and diet effects within each treatment (control and restricted). ‡ p < 0.05 vs. restricted sedentary. NS represents no statistical significance. Data is presented as mean ± SEM (n = 8–12/group).
Nutrients 11 01236 g004aNutrients 11 01236 g004b
Figure 5. F1 maternal bone turnover markers. Plasma markers of bone turnover Osteocalcin (a), CTX-1 (b), and Leptin (c) at E20. Statistical significance (p < 0.05) determined by two-way ANOVA to identify the differences between treatments (control and restricted) and diets (chow and HFD) within each exercise regime. A separate two–way ANOVA was then preformed to identify the exercise and diet effects within each treatment (control and restricted). # p < 0.05 vs. chow. NS represents no statistical significance. Data is presented as mean ± SEM (n = 8/group).
Nutrients 11 01236 g005
Table 1. F1 Control and restricted postnatal body weights. Postnatal body weights on days 1, 7, 14, and 35. Statistical significance (p < 0.05) determined by the Student’s unpaired t-test; * p = 0.0001 vs. control. Data is presented as mean ± SEM (sibling averages).
Postnatal Weight (g)ControlRestricted
PN14.22 ± 0.043.49 ± 0.02 *
PN79.88 ± 0.167.99 ± 0.17 *
PN1422.23 ± 0.2618.83 ± 0.38 *
PN3576.36 ± 0.6268.36 ± 0.80 *
Table 2. Body weight measurements of the F1 females. p-values in italics indicate the statistical significance (p < 0.05) determined by two-way ANOVA to identify the differences between treatment (control and restricted) and diet (chow and HFD) within each exercise regime. A separate two-way ANOVA was then performed to identify the exercise and diet effects within each treatment (control and restricted). NS represents no statistical significance. Data is presented as mean ± SEM (n = 8–12/group).
Two-Way ANOVA
ChowHFDTreatmentDietInteraction
15 week Body Weight (g)
SedentaryControl232 ± 4.0239 ± 7.0p = 0.0001NSNS
Restricted213 ± 2.0217 ± 7.8
ExerciseControl225 ± 4.1242 ± 2.3p = 0.020p = 0.0001NS
Restricted217 ± 2.6234 ± 2.5
19 week Body Weight (g)
SedentaryControl248 ± 4.5266 ± 7.0p = 0.001p = 0.026NS
Restricted230 ± 2.4240 ± 8.3
ExerciseControl258 ± 3.1275 ± 5.3p = 0.022p = 0.0001NS
Restricted247 ± 3.3269 ± 2.1
Mating Body Weight (g)
SedentaryControl258 ± 4.7270 ± 8.0p = 0.002NSNS
Restricted233 ± 6.0249 ± 7.5
ExerciseControl264 ± 3.7280 ± 6.8p = 0.042p = 0.001NS
Restricted251 ± 4.3272 ± 4.5
E20 Body Weight (g)
SedentaryControl347 ± 5.3360 ± 10.0p = 0.0001p = 0.030NS
Restricted314 ± 4.1335 ± 8.6
ExerciseControl346 ± 3.8377 ± 7.7p = 0.011p = 0.0001NS
Restricted332 ± 5.7359 ± 5.9
Pregnancy Weight Gain (g)
SedentaryControl89 ± 3.590 ± 4.1p = 0.027NSNS
Restricted76 ± 2.187 ± 2.3
ExerciseControl82 ± 1.897 ± 3.1NSp = 0.006NS
Restricted81 ± 2.987 ± 5.4
Table 3. Histological analysis of the right femur. There were no statistically significant findings (p > 0.05) determined by the two-way ANOVA to identify the differences between treatments (control and restricted) and diets (chow and HFD) within each exercise regime. A separate two-way ANOVA was then performed to identify the exercise and diet effects within each treatment (control and restricted). NS represents no statistical significance. Data is presented as mean ± SEM (n = 4/group).
Two-Way ANOVA
ChowHFDTreatmentDietInteraction
R. Femur Length (mm)
SedentaryControl34.3 ± 0.234.2 ± 0.2NSNSNS
Restricted33.5 ± 0.233.4 ± 0.2
ExerciseControl34.9 ± 0.134.6 ± 0.3NSNSNS
Restricted34.1 ± 0.134.6 ± 0.2
Bone Area (%)
SedentaryControl16 ± 3.2422.7 ± 2.2NSNSNS
Restricted18.6 ± 2.422 ± 2.9
ExerciseControl19.5 ± 1.621.7 ± 2.7NSNSNS
Restricted19 ± 1.320.5 ± 3.7
Calcified Cartilage (%)
SedentaryControl9.3 ± 2.29.5 ± 1.1NSNSNS
Restricted6.2 ± 2.38.4 ± 2.3
ExerciseControl6.8 ± 1.89.5 ± 0.04NSNSNS
Restricted6.6 ± 1.610.3 ± 1.5
Growth Plate (μm)
SedentaryControl121 ± 5.8123 ± 6.4NSNSNS
Restricted138 ± 14.6129.6 ± 6.2
ExerciseControl126 ± 8.1128.8 ± 2.9NSNSNS
Restricted116 ± 6.5123 ± 11.5
Table 4. Mechanical testing of the left femur. p-values in italics indicate statistical significance (p < 0.05) determined by two-way ANOVA to identify the differences between treatments (control and restricted) and diets (Chow and HFD) within each Exercise regime. A separate two–way ANOVA was then performed to identify the exercise and diet effects within each treatment (control and restricted). NS represents no statistical significance. Data is presented as mean ± SEM (n = 8–12/group).
Two-Way ANOVA
ChowHFDTreatmentDietInteraction
L. Femur Length (mm)
SedentaryControl34.4 ± 0.234.0 ± 0.3NSNSNS
Restricted33.5 ± 0.233.5 ± 0.2
ExerciseControl34.5 ± 0.234.7 ± 0.2NSNSNS
Restricted34.0 ± 0.234.3 ± 0.2
Peak Force (N)
SedentaryControl263.5 ± 16.0293.9 ± 10.9NSp = 0.003NS
Restricted247.2 ± 19.5287.8 ± 12.9
ExerciseControl313.2 ± 2.8286.1 ± 18.1NSNSNS
Restricted270.9 ± 12.3299.0 ± 22.5
Bending Stress (× 106 m2)
SedentaryControl107 ± 6.6117 ± 4.4NSp = 0.003NS
Restricted100 ± 5.7125 ± 4.6
ExerciseControl115.5 ± 8.5115.1 ± 6.9NSNSNS
Restricted109.6 ± 4.5122.3 ± 9.1

