Next Article in Journal
Adaptation and Validation of Alternative Healthy Eating Index in Hemodialysis Patients (AHEI-HD) and Its Association with all-Cause Mortality: A Multi-Center Follow-Up Study
Previous Article in Journal
Nutritional Interventions to Improve Clinical Outcomes in Ovarian Cancer: A Systematic Review of Randomized Controlled Trials
Previous Article in Special Issue
Association between Adherence to the Antioxidant-Rich Mediterranean Diet and Sensory Processing Profile in School-Aged Children: The Spanish Cross-Sectional InProS Project
 
 
nutrients-logo
Article Menu

Article Menu

Article

Dietary Inflammatory Index, Dietary Non-Enzymatic Antioxidant Capacity, and Colorectal and Breast Cancer Risk (MCC-Spain Study)

by
Mireia Obón-Santacana
1,2,3,
Dora Romaguera
4,5,6,*,
Esther Gracia-Lavedan
3,4,7,
Amaia Molinuevo
3,
Esther Molina-Montes
8,9,
Nitin Shivappa
10,11,12,
James R. Hebert
10,11,12,
Adonina Tardón
3,13,
Gemma Castaño-Vinyals
3,4,7,14,
Ferran Moratalla
1,2,3,15,
Elisabet Guinó
1,2,3,
Rafael Marcos-Gragera
3,16,
Mikel Azpiri
17,18,
Leire Gil
17,18,
Rocío Olmedo-Requena
3,19,20,
Macarena Lozano-Lorca
19,
Juan Alguacil
3,21,
Tania Fernández-Villa
22,23,
Vicente Martín
3,22,23,
Antonio J Molina
22,23,
María Ederra
3,24,25,
Conchi Moreno-Iribas
24,25,26,
Beatriz Perez
3,27,
Nuria Aragonés
3,28,
Adela Castello
3,27,29,
José Mª Huerta
3,30,
Trinidad Dierssen-Sotos
3,31,
Inés Gómez-Acebo
3,31,
Ana Molina-Barceló
32,
Marina Pollán
3,27,28,
Manolis Kogevinas
3,4,7,14,
Victor Moreno
1,2,3,15 and
Pilar Amiano
3,17,18
add Show full author list remove Hide full author list
1
Oncology Data Analytics Program (ODAP), Catalan Institute of Oncology (ICO), L’Hospitalet del Llobregat, 08908 Barcelona, Spain
2
ONCOBELL Program, Bellvitge Biomedical Research Institute (IDIBELL), L’Hospitalet de Llobregat, 08908 Barcelona, Spain
3
Consortium for Biomedical Research in Epidemiology and Public Health (CIBERESP), 28029 Madrid, Spain
4
Instituto de Salud Global de Barcelona (ISGlobal), 08036 Barcelona, Spain
5
Instituto de Investigación Sanitaria Illes Balears (IdISBa), 07120 Palma de Mallorca, Spain
6
CIBER Fisiopatología de la Obesidad y Nutrición (CIBEROBN), 28029 Madrid, Spain
7
Departament de Ciències Experimentals i de la Salut, Universitat Pompeu Fabra (UPF), 08002 Barcelona, Spain
8
Genetic and Molecular Epidemiology Group, Spanish National Cancer Research Center (CNIO), 28029 Madrid, Spain
9
Centro de Investigación Biomédica en Red de Cáncer (CIBERONC), 28029 Madrid, Spain
10
Cancer Prevention and Control Program, University of South Carolina, Columbia, SC 29208, USA.
11
Department of Epidemiology and Biostatistics, Arnold School of Public Health, University of South Carolina, Columbia, SC 29208, USA
12
Department of Nutrition, Connecting Health Innovations LLC (CHI), Columbia, SC 29201, USA
13
Department of Medicine, University of Oviedo, 33006 Oviedo, Spain
14
IMIM (Hospital del Mar Medical Research Institute), 08003 Barcelona, Spain
15
Department of Clinical Sciences, Faculty of Medicine, University of Barcelona, 08007 Barcelona, Spain
16
Genetics and Cancer Prevention Group, Epidemiology Unit and Girona Cancer Registry, Descriptive Epidemiology, IdIbGi, Catalan Institute of Oncology, 17007 Girona, Spain
17
Public Health Division of Gipuzkoa, 20003 San Sebastian, Spain
18
Biodonostia Research Institute, 20014 San Sebastian, Spain
19
Department of Preventive Medicine and Public Health, School of Medicine, University of Granada, 18016 Granada, Spain
20
Instituto de Investigación Biosanitaria de Granada ibs.GRANADA, 18014 Granada, Spain
21
Centro de Investigación en Recursos Naturales, Salud y Medio Ambiente (RENSMA), Universidad de Huelva, 21071Huelva, Spain
22
The Research Group in Gene - Environment and Health Interactions (GIIGAS) / Institut of Biomedicine (IBIOMED), Universidad de León, 24071 León, Spain
23
Faculty of Health Sciences, Department of Biomedical Sciences, Area of Preventive Medicine and Public Health, Universidad de León, 24071 León, Spain
24
Navarra Public Health Institute, 31003 Pamplona, Spain
25
Navarra Institute for Health Research (IdiSNA), 31003 Pamplona, Spain
26
REDISSEC Red de Investigación en Servicios de Salud en Enfermedades Crónicas, 28029 Madrid, Spain
27
Cancer & Environmental Epidemiology Unit, Department of Epidemiology of Chronic Diseases, National Centre for Epidemiology, Carlos III Institute of Health, 28029 Madrid, Spain
28
Department of Health of Madrid, Cancer Epidemiology Section, Public Health Division, 28029 Madrid, Spain
29
Department of Surgery and Medical and Social Sciences. Alcalá de Henares University, 28801 Alcalá de Henares, Madrid, Spain
30
Department of Epidemiology, Murcia Regional Health Council, IMIB-Arrixaca, 30008 Murcia, Spain
31
Preventive Medicine, Universidad de Cantabria—IDIVAL, 39011 Santander, Spain
32
Cancer and Public Health Area, FISABIO—Public Health; 46020 Valencia, Spain
*
Author to whom correspondence should be addressed.
Nutrients 2019, 11(6), 1406; https://doi.org/10.3390/nu11061406
Submission received: 2 May 2019 / Revised: 14 June 2019 / Accepted: 19 June 2019 / Published: 21 June 2019
(This article belongs to the Special Issue Dietary Antioxidants and Human Health)

Abstract

:
Inflammation and antioxidant capacity have been associated with colorectal and breast cancer. We computed the dietary inflammatory index (DII®), and the total dietary non-enzymatic antioxidant capacity (NEAC) and associated them with colorectal and breast cancer risk in the population-based multi case-control study in Spain (MCC-Spain). We included 1852 colorectal cancer and 1567 breast cancer cases, and 3447 and 1486 population controls, respectively. DII score and NEAC were derived using data from a semi-quantitative validated food frequency questionnaire. Unconditional logistic regression models were used to estimate odds ratios (OR) and 95% confidence intervals (95%CI) for energy-adjusted DII (E-DII), and a score combining E-DII and NEAC. E-DII was associated with colorectal cancer risk (OR = 1.93, highest quartile versus lowest, 95%CI:1.60–2.32; p-trend: <0.001); this increase was observed for both colon and rectal cancer. Less pronounced increased risks were observed for breast cancer (OR = 1.22, highest quartile versus lowest, 95%CI:0.99–1.52, p-trend: >0.10). The combined score of high E-DII scores and low antioxidant values were associated with colorectal cancer risk (OR = 1.48, highest quartile versus lowest, 95%CI: 1.26–1.74; p-trend: <0.001), but not breast cancer. This study provides evidence that a pro-inflammatory diet is associated with increased colorectal cancer risk while findings for breast cancer were less consistent.

1. Introduction

Colorectal cancer (CRC) is the third most common cancer worldwide [1]. Beyond non-modifiable risk factors such as age, male sex, family history of CRC, and genetic predisposition [2], epidemiological studies have identified a number of modifiable factors that have a direct impact on CRC risk, for example cigarette smoking, which increases risk [3], and regular use of aspirin, which decreases risk [4]. Regarding nutritional factors, consuming processed and red meat, alcoholic beverages, and being overweight or obese increases the risk of developing CRC; whereas being physically active, consuming whole grains, foods rich in fiber including fruits and vegetables, dairy products, and calcium supplements decrease CRC risk [5].
Among females, breast cancer (BC) and CRC are the two most frequently diagnosed cancers [6,7]. Age, BRCA1 or BRCA2 genes mutations, family history of BC or ovarian cancer, radiation, hormonal factors, physical inactivity, alcohol consumption, tobacco smoking and physical inactivity are important risk factors for BC [8,9]. The role of diet, however, remains controversial [9].
Despite that CRC and BC are different cancers affecting different organs, they share similar risk factors. Scientific evidence has shown that chronic inflammation and oxidative stress predispose the pathogenesis of numerous diseases, including CRC and BC [10,11,12,13]. Additionally, it has been observed that oxidative stress produces DNA damage and increases cancer risk, partially mediated through inflammation, suggesting that both mechanisms are also related [14,15].
Diet may play a role in the regulation of chronic inflammation, as shown by the relation between dietary factors and blood levels of inflammatory markers [16,17,18]. There have been several approaches to assess the inflammatory potential of the overall diet, beyond the study of single nutrients and foods, and the most widely used is the dietary inflammatory index (DII®), which was specifically designed to assess and offer quantitative information about the inflammatory potential of the diet [19]. The DII has been shown to be associated with various biomarkers of inflammation in several studies [20,21,22] including those in Europe [23,24,25]. The relation between diet and oxidative stress also has been evaluated, but the molecular mechanisms are still under study [26]. The non-enzymatic antioxidant capacity (NEAC) has been proven to be a useful tool to estimate the total dietary antioxidant content, as it takes into account all the antioxidants and bioactive compounds present in the diet and the synergistic effects between them [27,28].
Numerous epidemiological studies have assessed the association between DII and energy-adjusted (E-DII) scores and CRC and BC risk, supporting the hypothesis that a pro-inflammatory diet is related to CRC risk [29]. The evidence for BC is less clear [30,31,32]. The role of NEAC has also been evaluated in several cancer sites, including CRC and BC. Despite that some studies indicated no clear association between NEAC and CRC risk [33,34], others have observed statistically significant decreased risk for CRC [28,35], as well as for BC risk [36,37].
Thus far, studies essentially have focused on assessing the role of the inflammatory potential of the diet on cancer risk, without considering the plausible combined effect of a global indicator of NEAC. Using the newly constructed E-DII in the population-based multi-case-control (MCC)-Spain study our aim is to analyze the association between the inflammatory potential of the diet, and the risk of developing BC and CRC, as well as among tumor subtypes. A second aim of the present study is to elucidate the relation between E-DII and NEAC, and to evaluate whether having an anti-inflammatory and antioxidant diet affects the risk of developing CRC and BC.

2. Materials and Methods

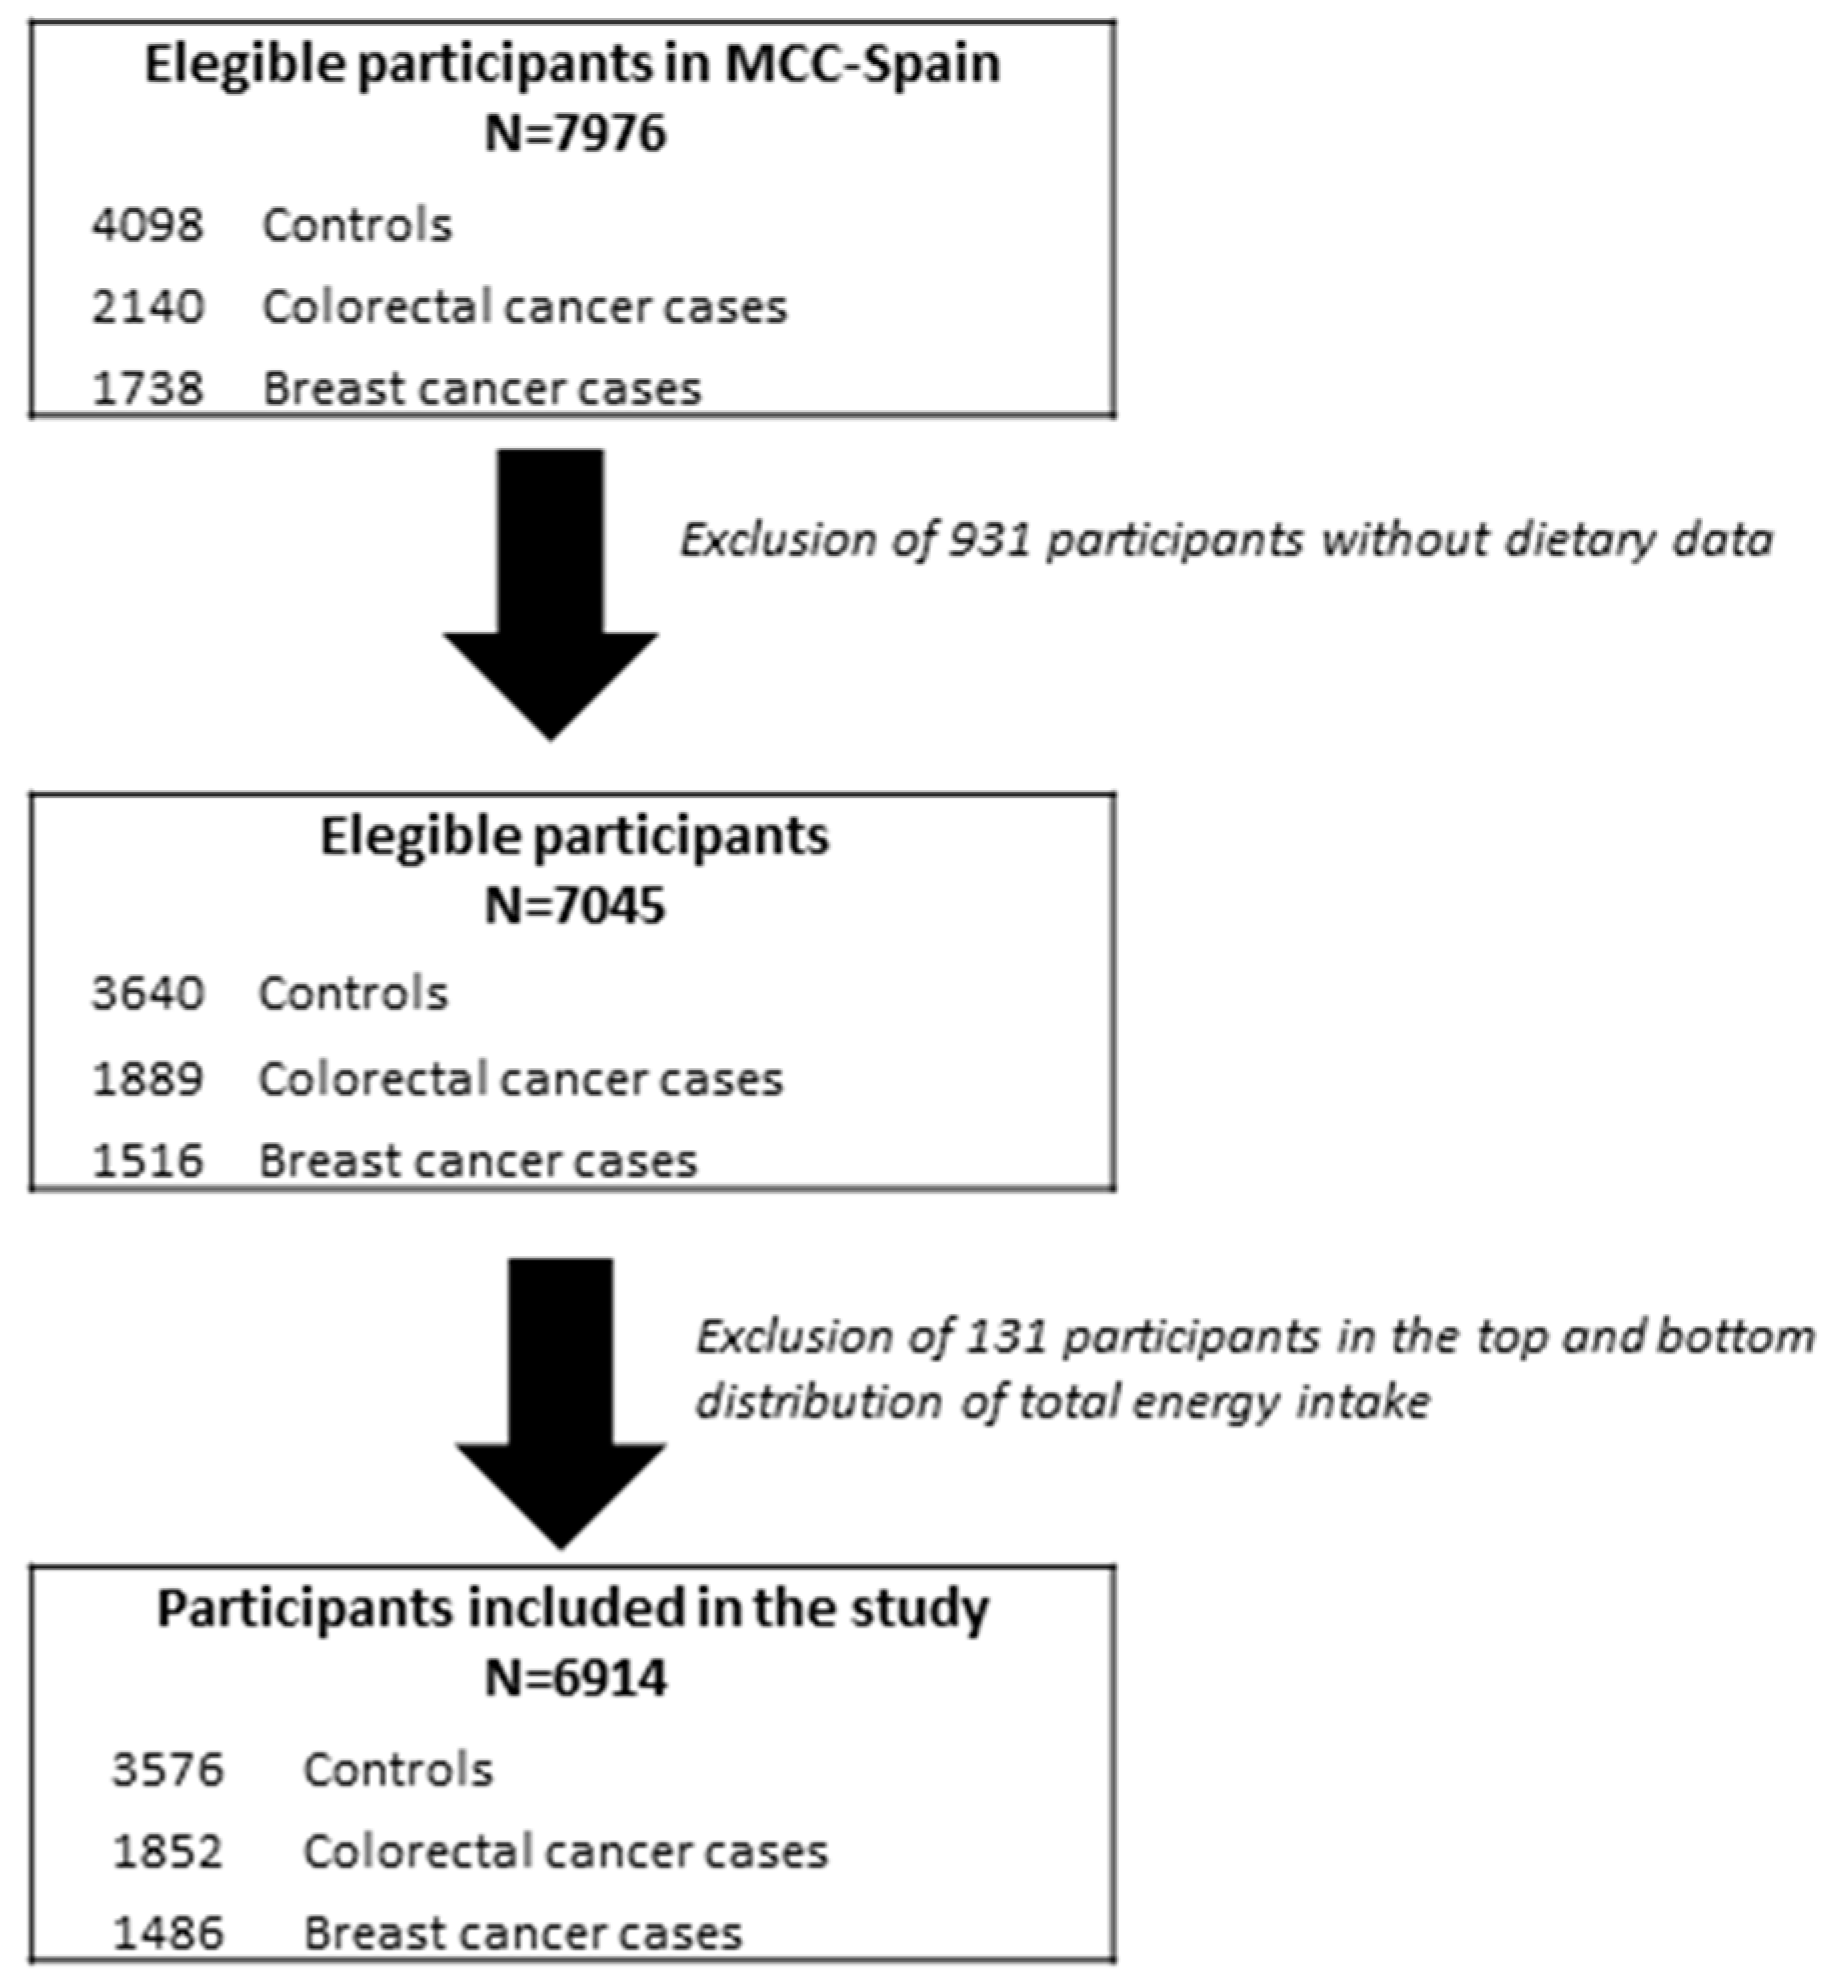
2.1. Study Population and Design

MCC-Spain is a population-based multicenter case-control study designed to investigate the etiology of the principal cancer sites (colorectal, breast, prostate, and gastric tumors, and chronic lymphocytic leukemia) in adults. The study design and protocol have been described in detail elsewhere [38]. The MCC-Spain enrolled cases and controls from 12 Spanish provinces (Asturias, Barcelona, Cantabria, Girona, Granada, Guipúzcoa, Huelva, León, Madrid, Murcia, Navarra, and Valencia) from 2008 to 2013. All participants who were eligible to take part in the study and agreed to participate signed an informed consent. The study protocol of the MCC-Spain was approved by all the Ethics Committees of the participating institutions and followed national and international directives on ethics and data protection [38].
The CRC sub-study included 1852 cases and 3347 controls, and the BC sub-study included 1486 cases and 1652 controls (Figure 1). Newly diagnosed cancer cases were ascertained through the oncologic or digestive units of the participating hospitals. All CRC and BC cases were histologically confirmed. CRC cases were classified according to the International Classification of Diseases 10th Revision as C18, C19, C20, D01.0, D01.1, and D01.2 (including cancer of the colon or rectum) whereas BC cases were classified as C50, D05.1, and D05.7. Controls were randomly selected from lists of primary care centers located in the catchment area of hospitals from where the cases came. They were frequency matched to cases on age, sex, and region. As reported elsewhere, the mean response rate of controls was 53%, and differed by region [38].

2.2. Epidemiological Data Collection

Face-to-face interviews were carried out at baseline by trained personnel using a structured computerized epidemiological questionnaire to assess data on socio-demographic, lifestyle, environmental exposure, residential history, personal/family medical history, drug use, and weight information at different ages. The questionnaire is available at http://www.mccspain.org.
Information on dietary data was assessed using a self-administered semi-quantitative food frequency questionnaire (FFQ), which was an adapted version of a Spanish-validated FFQ [39] as it was modified to include regional products. Details on the validation study of this FFQ are provided elsewhere. In brief, the de-attenuated correlation coefficients between the second questionnaire and diet records ranged from 0.45 for vitamin A to 0.91 for alcohol [40]. The MCC-study FFQ included portion sizes and photos to assess dietary information with the timeframe referring to the preceding year. Further, cross-check questions on food groups intakes were designed to adjust the frequency of food consumption and to reduce misreporting of food groups with large numbers of items. A total of 140 items were obtained. Information on total energy intake and intake of both macronutrients and micronutrients, as well as alcohol consumption were derived from Spanish food composition tables and other specific sources [41].

2.3. Dietary Non-Enzymatic Antioxidant Capacity and Dietary Inflammatory Index Assessment

The assessment of the dietary NEAC in the MCC-Study has been previously described in detail [28]. Briefly, for the present study, dietary NEAC was estimated using the Trolox equivalent antioxidant capacity (TEAC-ABTS, referred from now on as TEAC; mmol TE/Kg) using published values of NEAC content in food, and was assessed with and without coffee information. The MCC-study FFQ food items were matched with the corresponding dietary NEAC values, and the average daily NEAC consumption (using TEAC) was estimated for each participant.
DII scores were calculated using a method previously reported by Shivappa et al. [19]. Briefly, the scoring algorithm based on extensive review of the literature focused on the effect of diet on six inflammatory biomarkers (IL-1β, IL-4, IL-6, IL-10, TNF-α, and CRP) from 1950 to 2010. A total of 45 food parameters, including macronutrients and micronutrients, were scored according to whether they increased (+1), decreased (-1), or had no effect (0) on these inflammatory biomarkers. These scores were weighted based on study design. To avoid the arbitrariness resulting from simply using raw consumption amounts, intakes of foods and nutrition were standardized to a representative range of dietary intake based on actual human consumption in 11 populations living in different countries across the world that provided an estimate of a mean and standard deviation for each parameter. These values were converted to a proportion (with values from 0 to 1). Each proportion was doubled, and then 1 was subtracted to achieve a symmetrical distribution around a mean of ≈0. Each of these values was then multiplied by an overall food parameter-specific inflammation score. All the food parameter-specific DII scores were summed to create the overall DII scores for each subject. Energy-adjusted DII (E-DII) scores were calculated by converting raw dietary components to amount per 1000 kcal. To compute the E-DII scores, we relied on an energy-adjusted global database. Higher E-DII scores indicate more pro-inflammatory diets, while lower E-DII scores represent anti-inflammatory diets. In this study, data were available for a total of 30 food parameters (carbohydrate, protein, total fat, alcohol, fiber, cholesterol, saturated fatty acid, monounsaturated fatty acid, polyunsaturated fatty acid, vitamin A, vitamin B1, vitamin B2, vitamin B3, vitamin B6, vitamin B12, vitamin C, vitamin D, vitamin E, folic acid, iron, magnesium, zinc, anthocyanidins, flavan3ols, flavones, flavonols, flavonones, isoflavones, garlic, and onion) to calculate the E-DII scores. E-DII scores were used in all analyses in this study.

2.4. Statistical Analyses

Baseline dietary and sociodemographic characteristics were examined using means and standard deviations (SD) for continuous variables and percentages for categorical variables by CRC and BC cases and controls, and across E-DII quartiles. Differences between cases and controls were assessed using Student’s t-test for continuous variables normally distributed, Wilcoxon rank-sum test for continuous variables non-normally distributed, and Pearson χ² test for categorical variables. The E-DII was analyzed as a continuous variable (one-unit increment) and as a categorical variable, expressed as quartiles based on the sex-specific distribution in the control group (CRC or BC controls). The first E-DII quartile was treated as reference category (meaning lowest inflammatory potential of the diet).
The odds ratios (OR) and the corresponding 95% confidence intervals (95%CI) for the association between E-DII and CRC and BC risk were estimated using unconditional logistic regression models. Analyses also were conducted separately by CRC anatomic subsites (colon and rectum) and BC subtypes (HR+, HER2+, TN). Tests for dose-response trend were estimated by including the exposure variable as continuous ordinal (scored from 1 to 4) in the regression model.
Effect-measure modification by NSAIDs (yes, no), physical activity (inactive, active), BMI (<25, ≥25 kg/m2), and smoking status (never, ever) was evaluated by including interaction terms and by stratified analysis. The models with and without the interaction terms were compared using the likelihood ratio test (LRT).
For analyses where CRC was the main outcome, two different models are presented: (1) A simple model adjusting for age, sex, study area, and educational level (less than primary, primary, high school, university); (2) a final model, additionally adjusting for family history as first-degree relative of CRC (no, yes, unknown), smoking status (never, current, former), BMI (kg/m2) one year before recruitment, leisure-time physical activity calculated for the last 10 years of life, excluding the last 2 years previous to the interview (inactive, moderately active, active, very active), and non-steroidal anti-inflammatory drugs use (NSAIDs; yes, no, unknown).
Likewise, two different models were evaluated to study the relation between E-DII and BC risk: (1) A simple model (previously defined, excepting sex); (2) a final model further adjusted by family history first degree of BC (no, yes, unknown), smoking status, BMI, physical activity, hormonal replacement therapy use (HRT; no, yes, unknown), oral contraceptive use (OC; no, yes, unknown), age at menarche (<13, ≥13 years, unknown), age at first pregnancy (no children, <20, 20–24, 25–29, >29 years), number of children, and menopausal status (premenopausal, postmenopausal).
Potential effect-measure modification of the association between E-DII and BC risk also was assessed using a LRT in the mutually adjusted model by physical activity, BMI, smoking status, menopausal status (premenopausal, postmenopausal), HRT use (yes, no), and OC use (yes, no).
Three sensitivity analyses for both CRC and BC final models were performed: 1) Excluding those participants who had more than 6 months between the data of diagnosis and the interview (final models included 1596 CRC cases and 1140 BC cases); 2) further adjusting the final CRC and BC models by energy intake from non-alcohol sources and alcohol consumption; 3) restricting the analyses to non-drinkers.
To assess the second aim of the present study, two approaches were conducted. First, an inflammatory and antioxidant profile was designed, and it was used as the main exposure variable in both CRC and BC final models. A value of 0, 1, 2, and 3 was assigned to the first, second, third, and fourth quartile of E-DII (lower scores indicate lower inflammatory potential of diet), whereas a value of 3, 2, 1, and 0 was assigned to the first, second, third, and fourth quartile of NEAC (using TEAC; higher score indicates higher antioxidant capacity of diet). When CRC was evaluated, quartiles values were sex-specific. For each participant, the values received were summed to assess the profile score. The profile ranged from 0 (less inflammatory and high antioxidant) to 6 (high inflammatory and less antioxidant). Linear trend tests were used to calculate the OR for the profile as a continuous variable (1 point-increment). Second, a combined categorical variable including both indicators (E-DII and TEAC) was created using median values (sex-specific for CRC). This four-category variable was used as the main exposure variable in final models. Those participants classified having high antioxidant and low inflammatory potential of diet were selected as the reference category. Potential effect-measure modification of the association between E-DII+NEAC score and both cancer outcomes was evaluated by vegetable intake (low, high), all meat intake (low, high), and fiber intake (low, high).
Statistical analyses were conducted using R: A language and environment for statistical computing, version 3.5 (R Core Team, 2018). All statistical tests were two-sided and statistical significance was set at p < 0.05.

3. Results

3.1. Characteristics of Cases and Controls in the MCC-Study

The present study included 1852 CRC and 1486 BC cases, and 3447 and 1652 population controls, respectively. The main characteristics of cases and controls are presented in Table 1. Briefly, CRC cases compared to controls had higher E-DII scores, indicating a more pro-inflammatory diet, tended to be older, heavier, and less active, and more frequently classified as having a low education and a family history of CRC (p < 0.001). BC cases compared to controls also had higher E-DII scores, tended to be younger, and reported more frequently being smokers, premenopausal, and having a first-degree history of BC (p < 0.001). Similar distributions were observed among BC cases and controls regarding HRT, OC use, and age at first pregnancy (p > 0.05).
Characteristics of participants in the control group across quartiles of E-DII are shown in Table 2. Participants in the highest quartile (Q4) were younger, consumed more calories (without considering alcohol) and alcohol, reported being current smokers, and less active compared with those in the lowest quartile (Q1) (p < 0.001). Among female controls, those classified in the Q4 compared with Q1 tended to be premenopausal and were OC but not HRT users. No differences were observed across quartiles regarding age at menarche, age at first pregnancy, and number of children (all p > 0.30).

3.2. E-DII and Colorectal Cancer Risk

The OR and 95% CI for the association between E-DII and CRC risk, as well as according to the location of the tumor and the stratified results, are presented in Table 3. A statistically significant increased CRC risk was observed with increasing E-DII score per 1-point increment both in the minimally (ORE-DII: 1.15, 95%CI: 1.11–1.19) and fully adjusted models (ORE-DII: 1.14, 95%CI: 1.10–1.18). Participants classified at the fourth E-DII quartile were at higher risk of developing CRC (ORQ4vsQ1: 1.93, 95%CI: 1.60–2.32; p-value for trend: <0.001). This association was consistent when colon and rectal CRC subtypes were evaluated using the continuous E-DII variable per 1-point increment (ORE-DII: 1.13, 95%CI: 1.08–1.17, and ORE-DII: 1.17, 95%CI: 1.11–1.22; respectively). Results remained unchanged when we performed the three sensitivity analyses: (1) Excluding those participants who had more than six months between the data of diagnosis and the interview (Table 3); (2) adjusting the final model by energy intake from non-alcohol sources and alcohol consumption (data not shown); and (3) restricting the analyses to non-drinkers (data not shown).
The E-DII score was statistically significant positively associated with CRC risk in both males and females (p-value for trend: <0.001; LRT p-value: 0.04), but higher ORs were observed in men (ORQ4vsQ1: 2.14, 95%CI: 1.68–2.73) than in women (ORQ4vsQ1: 1.57, 95%CI: 1.16–2.13) (Table 3).
Effect-measure modification by BMI, physical activity, NSAIDs/aspirin use, and tobacco smoking was evaluated as these factors are related to inflammation and to CRC risk (Table 3). None of the LRT p-values showed evidence for heterogeneity (all LRT p-values > 0.25).

3.3. E-DII and Breast Cancer Risk

Table 4 displays the crude and adjusted OR and 95% CI for the association between E-DII and overall BC risk and BC subtypes, in addition to stratified analyses. A statistically significant increased BC risk was observed in the minimally adjusted model (ORE-DII: 1.05, 95%CI: 1.01–1.09; ORQ4vsQ1: 1.25, 95%CI: 1.02–1.55; p-value for trend: 0.06) but not in the fully adjusted model, where confidence limits overlapped unity (ORE-DII: 1.04, 95%CI: 1.00–1.08; ORQ4vsQ1: 1.22, 95%CI: 0.99–1.52; p-value for trend: 0.10). Sensitivity analyses did not alter the final model results and even when we excluded those BC cases that had more than six months between the data of diagnosis and the interview, results were not statistically significant (Table 4).
BC subtypes (HR+, HER2+, TN) also were investigated. No associations were found between E-DII (measured both as a continuous and categorical) and HR+ and TN subtypes. A statistically significant increased HER2+ risk was observed when E-DII was evaluated as a categorical variable (ORQ4vsQ1: 1.56, 95%CI: 1.01–2.04); however, there was no evidence of a linear dose response trend (p-value: 0.24) (Table 4).
Despite observing some individual statistically significant ORs among inactive (ORQ4vsQ1: 1.48, 95%CI: 1.04–2.10, p-value for trend: >0.13) and postmenopausal women (ORE-DII: 1.06, 95%CI: 1.01–1.12), no consistent evidence for effect-measure modification was observed by menopausal status, HRT and OC use, BMI, physical activity, and tobacco smoking (all LRT p-values > 0.15) (Table 4).

3.4. E-DII, NEAC, and Colorectal and Breast Cancer Risk

The correlation coefficient between E-DII and NEAC in the MCC-Spain study was −0.32 (p-value < 0.001). The ORs and 95% CI for the association between the inflammatory and antioxidant profile (combining information on E-DII and dietary NEAC) and CRC and BC risk are presented in Table 5. The inflammatory and antioxidant profile ranged from 0 (less inflammatory, high antioxidant) to 6 (high inflammatory and less antioxidant). The continuous variable (1-point increment in the E-DII+NEAC profile) included 1798 CRC cases and 3312 controls and showed a statistically significant 10% increasing risk. Participants classified at the highest category of the score (including 499 cases and 790 controls) compared to the first category (including 642 cases and 1404 controls) had higher risk of developing CRC (ORQ4vsQ1: 1.48, 95%CI: 1.26–1.74; p-value for trend: <0.001).
Results regarding BC risk showed a non-statistically significant increased risk when the profile was evaluated continuously (OR: 1.02, 95%CI: 0.98–1.07), as well as for participants classified at the fourth quartile (399 cases and 388 controls) compared to the first quartile (563 cases and 673 controls) (ORQ4vsQ1: 1.09, 95%CI: 0.90–1.32, p-value for trend: 0.39). Similar results for both outcomes were obtained when the combined categorical variable was used as the main exposure variable (Supplemental Table S1).
No evidence for effect-measure modification was observed in CRC models by low vs. high fiber, vegetables, and meat consumers (all LRT p-values > 0.05; Supplemental Table S2). Likewise, in BC models, none of the LRT p-values showed evidence for heterogeneity when low vs. high fiber and vegetables consumers were evaluated (LRT p-values > 0.28; Supplemental Table S2). However, there was statistically significant heterogeneity by meat intake (LRT p-value: 0.004). Those women who had higher values of meat consumption (above the median: ≥67 grams/day), had a 9% increased BC risk for each increment in the E-DII+NEAC score profile. High meat consumers classified at the highest category of the score (including 270 cases and 207 controls) had higher risk of developing BC (ORQ4vsQ1: 1.43, 95%CI: 1.10–1.85; p-value for trend: <0.001).

4. Discussion

This large case-control study in Spain provided further evidence that a pro-inflammatory diet (measured by the widely used E-DII) was clearly associated with increased CRC risk, and this risk was persistently shared across different tumor locations and all subgroups that were evaluated. Results regarding risk of BC do not support the hypothesis of an association; although non-statistically significant increased risks were observed when E-DII was analyzed both as a continuous variable and by quartiles. This study, including both outcomes, observed no changes when sensitivity analyses were carried out and did not observe evidence for effect-measure modification when subgroups were analyzed.
The epidemiologic evidence on the association between DII and CRC risk has been reported in 4 prospective [42,43,44,45], 5 case-controls studies [46,47,48,49,50], and several meta-analyses [29,30,51,52]. Despite the type of study design (case-control or prospective cohorts), the differences in the total number of food/nutrients items included in the previously reported DII scores, and the different DII-approaches used as the main exposure variable (with and without energy-adjustment), results reflect that a greater dietary inflammatory potential is related to CRC risk, and this effect tends to be more pronounced in men than in women. The present study is the first epidemiologic study that replicates these results using the E-DII score in Spanish populations.
Several dietary components and dietary patterns have been associated with CRC risk [5]. A total of 9 of the 45 possible items that comprise the DII score are pro-inflammatory: energy, carbohydrates, protein, total fat, saturated fat, trans fat, cholesterol, vitamin B12, and iron [19]. Most of these items are related to Western-style diets, which have been associated with inflammation [53]. In agreement with our results, a recent paper from our colleagues, Castelló, et al showed that a high adherence to the Western dietary pattern was statistically significant positive associated with overall CRC risk (ORQ4vsQ1: 1.50, 95%CI: 1.20–1.87), whereas a high adherence to the Mediterranean diet was inversely associated (ORQ4vsQ1: 0.65, 95%CI: 0.53–0.80). Likewise, similar relative risks were observed for both patterns among males and females [54].
The development and progression of BC has been linked, among other parameters, to inflammation [55]. The evidence regarding the association between DII and overall BC risk is still inconclusive despite being evaluated in several prospective cohorts [31,32,56,57,58], case-control studies [59,60,61,62,63], and cancer-specific and general meta-analyses [30,64,65,66]. Although our estimates suggested increased relative risks for the association between E-DII and overall BC, the 95% CIs included the null value. Our highest quartile of E-DII did not include very high E-DII values, and this may have limited our capability to observe statistically significant associations. Moreover, two recent reviews and meta-analysis have observed significant associations between high vs. low inflammatory diet in postmenopausal women but no for premenopausal women [65,66]. The present study also observed a significant association among postmenopausal women when E-DII was evaluated continuously, but no effect-measure modification was observed by menopausal status. Likewise, the observed results may have been influenced by alcohol consumption. During the calculation of the DII and E-DII score, alcohol is negatively weighted (meaning low inflammation), and alcohol consumption is considered an important risk factor for BC [67]. We performed a sensitivity analysis further adjusting for alcohol intake and total energy (without alcohol), and we restricted the analysis to non-drinkers; however, results were not altered. Further studies evaluating BC risk or survival should consider calculating the DII or the E-DII without accounting for alcohol intake.
Our study adds value to the scientific evidence because, up to now, none of the epidemiological studies cited above have evaluated the association between E-DII and cancer risk taking into account the total anti-oxidant dietary content. Dietary NEAC intake has been associated with a decreased risk of CRC in two large case-control studies, including the MCC-study [28,35]; whereas inconclusive results were observed in two prospective cohorts [33,34]. The association between dietary NEAC and BC is also doubtful. To our knowledge, only two studies have reported results: A prospective study showing a significant decreased risk [37] and a case-control study, which observed null associations [36]. Inflammation and oxidative stress are two mechanisms that have been independently related to cancer risk [68,69]; however, they are closely tied [14,70]. The profile score, including information on E-DII and dietary NEAC, showed consistent and significant increased effect estimates of CRC in all categories, as well as per 1-point increment in the score, suggesting that both E-DII and NEAC are linked to CRC risk. However, relative risks were slightly attenuated compared to those obtained when E-DII was used as the main exposure variable. Results for BC risk remained elevated, but not statistically significant. Likewise, a similar pattern was observed; i.e., relative risks were somewhat lower. Similar relative risks were observed when a combined variable (low E-DII and high TEAC vs high E-DII and low TEAC) was used instead of the profile score. This may indicate that E-DII plays a stronger effect on CRC and BC risk than NEAC, or that the E-DII and NEAC profile needs to be assessed in other ways. When the analyses were restricted to high/low consumers of vegetables, fiber, and meat, no evidence for heterogeneity was observed for CRC risk. Similar results were observed for BC risk; however, we found a statistically significant interaction between E-DII+NEAC score and meat intake. Women in the highest quartile of the score and were higher meat consumers were at higher BC risk . Although meat intake per se is not taken into account in the construction of the DII, meat-derived macronutrients and micronutrients are included as pro-inflammatory factors. Thus, higher consumption of meat results in higher E-DII values (and consequently higher E-DII+NEAC values). In addition, this category included more BC cases than controls (270 vs. 207). Meat intake has also been associated with increased BC risk in the MCC-Spain study, especially among postmenopausal women [71]. These findings could indicate a synergistic effect of meat consumption and having a pro-inflammatory and pro-oxidant diet on BC risk. Nonetheless, further research is warranted in this field to confirm these findings.
This study is based on a relatively large sample size that enabled us to investigate specific colorectal and breast tumor subtypes, as well as different subgroups (i.e., menopausal status, physical activity, NSAIDs/aspirin use). Additionally, we have used a valid tool to assess the inflammatory potential of the diet, which has been investigated in many different studies, regions and different outcomes [72].
Notwithstanding its strengths, there are some weaknesses in our study that should be mentioned. Case-control designs are prone to selection and recall biases. The MCC-study was designed with the goal of minimizing selection biases by recruiting population-based controls and cases [38]. Regarding recall bias, the dietary information collected at recruitment referred to the preceding year, and sensitivity analysis were carried out excluding CRC and BC cases diagnosed within less than six months between the date of diagnosis. When we did this, results did not differ substantially. Measurement error also may be present in our dietary data; nonetheless, the MCC-study assessed the dietary information by using a self-reported FFQ validated for Spanish population. As in that work, the DII derived from the MCC-Study was energy-adjusted and included only 30 of the 45 food/nutrient parameters, and we expressed the E-DII as quartiles based on the sex-specific distribution within the control group. Thus, direct comparison to other E-DII/DII quantile categorizations is challenging: Most of the studies assessed the inflammatory potential of the diet using the DII (energy was included in the score or as a covariate in final models); depending on the study, the E-DII/DII score was estimated including different number of food/nutrient parameters; other approaches have been used to estimate E-DII besides the one published by Shivappa et al. [44]; and only a few studies presented sex-specific E-DII/DII values. Despite these limitations, our E-DII range values in men are wider than the ones reported by the case-control study in Iran [73]. In women, our E-DII values are slightly lower than the ones reported by the case-control study in Germany; however, that study only included postmenopausal women [32]. No data on inflammatory biomarkers are available in the MCC-study; therefore, we could not conduct a validation analysis within our study. Finally, it should be acknowledged that several subgroups have been studied (i.e., E-DII and NEAC profile), and thus, some results might be due to chance.

5. Conclusions

In conclusion, the present study adds further evidence on the association between CRC risk and the inflammatory potential of the diet, as well as the combined effect of the inflammatory potential of the diet and its total dietary antioxidant capacity. The increased risk between these dietary scores and BC were not statistically significant. Additional studies with larger sample size should be performed to elucidate any possible association.

Supplementary Materials

The following are available online at https://www.mdpi.com/2072-6643/11/6/1406/s1, Table S1: Association E-DII and dietary NEAC and colorectal and breast cancer in the MCC-Spain Study. Table S2: Stratified analyses: OR and 95%CI for E-DII score and dietary NEAC and colorectal and breast cancer risk in the MCC-Spain Study

Author Contributions

Conceptualization, M.O.-S., D.R., E.G.-L., A.M., E.M.-M., P.A.; methodology, M.O.-S., D.R., E.G.-L., A.M.,E.M.-M., P.A., N.S., J.R.H.; software, E.G.-L., A.M.; formal analysis, M.O.-S., E.G.-L., A.M., E.M.-M.; investigation, M.O.-S., D.R., E.G.-L., A.M., E.M.-M.; P.A.; data curation, E.G.-L., A.M., M.O.-S.; writing—original draft preparation, M.O.-S.; writing—review and editing, D.R., E.G.-L., A.M., E.M.-M.; P.A., N.S., J.R.H., A.T., G.C.-V., F.M., E.G., R.M.-G., M.A., L.G., R.O.-R., M.L.-L., J.A., T.F.-V., V.M. (Vicente Martín), A.J.M., M.E., C.M.-I., B.P., N.A., A.C., J.M.H., T.D.-S., I.G.-A., A.M.-B., V.M. (Victor Moreno), M.P., M.K.; visualization, M.O.-S., D.R., E.G.-L., A.M., E.M.-M.; P.A.; supervision, M.O.-S., D.R., E.G.-L., A.M., E.M.-M.; P.A. All authors read and approved the final version of the manuscript.

Funding

This research was partially funded by the public grants from the Catalan Government (2014SGR756, 2017SGR1085, 2017SGR733, SLT006/17/76), and European Regional Development Fund-ERDF, by the “Acción Transversal del Cancer”, approved on the Spanish Ministry Council on the 11th October 2007, by the Instituto de Salud Carlos III-FEDER (PI08/1770, PI08/0533, PI08/1359, PS09/00773-Cantabria, PS09/01286-León, PS09/01903-Valencia, PS09/02078-Huelva, PS09/ 01662-Granada, PI11/01403, PI11/01889-FEDER, PI11/00226, PI11/01810, PI11/02213, PI12/00488, PI12/00265, PI12/01270, PI12/00715, PI12/00150, PI14/01219, PI14/0613, PI15/00069, PI15/00914, PI15/01032, PI11/01810, PI14/01219, PI11/02213, PIE16/00049, PI17/01179, PI17-00092), by the Fundación Marqués de Valdecilla (API 10/09), by the Red Temática de Investigación del Cáncer (RTICC) del ISCIII(RD12/0036/0036), by the Junta de Castilla y León (LE22A10-2), by the Consejería de Salud of the Junta de Andalucía (PI-0571-2009, PI-0306-2011, salud201200057018tra), by the Conselleria de Sanitat of the Generalitat Valenciana (AP_061/10), by the Recercaixa (2010ACUP00310), by the Regional Government of the Basque Country, by the Consejería de Sanidad de la Región de Murcia, by the European Commission grants FOOD-CT-2006-036224-HIWATE, by the Spanish Association Against Cancer (AECC) Scientific Foundation – grant GCTRA18022MORE, by the Catalan Government-Agency for Management of University and Research Grants (AGAUR) grants 2014SGR647, 2014SGR850 and 2017SGR723. Sample collection of this work was supported by the Xarxa de Bancs de Tumors de Catalunya sponsored by Pla Director d’Oncología de Catalunya (XBTC)”, Plataforma Biobancos PT13/0010/0013" and ICOBIOBANC, sponsored by the Catalan Institute of Oncology. We thank CERCA Program, Generalitat de Catalunya for institutional support. Mireia Obón-Santacana received a post-doctoral fellow from “Fundación Científica de la Asociación Española Contra el Cáncer (AECC)”.

Acknowledgments

We appreciate the collaboration of all those who participated providing questionnaire data. We thank all MCC-Spain study group members and collaborators.

Conflicts of Interest

James R. Hébert owns controlling interest in Connecting Health Innovations LLC (CHI), a company that has licensed the right to his invention of the dietary inflammatory index (DII®) from the University of South Carolina in order to develop computer and smartphone applications for patient counseling and dietary intervention in clinical settings. Nitin Shivappa is an employee of CHI. The subject matter of this paper will not have any direct bearing on that work, nor has that activity exerted any influence on this project. The authors have no other potential competing interest to disclose. The funders had no role in the design of the study; in the collection, analyses, or interpretation of data; in the writing of the manuscript, or in the decision to publish the results.

References

  1. Bray, F.; Ferlay, J.; Soerjomataram, I.; Siegel, R.L.; Torre, L.A.; Jemal, A. Global cancer statistics 2018: GLOBOCAN estimates of incidence and mortality worldwide for 36 cancers in 185 countries. CA Cancer J. Clin. 2018, 68, 394–424. [Google Scholar] [CrossRef] [PubMed] [Green Version]
  2. Brenner, H.; Chen, C. The colorectal cancer epidemic: Challenges and opportunities for primary, secondary and tertiary prevention. Br. J. Cancer 2018, 119, 785–792. [Google Scholar] [CrossRef] [PubMed]
  3. Fagunwa, I.O.; Loughrey, M.B.; Coleman, H.G. Alcohol, smoking and the risk of premalignant and malignant colorectal neoplasms. Best Pract. Res. Clin. Gastroenterol. 2017, 31, 561–568. [Google Scholar] [CrossRef] [PubMed] [Green Version]
  4. Marley, A.R.; Nan, H. Epidemiology of colorectal cancer. Int. J. Mol. Epidemiol. Genet. 2016, 7, 105–114. [Google Scholar] [PubMed]
  5. World Cancer Research Fund International/American Institute for Cancer Research. Continuous Update Project Report: Diet, Nutrition, Physical Activity and Colorectal Cancer; World Cancer Research Fund International/American Institute for Cancer Research: Arlington, VA, USA, 2017. [Google Scholar]
  6. Ferlay, J.; Soerjomataram, I.; Dikshit, R.; Eser, S.; Mathers, C.; Rebelo, M.; Parkin, D.M.; Forman, D.; Bray, F. Cancer incidence and mortality worldwide: Sources, methods and major patterns in GLOBOCAN 2012. Int. J. Cancer 2015, 136, E359–E386. [Google Scholar] [CrossRef] [PubMed]
  7. Torre, L.A.; Islami, F.; Siegel, R.L.; Ward, E.M.; Jemal, A. Global Cancer in Women: Burden and Trends. Cancer Epidemiol. Biomark. Prev. Publ. Am. Assoc. Cancer Res. Cosponsored Am. Soc. Prev. Oncol. 2017, 26, 444–457. [Google Scholar] [CrossRef] [PubMed]
  8. Gray, J.M.; Rasanayagam, S.; Engel, C.; Rizzo, J. State of the evidence 2017: An update on the connection between breast cancer and the environment. Environ. Health 2017, 16. [Google Scholar] [CrossRef]
  9. World Cancer Research Fund International/American Institute for Cancer Research. Continuous Update Project Report: Diet, Nutrition, Physical Activity and Breast Cancer; World Cancer Research Fund International/American Institute for Cancer Research: Arlington, VA, USA, 2018. [Google Scholar]
  10. Sosa, V.; Moliné, T.; Somoza, R.; Paciucci, R.; Kondoh, H.; LLeonart, M.E. Oxidative stress and cancer: An overview. Ageing Res. Rev. 2013, 12, 376–390. [Google Scholar] [CrossRef]
  11. Eiró, N.; Vizoso, F.J. Inflammation and cancer. World J. Gastrointest. Surg. 2012, 4, 62–72. [Google Scholar] [CrossRef]
  12. Kang, D.-H. Oxidative stress, DNA damage, and breast cancer. AACN Clin. Issues 2002, 13, 540–549. [Google Scholar] [CrossRef]
  13. Carini, F.; Mazzola, M.; Rappa, F.; Jurjus, A.; Geagea, A.G.; Al Kattar, S.; Bou-Assi, T.; Jurjus, R.; Damiani, P.; Leone, A.; et al. Colorectal Carcinogenesis: Role of Oxidative Stress and Antioxidants. Anticancer Res. 2017, 37, 4759–4766. [Google Scholar] [PubMed] [Green Version]
  14. Reuter, S.; Gupta, S.C.; Chaturvedi, M.M.; Aggarwal, B.B. Oxidative stress, inflammation, and cancer: How are they linked? Free Radic. Biol. Med. 2010, 49, 1603–1616. [Google Scholar] [CrossRef] [PubMed] [Green Version]
  15. Bartsch, H.; Nair, J. Chronic inflammation and oxidative stress in the genesis and perpetuation of cancer: Role of lipid peroxidation, DNA damage, and repair. Langenbecks Arch. Surg. 2006, 391, 499–510. [Google Scholar] [CrossRef] [PubMed]
  16. Barbaresko, J.; Koch, M.; Schulze, M.B.; Nöthlings, U. Dietary pattern analysis and biomarkers of low-grade inflammation: A systematic literature review. Nutr. Rev. 2013, 71, 511–527. [Google Scholar] [CrossRef]
  17. Haghighatdoost, F.; Bellissimo, N.; Totosy de Zepetnek, J.O.; Rouhani, M.H. Association of vegetarian diet with inflammatory biomarkers: A systematic review and meta-analysis of observational studies. Public Health Nutr. 2017, 20, 2713–2721. [Google Scholar] [CrossRef] [PubMed]
  18. Estruch, R. Anti-inflammatory effects of the Mediterranean diet: The experience of the PREDIMED study. Proc. Nutr. Soc. 2010, 69, 333–340. [Google Scholar] [CrossRef] [PubMed]
  19. Shivappa, N.; Steck, S.E.; Hurley, T.G.; Hussey, J.R.; Hébert, J.R. Designing and developing a literature-derived, population-based dietary inflammatory index. Public Health Nutr. 2014, 17, 1689–1696. [Google Scholar] [CrossRef]
  20. Shivappa, N.; Steck, S.E.; Hurley, T.G.; Hussey, J.R.; Ma, Y.; Ockene, I.S.; Tabung, F.; Hébert, J.R. A population-based dietary inflammatory index predicts levels of C-reactive protein in the Seasonal Variation of Blood Cholesterol Study (SEASONS). Public Health Nutr. 2014, 17, 1825–1833. [Google Scholar] [CrossRef]
  21. Wirth, M.D.; Shivappa, N.; Davis, L.; Hurley, T.G.; Ortaglia, A.; Drayton, R.; Blair, S.N.; Hébert, J.R. Construct Validation of the Dietary Inflammatory Index among African Americans. J. Nutr. Health Aging 2017, 21, 487–491. [Google Scholar] [CrossRef]
  22. Shivappa, N.; Wirth, M.D.; Murphy, E.A.; Hurley, T.G.; Hébert, J.R. Association between the Dietary Inflammatory Index (DII) and urinary enterolignans and C-reactive protein from the National Health and Nutrition Examination Survey-2003–2008. Eur. J. Nutr. 2019, 58, 797–805. [Google Scholar] [CrossRef]
  23. Bodén, S.; Wennberg, M.; Van Guelpen, B.; Johansson, I.; Lindahl, B.; Andersson, J.; Shivappa, N.; Hebert, J.R.; Nilsson, L.M. Dietary inflammatory index and risk of first myocardial infarction; a prospective population-based study. Nutr. J. 2017, 16, 21. [Google Scholar] [CrossRef] [PubMed]
  24. Shivappa, N.; Hébert, J.R.; Rietzschel, E.R.; De Buyzere, M.L.; Langlois, M.; Debruyne, E.; Marcos, A.; Huybrechts, I. Associations between dietary inflammatory index and inflammatory markers in the Asklepios Study. Br. J. Nutr. 2015, 113, 665–671. [Google Scholar] [CrossRef] [PubMed] [Green Version]
  25. Shivappa, N.; Hebert, J.R.; Marcos, A.; Diaz, L.-E.; Gomez, S.; Nova, E.; Michels, N.; Arouca, A.; González-Gil, E.; Frederic, G.; et al. Association between dietary inflammatory index and inflammatory markers in the HELENA study. Mol. Nutr. Food Res. 2017, 61. [Google Scholar] [CrossRef] [PubMed]
  26. Tan, B.L.; Norhaizan, M.E.; Liew, W.-P.-P. Nutrients and Oxidative Stress: Friend or Foe? Oxid. Med. Cell. Longev. 2018, 2018. [Google Scholar] [CrossRef]
  27. Serafini, M.; Del Rio, D. Understanding the association between dietary antioxidants, redox status and disease: Is the Total Antioxidant Capacity the right tool? Redox Rep. Commun. Free Radic. Res. 2004, 9, 145–152. [Google Scholar] [CrossRef]
  28. Amiano, P.; Molina-Montes, E.; Molinuevo, A.; Huerta, J.-M.; Romaguera, D.; Gracia, E.; Martín, V.; Castaño-Vinyals, G.; Pérez-Gómez, B.; Moreno, V.; et al. Association study of dietary non-enzymatic antioxidant capacity (NEAC) and colorectal cancer risk in the Spanish Multicase-Control Cancer (MCC-Spain) study. Eur. J. Nutr. 2018. [Google Scholar] [CrossRef]
  29. Shivappa, N.; Godos, J.; Hébert, J.R.; Wirth, M.D.; Piuri, G.; Speciani, A.F.; Grosso, G. Dietary Inflammatory Index and Colorectal Cancer Risk-A Meta-Analysis. Nutrients 2017, 9, 1043. [Google Scholar] [CrossRef]
  30. Namazi, N.; Larijani, B.; Azadbakht, L. Association between the dietary inflammatory index and the incidence of cancer: A systematic review and meta-analysis of prospective studies. Public Health 2018, 164, 148–156. [Google Scholar] [CrossRef]
  31. Shivappa, N.; Sandin, S.; Löf, M.; Hébert, J.R.; Adami, H.-O.; Weiderpass, E. Prospective study of dietary inflammatory index and risk of breast cancer in Swedish women. Br. J. Cancer 2015, 113, 1099–1103. [Google Scholar] [CrossRef] [Green Version]
  32. Ge, I.; Rudolph, A.; Shivappa, N.; Flesch-Janys, D.; Hébert, J.R.; Chang-Claude, J. Dietary inflammation potential and postmenopausal breast cancer risk in a German case-control study. Breast (Edinb. Scotl.) 2015, 24, 491–496. [Google Scholar] [CrossRef]
  33. Vece, M.M.; Agnoli, C.; Grioni, S.; Sieri, S.; Pala, V.; Pellegrini, N.; Frasca, G.; Tumino, R.; Mattiello, A.; Panico, S.; et al. Dietary Total Antioxidant Capacity and Colorectal Cancer in the Italian EPIC Cohort. PLoS ONE 2015, 10, e0142995. [Google Scholar] [CrossRef] [PubMed]
  34. Mekary, R.A.; Wu, K.; Giovannucci, E.; Sampson, L.; Fuchs, C.; Spiegelman, D.; Willett, W.C.; Smith-Warner, S.A. Total antioxidant capacity intake and colorectal cancer risk in the Health Professionals Follow-up Study. Cancer Causes Control 2010, 21, 1315–1321. [Google Scholar] [CrossRef] [PubMed] [Green Version]
  35. La Vecchia, C.; Decarli, A.; Serafini, M.; Parpinel, M.; Bellocco, R.; Galeone, C.; Bosetti, C.; Zucchetto, A.; Polesel, J.; Lagiou, P.; et al. Dietary total antioxidant capacity and colorectal cancer: A large case-control study in Italy. Int. J. Cancer 2013, 133, 1447–1451. [Google Scholar] [CrossRef] [PubMed]
  36. Karimi, Z.; Bahadoran, Z.; Abedini, S.; Houshyar-Rad, A.; Rashidkhani, B. Dietary total antioxidant capacity and the risk of breast cancer: A case-control study. East. Mediterr. Health J. Rev. (Sante Mediterr. Orient. Al-Majallah Al-Sihhiyah Li-Sharq Al-Mutawassit) 2015, 21, 564–571. [Google Scholar] [CrossRef]
  37. Pantavos, A.; Ruiter, R.; Feskens, E.F.; de Keyser, C.E.; Hofman, A.; Stricker, B.H.; Franco, O.H.; Kiefte-de Jong, J.C. Total dietary antioxidant capacity, individual antioxidant intake and breast cancer risk: The Rotterdam Study. Int. J. Cancer 2015, 136, 2178–2186. [Google Scholar] [CrossRef]
  38. Castaño-Vinyals, G.; Aragonés, N.; Pérez-Gómez, B.; Martín, V.; Llorca, J.; Moreno, V.; Altzibar, J.M.; Ardanaz, E.; de Sanjosé, S.; Jiménez-Moleón, J.J.; et al. Population-based multicase-control study in common tumors in Spain (MCC-Spain): Rationale and study design. Gac. Sanit. 2015, 29, 308–315. [Google Scholar] [CrossRef] [PubMed]
  39. García-Closas, R.; García-Closas, M.; Kogevinas, M.; Malats, N.; Silverman, D.; Serra, C.; Tardón, A.; Carrato, A.; Castaño-Vinyals, G.; Dosemeci, M.; et al. Food, nutrient and heterocyclic amine intake and the risk of bladder cancer. Eur. J. Cancer 2007, 43, 1731–1740. [Google Scholar] [CrossRef]
  40. Martin-Moreno, J.M.; Boyle, P.; Gorgojo, L.; Maisonneuve, P.; Fernandez-Rodriguez, J.C.; Salvini, S.; Willett, W.C. Development and validation of a food frequency questionnaire in Spain. Int. J. Epidemiol. 1993, 22, 512–519. [Google Scholar] [CrossRef]
  41. Farran, A.; Zamora, R.; Cervera, P. CESNID. Tablas de Composicion de Alimentos del CESNID.; McGraw-Hill Interamericana: Madrid, Spain, 2004. [Google Scholar]
  42. Harmon, B.E.; Wirth, M.D.; Boushey, C.J.; Wilkens, L.R.; Draluck, E.; Shivappa, N.; Steck, S.E.; Hofseth, L.; Haiman, C.A.; Le Marchand, L.; et al. The Dietary Inflammatory Index Is Associated with Colorectal Cancer Risk in the Multiethnic Cohort. J. Nutr. 2017, 147, 430–438. [Google Scholar] [CrossRef]
  43. Shivappa, N.; Prizment, A.E.; Blair, C.K.; Jacobs, D.R.; Steck, S.E.; Hébert, J.R. Dietary inflammatory index and risk of colorectal cancer in the Iowa Women’s Health Study. Cancer Epidemiol. Biomark. Prev. Publ. Am. Assoc. Cancer Res. Cosponsored Am. Soc. Prev. Oncol. 2014, 23, 2383–2392. [Google Scholar] [CrossRef]
  44. Tabung, F.K.; Steck, S.E.; Ma, Y.; Liese, A.D.; Zhang, J.; Caan, B.; Hou, L.; Johnson, K.C.; Mossavar-Rahmani, Y.; Shivappa, N.; et al. The association between dietary inflammatory index and risk of colorectal cancer among postmenopausal women: Results from the Women’s Health Initiative. Cancer Causes Control 2015, 26, 399–408. [Google Scholar] [CrossRef]
  45. Wirth, M.D.; Shivappa, N.; Steck, S.E.; Hurley, T.G.; Hébert, J.R. The dietary inflammatory index is associated with colorectal cancer in the National Institutes of Health-American Association of Retired Persons Diet and Health Study. Br. J. Nutr. 2015, 113, 1819–1827. [Google Scholar] [CrossRef]
  46. Kim, J.; Cho, Y.A.; Kim, D.-H.; Lee, B.-H.; Hwang, D.-Y.; Jeong, J.; Lee, H.-J.; Matsuo, K.; Tajima, K.; Ahn, Y.-O. Dietary intake of folate and alcohol, MTHFR C677T polymorphism, and colorectal cancer risk in Korea. Am. J. Clin. Nutr. 2012, 95, 405–412. [Google Scholar] [CrossRef] [Green Version]
  47. Sharma, I.; Zhu, Y.; Woodrow, J.R.; Mulay, S.; Parfrey, P.S.; Mclaughlin, J.R.; Hebert, J.R.; Shivappa, N.; Li, Y.; Zhou, X.; et al. Inflammatory diet and risk for colorectal cancer: A population-based case-control study in Newfoundland, Canada. Nutrition (Burbank Los Angel. Cty. Calif.) 2017, 42, 69–74. [Google Scholar] [CrossRef]
  48. Shivappa, N.; Hébert, J.R.; Steck, S.E.; Hofseth, L.J.; Shehadah, I.; Bani-Hani, K.E.; Al-Jaberi, T.; Al-Nusairr, M.; Heath, D.; Tayyem, R. Dietary inflammatory index and odds of colorectal cancer in a case-control study from Jordan. Appl. Physiol. Nutr. Metab. Physiol. Appl. Nutr. Metab. 2017, 42, 744–749. [Google Scholar] [CrossRef]
  49. Shivappa, N.; Zucchetto, A.; Montella, M.; Serraino, D.; Steck, S.E.; La Vecchia, C.; Hébert, J.R. Inflammatory potential of diet and risk of colorectal cancer: A case-control study from Italy. Br. J. Nutr. 2015, 114, 152–158. [Google Scholar] [CrossRef]
  50. Zamora-Ros, R.; Shivappa, N.; Steck, S.E.; Canzian, F.; Landi, S.; Alonso, M.H.; Hébert, J.R.; Moreno, V. Dietary inflammatory index and inflammatory gene interactions in relation to colorectal cancer risk in the Bellvitge colorectal cancer case-control study. Genes Nutr. 2015, 10, 447. [Google Scholar] [CrossRef]
  51. Fan, Y.; Jin, X.; Man, C.; Gao, Z.; Wang, X. Meta-analysis of the association between the inflammatory potential of diet and colorectal cancer risk. Oncotarget 2017, 8, 59592–59600. [Google Scholar] [CrossRef]
  52. Zhang, C.; Wang, W.; Zhang, D. Association Between Dietary Inflammation Index and The Risk of Colorectal Cancer: A Meta-Analysis. Nutr. Cancer 2018, 70, 14–22. [Google Scholar] [CrossRef]
  53. Wirth, M.; Burch, J.; Shivappa, N.; Violanti, J.M.; Burchfiel, C.M.; Fekedulegn, D.; Andrew, M.E.; Hartley, T.A.; Miller, D.B.; Mnatsakanova, A.; et al. Association of a Dietary Inflammatory Index with Inflammatory Indices and the Metabolic Syndrome among Police Officers. J. Occup. Environ. Med. Am. Coll. Occup. Environ. Med. 2014, 56, 986–989. [Google Scholar] [CrossRef]
  54. Castelló, A.; Amiano, P.; Fernández de Larrea, N.; Martín, V.; Alonso, M.H.; Castaño-Vinyals, G.; Pérez-Gómez, B.; Olmedo-Requena, R.; Guevara, M.; Fernandez-Tardon, G.; et al. Low adherence to the western and high adherence to the Mediterranean dietary patterns could prevent colorectal cancer. Eur. J. Nutr. 2018, 58, 1495–1505. [Google Scholar] [CrossRef]
  55. Allen, M.D.; Jones, L.J. The role of inflammation in progression of breast cancer: Friend or foe? (Review). Int. J. Oncol. 2015, 47, 797–805. [Google Scholar] [CrossRef]
  56. Graffouillère, L.; Deschasaux, M.; Mariotti, F.; Neufcourt, L.; Shivappa, N.; Hébert, J.R.; Wirth, M.D.; Latino-Martel, P.; Hercberg, S.; Galan, P.; et al. The Dietary Inflammatory Index Is Associated with Prostate Cancer Risk in French Middle-Aged Adults in a Prospective Study. J. Nutr. 2016, 146, 785–791. [Google Scholar] [CrossRef]
  57. Shivappa, N.; Blair, C.K.; Prizment, A.E.; Jacobs, D.R.; Hébert, J.R. Prospective study of the dietary inflammatory index and risk of breast cancer in postmenopausal women. Mol. Nutr. Food Res. 2017, 61. [Google Scholar] [CrossRef]
  58. Tabung, F.K.; Steck, S.E.; Liese, A.D.; Zhang, J.; Ma, Y.; Caan, B.; Chlebowski, R.T.; Freudenheim, J.L.; Hou, L.; Mossavar-Rahmani, Y.; et al. Association between dietary inflammatory potential and breast cancer incidence and death: Results from the Women’s Health Initiative. Br. J. Cancer 2016, 114, 1277–1285. [Google Scholar] [CrossRef]
  59. Huang, W.-Q.; Mo, X.-F.; Ye, Y.-B.; Shivappa, N.; Lin, F.-Y.; Huang, J.; Hébert, J.R.; Yan, B.; Zhang, C.-X. A higher Dietary Inflammatory Index score is associated with a higher risk of breast cancer among Chinese women: A case-control study. Br. J. Nutr. 2017, 117, 1358–1367. [Google Scholar] [CrossRef]
  60. Shivappa, N.; Hébert, J.R.; Rosato, V.; Montella, M.; Serraino, D.; La Vecchia, C. Association between the dietary inflammatory index and breast cancer in a large Italian case-control study. Mol. Nutr. Food Res. 2017, 61. [Google Scholar] [CrossRef]
  61. Gardeazabal, I.; Ruiz-Canela, M.; Sánchez-Bayona, R.; Romanos-Nanclares, A.; Aramendía-Beitia, J.M.; Shivappa, N.; Hébert, J.R.; Martínez-González, M.A.; Toledo, E. Dietary inflammatory index and incidence of breast cancer in the SUN project. Clin. Nutr. (Edinb. Scotl.) 2018. [Google Scholar] [CrossRef]
  62. Vahid, F.; Shivappa, N.; Hatami, M.; Sadeghi, M.; Ameri, F.; Naeini, Y.J.; Hebert, J.R.; Davoodi, S.H. Association between Dietary Inflammatory Index (DII) and Risk of Breast Cancer: A Case-Control Study. Asian Pac. J. Cancer Prev. 2018, 19, 1215–1221. [Google Scholar]
  63. Jalali, S.; Shivappa, N.; Hébert, J.R.; Heidari, Z.; Hekmatdoost, A.; Rashidkhani, B. Dietary Inflammatory Index and Odds of Breast Cancer in a Case-Control Study from Iran. Nutr. Cancer 2018, 70, 1034–1042. [Google Scholar] [CrossRef]
  64. Jayedi, A.; Emadi, A.; Shab-Bidar, S. Dietary Inflammatory Index and Site-Specific Cancer Risk: A Systematic Review and Dose-Response  Meta-Analysis. Adv. Nutr. (Bethesda Md.) 2018, 9, 388–403. [Google Scholar] [CrossRef]
  65. Moradi, S.; Issah, A.; Mohammadi, H.; Mirzaei, K. Associations between dietary inflammatory index and incidence of breast and prostate cancer: A systematic review and meta-analysis. Nutrition (Burbank Los Angel. Cty. Calif.) 2018, 55–56, 168–178. [Google Scholar] [CrossRef]
  66. Wang, L.; Liu, C.; Zhou, C.; Zhuang, J.; Tang, S.; Yu, J.; Tian, J.; Feng, F.; Liu, L.; Zhang, T.; et al. Meta-analysis of the association between the dietary inflammatory index (DII) and breast cancer risk. Eur. J. Clin. Nutr. 2019, 73, 509–517. [Google Scholar] [CrossRef]
  67. World Cancer Research Fund International/American Institute for Cancer Research. Continuous Update Project Expert Report 2018. Alcoholic Drinks and the Risk of Cancer; World Cancer Research Fund International/American Institute for Cancer Research: Arlington, VA, USA, 2018. [Google Scholar]
  68. Hanahan, D.; Weinberg, R.A. Hallmarks of cancer: The next generation. Cell 2011, 144, 646–674. [Google Scholar] [CrossRef]
  69. Pavlova, N.N.; Thompson, C.B. The Emerging Hallmarks of Cancer Metabolism. Cell Metab. 2016, 23, 27–47. [Google Scholar] [CrossRef] [Green Version]
  70. Federico, A.; Morgillo, F.; Tuccillo, C.; Ciardiello, F.; Loguercio, C. Chronic inflammation and oxidative stress in human carcinogenesis. Int. J. Cancer 2007, 121, 2381–2386. [Google Scholar] [CrossRef]
  71. Boldo, E.; Castelló, A.; Aragonés, N.; Amiano, P.; Pérez-Gómez, B.; Castaño-Vinyals, G.; Martín, V.; Guevara, M.; Urtiaga, C.; Dierssen-Sotos, T.; et al. Meat intake, methods and degrees of cooking and breast cancer risk in the MCC-Spain study. Maturitas 2018, 110, 62–70. [Google Scholar] [CrossRef] [Green Version]
  72. Hébert, J.R.; Shivappa, N.; Wirth, M.D.; Hussey, J.R.; Hurley, T.G. Perspective: The Dietary Inflammatory Index (DII)-Lessons Learned, Improvements Made, and Future Directions. Adv. Nutr. (Bethesda Md.) 2019, 10, 185–195. [Google Scholar] [CrossRef]
  73. Rafiee, P.; Shivappa, N.; Hébert, J.R.; Nasab, S.J.; Bahrami, A.; Hekmatdoost, A.; Rashidkhani, B.; Sadeghi, A.; Houshyari, M.; Hejazi, E. Dietary Inflammatory Index and Odds of Colorectal Cancer and Colorectal Adenomatous Polyps in A Case-Control Study from Iran. Nutrients 2019, 11, 1213. [Google Scholar] [CrossRef]
Figure 1. Flow chart of study population selection.
Nutrients 11 01406 g001
Table 1. Characteristics of colorectal cancer and breast cancer cases and controls in the Multi Case-Control Study in Spain (MCC-Spain). Numbers may differ due to missing values.
Colorectal Cancer Study (n = 5299)Breast Cancer Study (n = 3138)
ControlsCRC Casesp-Value 1ControlsBC Casesp-Value 1
mean(sd)/N(%)mean(sd)/N(%)mean(sd)/N(%)mean(sd)/N(%)
Sex
Male1781 (51.7%)1183 (63.9%)<0.001--
Female1666 (48.3%)669 (36.1%) 1652 (52.6)1486 (47.4)
E-DII score−0.39 (1.9)0.03 (1.9) <0.001−0.75 (1.8)−0.50 (1.9)<0.001
Total dietary NEAC (without coffee)
TEAC (µmol TE/day)4.01 (1.83) 3.96 (1.82) 0.333.74 (1.68) 3.75 (1.72) 0.98
Age (years)63.2 (11.7) 66.8 (10.6) <0.001259.0 (13.0) 56.2 (12.4) <0.001
BMI (kg/m2)26.6 (4.4) 27.6 (4.5) <0.00125.7 (4.8) 25.9 (4.6) 0.40
Energy intake (without alcohol; kcal/day)1805 (535)1900 (588) <0.0011727 (499)1808 (529)<0.001
Ethanol intake (g/day)11.0 (15.9)12.0 (19.3) <0.0012 4.97 (8.2)5.16 (9.3) 0.29 2
Physical activity
Inactive1316 (38.6%)949 (51.2%) <0.001628 (38.3%) 613 (41.3%) 0.40
Moderately active501 (14.7%) 214 (11.6%) 305 (18.6%) 256 (17.2%)
Active416 (12.2%) 159 (8.59%) 214 (13.1%) 190 (12.8%)
Very active1178 (34.5%)530 (28.6%) 491 (30.0%) 427 (28.7%)
Education level
Less than primary604 (17.5%) 578 (31.2%)<0.001272 (16.5%) 209 (14.1%) 0.07
Primary1120 (32.5%)715 (38.6%)500 (30.3%) 491 (33.0%)
High school992 (28.8%) 373 (20.1%)520 (31.5%) 492 (33.1%)
University731 (21.2%) 186 (10.0%)360 (21.8%) 294 (19.8%)
Tobacco smoking
Never smoker1522 (44.3%)766 (41.6%)<0.001991 (60.1%) 822 (55.5%) 0.004
Former smoker1204 (35.1%)747 (40.6%)330 (20.0%) 294 (19.8%)
Current smoker709 (20.6%) 329 (17.9%)329 (19.9%) 366 (24.7%)
Family history 3
Yes297 (8.62%) 304 (16.4%)<0.001144 (8.72%) 218 (14.7%) <0.001
No2960 (85.9%)1415 (76.4%)1441 (87.2%)1232 (82.9%)
Missing-Unknown190 (5.5%) 133 (7.2%) 67 (4.1%) 36 (2.4%)
Use of NSAIDs/aspirin
Yes1334 (38.7%)604 (32.6%)<0.001--
No2000 (58.0%)1184 (63.9%)--
Missing113 (3.3%) 64 (3.46%)
Hormone replacement therapy use
Never-- 1469 (88.9%)1347 (90.6%)0.15
Ever-- 126 (7.6%) 104 (7.0%)
Not Known (or not remember)-- 57 (3.5%) 35 (2.4%)
Oral contraceptive use
No-- 839 (50.8%) 772 (52.0%) 0.52
Yes-- 812 (49.2%) 712 (48.0%)
Age at menarche
<13 years old-- 667 (40.4%) 630 (42.4%) <0.001
≥13 years old-- 925 (56.0%) 837 (56.3%)
Not known-- 60 (3.6%) 19 (1.3%)
Number of children 1.9 (1.5) 1.7 (1.3)<0.001 2
Age at first pregnancy
Nulliparous-- 310 (18.8%) 317 (21.5%) 0.33
<20 years-- 58 (3.53%) 59 (4.0%)
20–24 years-- 407 (24.7%) 345 (23.4%)
25–29 years-- 537 (32.6%) 454 (30.8%)
>29 years-- 333 (20.2%) 301 (20.4%)
Menopausal status
Premenopausal-- 476 (28.8%) 532 (35.8%) <0.001
Postmenopausal-- 1175 (71.2%)953 (64.2%)
BC, breast cancer; BMI, body mass index; CRC, colorectal cancer; E-DII; energy-adjusted dietary inflammatory index; MCC, Multi-case-control Spain study; Non-enzymatic antioxidant capacity, NEAC; NSADs, nonsteroidal anti-inflammatory drugs; TE, Trolox equivalents. 1 p-value obtained by Student t-test for continuous variables normally distributed or chi-squared test for categorical variables unless otherwise indicated. 2 p-value obtained by Wilcoxon rank-sum test for continuous variables non-normally distributed. 3 Only first relative degree colorectal cancers or breast cancer.
Table 2. Characteristics of participants in the control group (n = 3576) according to categories of the energy-adjusted dietary inflammatory index (E-DII) score (based on the quartile distribution in controls).
Variables Q1
N = 894
Q2
N = 895
Q3
N = 892
Q4
N = 895
p-Value 1n
Men(−5.11, −1.49)(−1.49, −0.167)(−0.167, 1.41)(1.41, 5.47)
Women(−5.64, −2.15)(−2.15, −1.01)(−1.01, 0.426)(0.426, 5.12)
mean(sd) / N(%)mean(sd) / N(%)mean(sd) / N(%)mean(sd) / N(%)
Age 65.3 (10.8)64.5 (11.1)63.0 (12.0)58.6 (13.0)<0.001 23576
BMI (kg/m2) 26.9 (4.4)26.7 (4.43)26.4 (4.3)26.4 (4.52)0.053576
Energy intake (without alcohol; kcal/day) 1627 (471) 1776 (495) 1841 (528) 1966 (581) <0.0013576
Ethanol intake (g/day) 9.4 (12.8)9.5 (13.3)11.3 (16.6)13.6 (19.3)<0.001 23576
Total dietary NEAC (without coffee)
TEAC (µmol TE/day) 4.76 (1.95)4.25 (1.74)3.82 (1.68)3.17 (1.53)<0.0013450
Sex 13576
Men 455 (50.9%)456 (50.9%)455 (51.0%)456 (50.9%)
Women 439 (49.1%)439 (49.1%)437 (49.0%)439 (49.1%)
Education <0.0013576
Less than primary school 171 (19.1%)169 (18.9%)147 (16.5%)130 (14.5%)
Primary school 298 (33.3%)299 (33.4%)301 (33.7%)245 (27.4%)
Secondary school 241 (27.0%)233 (26.0%)259 (29.0%)316 (35.3%)
University 184 (20.6%)194 (21.7%)185 (20.7%)204 (22.8%)
Tobacco smoking <0.0013562
Never smoker 445 (49.9%)427 (48.0%)389 (43.7%)328 (36.8%)
Former smoker 316 (35.5%)333 (37.5%)312 (35.1%)278 (31.2%)
Current smoker 130 (14.6%)129 (14.5%)189 (21.2%)286 (32.1%)
Physical activity <0.0013540
Inactive 314 (35.4%)303 (34.2%)336 (38.1%)405 (45.9%)
Moderately active 119 (13.4%)137 (15.4%)135 (15.3%)139 (15.7%)
Active 107 (12.1%)122 (13.8%)102 (11.6%)102 (11.6%)
Very active 347 (39.1%)325 (36.6%)310 (35.1%)237 (26.8%)
Use of NSAIDs/aspirin 0.323576
Yes 346 (38.7%)335 (37.4%)353 (39.6%)356 (39.8%)
No 515 (57.6%)522 (58.3%)512 (57.4%)519 (58.0%)
Missing 33 (3.7%) 38 (4.3%) 27 (3.0%) 20 (2.2%)
Hormone replacement therapy use 0.011754
Never 377 (85.9%)383 (87.2%)393 (89.9%)407 (92.7%)
Ever 38 (8.7%) 40 (9.1%) 28 (6.4%) 26 (5.9%)
Not Known (or not remember) 24 (5.5%) 16 (3.6%) 16 (3.7%) 6 (1.4%)
Oral contraceptive use <0.0011753
No 251 (57.2%)247 (56.4%)209 (47.8%)196 (44.6%)
Yes 188 (42.8%)191 (43.6%)228 (52.2%)243 (55.4%)
Age at menarche 0.301754
<13 172 (39.2%)179 (40.8%)166 (38.0%)194 (44.2%)
≥13 247 (56.3%)240 (54.7%)259 (59.3%)231 (52.6%)
Missing 20 (4.6%) 20 (4.6%) 12 (2.8%) 14 (3.2%)
Age at first pregnancy 0.301742
Nulliparous 73 (16.7%) 83 (19.1%) 76 (17.6%) 91 (20.8%)
<20 years 17 (3.9%) 11 (2.5%) 18 (4.2%) 15 (3.43%)
20–24 years 104 (23.8%)122 (28.0%)104 (24.0%)103 (23.6%)
25–29 years 144 (33.0%)142 (32.6%)159 (36.7%)133 (30.4%)
>29 years 99 (22.7%)77 (17.7%) 76 (17.6%) 95 (21.7%)
Number of children 2.0 (1.5)1.9 (1.4)2.0 (1.5)1.9 (1.4)0.41 21750
Menopausal status <0.0011753
Premenopausal 81 (18.5%)100 (22.8%)128 (29.4%)184 (41.9%)
Postmenopausal 358 (81.5%)339 (77.2%)308 (70.6%)255 (58.1%)
E-DII; energy-adjusted dietary inflammatory index; BMI, body mass index; Non-enzymatic antioxidant capacity, NEAC; NSADs, nonsteroidal anti-inflammatory drugs; TE, Trolox equivalents. 1 p-value obtained by Student t-test for continuous variables normally distributed or chi-squared test for categorical variables unless otherwise indicated. 2 p-value obtained by Wilcoxon rank-sum test for continuous variables non-normally distributed.
Table 3. Association between E-DII score and colorectal cancer in the MCC-Spain Study (n = 5299).
Control/CasesModels E-DII Score Categoriesp for Trendp for Interaction
Per 1-Point Increment in the E-DII Score Q1Q2Q3Q4
M≤−1.49(−1.49, −0.167)(−0.167, 1.41)>1.41
W≤−2.15(−2.15, −1.01)(−1.01, 0.426)>0.426
OR (95% CI) OR (95% CI)OR (95% CI)OR (95% CI)OR (95% CI)
All3447/1852Simple1.15 (1.11–1.19) 1.00 (ref)1.59 (1.33–1.89)1.99 (1.67–2.37)2.03 (1.70–2.44)<0.001
3399/1842Final 1.14 (1.10–1.18) 1.00 (ref)1.57 (1.31–1.89)1.97 (1.64–2.35)1.93 (1.60–2.32)<0.001
3399/1596Sensitivity1.15 (1.11–1.19) 1.00 (ref)1.66 (1.37–2.01)2.06 (1.70–2.49)2.02 (1.66–2.47)<0.001
CRC Subtype 1
Colon cancer3399/1122Final 1.13 (1.08–1.17) 1.00 (ref)1.53 (1.24–1.89)1.86 (1.51–2.30)1.81 (1.45–2.26)<0.001
Rectal cancer3399/7001.17 (1.11–1.22) 1.00 (ref)1.69 (1.29–2.22)2.23 (1.71–2.90)2.27 (1.73–2.98)<0.001
Sex
Men1748/1174Stratified 11.14 (1.09–1.19) 1.00 (ref)1.72 (1.36–2.18)2.02 (1.60–2.57)2.14 (1.68–2.73)<0.0010.04
Women1651/6681.12 (1.05–1.18) 1.00 (ref)1.39 (1.05–1.86)1.95 (1.47–2.59)1.57 (1.16–2.13)<0.001
BMI (kg/m2)
Normal weight1308/544Stratified 21.12 (1.06–1.19) 1.00 (ref)1.52 (1.09–2.12)1.75 (1.26–2.44)1.95 (1.39–2.73)<0.0010.87
Overweight and Obese2091/12981.14 (1.10–1.19) 1.00 (ref)1.58 (1.27–1.97)2.06 (1.66–2.55)1.90 (1.51–2.37)<0.001
Physical activity 2
Inactive1310/945Stratified 31.17 (1.08–1.20) 1.00 (ref)1.69 (1.28–2.24)2.31 (1.76–3.03)2.05 (1.55–2.70)<0.0010.52
Active2089/8971.15 (1.09–1.20) 1.00 (ref)1.50 (1.18–1.91)1.78 (1.39–2.26)1.92 (1.49–2.47)<0.001
Use of NSAIDs/aspirin
Yes1298/601Stratified 41.14 (1.07–1.20) 1.00 (ref)1.73 (1.26–2.37)1.94 (1.42–2.65)1.97 (1.43–2.72)<0.0010.25
No1990/11781.13 (1.08–1.18) 1.00 (ref)1.49 (1.18–1.88)1.97 (1.57–2.47)1.83 (1.44–2.32)<0.001
Tobacco smoking
Current/Former smokers1893/1076Stratified 51.09 (1.05–1.14) 1.00 (ref)1.61 (1.26–2.07)1.87 (1.47–2.39)1.72 (1.34–2.20)<0.0010.58
Never smokers1506/7661.18 (1.12–1.25) 1.00 (ref)1.53 (1.17–2.00)2.05 (1.57–2.68)2.11 (1.58–2.82)<0.001
BMI, body mass index; CRC, colorectal cancer; E-DII; energy-adjusted dietary inflammatory index; M, men; MCC, Multi-case-control Spain study; NEAC, dietary non-enzymatic total antioxidant capacity; NSADs, nonsteroidal anti-inflammatory drugs; W, women. Simple model: Logistic regression analyses adjusted for sex (except in models stratified by gender), age, educational level, and study area. Final model: Logistic regression analyses adjusted for sex, age, educational level, study area, family history of colorectal cancer, tobacco smoking, physical activity, BMI, and NSAIDs/aspirin use. Sensitivity analysis excluding cases that had more than 6 months between the data of diagnosis and the interview: Logistic regression analyses adjusted for the same variables as Final model. Stratified 1: Logistic regression analyses adjusted, age, educational level, study area, family history of colorectal cancer, tobacco smoking, physical activity, BMI, and NSAIDs/aspirin use. Stratified 2: Logistic regression analyses adjusted for sex, age, educational level, study area, family history of colorectal cancer, tobacco smoking, physical activity, and NSAIDs/aspirin use. Stratified 3: Logistic regression analyses adjusted for sex, age, educational level, study area, family history of colorectal cancer, tobacco smoking, BMI, and NSAIDs/aspirin use. Stratified 4: Logistic regression analyses adjusted for sex, age, educational level, study area, family history of colorectal cancer, tobacco smoking, physical activity, and BMI. Stratified 5: Logistic regression analyses adjusted for sex, age, educational level, study area, family history of colorectal cancer, physical activity, BMI, and NSAIDs/aspirin use. 1 In 20 colorectal cancer cases, tumor subtype was not available, hence were excluded. 2 Categorized as inactive and active (including "moderately active", "active”, and "very active").
Table 4. Association between E-DII score and breast cancer in the MCC-Spain Study (n = 3138) .
Control/CaseModels E-DII Score Categoriesp for Trendp for Interaction
Per 1-Point Increment in the E-DII ScoreQ1Q2Q3Q4
≤−2.15(−2.15, −1.01)(−1.01, 0.426)>0.426
OR (95% CI)OR (95% CI)OR (95% CI)OR (95% CI)OR (95% CI)
All women1652/1486Simple1.05 (1.01–1.09)1.00 (ref)1.17 (0.95–1.45)1.13 (0.92–1.39)1.25 (1.02–1.55)0.06
1628/1471Final1.04 (1.00–1.08)1.00 (ref)1.16 (0.94–1.43)1.13 (0.91–1.39)1.22 (0.99–1.52)0.10
1628/1140Sensitivity1.03 (0.99–1.08)1.00 (ref)1.17 (0.93–1.47)1.09 (0.87–1.37)1.19 (0.94–1.50)0.24
BC subtypes
HR+ 11628/986Final1.04 (0.99–1.09)1.00 (ref)1.17 (0.92–1.49)1.17 (0.93–1.49)1.22 (0.95–1.55)0.14
HER2+ 11628/251Final1.04 (0.96–1.13)1.00 (ref)1.85 (1.21–2.83)1.27 (0.81–1.98)1.56 (1.01–2.04)0.24
TN11628/105Final1.02 (0.91–1.14)1.00 (ref)0.67 (0.37–1.23)0.78 (0.44–1.39)0.99 (0.56–1.75)0.97
Menopausal status
Premenopausal469/526Stratified 11.01 (0.94–1.08)1.00 (ref)0.94 (0.60–1.47)0.97 (0.64–1.48)1.05 (0.70–1.57)0.710.33
Postmenopausal1159/9451.06 (1.01–1.12)1.00 (ref)1.23 (0.97–1.58)1.19 (0.93–1.54)1.30 (0.99–1.69)0.08
HRT use
Never1448/1335Stratified 21.04 (1.00–1.08)1.00 (ref)1.16 (0.93–1.46)1.16 (0.92–1.45)1.22 (0.97–1.53)0.110.54
Ever125/1031.12 (0.93–1.34)1.00 (ref)0.88 (0.38–2.05)1.12 (0.47–2.64)1.47 (0.62–3.49)0.35
OC use
No828/764Stratified 31.05 (0.99–1.11)1.00 (ref)1.25 (0.94–1.66)1.35 (1.01–1.81)1.20 (0.88–1.63)0.180.87
Yes800/7071.04 (0.98–1.10)1.00 (ref)1.10 (0.79–1.52)0.97 (0.71–1.33)1.25 (0.91–1.71)0.25
BMI (kg/m2)
Normal weight843/718Stratified 41.04 (0.98–1.10)1.00 (ref)0.88 (0.64–1.21)1.01 (0.74–1.38)1.20 (0.88–1.63)0.150.99
Overweight and Obese785/7531.05 (0.99–1.12)1.00 (ref)1.49 (1.11–2.01)1.25 (0.93–1.68)1.29 (0.95–1.76)0.23
Physical activity 2
Inactive625/608Stratified 51.06 (0.99–1.12)1.00 (ref)1.92 (1.33–2.78)1.63 (1.14–2.34)1.48 (1.04–2.10)0.130.92
Active1003/8631.03 (0.97–1.09)1.00 (ref)0.93 (0.71–1.21)0.90 (0.69–1.18)1.14 (0.86–1.51)0.45
Tobacco smoking
Current/Former smokers647/656Stratified 61.05 (0.98–1.11)1.00 (ref)0.85 (0.59–1.22)1.01 (0.71–1.44)1.15 (0.81–1.61)0.210.15
Never smokers981/8151.03 (0.97–1.09)1.00 (ref)1.40 (1.07–1.82)1.19 (0.91–1.57)1.19 (0.89–1.59)0.39
BMI, body mass index; CRC, colorectal cancer; E-DII; energy-adjusted dietary inflammatory index; HRT, hormone replacement therapy; MCC, Multi-case-control Spain study; NSADs, nonsteroidal anti-inflammatory drugs; OC, oral contraceptive. Simple model: Logistic regression analyses adjusted for age, study area, and educational level. Final model: Logistic regression analyses adjusted for age, study area, educational level, family history of breast cancer, tobacco smoking, HRT use, OC use, age at menarche, age at first pregnancy, number of children, menopausal status, physical activity, and BMI. Sensitivity analysis excluding cases that had more than six months between the data of diagnosis and the interview: Logistic regression analyses adjusted for the same variables as Final model. Stratified 1: Logistic regression analyses adjusted for age, study area, educational level, family history of breast cancer, tobacco smoking, HRT use, OC use, age at menarche, age at first pregnancy, number of children, physical activity, and BMI. Stratified 2: Logistic regression analyses adjusted for age, study area, educational level, family history of breast cancer, tobacco smoking, OC use, age at menarche, age at first pregnancy, number of children, menopausal status, physical activity, and BMI. Stratified 3: Logistic regression analyses adjusted for age, study area, educational level, family history of breast cancer, tobacco smoking, HRT use, age at menarche, age at first pregnancy, number of children, menopausal status, physical activity, and BMI. Stratified 4: Logistic regression analyses adjusted for age, study area, educational level, family history of breast cancer, tobacco smoking, HRT use, OC use, age at menarche, age at first pregnancy, number of children, menopausal status, and physical activity. Stratified 5: Logistic regression analyses adjusted for age, study area, educational level, family history of breast cancer, tobacco smoking, HRT use, OC use, age at menarche, age at first pregnancy, number of children, menopausal status, and BMI. Stratified 6: Logistic regression analyses adjusted for age, study area, educational level, family history of breast cancer, HRT use, OC use, age at menarche, age at first pregnancy, number of children, menopausal status, physical activity, and BMI. 1 HR+: hormone receptor positive tumors (ER+ or PR+ with HER2-); HER2+: human epidermal growth factor receptor positive tumors, independent of ER or PR; TN: triple negative tumors (ER-, PR-, and HER2-). In 131 breast cancer cases, tumor subtype was not available, hence were excluded. 2 Categorized as inactive and active (including "moderately active", "active”, and "very active")
Table 5. Association between E-DII score and dietary non-enzymatic antioxidant capacity (NEAC) and colorectal and breast cancer in the MCC-Spain Study.
Control/CaseModels E-DII+NEAC Score Categoriespfor Trend
≤234≥5
Per 1-Point Increment in the E-DII+NEAC ScoreM: mean E-DII−1.49−0.120.802.15
W: mean E-DII−2.12−0.89−0.161.28
M: mean TEAC5.684.113.452.39
W: mean TEAC4.933.683.022.19
OR (95% CI) OR (95% CI)OR (95% CI)OR (95% CI)OR (95% CI)
CRC3312/1798Final-CRC 1.10 (1.06–1.14) 1.00 (ref)1.31 (1.10–1.55)1.32 (1.10–1.58)1.48 (1.26–1.74)<0.001
CRC Subtype 1
Colon cancer3312/1100Final-CRC1.09 (1.05–1.14)1. 1.00 (ref)1.31 (1.07–1.60)1.29 (1.04–1.60)1.46 (1.21–1.76)<0.001
Rectal cancer3312/678Final-CRC1.11 (1.06–1.17) 1.00 (ref)1.29 (1.01–1.65)1.34 (1.04–1.73)1.49 (1.19–1.87)<0.001
BC1585/1418Final-BC1.02 (0.98–1.07) 1.00 (ref)0.98 (0.80–1.22)1.03 (0.82–1.28)1.09 (0.90–1.32)0.39
Menopausal status
Premenopausal464/506Stratified 10.98 (0.91–1.06) 1.00 (ref)1.04 (0.68–1.57)0.88 (0.58–1.33)0.91 (0.66–1.27)0.50
Postmenopausal1121/912Stratified 11.05 (0.99–1.11) 1.00 (ref)0.95 (0.74–1.22)1.12 (0.85–1.48)1.22 (0.95–1.56)0.10
BC, breast cancer; CRC, colorectal cancer; E-DII; energy-adjusted dietary inflammatory index; M, men; MCC, Multi-case-control Spain study; NEAC, dietary non-enzymatic total antioxidant capacity; TE, Trolox equivalents; W, women, Final model (CRC): Logistic regression analyses adjusted for sex, age, educational level, study area, family history of colorectal cancer, tobacco smoking, physical activity, BMI, and NSAIDs/aspirin use. Final model (BC): Logistic regression analyses adjusted for age, study area, educational level, family history of breast cancer, tobacco smoking, HRT use, OC use, age at menarche, age at first pregnancy, number of children, menopausal status, physical activity, and BMI. Stratified 1: Logistic regression analyses adjusted for age, study area, educational level, family history of breast cancer, tobacco smoking, HRT use, OC use, age at menarche, age at first pregnancy, number of children, physical activity, and BMI. 1 In 20 colorectal cancer cases, tumor subtype was not available, hence were excluded.

