Genome-Wide Association Study for Serum Omega-3 and Omega-6 Polyunsaturated Fatty Acids: Exploratory Analysis of the Sex-Specific Effects and Dietary Modulation in Mediterranean Subjects with Metabolic Syndrome

 , , ,
, , ,  , , , and
Abstract
:1. Introduction
2. Materials and Methods
2.1. Study Design and Participants
2.2. Baseline Clinical, Anthropometric, Biochemical, and Lifestyle Variables
2.3. Serum Fatty Acid Determinations
2.4. Genome-Wide Genotyping
2.5. Statistical Analysis
3. Results
3.1. General Characteristics of the Population
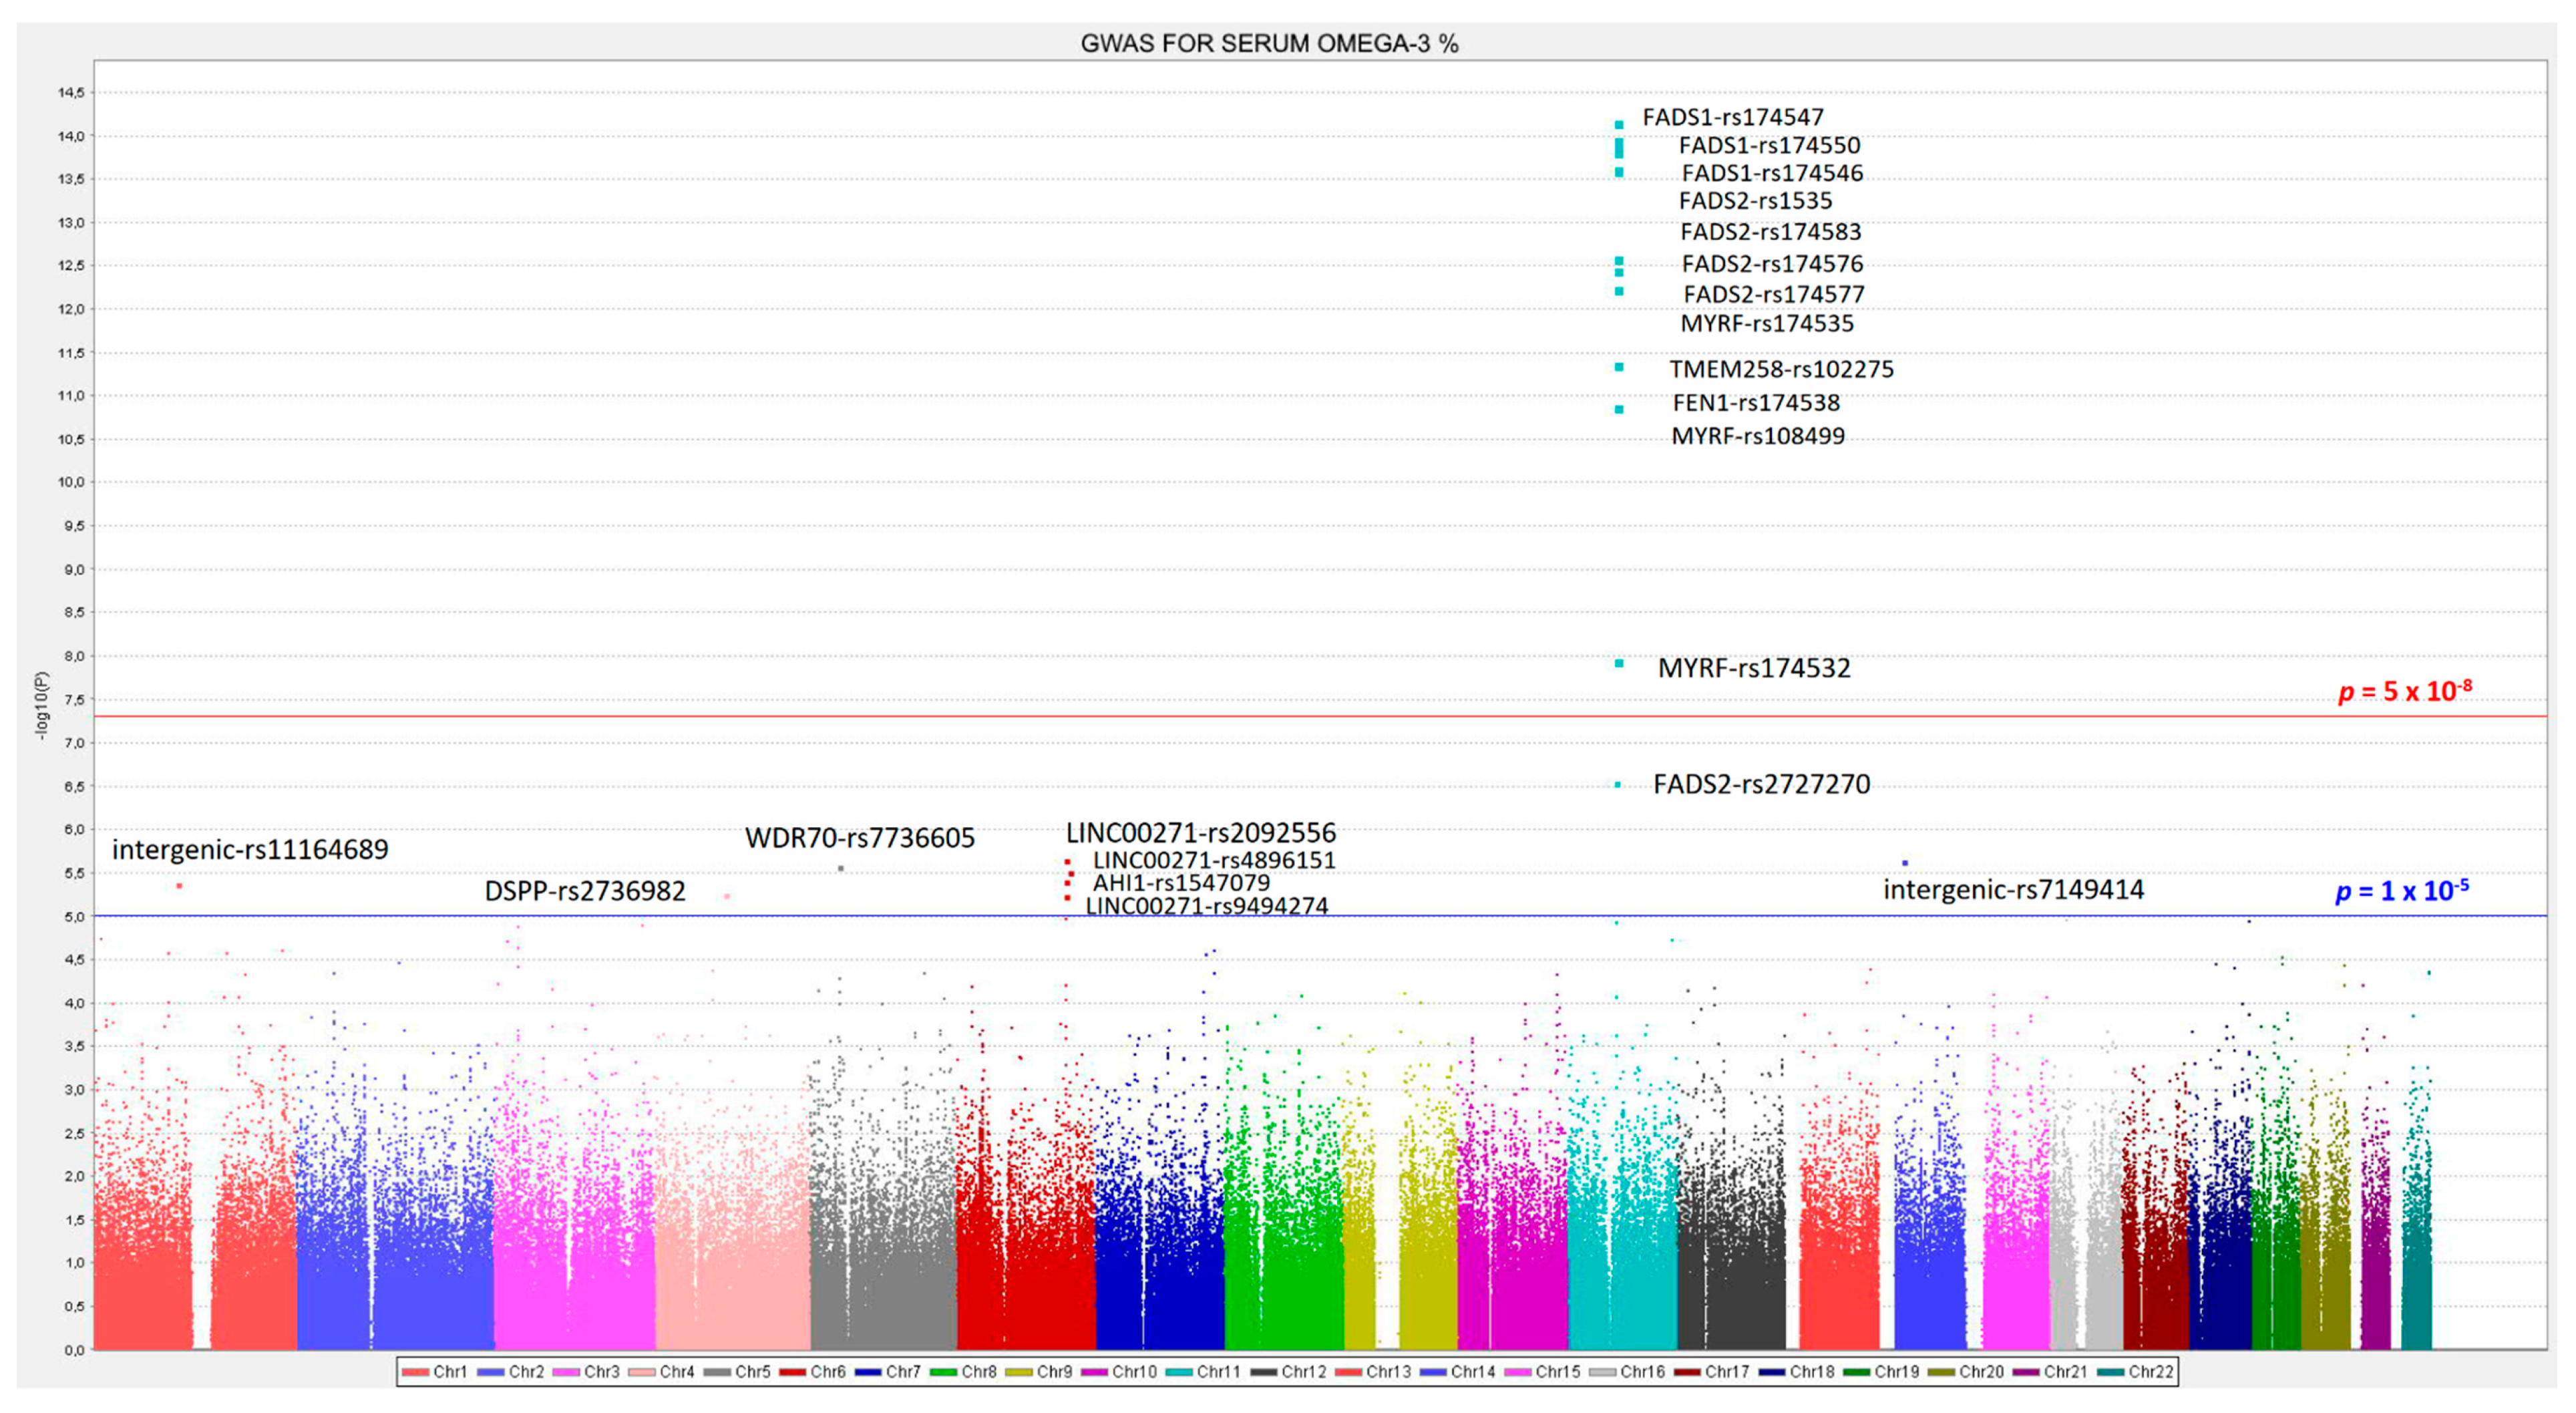
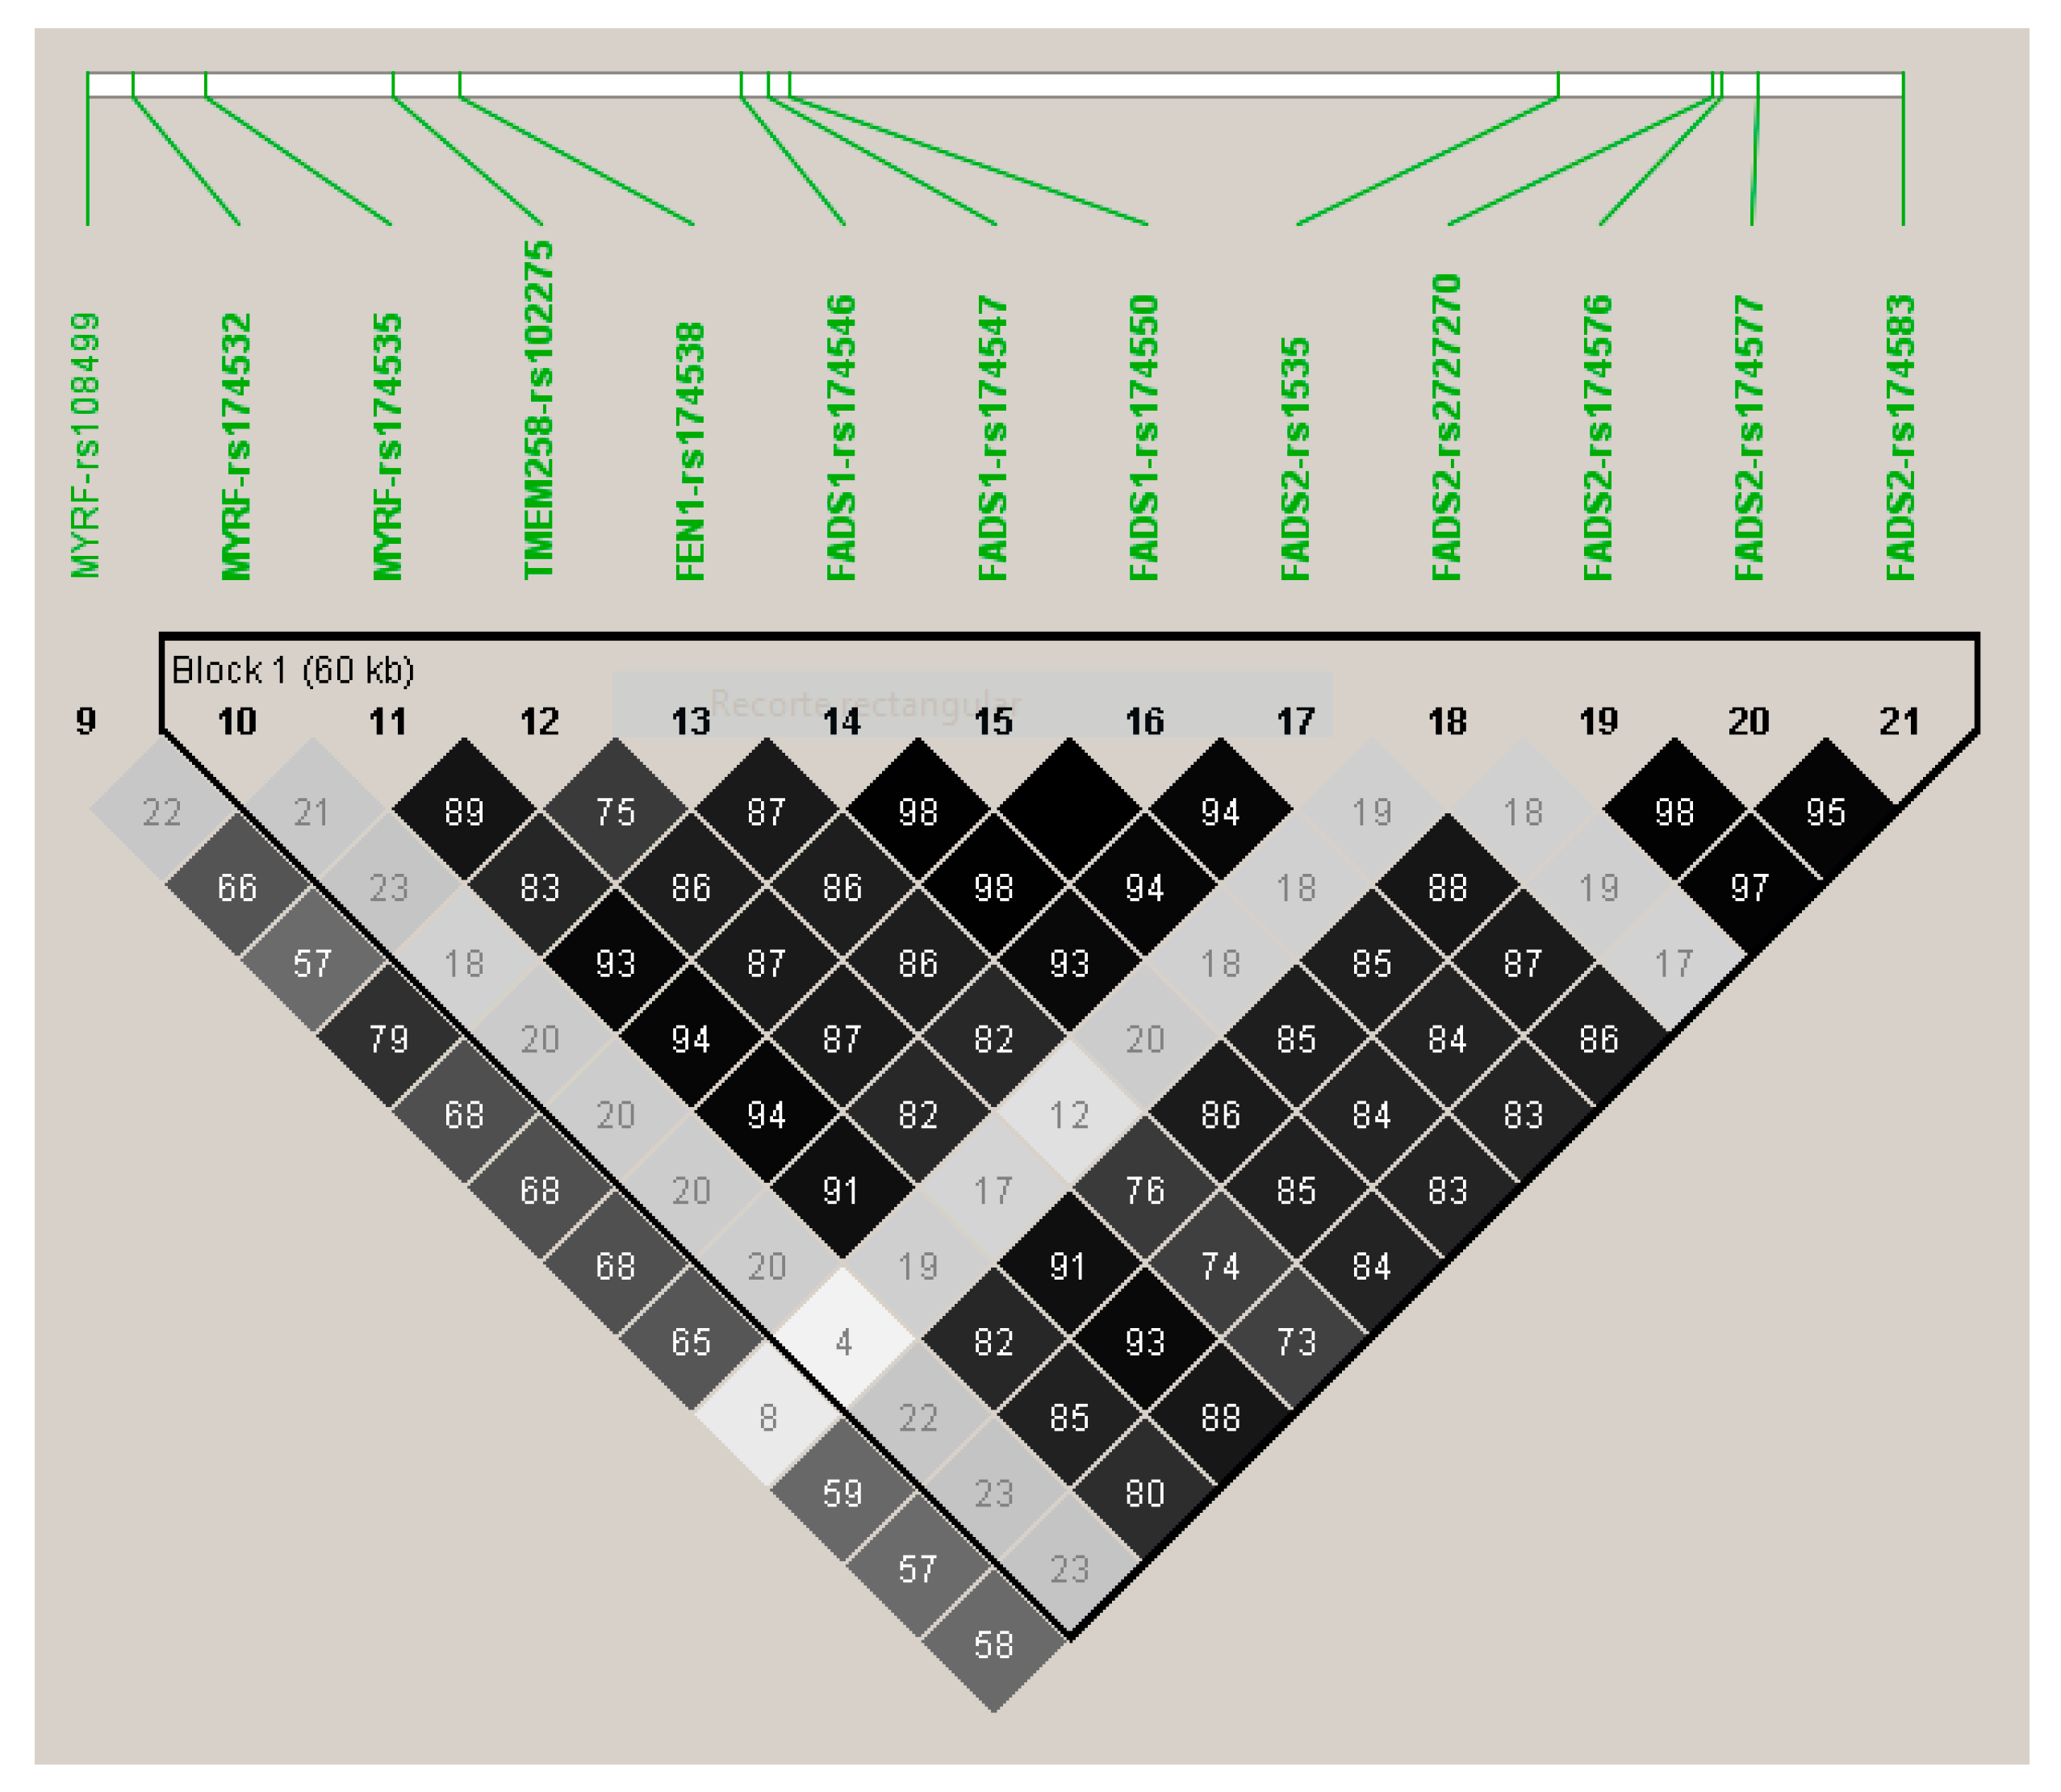
3.2. GWAS for Serum Omega-3 PUFA (%) in this Population
3.3. GWAS for Serum DHA Concentrations (%) in this Population
3.4. GWAS for Serum Omega-6 Concentrations (%) in this Population
3.5. GWAS for Serum LA Concentrations (%) in this Population
3.6. GWAS for Serum Total PUFA Concentrations (%) in this Population
3.7. GWAS for the Omega-6 to Omega 3 Ratio
3.8. RWASs for Serum PUFA Concentrations
4. Discussion
5. Conclusions
Supplementary Materials
Author Contributions
Funding
Conflicts of Interest
References
- Chilton, F.; Dutta, R.; Reynolds, L.; Sergeant, S.; Mathias, R.; Seeds, M. Precision Nutrition and Omega-3 Polyunsaturated Fatty Acids: A Case for Personalized Supplementation Approaches for the Prevention and Management of Human Diseases. Nutrients 2017, 9, 1165. [Google Scholar] [CrossRef] [PubMed]
- Park, H.G.; Park, W.J.; Kothapalli, K.S.D.; Brenna, J.T. The fatty acid desaturase 2 (FADS2) gene product catalyzes Δ4 desaturation to yield n-3 docosahexaenoic acid and n-6 docosapentaenoic acid in human cells. FASEB J. 2015, 29, 3911–3919. [Google Scholar] [CrossRef] [PubMed] [Green Version]
- Kim, O.; Lee, S.; An, W. Impact of Blood or Erythrocyte Membrane Fatty Acids for Disease Risk Prediction: Focusing on Cardiovascular Disease and Chronic Kidney Disease. Nutrients 2018, 10, 1454. [Google Scholar] [CrossRef] [PubMed] [Green Version]
- Zhang, J.Y.; Kothapalli, K.S.D.; Brenna, J.T. Desaturase and elongase-limiting endogenous long-chain polyunsaturated fatty acid biosynthesis. Curr. Opin. Clin. Nutr. Metab. Care 2016, 19, 103–110. [Google Scholar] [CrossRef]
- Astorg, P.; Bertrais, S.; Laporte, F.; Arnault, N.; Estaquio, C.; Galan, P.; Favier, A.; Hercberg, S. Plasma n-6 and n-3 polyunsaturated fatty acids as biomarkers of their dietary intakes: a cross-sectional study within a cohort of middle-aged French men and women. Eur. J. Clin. Nutr. 2008, 62, 1155–1161. [Google Scholar] [CrossRef] [Green Version]
- Li, D.; Wahlqvist, M.L.; Sinclair, A.J. Advances in n-3 polyunsaturated fatty acid nutrition. Asia Pac. J. Clin. Nutr. 2019, 28, 1–5. [Google Scholar]
- Meyer, B.J.; Mann, N.J.; Lewis, J.L.; Milligan, G.C.; Sinclair, A.J.; Howe, P.R.C. Dietary intakes and food sources of omega-6 and omega-3 polyunsaturated fatty acids. Lipids 2003, 38, 391–398. [Google Scholar] [CrossRef]
- Ortega Anta, R.M.; González Rodríguez, L.G.; Villalobos Cruz, T.K.; Perea Sánchez, J.M.; Aparicio Vizuete, A.; López Sobaler, A.M. Food sources and adequacy of intake of omega 3 and omega-6 fatty acids in a representative sample of Spanish adults. Nutr. Hosp. 2013, 28, 2236–2245. [Google Scholar]
- González-Rodríguez, L.G.; Aparicio, A.; López-Sobaler, A.M.; Ortega, R.M. Omega 3 and omega 6 fatty acids intake and dietary sources in a representative sample of Spanish adults. Int. J. Vitam. Nutr. Res. 2013, 83, 36–47. [Google Scholar] [CrossRef]
- Dyerberg, J.; Bang, H.O.; Stoffersen, E.; Moncada, S.; Vane, J.R. Eicosapentaenoic acid and prevention of thrombosis and atherosclerosis? Lancet 1978, 2, 117–119. [Google Scholar] [CrossRef]
- Demaison, L.; Moreau, D. Dietary n-3 polyunsaturated fatty acids and coronary heart disease-related mortality: A possible mechanism of action. Cell. Mol. Life Sci. 2002, 59, 463–477. [Google Scholar] [CrossRef]
- Harbige, L.S. Fatty acids, the immune response, and autoimmunity: A question of n-6 essentiality and the balance between n-6 and n-3. Lipids 2003, 38, 323–341. [Google Scholar] [CrossRef]
- Nageswari, K.; Banerjee, R.; Menon, V.P. Effect of saturated, omega-3 and omega-6 polyunsaturated fatty acids on myocardial infarction. J. Nutr. Biochem. 1999, 10, 338–344. [Google Scholar] [CrossRef]
- Bang, H.O.; Dyerberg, J.; Sinclair, H.M. The composition of the Eskimo food in north western Greenland. Am. J. Clin. Nutr. 1980, 33, 2657–2661. [Google Scholar] [CrossRef] [PubMed] [Green Version]
- Salonen, J.T.; Salonen, R.; Penttilä, I.; Herranen, J.; Jauhiainen, M.; Kantola, M.; Lappeteläinen, R.; Mäenpää, P.H.; Alfthan, G.; Puska, P. Serum fatty acids, apolipoproteins, selenium and vitamin antioxidants and the risk of death from coronary artery disease. Am. J. Cardiol. 1985, 56, 226–231. [Google Scholar] [CrossRef]
- Kang, J.X.; Leaf, A. The cardiac antiarrhythmic effects of polyunsaturated fatty acid. Lipids 1996, 31, S41–S44. [Google Scholar] [CrossRef]
- Nordøy, A.; Marchioli, R.; Arnesen, H.; Videbaek, J. N-3 polyunsaturated fatty acids and cardiovascular diseases. Lipids 2001, 36, S127–S129. [Google Scholar] [CrossRef]
- Mozaffarian, D.; Ascherio, A.; Hu, F.B.; Stampfer, M.J.; Willett, W.C.; Siscovick, D.S.; Rimm, E.B. Interplay between different polyunsaturated fatty acids and risk of coronary heart disease in men. Circulation 2005, 111, 157–164. [Google Scholar] [CrossRef] [Green Version]
- Lavie, C.J.; Milani, R.V.; Mehra, M.R.; Ventura, H.O. Omega-3 polyunsaturated fatty acids and cardiovascular diseases. J. Am. Coll. Cardiol. 2009, 54, 585–594. [Google Scholar] [CrossRef] [Green Version]
- Mori, T.A. Omega-3 fatty acids and hypertension in humans. Clin. Exp. Pharmacol. Physiol. 2006, 33, 842–846. [Google Scholar] [CrossRef]
- Rupp, H. Omacor (prescription omega-3-acid ethyl esters 90): From severe rhythm disorders to hypertriglyceridemia. Adv. Ther. 2009, 26, 675–690. [Google Scholar] [CrossRef] [PubMed]
- Yang, Z.-H.; Emma-Okon, B.; Remaley, A.T. Dietary marine-derived long-chain monounsaturated fatty acids and cardiovascular disease risk: A mini review. Lipids Health Dis. 2016, 15, 201. [Google Scholar] [CrossRef] [PubMed] [Green Version]
- Schunck, W.-H.; Konkel, A.; Fischer, R.; Weylandt, K.-H. Therapeutic potential of omega-3 fatty acid-derived epoxyeicosanoids in cardiovascular and inflammatory diseases. Pharmacol. Ther. 2018, 183, 177–204. [Google Scholar] [CrossRef] [PubMed]
- Yates, C.M.; Calder, P.C.; Ed Rainger, G. Pharmacology and therapeutics of omega-3 polyunsaturated fatty acids in chronic inflammatory disease. Pharmacol. Ther. 2014, 141, 272–282. [Google Scholar] [CrossRef] [PubMed]
- Saini, R.K.; Keum, Y.-S. Omega-3 and omega-6 polyunsaturated fatty acids: Dietary sources, metabolism, and significance—A review. Life Sci. 2018, 203, 255–267. [Google Scholar] [CrossRef] [PubMed]
- Darwesh, A.M.; Sosnowski, D.K.; Lee, T.Y.; Keshavarz-Bahaghighat, H.; Seubert, J.M. Insights into the cardioprotective properties of n-3 PUFAs against ischemic heart disease via modulation of the innate immune system. Chem. Biol. Interact. 2019, 308, 20–44. [Google Scholar] [CrossRef]
- Schwab, U.; Lauritzen, L.; Tholstrup, T.; Haldorssoni, T.; Riserus, U.; Uusitupa, M.; Becker, W. Effect of the amount and type of dietary fat on cardiometabolic risk factors and risk of developing type 2 diabetes, cardiovascular diseases, and cancer: A systematic review. Food Nutr. Res. 2014, 58, 25145. [Google Scholar] [CrossRef] [Green Version]
- Marangoni, F.; Agostoni, C.; Borghi, C.; Catapano, A.L.; Cena, H.; Ghiselli, A.; La Vecchia, C.; Lercker, G.; Manzato, E.; Pirillo, A.; et al. Dietary linoleic acid and human health: Focus on cardiovascular and cardiometabolic effects. Atherosclerosis 2020, 292, 90–98. [Google Scholar] [CrossRef] [Green Version]
- Simonetto, M.; Infante, M.; Sacco, R.L.; Rundek, T.; Della-Morte, D. A Novel Anti-Inflammatory Role of Omega-3 PUFAs in Prevention and Treatment of Atherosclerosis and Vascular Cognitive Impairment and Dementia. Nutrients 2019, 11, 2279. [Google Scholar] [CrossRef] [Green Version]
- Maki, K.; Dicklin, M. Omega-3 Fatty Acid Supplementation and Cardiovascular Disease Risk: Glass Half Full or Time to Nail the Coffin Shut? Nutrients 2018, 10, 864. [Google Scholar] [CrossRef] [Green Version]
- Tortosa-Caparrós, E.; Navas-Carrillo, D.; Marín, F.; Orenes-Piñero, E. Anti-inflammatory effects of omega 3 and omega 6 polyunsaturated fatty acids in cardiovascular disease and metabolic syndrome. Crit. Rev. Food Sci. Nutr. 2017, 57, 3421–3429. [Google Scholar] [CrossRef] [PubMed]
- Harris, W.S. Are n-3 fatty acids still cardioprotective? Curr. Opin. Clin. Nutr. Metab. Care 2013, 16, 141–149. [Google Scholar] [CrossRef] [PubMed]
- Mozaffarian, D.; Wu, J.H.Y. Omega-3 fatty acids and cardiovascular disease: Effects on risk factors, molecular pathways, and clinical events. J. Am. Coll. Cardiol. 2011, 58, 2047–2067. [Google Scholar] [CrossRef] [PubMed] [Green Version]
- Rimm, E.B.; Appel, L.J.; Chiuve, S.E.; Djoussé, L.; Engler, M.B.; Kris-Etherton, P.M.; Mozaffarian, D.; Siscovick, D.S.; Lichtenstein, A.H. On behalf of the American Heart Association Nutrition Committee of the Council on Lifestyle and Cardiometabolic Health; Council on Epidemiology and Prevention; Council on Cardiovascular Disease in the Young; Council on Cardiovascular and Stroke Nursing; and Council on Clinical Cardiology. Seafood Long-Chain n-3 Polyunsaturated Fatty Acids and Cardiovascular Disease: A Science Advisory From the American Heart Association. Circulation 2018, 138, e35–e47. [Google Scholar] [PubMed]
- Sacks, F.M.; Lichtenstein, A.H.; Wu, J.H.Y.; Appel, L.J.; Creager, M.A.; Kris-Etherton, P.M.; Miller, M.; Rimm, E.B.; Rudel, L.L.; Robinson, J.G.; et al. Dietary Fats and Cardiovascular Disease: A Presidential Advisory from the American Heart Association. Circulation 2017, 136, e1–e23. [Google Scholar] [CrossRef]
- Abdelhamid, A.S.; Martin, N.; Bridges, C.; Brainard, J.S.; Wang, X.; Brown, T.J.; Hanson, S.; Jimoh, O.F.; Ajabnoor, S.M.; Deane, K.H.; et al. Polyunsaturated fatty acids for the primary and secondary prevention of cardiovascular disease. Cochrane Database Syst. Rev. 2018, 11, CD012345. [Google Scholar]
- Abdelhamid, A.S.; Brown, T.J.; Brainard, J.S.; Biswas, P.; Thorpe, G.C.; Moore, H.J.; Deane, K.H.; AlAbdulghafoor, F.K.; Summerbell, C.D.; Worthington, H.V.; et al. Omega-3 fatty acids for the primary and secondary prevention of cardiovascular disease. Cochrane Database Syst. Rev. 2018, 11, CD003177. [Google Scholar]
- Hooper, L.; Al-Khudairy, L.; Abdelhamid, A.S.; Rees, K.; Brainard, J.S.; Brown, T.J.; Ajabnoor, S.M.; O’Brien, A.T.; Winstanley, L.E.; Donaldson, D.H.; et al. Omega-6 fats for the primary and secondary prevention of cardiovascular disease. Cochrane Database Syst. Rev. 2018, 11, CD011094. [Google Scholar]
- Imamura, F.; Micha, R.; Wu, J.H.Y.; de Oliveira Otto, M.C.; Otite, F.O.; Abioye, A.I.; Mozaffarian, D. Effects of Saturated Fat, Polyunsaturated Fat, Monounsaturated Fat, and Carbohydrate on Glucose-Insulin Homeostasis: A Systematic Review and Meta-analysis of Randomised Controlled Feeding Trials. PLoS Med. 2016, 13, e1002087. [Google Scholar] [CrossRef] [Green Version]
- Balk, E.M.; Adam, G.P.; Langberg, V.; Halladay, C.; Chung, M.; Lin, L.; Robertson, S.; Yip, A.; Steele, D.; Smith, B.T.; et al. Omega-3 Fatty Acids and Cardiovascular Disease: An Updated Systematic Review; Agency for Healthcare Research and Quality: Rockville, MD, USA, 2016. [Google Scholar]
- Brown, T.J.; Brainard, J.; Song, F.; Wang, X.; Abdelhamid, A.; Hooper, L. Omega-3, omega-6, and total dietary polyunsaturated fat for prevention and treatment of type 2 diabetes mellitus: Systematic review and meta-analysis of randomised controlled trials. BMJ 2019, l4697. [Google Scholar] [CrossRef] [Green Version]
- Jeffery, N.M.; Newsholme, E.A.; Calder, P.C. Level of polyunsaturated fatty acids and the n-6 to n-3 polyunsaturated fatty acid ratio in the rat diet alter serum lipid levels and lymphocyte functions. Prostaglandins Leukot. Essent. Fatty Acids 1997, 57, 149–160. [Google Scholar] [CrossRef]
- Wijendran, V.; Hayes, K.C. Dietary n-6 and n-3 fatty acid balance and cardiovascular health. Annu. Rev. Nutr. 2004, 24, 597–615. [Google Scholar] [CrossRef] [PubMed]
- Andrioli, G.; Carletto, A.; Guarini, P.; Galvani, S.; Biasi, D.; Bellavite, P.; Corrocher, R. Differential effects of dietary supplementation with fish oil or soy lecithin on human platelet adhesion. Thromb. Haemost. 1999, 82, 1522–1527. [Google Scholar] [PubMed]
- Calder, P.C. Omega-3 fatty acids and inflammatory processes. Nutrients 2010, 2, 355–374. [Google Scholar] [CrossRef] [PubMed] [Green Version]
- Calder, P.C. Omega-3 fatty acids and inflammatory processes: from molecules to man. Biochem. Soc. Trans. 2017, 45, 1105–1115. [Google Scholar] [CrossRef] [Green Version]
- Patterson, E.; Wall, R.; Fitzgerald, G.F.; Ross, R.P.; Stanton, C. Health implications of high dietary omega-6 polyunsaturated Fatty acids. J. Nutr. Metab. 2012, 2012, 539426. [Google Scholar] [CrossRef]
- Innes, J.K.; Calder, P.C. Omega-6 fatty acids and inflammation. Prostaglandins Leukot. Essent. Fatty Acids 2018, 132, 41–48. [Google Scholar] [CrossRef] [Green Version]
- DiNicolantonio, J.J.; O’Keefe, J.H. Importance of maintaining a low omega–6/omega–3 ratio for reducing inflammation. Open Heart 2018, 5, e000946. [Google Scholar] [CrossRef]
- Simopoulos, A.P. The importance of the omega-6/omega-3 fatty acid ratio in cardiovascular disease and other chronic diseases. Exp. Biol. Med. 2008, 233, 674–688. [Google Scholar] [CrossRef]
- Russo, G.L. Dietary n-6 and n-3 polyunsaturated fatty acids: From biochemistry to clinical implications in cardiovascular prevention. Biochem. Pharmacol. 2009, 77, 937–946. [Google Scholar] [CrossRef]
- Eaton, S.B.; Eaton, S.B.; Konner, M.J.; Shostak, M. An evolutionary perspective enhances understanding of human nutritional requirements. J. Nutr. 1996, 126, 1732–1740. [Google Scholar] [CrossRef] [PubMed] [Green Version]
- Griffin, M.D.; Sanders, T.A.B.; Davies, I.G.; Morgan, L.M.; Millward, D.J.; Lewis, F.; Slaughter, S.; Cooper, J.A.; Miller, G.J.; Griffin, B.A. Effects of altering the ratio of dietary n-6 to n-3 fatty acids on insulin sensitivity, lipoprotein size, and postprandial lipemia in men and postmenopausal women aged 45-70 y: the OPTILIP Study. Am. J. Clin. Nutr. 2006, 84, 1290–1298. [Google Scholar] [CrossRef] [Green Version]
- Griffin, B.A. How relevant is the ratio of dietary n-6 to n-3 polyunsaturated fatty acids to cardiovascular disease risk? Evidence from the OPTILIP study. Curr. Opin. Lipidol. 2008, 19, 57–62. [Google Scholar] [CrossRef] [PubMed]
- Dunbar, B.S.; Bosire, R.V.; Deckelbaum, R.J. Omega 3 and omega 6 fatty acids in human and animal health: An African perspective. Mol. Cell. Endocrinol. 2014, 398, 69–77. [Google Scholar] [CrossRef] [PubMed]
- Shrestha, N.; Sleep, S.L.; Cuffe, J.S.; Holland, O.J.; Perkins, A.V.; Yu Yau, S.; McAinch, A.J.; Hryciw, D.H. Role Of Omega-6 and Omega-3 fatty acids in fetal programming. Clin. Exp. Pharmacol. Physiol. 2019. [Google Scholar] [CrossRef] [Green Version]
- Kaliannan, K.; Li, X.-Y.; Wang, B.; Pan, Q.; Chen, C.-Y.; Hao, L.; Xie, S.; Kang, J.X. Multi-omic analysis in transgenic mice implicates omega-6/omega-3 fatty acid imbalance as a risk factor for chronic disease. Commun. Biol. 2019, 2, 276. [Google Scholar] [CrossRef] [Green Version]
- Steffen, B.T.; Guan, W.; Stein, J.H.; Tattersall, M.C.; Kaufman, J.D.; Sandfort, V.; Szklo, M.; Tsai, M.Y. Plasma n-3 and n-6 Fatty Acids Are Differentially Related to Carotid Plaque and Its Progression: The Multi-Ethnic Study of Atherosclerosis. Arterioscler. Thromb. Vasc. Biol. 2018, 38, 653–659. [Google Scholar] [CrossRef] [Green Version]
- Virtanen, J.K. Randomized trials of replacing saturated fatty acids with n-6 polyunsaturated fatty acids in coronary heart disease prevention: Not the gold standard? Prostaglandins Leukot. Essent. Fatty Acids 2018, 133, 8–15. [Google Scholar] [CrossRef] [Green Version]
- Simopoulos, A.P. Genetic variants in the metabolism of omega-6 and omega-3 fatty acids: Their role in the determination of nutritional requirements and chronic disease risk. Exp. Biol. Med. 2010, 235, 785–795. [Google Scholar] [CrossRef]
- Dumont, J.; Huybrechts, I.; Spinneker, A.; Gottrand, F.; Grammatikaki, E.; Bevilacqua, N.; Vyncke, K.; Widhalm, K.; Kafatos, A.; Molnar, D.; et al. FADS1 genetic variability interacts with dietary α-linolenic acid intake to affect serum non-HDL-cholesterol concentrations in European adolescents. J. Nutr. 2011, 141, 1247–1253. [Google Scholar] [CrossRef] [Green Version]
- Cormier, H.; Rudkowska, I.; Paradis, A.-M.; Thifault, E.; Garneau, V.; Lemieux, S.; Couture, P.; Vohl, M.-C. Association between polymorphisms in the fatty acid desaturase gene cluster and the plasma triacylglycerol response to an n-3 PUFA supplementation. Nutrients 2012, 4, 1026–1041. [Google Scholar] [CrossRef] [PubMed] [Green Version]
- Hellstrand, S.; Sonestedt, E.; Ericson, U.; Gullberg, B.; Wirfält, E.; Hedblad, B.; Orho-Melander, M. Intake levels of dietary long-chain PUFAs modify the association between genetic variation in FADS and LDL-C. J. Lipid Res. 2012, 53, 1183–1189. [Google Scholar] [CrossRef] [PubMed] [Green Version]
- Brayner, B.; Kaur, G.; Keske, M.A.; Livingstone, K.M. FADS Polymorphism, Omega-3 Fatty Acids and Diabetes Risk: A Systematic Review. Nutrients 2018, 10, 758. [Google Scholar] [CrossRef] [PubMed] [Green Version]
- Kwong, R.Y.; Heydari, B.; Ge, Y.; Abdullah, S.; Fujikura, K.; Kaneko, K.; Harris, W.S.; Jerosch-Herold, M.; Antman, E.M.; Seidman, J.G.; et al. Genetic profiling of fatty acid desaturase polymorphisms identifies patients who may benefit from high-dose omega-3 fatty acids in cardiac remodeling after acute myocardial infarction-Post-hoc analysis from the OMEGA-REMODEL randomized controlled trial. PLoS ONE 2019, 14, e0222061. [Google Scholar] [CrossRef]
- De Goede, J.; Verschuren, W.M.M.; Boer, J.M.A.; Kromhout, D.; Geleijnse, J.M. Gender-specific associations of marine n-3 fatty acids and fish consumption with 10-year incidence of stroke. PLoS ONE 2012, 7, e33866. [Google Scholar] [CrossRef] [Green Version]
- Ferdouse, A.; Leng, S.; Winter, T.; Aukema, H.M. Dietary n-6 and n-3 PUFA alter the free oxylipin profile differently in male and female rat hearts. Br. J. Nutr. 2019, 122, 252–261. [Google Scholar] [CrossRef]
- Lauritzen, L.; Sørensen, L.B.; Harsløf, L.B.; Ritz, C.; Stark, K.D.; Astrup, A.; Dyssegaard, C.B.; Egelund, N.; Michaelsen, K.F.; Damsgaard, C.T. Mendelian randomization shows sex-specific associations between long-chain PUFA-related genotypes and cognitive performance in Danish schoolchildren. Am. J. Clin. Nutr. 2017, 106, 88–95. [Google Scholar] [CrossRef] [Green Version]
- Da Boit, M.; Sibson, R.; Sivasubramaniam, S.; Meakin, J.R.; Greig, C.A.; Aspden, R.M.; Thies, F.; Jeromson, S.; Hamilton, D.L.; Speakman, J.R.; et al. Sex differences in the effect of fish-oil supplementation on the adaptive response to resistance exercise training in older people: A randomized controlled trial. Am. J. Clin. Nutr. 2017, 105, 151–158. [Google Scholar] [CrossRef]
- Ip, W.T.K.; McAlindon, A.; Miller, S.E.; Bell, J.R.; Curl, C.L.; Huggins, C.E.; Mellor, K.M.; Raaijmakers, A.J.A.; Bienvenu, L.A.; McLennan, P.L.; et al. Dietary omega-6 fatty acid replacement selectively impairs cardiac functional recovery after ischemia in female (but not male) rats. Am. J. Physiol. Heart Circ. Physiol. 2016, 311, H768–H780. [Google Scholar] [CrossRef] [Green Version]
- Balogun, K.A.; Cheema, S.K. Dietary Omega-3 Fatty Acids Prevented Adipocyte Hypertrophy by Downregulating DGAT-2 and FABP-4 in a Sex-Dependent Fashion. Lipids 2016, 51, 25–38. [Google Scholar] [CrossRef]
- Ghasemifard, S.; Hermon, K.; Turchini, G.M.; Sinclair, A.J. Metabolic fate (absorption, β-oxidation and deposition) of long-chain n-3 fatty acids is affected by sex and by the oil source (krill oil or fish oil) in the rat. Br. J. Nutr. 2015, 114, 684–692. [Google Scholar] [CrossRef] [PubMed] [Green Version]
- Childs, C.E.; Kew, S.; Finnegan, Y.E.; Minihane, A.M.; Leigh-Firbank, E.C.; Williams, C.M.; Calder, P.C. Increased dietary α-linolenic acid has sex-specific effects upon eicosapentaenoic acid status in humans: Re-examination of data from a randomised, placebo-controlled, parallel study. Nutr. J. 2014, 13, 113. [Google Scholar] [CrossRef] [PubMed] [Green Version]
- Jin, H.; Nicodemus-Johnson, J. Gender and Age Stratified Analyses of Nutrient and Dietary Pattern Associations with Circulating Lipid Levels Identify Novel Gender and Age-Specific Correlations. Nutrients 2018, 10, 1760. [Google Scholar] [CrossRef] [PubMed] [Green Version]
- Zou, X.-G.; Huang, Y.-H.; Li, H.-Y.; Xu, T.-C.; Fan, Y.-W.; Li, J.; Deng, Z.-Y. Effects of Chinese Dietary Pattern of Fat Content, n-6/n-3 Polyunsaturated Fatty Acid Ratio, and Cholesterol Content on Lipid Profile in Rats. Biomed. Res. Int. 2018, 2018, 4398086. [Google Scholar] [CrossRef] [PubMed] [Green Version]
- Petersson, S.; Philippou, E.; Rodomar, C.; Nikiphorou, E. The Mediterranean diet, fish oil supplements and Rheumatoid arthritis outcomes: Evidence from clinical trials. Autoimmun. Rev. 2018, 17, 1105–1114. [Google Scholar] [CrossRef] [PubMed] [Green Version]
- Adamsson, V.; Cederholm, T.; Vessby, B.; Risérus, U. Influence of a healthy Nordic diet on serum fatty acid composition and associations with blood lipoproteins—Results from the NORDIET study. Food Nutr. Res. 2014, 58, 24114. [Google Scholar] [CrossRef] [Green Version]
- Muzsik, A.; Bajerska, J.; Jeleń, H.H.; Walkowiak, J.; Krzyżanowska-Jankowska, P.; Chmurzynska, A. FADS1 and FADS2 polymorphism are associated with changes in fatty acid concentrations after calorie-restricted Central European and Mediterranean diets. Menopause 2019, 26, 1415–1424. [Google Scholar] [CrossRef]
- Tanaka, T.; Shen, J.; Abecasis, G.R.; Kisialiou, A.; Ordovas, J.M.; Guralnik, J.M.; Singleton, A.; Bandinelli, S.; Cherubini, A.; Arnett, D.; et al. Genome-Wide Association Study of Plasma Polyunsaturated Fatty Acids in the InCHIANTI Study. PLoS Genet. 2009, 5, e1000338. [Google Scholar] [CrossRef] [Green Version]
- Lemaitre, R.N.; Tanaka, T.; Tang, W.; Manichaikul, A.; Foy, M.; Kabagambe, E.K.; Nettleton, J.A.; King, I.B.; Weng, L.-C.; Bhattacharya, S.; et al. Genetic Loci Associated with Plasma Phospholipid n-3 Fatty Acids: A Meta-Analysis of Genome-Wide Association Studies from the CHARGE Consortium. PLoS Genet. 2011, 7, e1002193. [Google Scholar] [CrossRef] [Green Version]
- Guan, W.; Steffen, B.T.; Lemaitre, R.N.; Wu, J.H.Y.; Tanaka, T.; Manichaikul, A.; Foy, M.; Rich, S.S.; Wang, L.; Nettleton, J.A.; et al. Genome-Wide Association Study of Plasma N6 Polyunsaturated Fatty Acids Within the Cohorts for Heart and Aging Research in Genomic Epidemiology Consortium. Circ. Cardiovasc. Genet. 2014, 7, 321–331. [Google Scholar] [CrossRef] [Green Version]
- Tintle, N.L.; Pottala, J.V.; Lacey, S.; Ramachandran, V.; Westra, J.; Rogers, A.; Clark, J.; Olthoff, B.; Larson, M.; Harris, W.; et al. A genome-wide association study of saturated, mono- and polyunsaturated red blood cell fatty acids in the Framingham Heart Offspring Study. Prostaglandins Leukot. Essent. Fatty Acids 2015, 94, 65–72. [Google Scholar] [CrossRef] [PubMed] [Green Version]
- Wu, J.H.Y.; Lemaitre, R.N.; Manichaikul, A.; Guan, W.; Tanaka, T.; Foy, M.; Kabagambe, E.K.; Djousse, L.; Siscovick, D.; Fretts, A.M.; et al. Genome-Wide Association Study Identifies Novel Loci Associated with Concentrations of Four Plasma Phospholipid Fatty Acids in the De Novo Lipogenesis Pathway: Results From the Cohorts for Heart and Aging Research in Genomic Epidemiology (CHARGE) Consortium. Circ. Cardiovasc. Genet. 2013, 6, 171–183. [Google Scholar] [CrossRef] [PubMed] [Green Version]
- Dorajoo, R.; Sun, Y.; Han, Y.; Ke, T.; Burger, A.; Chang, X.; Low, H.Q.; Guan, W.; Lemaitre, R.N.; Khor, C.-C.; et al. A genome-wide association study of n-3 and n-6 plasma fatty acids in a Singaporean Chinese population. Genes. Nutr. 2015, 10, 53. [Google Scholar] [CrossRef] [PubMed]
- Fumagalli, M.; Moltke, I.; Grarup, N.; Racimo, F.; Bjerregaard, P.; Jorgensen, M.E.; Korneliussen, T.S.; Gerbault, P.; Skotte, L.; Linneberg, A.; et al. Greenlandic Inuit show genetic signatures of diet and climate adaptation. Science 2015, 349, 1343–1347. [Google Scholar] [CrossRef] [PubMed]
- Hu, Y.; Li, H.; Lu, L.; Manichaikul, A.; Zhu, J.; Chen, Y.-D.I.; Sun, L.; Liang, S.; Siscovick, D.S.; Steffen, L.M.; et al. Genome-wide meta-analyses identify novel loci associated with n-3 and n-6 polyunsaturated fatty acid levels in Chinese and European-ancestry populations. Hum. Mol. Genet. 2016, 25, 1215–1224. [Google Scholar] [CrossRef] [PubMed]
- PAGE Consortium; Yoneyama, S.; Yao, J.; Guo, X.; Fernandez-Rhodes, L.; Lim, U.; Boston, J.; Buzková, P.; Carlson, C.S.; Cheng, I.; et al. Generalization and fine mapping of European ancestry-based central adiposity variants in African ancestry populations. Int. J. Obes. 2017, 41, 324–331. [Google Scholar] [CrossRef] [Green Version]
- Martin, A.R.; Kanai, M.; Kamatani, Y.; Okada, Y.; Neale, B.M.; Daly, M.J. Clinical use of current polygenic risk scores may exacerbate health disparities. Nat. Genet. 2019, 51, 584–591. [Google Scholar] [CrossRef]
- Duncan, L.; Shen, H.; Gelaye, B.; Meijsen, J.; Ressler, K.; Feldman, M.; Peterson, R.; Domingue, B. Analysis of polygenic risk score usage and performance in diverse human populations. Nat. Commun. 2019, 10, 3328. [Google Scholar] [CrossRef]
- Ortega-Azorín, C.; Coltell, O.; Asensio, E.M.; Sorlí, J.V.; González, J.I.; Portolés, O.; Saiz, C.; Estruch, R.; Ramírez-Sabio, J.B.; Pérez-Fidalgo, A.; et al. Candidate Gene and Genome-Wide Association Studies for Circulating Leptin Levels Reveal Population and Sex-Specific Associations in High Cardiovascular Risk Mediterranean Subjects. Nutrients 2019, 11, 2751. [Google Scholar] [CrossRef] [Green Version]
- Schaeffer, L.; Gohlke, H.; Müller, M.; Heid, I.M.; Palmer, L.J.; Kompauer, I.; Demmelmair, H.; Illig, T.; Koletzko, B.; Heinrich, J. Common genetic variants of the FADS1 FADS2 gene cluster and their reconstructed haplotypes are associated with the fatty acid composition in phospholipids. Hum. Mol. Genet. 2006, 15, 1745–1756. [Google Scholar] [CrossRef]
- Malerba, G.; Schaeffer, L.; Xumerle, L.; Klopp, N.; Trabetti, E.; Biscuola, M.; Cavallari, U.; Galavotti, R.; Martinelli, N.; Guarini, P.; et al. SNPs of the FADS gene cluster are associated with polyunsaturated fatty acids in a cohort of patients with cardiovascular disease. Lipids 2008, 43, 289–299. [Google Scholar] [CrossRef] [PubMed]
- Rzehak, P.; Heinrich, J.; Klopp, N.; Schaeffer, L.; Hoff, S.; Wolfram, G.; Illig, T.; Linseisen, J. Evidence for an association between genetic variants of the fatty acid desaturase 1 fatty acid desaturase 2 (FADS1 FADS2) gene cluster and the fatty acid composition of erythrocyte membranes. Br. J. Nutr. 2008, 101, 20–26. [Google Scholar] [CrossRef] [PubMed] [Green Version]
- Koletzko, B.; Reischl, E.; Tanjung, C.; Gonzalez-Casanova, I.; Ramakrishnan, U.; Meldrum, S.; Simmer, K.; Heinrich, J.; Demmelmair, H. FADS1 and FADS2 Polymorphisms Modulate Fatty Acid Metabolism and Dietary Impact on Health. Annu. Rev. Nutr. 2019, 39, 21–44. [Google Scholar] [CrossRef] [PubMed]
- Ye, K.; Gao, F.; Wang, D.; Bar-Yosef, O.; Keinan, A. Dietary adaptation of FADS genes in Europe varied across time and geography. Nat. Ecol. Evol. 2017, 1, 0167. [Google Scholar] [CrossRef] [PubMed] [Green Version]
- Harris, D.N.; Ruczinski, I.; Yanek, L.R.; Becker, L.C.; Becker, D.M.; Guio, H.; Cui, T.; Chilton, F.H.; Mathias, R.A.; O’Connor, T.D. Evolution of Hominin Polyunsaturated Fatty Acid Metabolism: From Africa to the New World. Genome Biol. Evol. 2019, 11, 1417–1430. [Google Scholar] [CrossRef] [PubMed] [Green Version]
- Buckley, M.T.; Racimo, F.; Allentoft, M.E.; Jensen, M.K.; Jonsson, A.; Huang, H.; Hormozdiari, F.; Sikora, M.; Marnetto, D.; Eskin, E.; et al. Selection in Europeans on Fatty Acid Desaturases Associated with Dietary Changes. Mol. Biol. Evol. 2017, 34, 1307–1318. [Google Scholar] [CrossRef] [Green Version]
- Ameur, A.; Enroth, S.; Johansson, Å.; Zaboli, G.; Igl, W.; Johansson, A.C.V.; Rivas, M.A.; Daly, M.J.; Schmitz, G.; Hicks, A.A.; et al. Genetic Adaptation of Fatty-Acid Metabolism: A Human-Specific Haplotype Increasing the Biosynthesis of Long-Chain Omega-3 and Omega-6 Fatty Acids. Am. J. Hum. Genet. 2012, 90, 809–820. [Google Scholar] [CrossRef] [Green Version]
- Corella, D.; Coltell, O.; Macian, F.; Ordovás, J.M. Advances in Understanding the Molecular Basis of the Mediterranean Diet Effect. Annu. Rev. Food Sci. Technol. 2018, 9, 227–249. [Google Scholar] [CrossRef]
- Vilarnau, C.; Stracker, D.M.; Funtikov, A.; da Silva, R.; Estruch, R.; Bach-Faig, A. Worldwide adherence to Mediterranean Diet between 1960 and 2011. Eur. J. Clin. Nutr. 2019, 72, 83–91. [Google Scholar] [CrossRef]
- Serra-Majem, L.; Román-Viñas, B.; Sanchez-Villegas, A.; Guasch-Ferré, M.; Corella, D.; La Vecchia, C. Benefits of the Mediterranean diet: Epidemiological and molecular aspects. Mol. Aspects Med. 2019, 67, 1–55. [Google Scholar] [CrossRef]
- De la Garza Puentes, A.; Montes Goyanes, R.; Chisaguano Tonato, A.M.; Torres-Espínola, F.J.; Arias García, M.; de Almeida, L.; Bonilla Aguirre, M.; Guerendiain, M.; Castellote Bargalló, A.I.; Segura Moreno, M.; et al. Association of maternal weight with FADS and ELOVL genetic variants and fatty acid levels- The PREOBE follow-up. PLoS ONE 2017, 12, e0179135. [Google Scholar] [CrossRef] [PubMed] [Green Version]
- Salas Lorenzo, I.; Chisaguano Tonato, A.M.; de la Garza Puentes, A.; Nieto, A.; Herrmann, F.; Dieguez, E.; Castellote, A.I.; López-Sabater, M.C.; Rodríguez-Palmero, M.; Campoy, C. The Effect of an Infant Formula Supplemented with AA and DHA on Fatty Acid Levels of Infants with Different FADS Genotypes: The COGNIS Study. Nutrients 2019, 11, 602. [Google Scholar] [CrossRef] [PubMed] [Green Version]
- Chisaguano, A.M.; Montes, R.; Pérez-Berezo, T.; Castellote, A.I.; Guerendiain, M.; Bustamante, M.; Morales, E.; García-Esteban, R.; Sunyer, J.; Franch, À.; et al. Gene Expression of Desaturase (FADS1 and FADS2) and Elongase (ELOVL5) Enzymes in Peripheral Blood: Association with Polyunsaturated Fatty Acid Levels and Atopic Eczema in 4-Year-Old Children. PLoS ONE 2013, 8, e78245. [Google Scholar] [CrossRef] [PubMed]
- Coltell, O.; Asensio, E.M.; Sorlí, J.V.; Barragán, R.; Fernández-Carrión, R.; Portolés, O.; Ortega-Azorín, C.; Martínez-LaCruz, R.; González, J.I.; Zanón-Moreno, V.; et al. Genome-Wide Association Study (GWAS) on Bilirubin Concentrations in Subjects with Metabolic Syndrome: Sex-Specific GWAS Analysis and Gene-Diet Interactions in a Mediterranean Population. Nutrients 2019, 11, 90. [Google Scholar] [CrossRef] [Green Version]
- Martínez-González, M.A.; Buil-Cosiales, P.; Corella, D.; Bulló, M.; Fitó, M.; Vioque, J.; Romaguera, D.; Martínez, J.A.; Wärnberg, J.; López-Miranda, J.; et al. Cohort Profile: Design and methods of the PREDIMED-Plus randomized trial. Int. J. Epidemiol. 2019, 48, 387–388. [Google Scholar] [CrossRef] [PubMed] [Green Version]
- Salas-Salvadó, J.; Díaz-López, A.; Ruiz-Canela, M.; Basora, J.; Fitó, M.; Corella, D.; Serra-Majem, L.; Wärnberg, J.; Romaguera, D.; Estruch, R.; et al. Effect of a Lifestyle Intervention Program with Energy-Restricted Mediterranean Diet and Exercise on Weight Loss and Cardiovascular Risk Factors: One-Year Results of the PREDIMED-Plus Trial. Diabetes Care 2018, 42, 777–788. [Google Scholar] [CrossRef] [Green Version]
- Molina, L.; Sarmiento, M.; Peñafiel, J.; Donaire, D.; Garcia-Aymerich, J.; Gomez, M.; Ble, M.; Ruiz, S.; Frances, A.; Schröder, H.; et al. Validation of the Regicor Short Physical Activity Questionnaire for the Adult Population. PLoS ONE 2017, 12, e0168148. [Google Scholar] [CrossRef] [PubMed]
- Galilea-Zabalza, I.; Buil-Cosiales, P.; Salas-Salvadó, J.; Toledo, E.; Ortega-Azorín, C.; Díez-Espino, J.; Vázquez-Ruiz, Z.; Zomeño, M.D.; Vioque, J.; Martínez, J.A.; et al. Mediterranean diet and quality of life: Baseline cross-sectional analysis of the PREDIMED-PLUS trial. PLoS ONE 2018, 13, e0198974. [Google Scholar] [CrossRef] [PubMed] [Green Version]
- Soininen, P.; Kangas, A.J.; Würtz, P.; Tukiainen, T.; Tynkkynen, T.; Laatikainen, R.; Järvelin, M.-R.; Kähönen, M.; Lehtimäki, T.; Viikari, J.; et al. High-throughput serum NMR metabonomics for cost-effective holistic studies on systemic metabolism. Analyst 2009, 134, 1781–1785. [Google Scholar] [CrossRef]
- Tukiainen, T.; Kettunen, J.; Kangas, A.J.; Lyytikäinen, L.-P.; Soininen, P.; Sarin, A.-P.; Tikkanen, E.; O’Reilly, P.F.; Savolainen, M.J.; Kaski, K.; et al. Detailed metabolic and genetic characterization reveals new associations for 30 known lipid loci. Hum. Mol. Genet. 2012, 21, 1444–1455. [Google Scholar] [CrossRef] [Green Version]
- Würtz, P.; Kangas, A.J.; Soininen, P.; Lawlor, D.A.; Davey Smith, G.; Ala-Korpela, M. Quantitative Serum Nuclear Magnetic Resonance Metabolomics in Large-Scale Epidemiology: A Primer on -Omic Technologies. Am. J. Epidemiol. 2017, 186, 1084–1096. [Google Scholar] [CrossRef] [PubMed] [Green Version]
- Jelenkovic, A.; Bogl, L.H.; Rose, R.J.; Kangas, A.J.; Soininen, P.; Ala-Korpela, M.; Kaprio, J.; Silventoinen, K. Association between serum fatty acids and lipoprotein subclass profile in healthy young adults: Exploring common genetic and environmental factors. Atherosclerosis 2014, 233, 394–402. [Google Scholar] [CrossRef] [PubMed] [Green Version]
- Deelen, J.; Kettunen, J.; Fischer, K.; van der Spek, A.; Trompet, S.; Kastenmüller, G.; Boyd, A.; Zierer, J.; van den Akker, E.B.; Ala-Korpela, M.; et al. A metabolic profile of all-cause mortality risk identified in an observational study of 44,168 individuals. Nat. Commun. 2019, 10, 3346. [Google Scholar] [CrossRef] [Green Version]
- Jääskeläinen, O.; Solje, E.; Hall, A.; Katisko, K.; Korhonen, V.; Tiainen, M.; Kangas, A.J.; Helisalmi, S.; Pikkarainen, M.; Koivisto, A.; et al. Low Serum High-Density Lipoprotein Cholesterol Levels Associate with the C9orf72 Repeat Expansion in Frontotemporal Lobar Degeneration Patients. J. Alzheimers Dis. 2019, 72, 127–137. [Google Scholar] [CrossRef] [PubMed] [Green Version]
- Inouye, M.; Kettunen, J.; Soininen, P.; Silander, K.; Ripatti, S.; Kumpula, L.S.; Hämäläinen, E.; Jousilahti, P.; Kangas, A.J.; Männistö, S.; et al. Metabonomic, transcriptomic, and genomic variation of a population cohort. Mol. Syst. Biol. 2010, 6, 441. [Google Scholar] [CrossRef] [PubMed]
- Sergeant, S.; Ruczinski, I.; Ivester, P.; Lee, T.C.; Morgan, T.M.; Nicklas, B.J.; Mathias, R.A.; Chilton, F.H. Impact of methods used to express levels of circulating fatty acids on the degree and direction of associations with blood lipids in humans. Br. J. Nutr. 2016, 115, 251–261. [Google Scholar] [CrossRef] [PubMed] [Green Version]
- Purcell, S.; Neale, B.; Todd-Brown, K.; Thomas, L.; Ferreira, M.A.R.; Bender, D.; Maller, J.; Sklar, P.; de Bakker, P.I.W.; Daly, M.J.; et al. PLINK: A tool set for whole-genome association and population-based linkage analyses. Am. J. Hum. Genet. 2007, 81, 559–575. [Google Scholar] [CrossRef] [Green Version]
- Chang, C.C.; Chow, C.C.; Tellier, L.C.; Vattikuti, S.; Purcell, S.M.; Lee, J.J. Second-generation PLINK: Rising to the challenge of larger and richer datasets. Gigascience 2015, 4, 7. [Google Scholar] [CrossRef]
- Barrett, J.C.; Fry, B.; Maller, J.; Daly, M.J. Haploview: Analysis and visualization of LD and haplotype maps. Bioinformatics 2005, 21, 263–265. [Google Scholar] [CrossRef] [Green Version]
- Turner, S.D. Qqman: An R package for visualizing GWAS results using Q-Q and manhattan plots. bioRxiv 2014. [Google Scholar] [CrossRef]
- Kalsbeek, A.; Veenstra, J.; Westra, J.; Disselkoen, C.; Koch, K.; McKenzie, K.A.; O’Bott, J.; Vander Woude, J.; Fischer, K.; Shearer, G.C.; et al. A genome-wide association study of red-blood cell fatty acids and ratios incorporating dietary covariates: Framingham Heart Study Offspring Cohort. PLoS ONE 2018, 13, e0194882. [Google Scholar] [CrossRef] [PubMed] [Green Version]
- Koronowicz, A.A.; Banks, P.; Szymczyk, B.; Leszczyńska, T.; Master, A.; Piasna, E.; Szczepański, W.; Domagała, D.; Kopeć, A.; Piątkowska, E.; et al. Dietary conjugated linoleic acid affects blood parameters, liver morphology and expression of selected hepatic genes in laying hens. Br. Poult. Sci. 2016, 57, 663–673. [Google Scholar] [CrossRef] [PubMed]
- Al-Dwairi, A.; Brown, A.R.; Pabona, J.M.P.; Van, T.H.; Hamdan, H.; Mercado, C.P.; Quick, C.M.; Wight, P.A.; Simmen, R.C.M.; Simmen, F.A. Enhanced Gastrointestinal Expression of Cytosolic Malic Enzyme (ME1) Induces Intestinal and Liver Lipogenic Gene Expression and Intestinal Cell Proliferation in Mice. PLoS ONE 2014, 9, e113058. [Google Scholar] [CrossRef] [PubMed] [Green Version]
- Huang, Y.; Ye, T.; Liu, C.; Fang, F.; Chen, Y.; Dong, Y. Maternal high-fat diet during pregnancy and lactation affects hepatic lipid metabolism in early life of offspring rat. J. Biosci. 2017, 42, 311–319. [Google Scholar] [CrossRef] [PubMed]
- Segarra, M.; Aburto, M.R.; Cop, F.; Llaó-Cid, C.; Härtl, R.; Damm, M.; Bethani, I.; Parrilla, M.; Husainie, D.; Schänzer, A.; et al. Endothelial Dab1 signaling orchestrates neuro-glia-vessel communication in the central nervous system. Science 2018, 361, eaao2861. [Google Scholar] [CrossRef] [Green Version]
- Suhre, K.; Shin, S.-Y.; Petersen, A.-K.; Mohney, R.P.; Meredith, D.; Wägele, B.; Altmaier, E.; CARDIoGRAM; Deloukas, P.; Erdmann, J.; et al. Human metabolic individuality in biomedical and pharmaceutical research. Nature 2011, 477, 54–60. [Google Scholar] [CrossRef]
- Sasaki, H.; Sueyasu, T.; Tokuda, H.; Ito, M.; Kaneda, Y.; Rogi, T.; Kawashima, H.; Horiguchi, S.; Kawabata, T.; Shibata, H. Aging and FADS1 polymorphisms decrease the biosynthetic capacity of long-chain PUFAs: A human trial using [U-13C] linoleic acid. Prostaglandins Leukot. Essent. Fatty Acids 2019, 148, 1–8. [Google Scholar] [CrossRef]
- Liu, F.; Li, Z.; Lv, X.; Ma, J. Dietary n-3 Polyunsaturated Fatty Acid Intakes Modify the Effect of Genetic Variation in Fatty Acid Desaturase 1 on Coronary Artery Disease. PLoS ONE 2015, 10, e0121255. [Google Scholar] [CrossRef]
- Marklund, M.; Wu, J.H.Y.; Imamura, F.; Del Gobbo, L.C.; Fretts, A.; de Goede, J.; Shi, P.; Tintle, N.; Wennberg, M.; Aslibekyan, S.; et al. Biomarkers of Dietary Omega-6 Fatty Acids and Incident Cardiovascular Disease and Mortality. Circulation 2019, 139, 2422–2436. [Google Scholar] [CrossRef] [PubMed] [Green Version]
- Nyalala, J.O.; Wang, J.; Dang, A.; Faas, F.H.; Smith, W.G. Hypertriglyceridemia and hypercholesterolemia: Effects of drug treatment on fatty acid composition of plasma lipids and membranes. Prostaglandins Leukot. Essent. Fatty Acids 2008, 78, 271–280. [Google Scholar] [CrossRef]
- Risé, P.; Marangoni, F.; Galli, C. Regulation of PUFA metabolism: Pharmacological and toxicological aspects. Prostaglandins Leukot. Essent. Fatty Acids 2002, 67, 85–89. [Google Scholar] [CrossRef] [PubMed]
- Juan, J.; Huang, H.; Jiang, X.; Ardisson Korat, A.V.; Song, M.; Sun, Q.; Willett, W.C.; Jensen, M.K.; Kraft, P. Joint effects of fatty acid desaturase 1 polymorphisms and dietary polyunsaturated fatty acid intake on circulating fatty acid proportions. Am. J. Clin. Nutr. 2018, 107, 826–833. [Google Scholar] [CrossRef] [PubMed]
- Gillingham, L.G.; Harding, S.V.; Rideout, T.C.; Yurkova, N.; Cunnane, S.C.; Eck, P.K.; Jones, P.J. Dietary oils and FADS1-FADS2 genetic variants modulate [13C] α-linolenic acid metabolism and plasma fatty acid composition. Am. J. Clin. Nutr. 2013, 97, 195–207. [Google Scholar] [CrossRef] [PubMed] [Green Version]
- Hallmann, J.; Kolossa, S.; Gedrich, K.; Celis-Morales, C.; Forster, H.; O’Donovan, C.B.; Woolhead, C.; Macready, A.L.; Fallaize, R.; Marsaux, C.F.M.; et al. Predicting fatty acid profiles in blood based on food intake and the FADS1 rs174546 SNP. Mol. Nutr. Food. Res. 2015, 59, 2565–2573. [Google Scholar] [CrossRef] [PubMed]
- Zhu, B.-H.; Zhang, R.-H.; Lv, N.-N.; Yang, G.-P.; Wang, Y.-S.; Pan, K.-H. The Role of Malic Enzyme on Promoting Total Lipid and Fatty Acid Production in Phaeodactylum tricornutum. Front. Plant Sci. 2018, 9, 826. [Google Scholar] [CrossRef] [PubMed]
- Mühlroth, A.; Li, K.; Røkke, G.; Winge, P.; Olsen, Y.; Hohmann-Marriott, M.; Vadstein, O.; Bones, A. Pathways of Lipid Metabolism in Marine Algae, Co-Expression Network, Bottlenecks and Candidate Genes for Enhanced Production of EPA and DHA in Species of Chromista. Marine Drugs 2013, 11, 4662–4697. [Google Scholar] [CrossRef]
- Rovadoscki, G.A.; Pertile, S.F.N.; Alvarenga, A.B.; Cesar, A.S.M.; Pértille, F.; Petrini, J.; Franzo, V.; Soares, W.V.B.; Morota, G.; Spangler, M.L.; et al. Estimates of genomic heritability and genome-wide association study for fatty acids profile in Santa Inês sheep. BMC Genom. 2018, 19, 375. [Google Scholar] [CrossRef]
- Benítez, R.; Fernández, A.; Isabel, B.; Núñez, Y.; De Mercado, E.; Gómez-Izquierdo, E.; García-Casco, J.; López-Bote, C.; Óvilo, C. Modulatory Effects of Breed, Feeding Status, and Diet on Adipogenic, Lipogenic, and Lipolytic Gene Expression in Growing Iberian and Duroc Pigs. Int. J. Med. Sci. 2017, 19, 22. [Google Scholar] [CrossRef] [Green Version]
- Wathes, D.C.; Abayasekara, D.R.E.; Aitken, R.J. Polyunsaturated Fatty Acids in Male and Female Reproduction. Biol. Reprod. 2007, 77, 190–201. [Google Scholar] [CrossRef]
- Feltham, B.A.; Balogun, K.A.; Cheema, S.K. Perinatal and postweaning diets high in omega-3 fatty acids have age- and sex-specific effects on the fatty acid composition of the cerebellum and brainstem of C57BL/6 mice. Prostaglandins Leukot. Essent. Fatty Acids 2019, 148, 16–24. [Google Scholar] [CrossRef]
- Corella, D.; Coltell, O.; Portolés, O.; Sotos-Prieto, M.; Fernández-Carrión, R.; Ramirez-Sabio, J.; Zanón-Moreno, V.; Mattei, J.; Sorlí, J.; Ordovas, J. A Guide to Applying the Sex-Gender Perspective to Nutritional Genomics. Nutrients 2018, 11, 4. [Google Scholar] [CrossRef] [PubMed] [Green Version]
- Fukada, T.; Shibata, S.; Ueda, T.; Sasaki, K.; Shimoida, Y.; Senda-Murata, K.; Sugimoto, K. Characterization of nucleolar localization and exclusion signals in terminal deoxynucleotidyltransferase interacting factor 2/estrogen receptor α-binding protein. Biosci. Biotechnol. Biochem. 2019, 83, 1255–1262. [Google Scholar] [CrossRef] [PubMed]
- Yamada, Y.; Kato, K.; Oguri, M.; Horibe, H.; Fujimaki, T.; Yasukochi, Y.; Takeuchi, I.; Sakuma, J. Identification of nine genes as novel susceptibility loci for early-onset ischemic stroke, intracerebral hemorrhage, or subarachnoid hemorrhage. Biomed. Rep. 2018, 9, 8–20. [Google Scholar] [CrossRef] [PubMed] [Green Version]


| Variables | Total (n = 426) | Men (n = 187) | Women (n = 239) | p |
|---|---|---|---|---|
| Age (years) | 65.1 ± 0.2 | 64.0 ± 0.4 | 66.0 ± 0.3 | <0.001 |
| Weight (Kg) | 84.2 ± 0.7 | 92.5 ± 1.0 | 77.7 ± 0.6 | <0.001 |
| BMI (Kg/m2) | 32.3 ± 0.2 | 32.2 ± 0.3 | 32.3 ± 0.2 | 0.836 |
| Waist circumference (cm) | 105.8 ± 0.5 | 110.9 ± 0.6 | 101.8 ± 0.6 | <0.001 |
| SBP (mm Hg) | 141.9 ± 0.9 | 144.1 ± 1.4 | 140.1 ± 1.2 | 0.029 |
| DBP (mm Hg) | 81.0 ± 0.5 | 82.7 ± 0.7 | 79.6 ± 0.6 | 0.001 |
| Total cholesterol (mg/dL) | 196.4 ± 1.8 | 188.3 ± 2.9 | 202.7 ± 2.3 | <0.001 |
| LDL-C (mg/dL) | 124.9 ± 1.5 | 121.9 ± 2.4 | 127.2 ± 1.9 | 0.078 |
| HDL-C (mg/dL) | 51.6 ± 0.6 | 47.3 ± 0.8 | 55.0 ± 0.7 | <0.001 |
| Triglycerides (mg/dL) | 140.7 ± 2.9 | 137.6 ± 3.9 | 143.1 ± 4.1 | 0.334 |
| Fasting glucose (mg/dL) | 112.4 ± 1.3 | 113.5 ± 2.1 | 111.5 ± 1.6 | 0.441 |
| Total fatty acids (mmol/L) | 11.09 ± 0.10 | 10.63 ± 0.14 | 14.46 ± 0.14 | <0.001 |
| SFA (mmol/L) | 4.02 ± 0.04 | 3.85 ± 0.05 | 4.16 ± 0.05 | <0.001 |
| MUFA (mmol/L) | 3.09 ± 0.03 | 2.97 ± 0.04 | 3.20 ± 0.05 | <0.001 |
| PUFA (mmol/L) | 3.97 ± 0.04 | 3.81 ± 0.05 | 4.10 ± 0.05 | <0.001 |
| Omega-3 (mmol/L) | 0.46 ± 0.01 | 0.43 ± 0.01 | 0.48 ± 0.01 | <0.001 |
| Omega-6 (mmol/L) | 3.52 ± 0.03 | 3.38 ± 0.04 | 3.63 ± 0.04 | <0.001 |
| DHA (mmol/L) | 0.146 ± 0.002 | 0.140 ± 0.003 | 0.150 ± 0.003 | 0.013 |
| LA (mmol/L) | 2.88 ± 0.03 | 2.78 ± 0.04 | 2.97 ± 0.04 | 0.001 |
| SFA (%) 1 | 36.27 ± 0.06 | 36.25 ± 0.09 | 36.29 ± 0.08 | 0.722 |
| MUFA (%) 2 | 27.82 ± 0.09 | 27.85 ± 0.13 | 27.79 ± 0.13 | 0.754 |
| PUFA (%) 3 | 35.90 ± 0.11 | 35.89 ± 0.16 | 35.91 ± 0.15 | 0.950 |
| Omega-3 (%) 4 | 4.09 ± 0.03 | 4.04 ± 0.05 | 4.13 ± 0.05 | 0.182 |
| Omega-6 (%) 5 | 31.80 ± 0.10 | 31.85 ± 0.15 | 31.78 ± 0.14 | 0.723 |
| DHA (%) 6 | 1.30 ± 0.01 | 1.31 ± 0.02 | 1.30 ± 0.02 | 0.710 |
| LA (%) 7 | 26.04 ± 0.11 | 26.18 ± 0.18 | 25.90 ± 0.15 | 0.272 |
| Omega-6/Omega-3 ratio | 7.98 ± 0.07 | 8.07 ± 0.10 | 7.91 ± 0.09 | 0.254 |
| Type 2 diabetes: n, % | 160 (37.6) | 70 (37.4) | 90 (37.7) | 0.962 |
| Current smokers: n, % | 46 (10.8) | 28 (15.0) | 18 (7.5) | <0.001 |
| Antihypertensive drugs | 334 (78.4) | 148 (79.1) | 186 (77.8) | 0.742 |
| Hypolipidemic drugs | 274 (64.3) | 121 (64.7) | 153 (64.0) | 0.883 |
| Metformin treatment | 128 (30.0) | 56 (29.9) | 72 (30.1) | 0.968 |
| Insulin treatment | 19 (4.5) | 11 (5.9) | 8 (3.3) | 0.208 |
| Physical Activity (MET.min/wk) | 1724 ± 76 | 1950 ± 132 | 1547 ± 85 | 0.008 |
| Adherence to MedDiet (P17) 8 | 8.1 ± 0.1 | 7.8 ± 0.2 | 8.2 ± 0.2 | 0.145 |
| Unadjusted 1 | Adjusted 2 | ||||||||||||||
|---|---|---|---|---|---|---|---|---|---|---|---|---|---|---|---|
| Chr | SNP | Gene | Position 3 | Allele | MAF | Beta 1 | SE 1 | R2 (1) | p1 | Chr | SNP | Gene | MAF | Beta 2 | p2 |
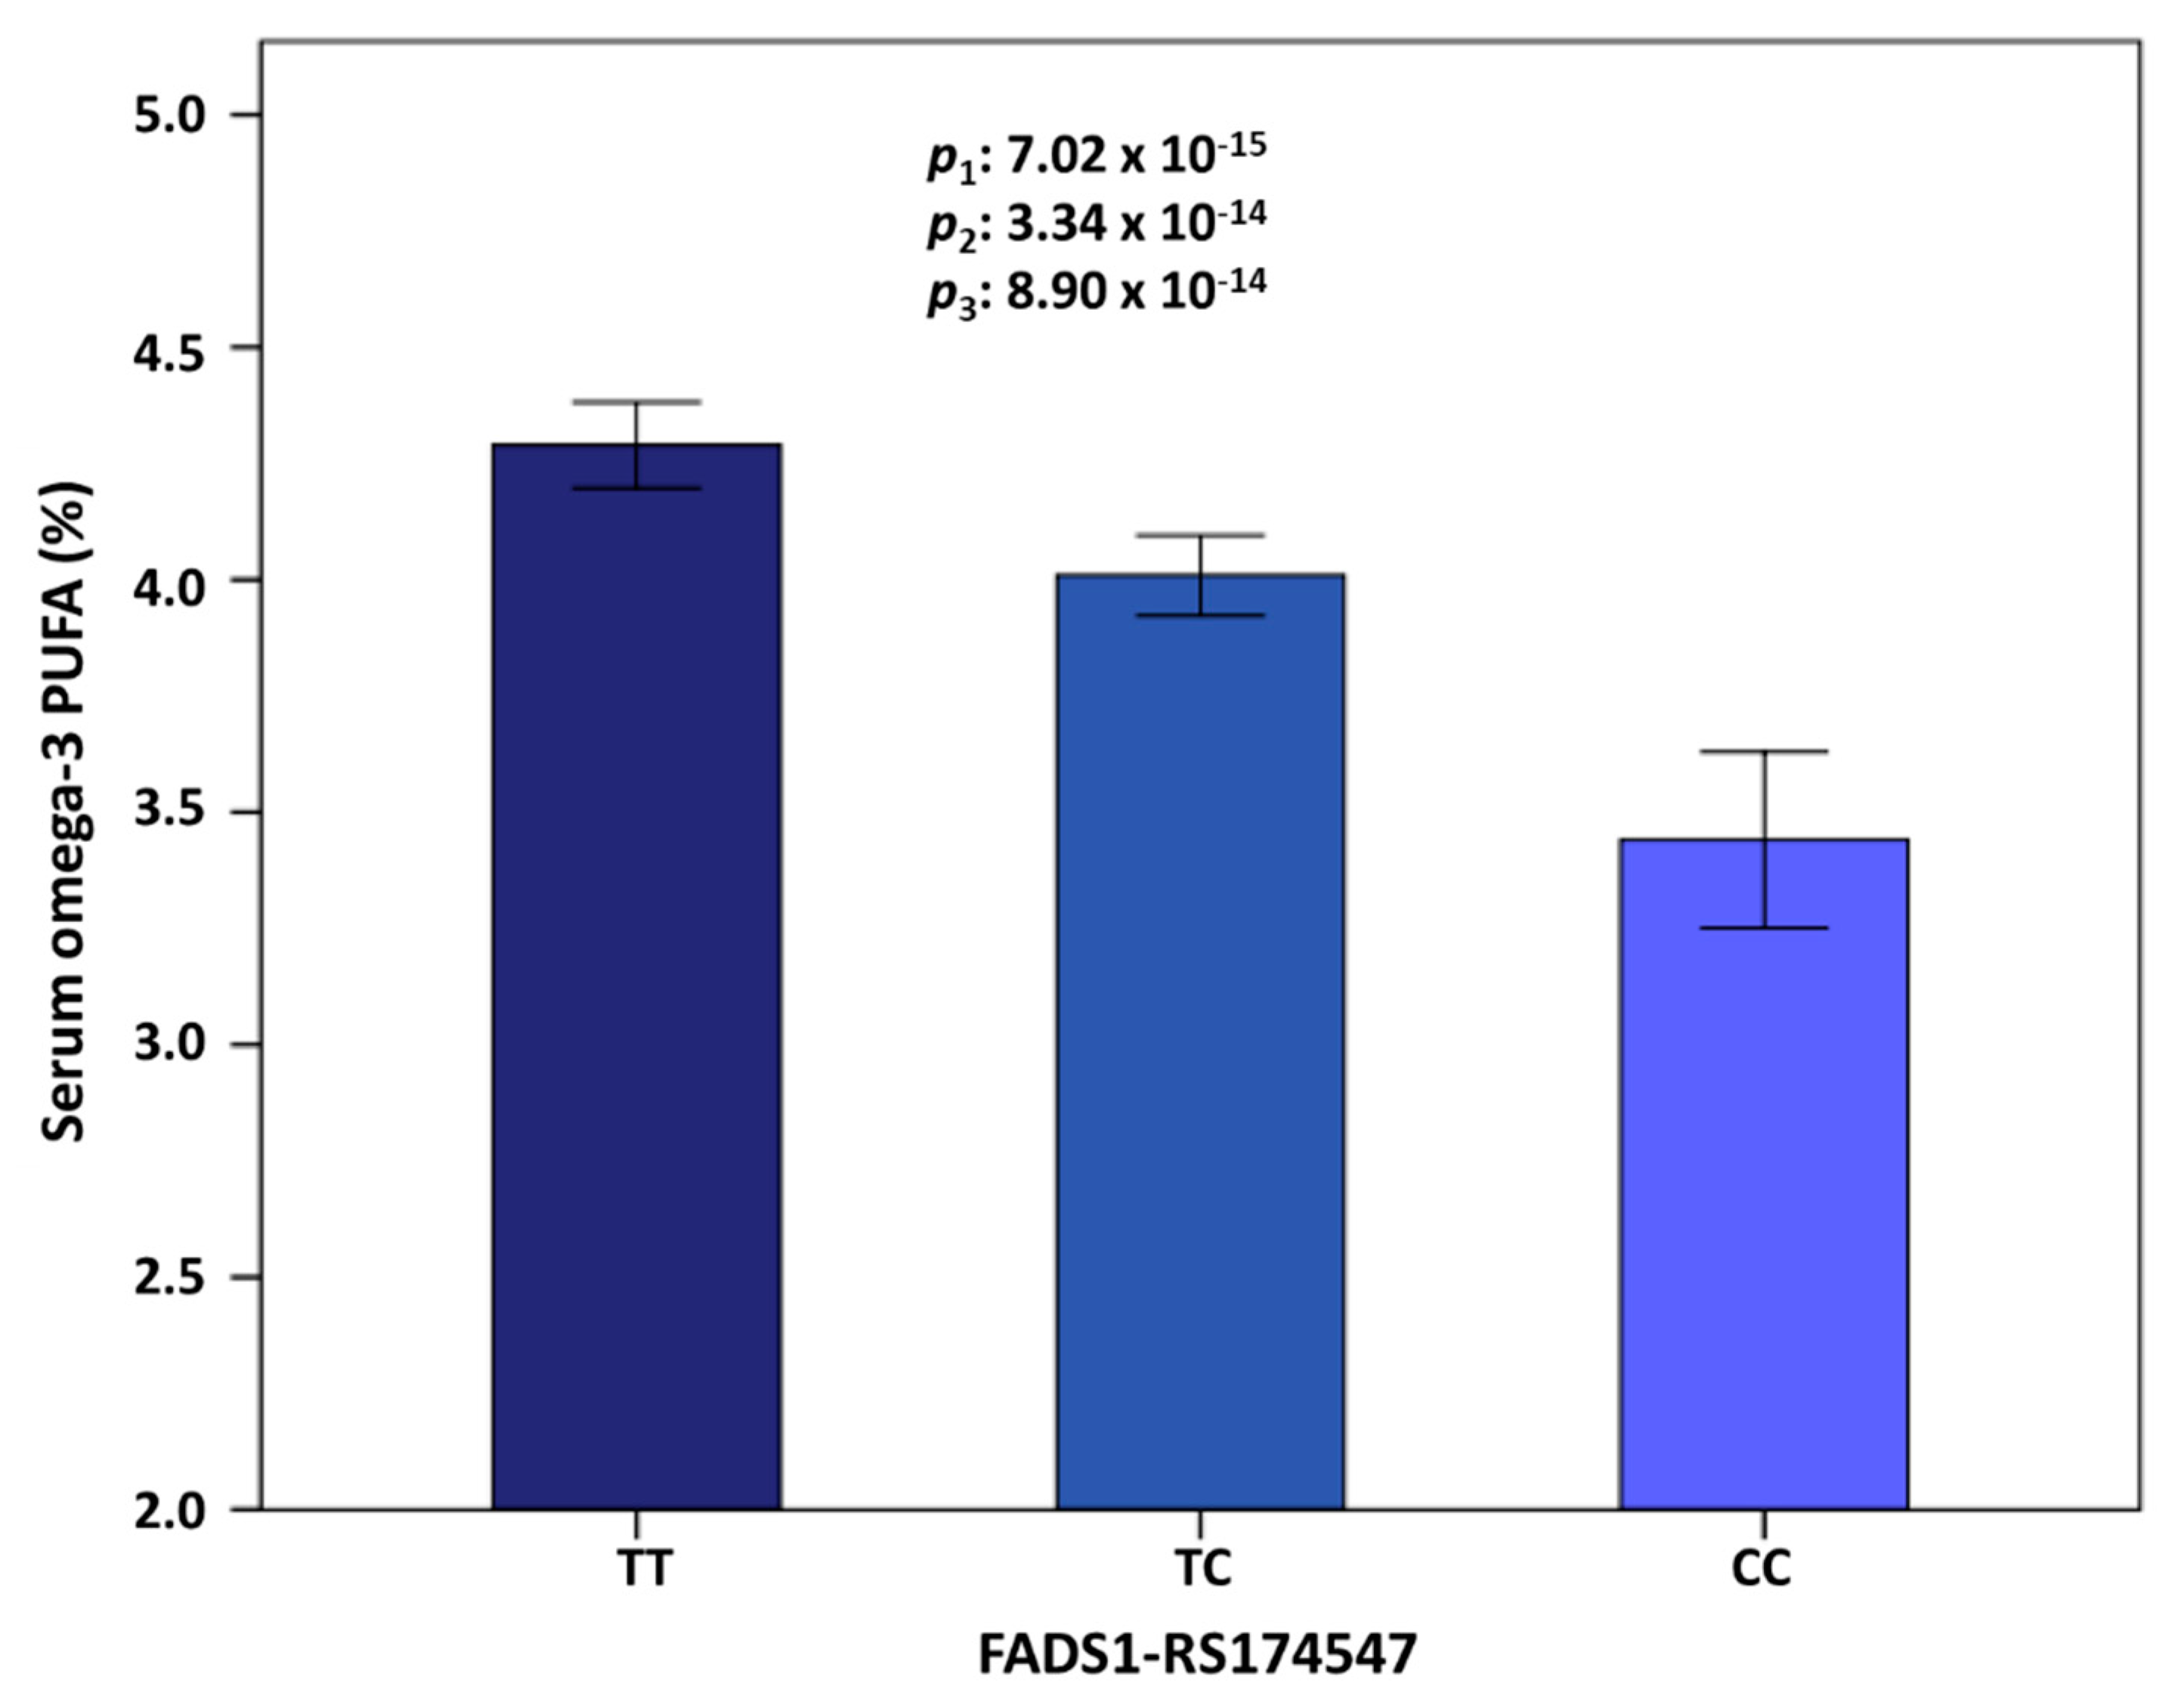
| 11 | rs174547 | FADS1 | 61570783 | C | 0.298 | −0.372 | 0.046 | 0.134 | 7.02 × 10⁻¹⁵ | 11 | rs174547 | FADS1 | 0.298 | −0.366 | 3.34 × 10⁻¹⁴ |
| 11 | rs174550 | FADS1 | 61571478 | C | 0.298 | −0.369 | 0.046 | 0.132 | 1.10 × 10⁻¹⁴ | 11 | rs174550 | FADS1 | 0.298 | −0.364 | 5.35 × 10⁻¹⁴ |
| 11 | rs174546 | FADS1 | 61569830 | T | 0.298 | −0.368 | 0.046 | 0.131 | 1.34 × 10⁻¹⁴ | 11 | rs1535 | FADS2 | 0.322 | −0.356 | 5.85 × 10⁻¹⁴ |
| 11 | rs1535 | FADS2 | 61597972 | G | 0.322 | −0.361 | 0.045 | 0.131 | 1.51 × 10⁻¹⁴ | 11 | rs174546 | FADS1 | 0.298 | −0.362 | 6.72 × 10⁻¹⁴ |
| 11 | rs174583 | FADS2 | 61609750 | T | 0.369 | −0.352 | 0.044 | 0.129 | 2.38 × 10⁻¹⁴ | 11 | rs174583 | FADS2 | 0.369 | −0.346 | 9.75 × 10⁻¹⁴ |
| 11 | rs174576 | FADS2 | 61603510 | A | 0.363 | −0.352 | 0.045 | 0.129 | 2.49 × 10⁻¹⁴ | 11 | rs174576 | FADS2 | 0.363 | −0.346 | 1.17 × 10⁻¹³ |
| 11 | rs174577 | FADS2 | 61604814 | A | 0.392 | −0.339 | 0.045 | 0.119 | 2.56 × 10⁻¹³ | 11 | rs174577 | FADS2 | 0.392 | −0.332 | 1.12 × 10⁻¹² |
| 11 | rs174535 | MYRF | 61551356 | C | 0.340 | −0.344 | 0.046 | 0.117 | 3.56 × 10⁻¹³ | 11 | rs174535 | MYRF | 0.340 | −0.339 | 1.49 × 10⁻¹² |
| 11 | rs102275 | TMEM258 | 61557803 | C | 0.493 | −0.338 | 0.045 | 0.116 | 5.79 × 10⁻¹³ | 11 | rs102275 | TMEM258 | 0.493 | −0.332 | 2.43 × 10⁻¹² |
| 11 | rs174538 | FEN1 | 61560081 | A | 0.282 | −0.346 | 0.048 | 0.107 | 4.25 × 10⁻¹² | 11 | rs174538 | FEN1 | 0.282 | −0.339 | 1.96 × 10⁻¹¹ |
| 11 | rs108499 | MYRF | 61547237 | T | 0.288 | −0.332 | 0.048 | 0.103 | 1.31 × 10⁻¹¹ | 11 | rs108499 | MYRF | 0.288 | −0.327 | 4.21 × 10⁻¹¹ |
| 11 | rs174532 | MYRF | 61548874 | A | 0.100 | 0.267 | 0.046 | 0.074 | 1.12 × 10−08 | 11 | rs174532 | MYRF | 0.100 | 0.267 | 1.20 × 10−08 |
| 11 | rs2727270 | FADS2 | 61603237 | T | 0.163 | −0.402 | 0.077 | 0.060 | 2.88 × 10−07 | 11 | rs2727270 | FADS2 | 0.163 | −0.391 | 8.01 × 10−07 |
| 6 | rs2092556 | LINC00271 | 135899344 | C | 0.188 | 0.409 | 0.085 | 0.052 | 2.23 × 10−06 | 6 | rs2092556 | LINC00271 | 0.188 | 0.413 | 1.85 × 10−06 |
| 14 | rs7149414 | intergenic | 31237170 | A | 0.133 | 0.381 | 0.080 | 0.052 | 2.31 × 10−06 | 4 | rs2736982 | DSPP | 0.326 | 0.220 | 2.09 × 10−06 |
| 5 | rs7736605 | WDR70 | 37642044 | A | 0.059 | 0.775 | 0.163 | 0.051 | 2.72 × 10−06 | 5 | rs7736605 | WDR70 | 0.059 | 0.782 | 2.26 × 10−06 |
| 6 | rs10499212 | intergenic | 140027475 | T | 0.100 | 0.642 | 0.136 | 0.051 | 3.11 × 10−06 | 14 | rs7149414 | intergenic | 0.133 | 0.382 | 2.31 × 10−06 |
| 6 | rs4896151 | LINC00271 | 135829796 | T | 0.141 | 0.398 | 0.085 | 0.049 | 3.93 × 10−06 | 1 | rs11164689 | intergenic | 0.065 | 0.500 | 3.09 × 10−06 |
| 1 | rs11164689 | intergenic | 103603452 | T | 0.065 | 0.491 | 0.106 | 0.049 | 4.32 × 10−06 | 6 | rs4896151 | LINC00271 | 0.141 | 0.402 | 3.42 × 10−06 |
| 6 | rs1547079 | AHI1 | 135749202 | C | 0.177 | 0.389 | 0.085 | 0.047 | 5.91 × 10−06 | 6 | rs1547079 | AHI1 | 0.177 | 0.634 | 4.69 × 10−06 |
| 6 | rs9494274 | LINC00271 | 0.234 | 0.394 | 7.95 × 10−06 | ||||||||||
| Unadjusted 1 | Adjusted 2 | ||||||||||||||
|---|---|---|---|---|---|---|---|---|---|---|---|---|---|---|---|
| Chr | SNP | Gene | Position 3 | Allele | MAF | Beta 1 | SE 1 | R2 (1) | p1 | Chr | SNP | Gene | MAF | Beta 2 | p2 |
| 11 | rs174547 | FADS1 | 61570783 | C | 0.298 | −0.122 | 0.017 | 0.106 | 6.12 × 10⁻¹² | 11 | rs174547 | FADS1 | 0.298 | −0.121 | 1.28 × 10⁻¹¹ |
| 11 | rs174550 | FADS1 | 61571478 | C | 0.298 | −0.121 | 0.017 | 0.105 | 7.35 × 10⁻¹² | 11 | rs174550 | FADS1 | 0.298 | −0.121 | 1.50 × 10⁻¹¹ |
| 11 | rs174546 | FADS1 | 61569830 | T | 0.298 | −0.121 | 0.017 | 0.104 | 8.24 × 10⁻¹² | 11 | rs174546 | FADS1 | 0.298 | −0.120 | 1.66 × 10⁻¹¹ |
| 11 | rs1535 | FADS2 | 61597972 | G | 0.322 | −0.118 | 0.017 | 0.103 | 1.29 × 10⁻¹¹ | 11 | rs1535 | FADS2 | 0.322 | −0.117 | 2.87 × 10⁻¹¹ |
| 11 | rs174583 | FADS2 | 61609750 | T | 0.369 | −0.115 | 0.017 | 0.102 | 1.54 × 10⁻¹¹ | 11 | rs174583 | FADS2 | 0.369 | −0.114 | 3.34 × 10⁻¹¹ |
| 11 | rs174576 | FADS2 | 61603510 | A | 0.363 | −0.115 | 0.017 | 0.101 | 2.11 × 10⁻¹¹ | 11 | rs174576 | FADS2 | 0.363 | −0.114 | 4.42 × 10⁻¹¹ |
| 11 | rs174577 | FADS2 | 61604814 | A | 0.392 | −0.109 | 0.017 | 0.092 | 1.66 × 10⁻¹⁰ | 11 | rs174538 | FEN1 | 0.282 | −0.117 | 3.40 × 10⁻¹⁰ |
| 11 | rs174538 | FEN1 | 61560081 | A | 0.282 | −0.117 | 0.018 | 0.092 | 1.77 × 10⁻¹⁰ | 11 | rs174577 | FADS2 | 0.392 | −0.109 | 3.47 × 10⁻¹⁰ |
| 11 | rs174535 | MYRF | 61551356 | C | 0.340 | −0.111 | 0.017 | 0.091 | 1.91 × 10⁻¹⁰ | 11 | rs174535 | MYRF | 0.340 | −0.111 | 3.89 × 10⁻¹⁰ |
| 11 | rs102275 | TMEM258 | 61557803 | C | 0.493 | −0.108 | 0.017 | 0.088 | 4.14 × 10⁻¹⁰ | 11 | rs102275 | TMEM258 | 0.493 | −0.108 | 8.79 × 10⁻¹⁰ |
| 11 | rs108499 | MYRF | 61547237 | T | 0.288 | −0.112 | 0.018 | 0.087 | 5.76 × 10⁻¹⁰ | 11 | rs108499 | MYRF | 0.288 | −0.111 | 1.22 × 10−09 |
| 11 | rs174532 | MYRF | 61548874 | A | 0.100 | 0.089 | 0.017 | 0.061 | 2.19 × 10−07 | 11 | rs174532 | MYRF | 0.100 | 0.088 | 3.43 × 10−07 |
| 6 | rs2092556 | LINC00271 | 135899344 | C | 0.188 | 0.154 | 0.031 | 0.055 | 1.13 × 10−06 | 6 | rs2092556 | LINC00271 | 0.188 | 0.154 | 1.24 × 10−06 |
| 6 | rs10499212 | intergenic | 140027475 | T | 0.100 | 0.239 | 0.050 | 0.052 | 2.27 × 10−06 | 4 | rs2736982 | DSPP | 0.326 | 0.081 | 2.25 × 10−06 |
| 1 | rs3001080 | intergenic | 163434750 | G | 0.426 | −0.082 | 0.017 | 0.050 | 2.90 × 10−06 | 6 | rs10499212 | intergenic | 0.100 | 0.238 | 2.64 × 10−06 |
| 6 | rs4896151 | LINC00271 | 135829796 | T | 0.141 | 0.148 | 0.031 | 0.050 | 2.90 × 10−06 | 6 | rs4896151 | LINC00271 | 0.141 | 0.149 | 3.04 × 10−06 |
| 4 | rs2736982 | DSPP | 88534235 | A | 0.326 | 0.079 | 0.017 | 0.050 | 3.13 × 10−06 | 1 | rs3001080 | intergenic | 0.426 | −0.081 | 3.57 × 10−06 |
| 1 | rs16856236 | DISC1 | 232160058 | G | 0.062 | 0.188 | 0.040 | 0.050 | 3.38 × 10−06 | 6 | rs1547079 | AHI1 | 0.177 | 0.146 | 3.91 × 10−06 |
| 6 | rs1547079 | AHI1 | 135749202 | C | 0.177 | 0.146 | 0.031 | 0.049 | 3.85 × 10−06 | 1 | rs16856236 | DISC1 | 0.062 | 0.186 | 4.01 × 10−06 |
| 5 | rs7736605 | WDR70 | 37642044 | A | 0.059 | 0.280 | 0.060 | 0.049 | 3.86 × 10−06 | 5 | rs7736605 | WDR70 | 0.059 | 0.281 | 4.05 × 10−06 |
| 6 | rs9494274 | LINC00271 | 135880480 | G | 0.234 | 0.135 | 0.029 | 0.048 | 5.55 × 10−06 | 5 | rs9312754 | CTNND2 | 0.261 | 0.123 | 5.24 × 10−06 |
| 5 | rs9312754 | CTNND2 | 11088028 | C | 0.261 | 0.122 | 0.027 | 0.047 | 6.18 × 10−06 | 6 | rs9494274 | LINC00271 | 0.234 | 0.135 | 6.35 × 10−06 |
| 18 | rs165155 | intergenic | 75341905 | C | 0.163 | −0.110 | 0.024 | 0.047 | 6.53 × 10−06 | 18 | rs165155 | intergenic | 0.163 | −0.109 | 8.42 × 10−06 |
| 10 | rs16911516 | intergenic | 59751257 | C | 0.086 | −0.337 | 0.074 | 0.047 | 7.04 × 10−06 | 10 | rs16911516 | intergenic | 0.086 | −0.336 | 8.92 × 10−06 |
| 1 | rs11164689 | intergenic | 0.065 | 0.175 | 9.18 × 10−06 | ||||||||||
| Adjusted 1 | |||||||
|---|---|---|---|---|---|---|---|
| Chr | SNP | Gene | Position2 | Alleles | MAF | Beta | p |
| 11 | rs174611 | FADS2 | 61627881 | C | 0.116 | 0.679 | 4.86 × 10−04 |
| 11 | rs174618 | FADS2 | 61629322 | C | 0.349 | 0.550 | 1.21 × 10−03 |
| 11 | rs174547 | FADS1 | 61570783 | C | 0.298 | 0.527 | 2.78 × 10−03 |
| 11 | rs174583 | FADS2 | 61609750 | T | 0.369 | 0.507 | 2.88 × 10−03 |
| 11 | rs174546 | FADS1 | 61569830 | T | 0.298 | 0.521 | 3.19 × 10−03 |
| 11 | rs174550 | FADS1 | 61571478 | C | 0.298 | 0.512 | 3.82 × 10−03 |
| 11 | rs174576 | FADS2 | 61603510 | A | 0.363 | 0.493 | 3.83 × 10−03 |
| 11 | rs174577 | FADS2 | 61604814 | A | 0.392 | 0.491 | 3.89 × 10−03 |
| 11 | rs174450 | FADS3 | 61641542 | T | 0.435 | 0.481 | 5.15 × 10−03 |
| 11 | rs1535 | FADS2 | 61597972 | G | 0.322 | 0.482 | 5.49 × 10−03 |
| 11 | rs17156442 | FADS2 | 61614023 | T | 0.098 | 0.976 | 8.04 × 10−03 |
| 11 | rs174455 | FADS3 | 61656117 | A | 0.407 | 0.401 | 1.93 × 10−02 |
| 11 | rs1000778 | FADS3 | 61655305 | A | 0.477 | 0.329 | 7.15 × 10−02 |
| 11 | rs174570 | FADS2 | 61597212 | T | 0.228 | 0.219 | 3.84 × 10−01 |
| 11 | rs2727270 | FADS2 | 61603237 | T | 0.163 | 0.236 | 4.08 × 10−01 |
| 11 | rs482548 | FADS2 | 61633182 | T | 0.030 | 0.216 | 4.19 × 10−01 |
| 11 | rs17764288 | FADS2 | 61633736 | A | 0.003 | 0.520 | 5.00 × 10−01 |
| 11 | rs12807005 | FADS2 | 61591059 | A | 0.006 | 0.357 | 6.30 × 10−01 |
| 11 | rs2851682 | FADS2 | 61616012 | G | 0.149 | 0.133 | 6.75 × 10−01 |
| 11 | rs498793 | FADS2 | 61624705 | T | 0.313 | −0.048 | 7.77 × 10−01 |
| 11 | rs7942717 | FADS3 | 61647288 | G | 0.097 | 0.040 | 8.83 × 10−01 |
© 2020 by the authors. Licensee MDPI, Basel, Switzerland. This article is an open access article distributed under the terms and conditions of the Creative Commons Attribution (CC BY) license (http://creativecommons.org/licenses/by/4.0/).
Share and Cite
Coltell, O.; Sorlí, J.V.; Asensio, E.M.; Barragán, R.; González, J.I.; Giménez-Alba, I.M.; Zanón-Moreno, V.; Estruch, R.; Ramírez-Sabio, J.B.; Pascual, E.C.; et al. Genome-Wide Association Study for Serum Omega-3 and Omega-6 Polyunsaturated Fatty Acids: Exploratory Analysis of the Sex-Specific Effects and Dietary Modulation in Mediterranean Subjects with Metabolic Syndrome. Nutrients 2020, 12, 310. https://doi.org/10.3390/nu12020310
Coltell O, Sorlí JV, Asensio EM, Barragán R, González JI, Giménez-Alba IM, Zanón-Moreno V, Estruch R, Ramírez-Sabio JB, Pascual EC, et al. Genome-Wide Association Study for Serum Omega-3 and Omega-6 Polyunsaturated Fatty Acids: Exploratory Analysis of the Sex-Specific Effects and Dietary Modulation in Mediterranean Subjects with Metabolic Syndrome. Nutrients. 2020; 12(2):310. https://doi.org/10.3390/nu12020310
Chicago/Turabian StyleColtell, Oscar, Jose V. Sorlí, Eva M. Asensio, Rocío Barragán, José I. González, Ignacio M. Giménez-Alba, Vicente Zanón-Moreno, Ramon Estruch, Judith B. Ramírez-Sabio, Eva C. Pascual, and et al. 2020. "Genome-Wide Association Study for Serum Omega-3 and Omega-6 Polyunsaturated Fatty Acids: Exploratory Analysis of the Sex-Specific Effects and Dietary Modulation in Mediterranean Subjects with Metabolic Syndrome" Nutrients 12, no. 2: 310. https://doi.org/10.3390/nu12020310