Krill Oil Has Different Effects on the Plasma Lipidome Compared with Fish Oil Following 30 Days of Supplementation in Healthy Women: A Randomized Controlled and Crossover Study

 , , and
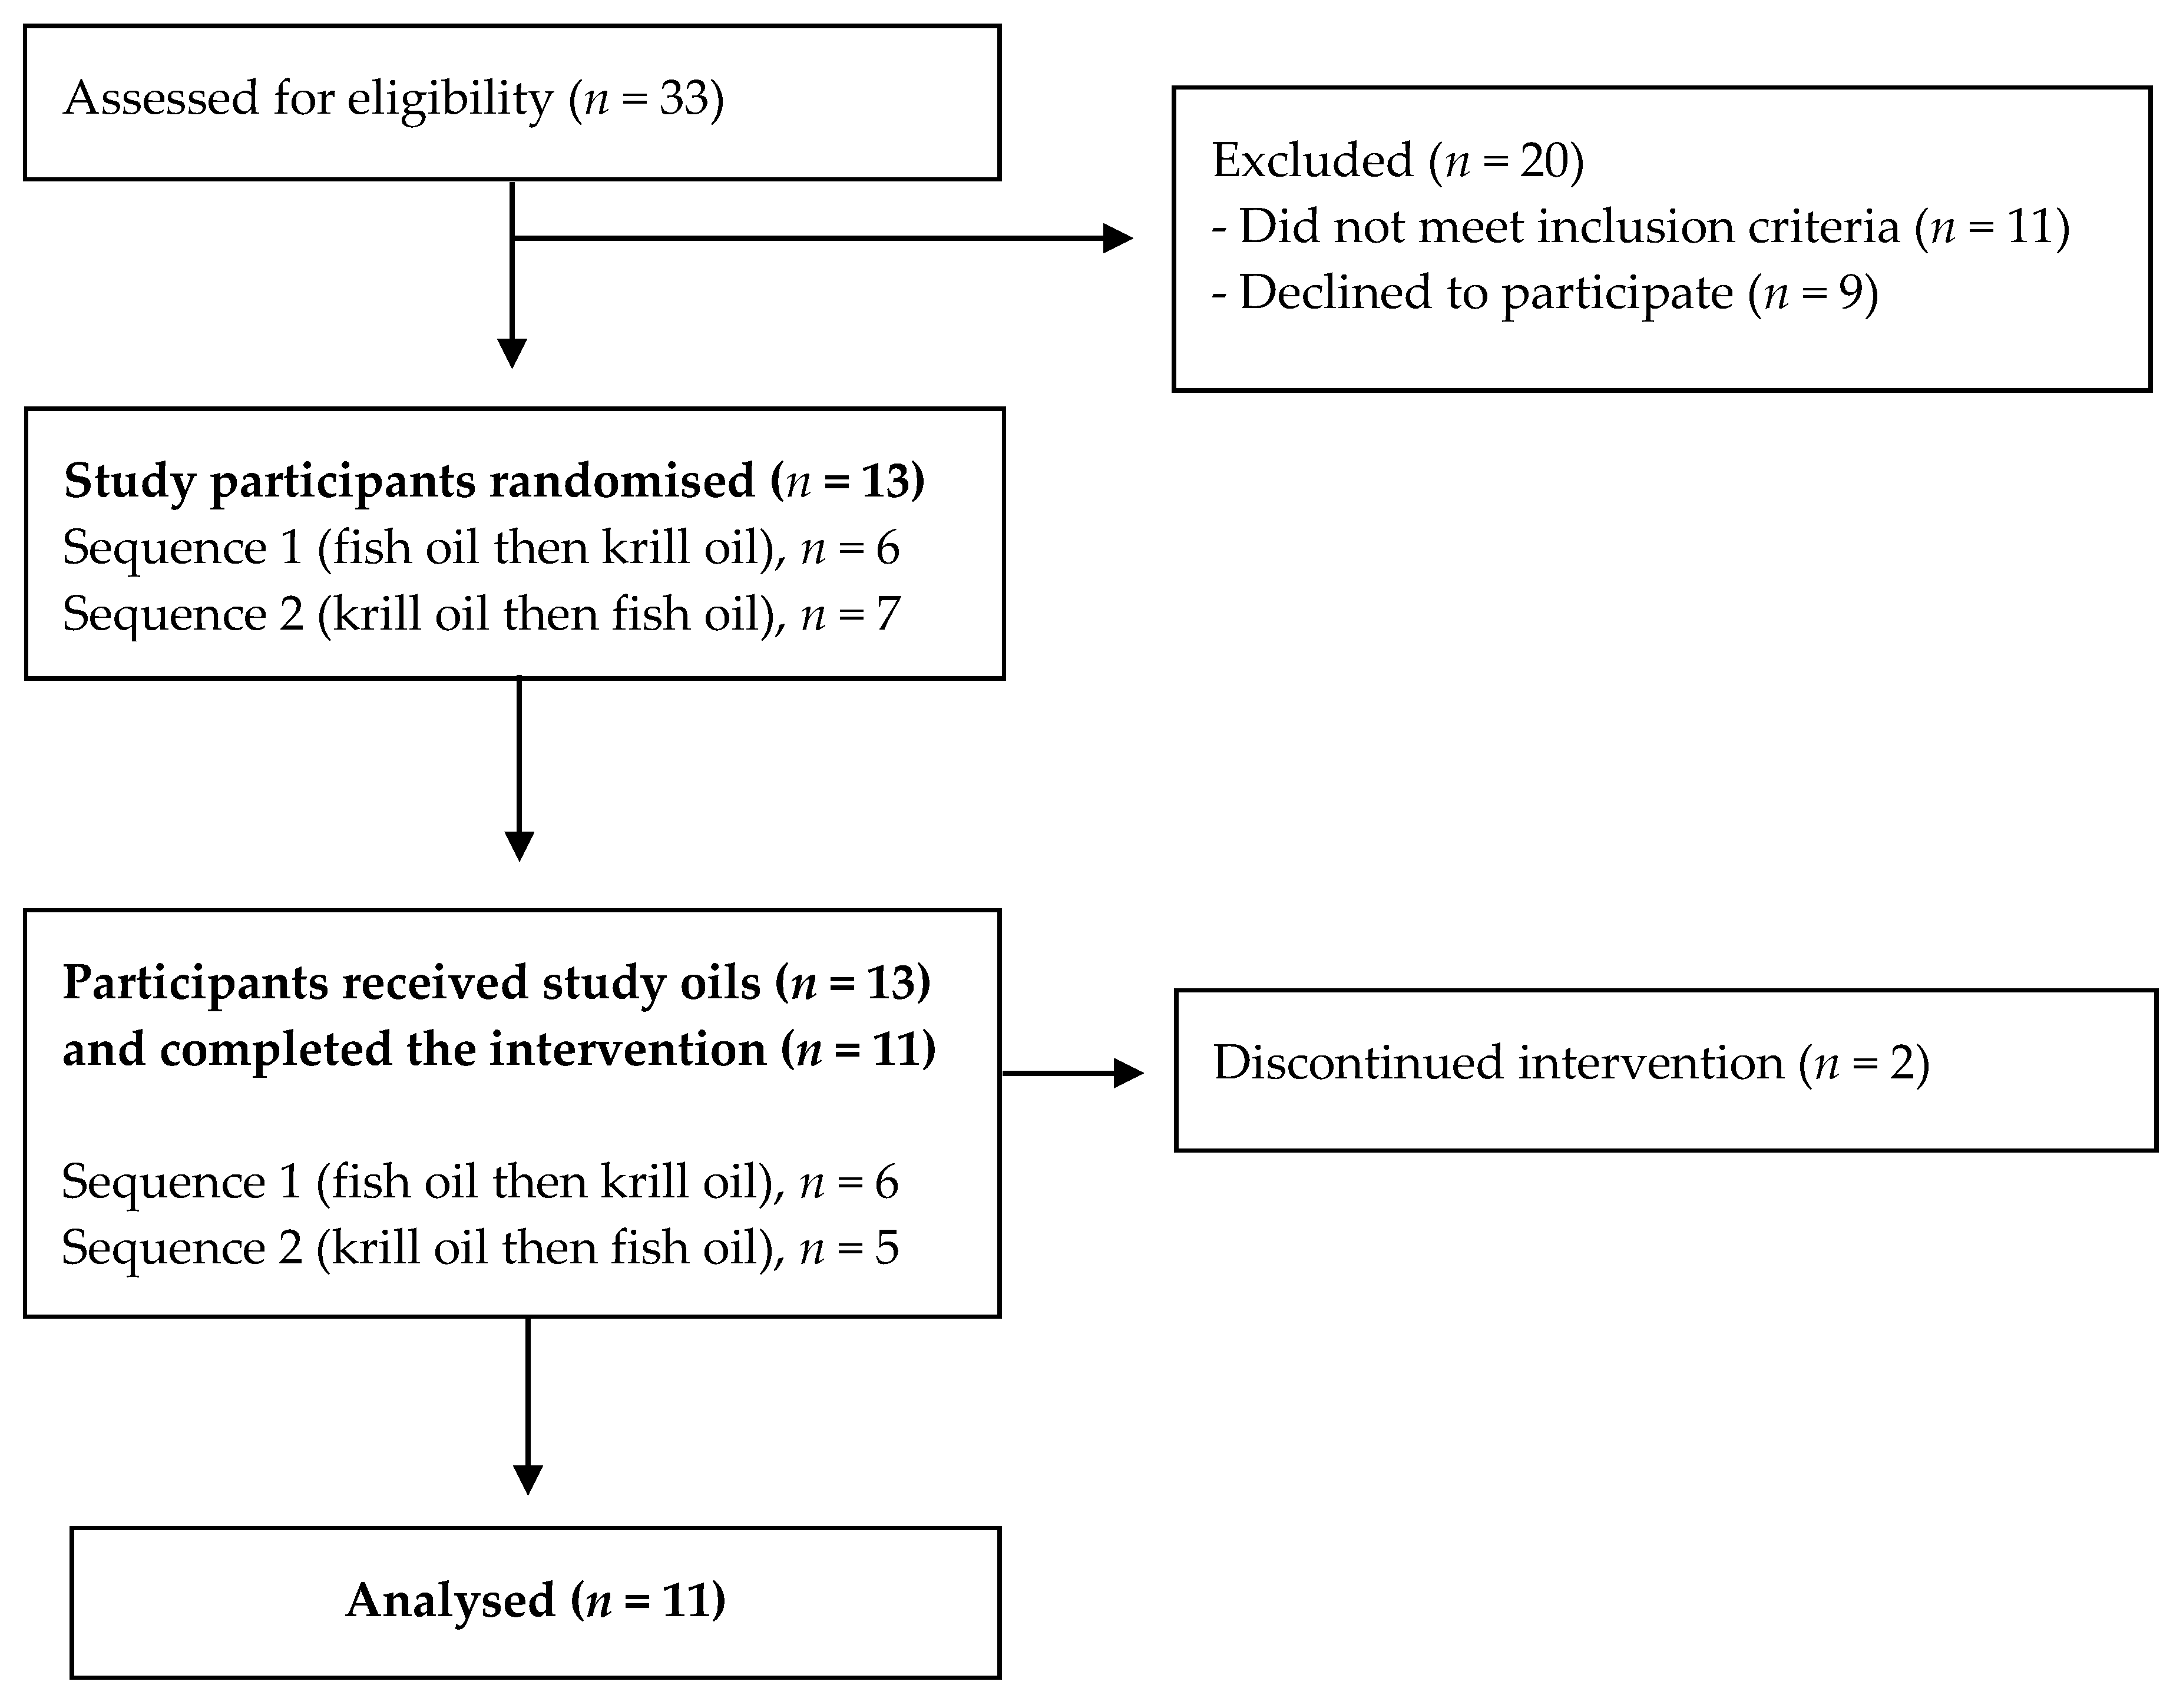
Abstract
:1. Introduction
2. Materials and Methods
2.1. Study Participants
2.2. Study Design
2.3. Dietary Assessment
2.4. Plasma and Oil Fatty Acids Analysis
2.5. Lipid Extraction, Lipidomics Analysis, and Identification of Lipid Molecular Species
2.6. Statistical Analysis
3. Results
3.1. Participant Characteristics and Intake of Dietary Long-Chain Omega-3 PUFA at Baseline
3.2. Responses of Plasma LC Omega-3 PUFA
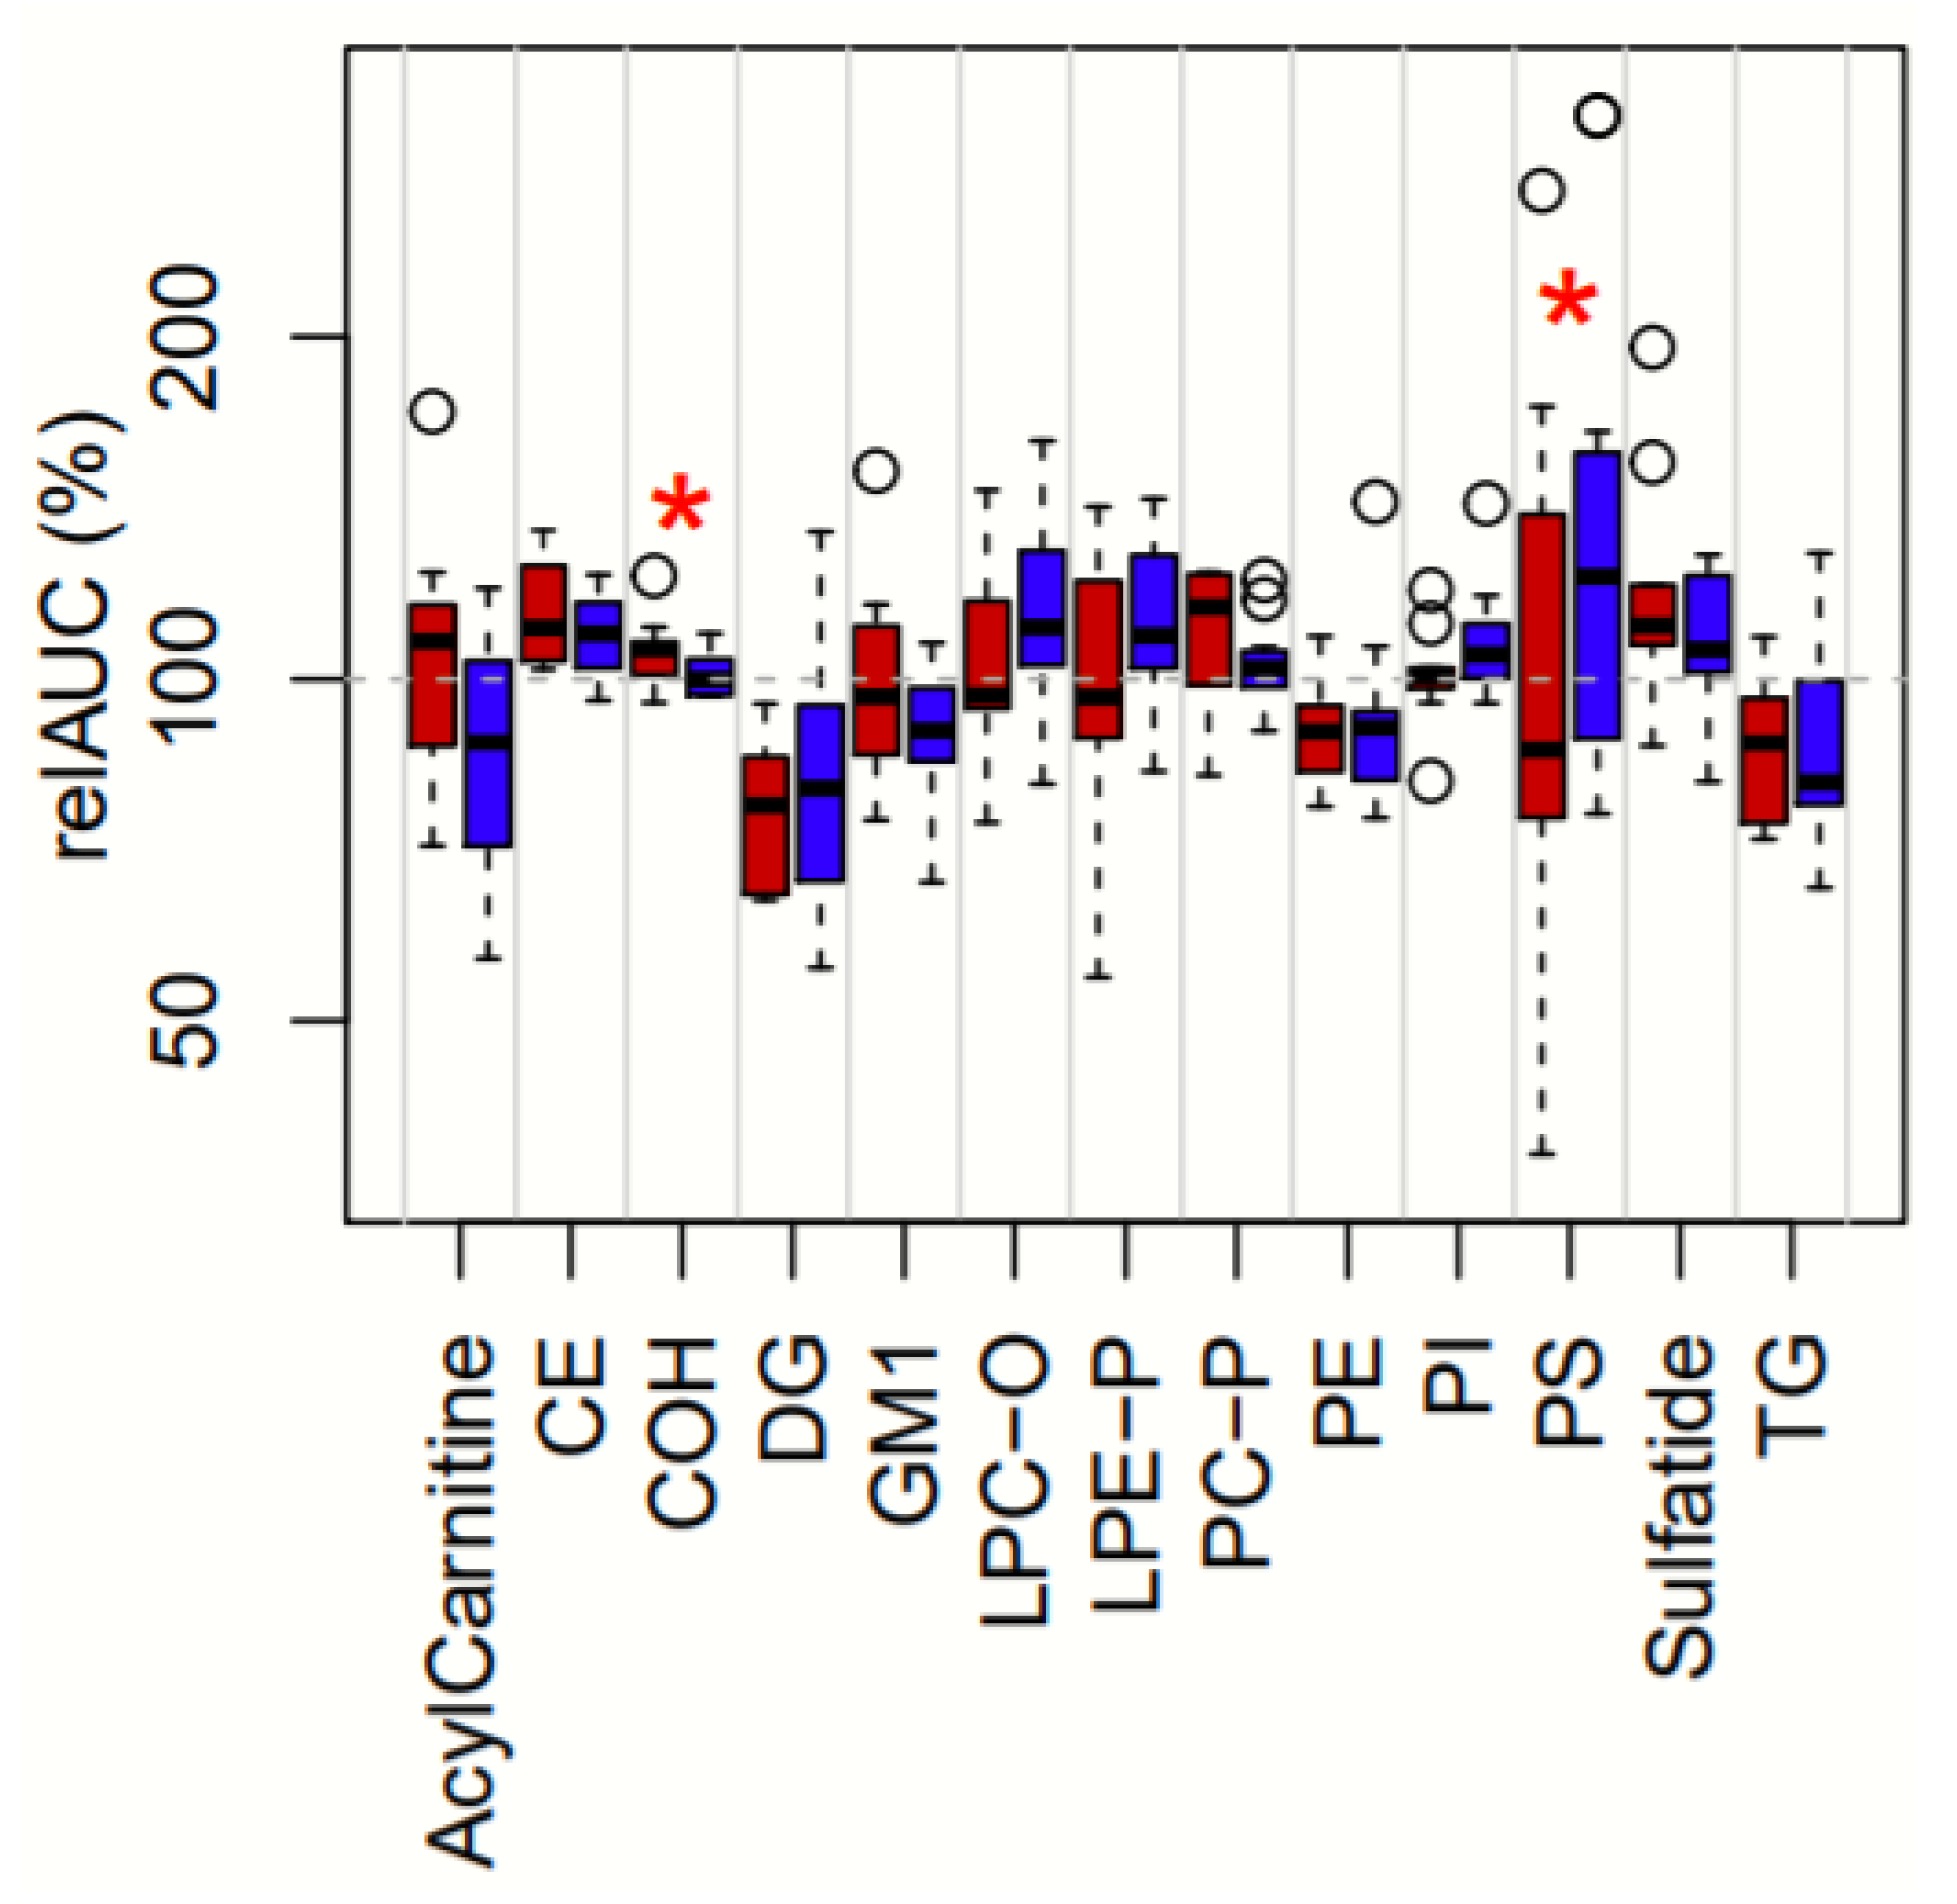
3.3. Treatment-Dependent Changes in Lipid Classes
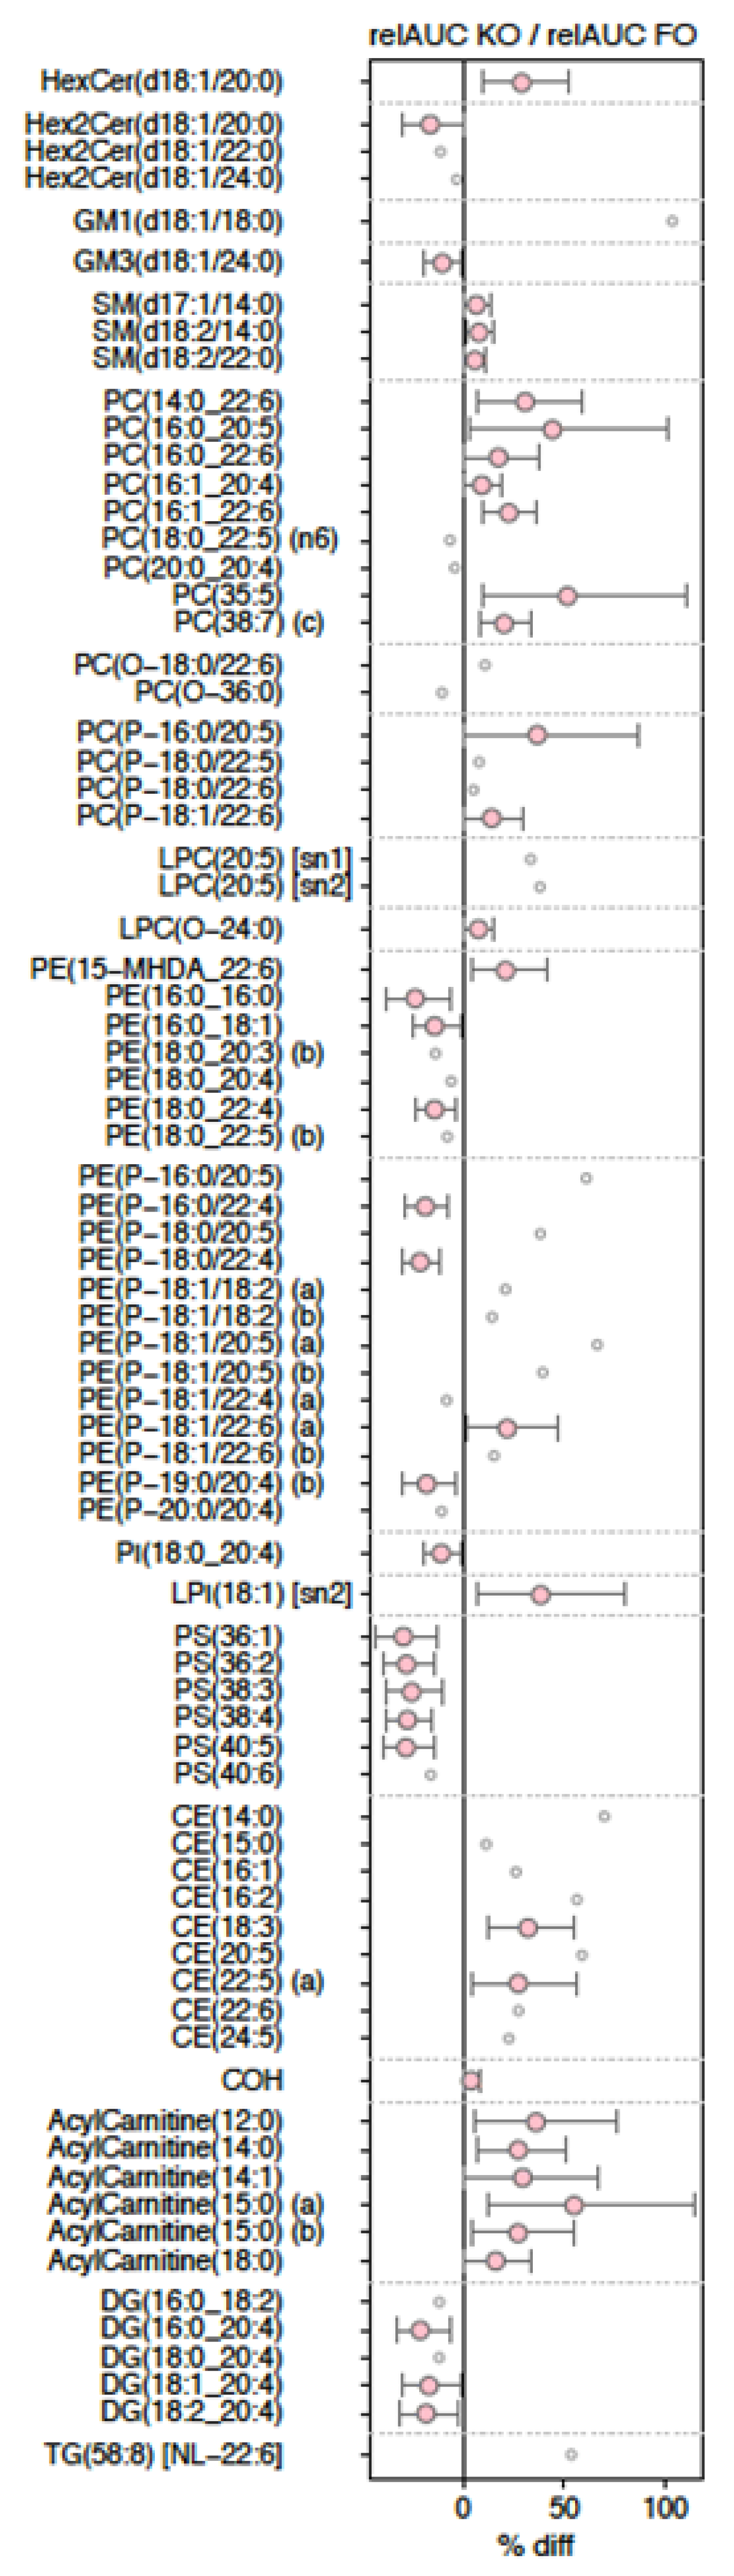
3.4. Changes in Lipid Species
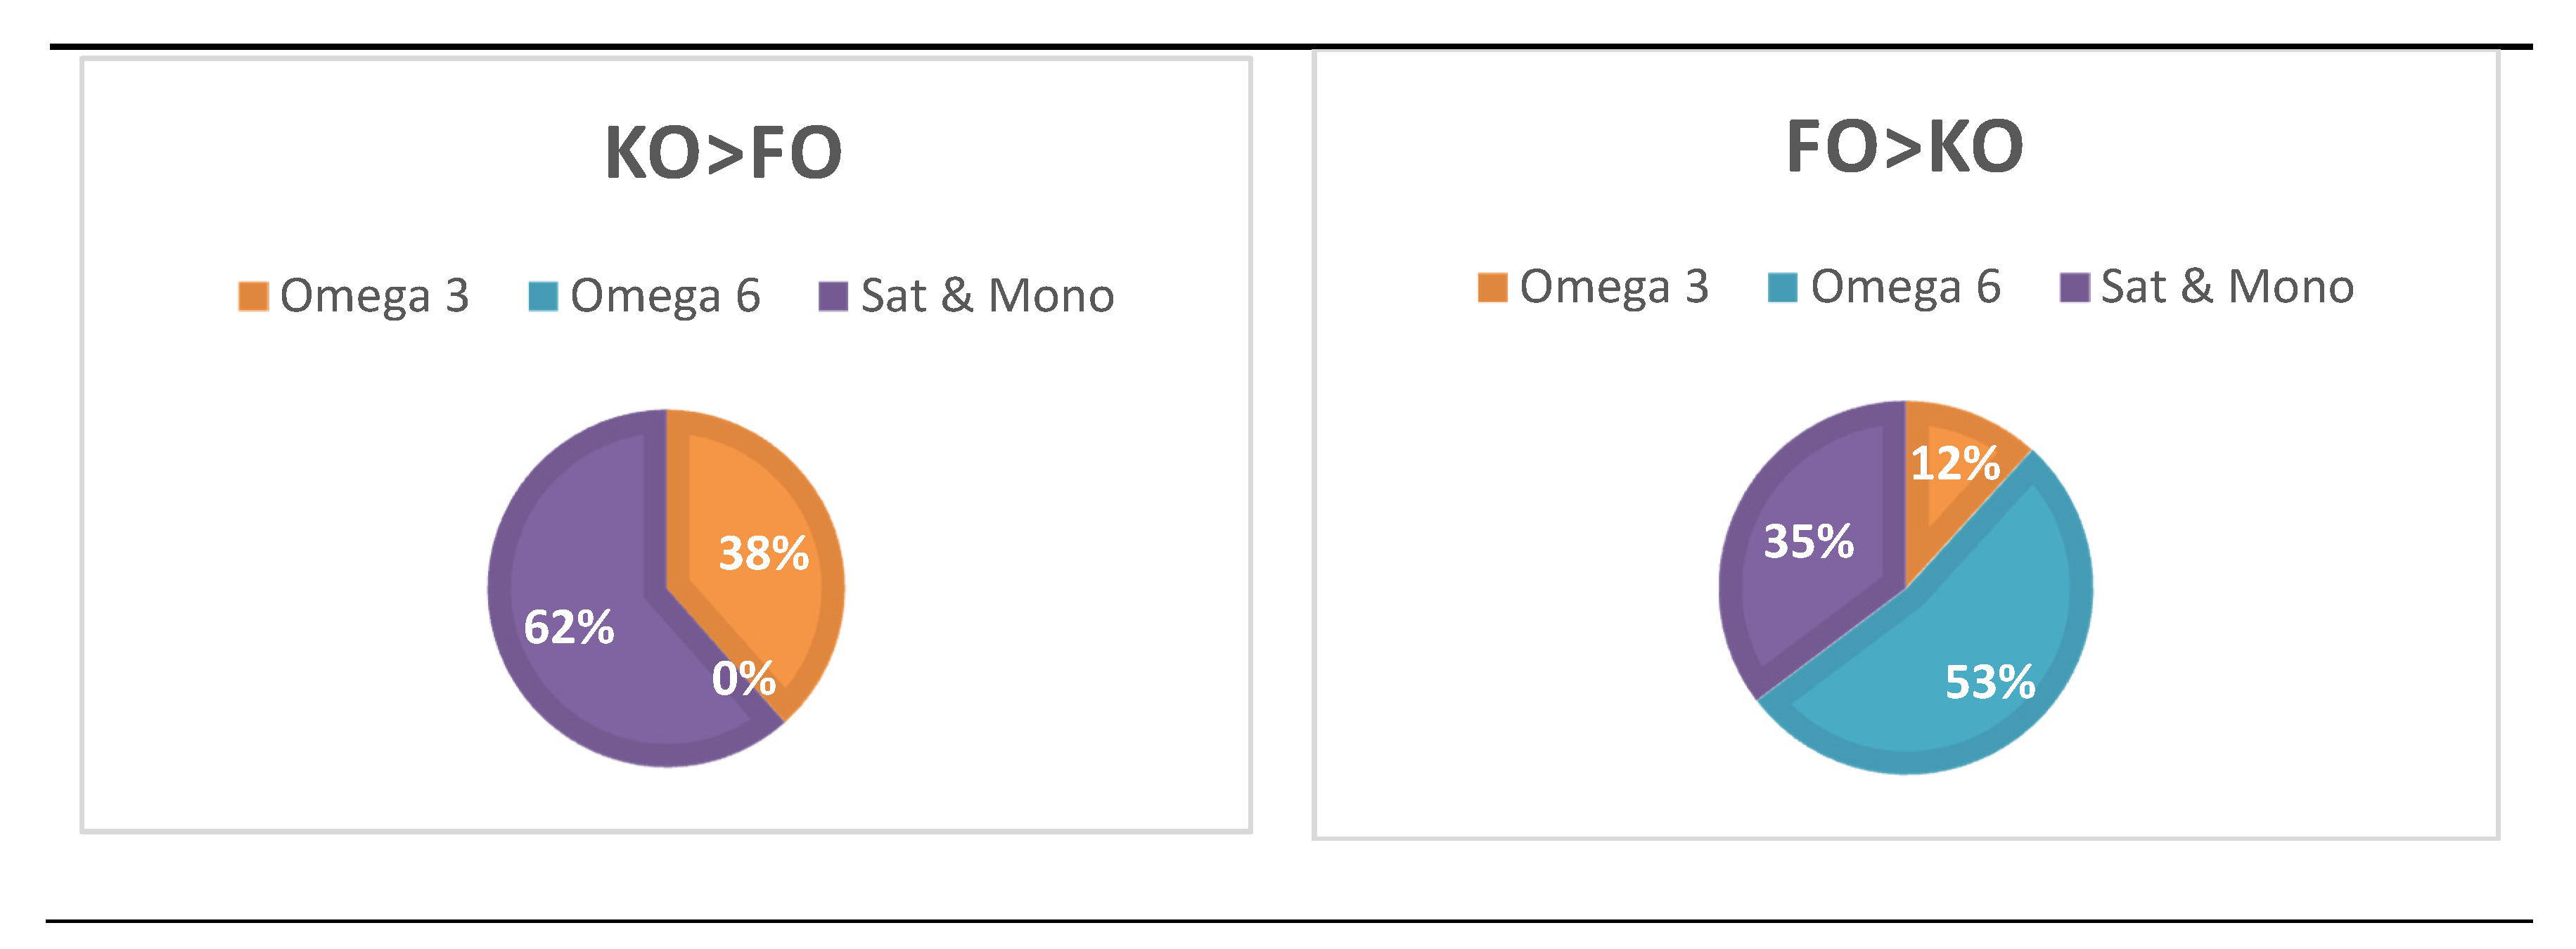
3.5. Treatment-Dependent Changes in Lipid Species
4. Discussion
5. Conclusions
Supplementary Materials
Author Contributions
Funding
Acknowledgments
Conflicts of Interest
References
- Sung, H.H.; Sinclair, A.J.; Huynh, K.; Smith, A.T.; Mellett, N.A.; Meikle, P.J.; Su, X.Q. Differential plasma postprandial lipidomic responses to krill oil and fish oil supplementations in women: A randomized crossover study. Nutrition 2019, 65, 191–201. [Google Scholar] [CrossRef] [PubMed]
- Winther, B.; Hoem, N.; Berge, K.; Reubsaet, L. Elucidation of phosphatidylcholine composition in krill oil extracted from Euphausia superba. Lipids 2011, 46, 25–36. [Google Scholar] [CrossRef] [PubMed] [Green Version]
- Tou, J.C.; Jaczynski, J.; Chen, Y.-C. Krill for Human Consumption: Nutritional Value and Potential Health Benefits. Nutr. Rev. 2007, 65, 63–77. [Google Scholar] [CrossRef] [PubMed]
- Sung, H.; Sinclair, A.J.; Lewandowski, P.A.; Su, X.Q. Postprandial long-chain n-3 polyunsaturated fatty acid response to krill oil and fish oil consumption in healthy women: A randomised controlled, single-dose, crossover study. Asia Pac. J. Clin. Nutr. 2018, 27, 148. [Google Scholar]
- Yurko-Mauro, K.; Kralovec, J.; Bailey-Hall, E.; Smeberg, V.; Stark, J.G.; Salem, N. Similar eicosapentaenoic acid and docosahexaenoic acid plasma levels achieved with fish oil or krill oil in a randomized double-blind four-week bioavailability study. Lipids Health Dis. 2015, 14, 1–9. [Google Scholar] [CrossRef] [Green Version]
- Ulven, S.M.; Kirkhus, B.; Lamglait, A.; Basu, S.; Elind, E.; Haider, T.; Berge, K.; Vik, H.; Pedersen, J.I. Metabolic effects of krill oil are essentially similar to those of fish oil but at lower dose of EPA and DHA, in healthy volunteers. Lipids 2011, 46, 37–46. [Google Scholar] [CrossRef] [Green Version]
- Maki, K.C.; Reeves, M.S.; Farmer, M.; Griinari, M.; Berge, K.; Vik, H.; Hubacher, R.; Rains, T.M. Krill oil supplementation increases plasma concentrations of eicosapentaenoic and docosahexaenoic acids in overweight and obese men and women. Nutr. Res. 2009, 29, 609–615. [Google Scholar] [CrossRef]
- Ghasemifard, S.; Turchini, G.M.; Sinclair, A.J. Omega-3 long chain fatty acid “bioavailability”: A review of evidence and methodological considerations. Prog. Lipid Res. 2014, 56, 92–108. [Google Scholar] [CrossRef]
- Ulven, S.M.; Holven, K.B. Comparison of bioavailability of krill oil versus fish oil and health effect. Vasc. Health Risk Manag. 2015, 11, 511. [Google Scholar] [CrossRef] [Green Version]
- Mödinger, Y.; Schön, C.; Wilhelm, M.; Hals, P.-A. Plasma Kinetics of Choline and Choline Metabolites After A Single Dose of SuperbaBoostTM Krill Oil or Choline Bitartrate in Healthy Volunteers. Nutrients 2019, 11, 2548. [Google Scholar] [CrossRef] [Green Version]
- Ottestad, I.; Hassani, S.; Borge, G.I.; Kohler, A.; Vogt, G.; Hyötyläinen, T.; Orešič, M.; Brønner, K.W.; Holven, K.B.; Ulven, S.M. Fish oil supplementation alters the plasma lipidomic profile and increases long-chain PUFAs of phospholipids and triglycerides in healthy subjects. PLoS ONE 2012, 7, e42550. [Google Scholar] [CrossRef] [PubMed] [Green Version]
- Skorve, J.; Hilvo, M.; Vihervaara, T.; Burri, L.; Bohov, P.; Tillander, V.; Bjørndal, B.; Suoniemi, M.; Laaksonen, R.; Ekroos, K. Fish oil and krill oil differentially modify the liver and brain lipidome when fed to mice. Lipids Health Dis. 2015, 14, 1. [Google Scholar] [CrossRef] [PubMed] [Green Version]
- Clayton, J.A.; Collins, F.S. NIH to balance sex in cell and animal studies. Nature 2014, 509, 282–283. [Google Scholar] [CrossRef] [PubMed]
- Sullivan, B.L.; Brown, J.; Williams, P.G.; Meyer, B.J. Dietary validation of a new Australian food-frequency questionnaire that estimates long-chain n-3 polyunsaturated fatty acids. Br. J. Nutr. 2008, 99, 660–666. [Google Scholar] [CrossRef]
- Hodge, J.; Sanders, K.; Sinclair, A.J. Differential utilization of eicosapentaenoic acid and docosahexaenoic acid in human plasma. Lipids 1993, 28, 525–531. [Google Scholar] [CrossRef] [PubMed]
- Cicero, A.F.G.; Rosticci, M.; Morbini, M.; Cagnati, M.; Grandi, E.; Parini, A.; Borghi, C. Lipid-lowering and anti-inflammatory effects of omega 3 ethyl esters and krill oil: A randomized, cross-over, clinical trial. Arch. Med. Sci. 2015, 12, 507–512. [Google Scholar] [CrossRef] [Green Version]
- Weir, J.M.; Wong, G.; Barlow, C.K.; Greeve, M.A.; Kowalczyk, A.; Almasy, L.; Comuzzie, A.G.; Mahaney, M.C.; Jowett, J.B.; Shaw, J. Plasma lipid profiling in a large population-based cohort. J. Lipid Res. 2013, 54, 2898–2908. [Google Scholar] [CrossRef] [Green Version]
- Huynh, K.; Barlow, C.K.; Jayawardana, K.S.; Weir, J.M.; Mellett, N.A.; Cinel, M.; Magliano, D.J.; Shaw, J.E.; Drew, B.G.; Meikle, P.J. High-throughput plasma lipidomics: Detailed mapping of the associations with cardiometabolic risk factors. Cell Chem. Biol. 2019, 26, 71–84.e4. [Google Scholar] [CrossRef]
- R Core Team. R: A Language and Environment for Statistical Computing. R Foundation for Statistical Computing Vienna, Austria. Vienna, Austria. 2016. Available online: https://www.r-project.org/ (accessed on 5 April 2020).
- Fard, S.G.; Linderborg, K.M.; Turchini, G.M.; Sinclair, A.J. Comparison of the bioavailability of docosapentaenoic acid (DPA, 22: 5n-3) and eicosapentaenoic acid (EPA, 20: 5n-3) in the rat. Prostaglandins Leukot. Essent. Fat. Acids 2014, 90, 23–26. [Google Scholar] [CrossRef]
- Ramprasath, V.R.; Eyal, I.; Zchut, S.; Jones, P.J. Enhanced increase of omega-3 index in healthy individuals with response to 4-week n-3 fatty acid supplementation from krill oil versus fish oil. Lipids Health Dis. 2013, 12, 178. [Google Scholar] [CrossRef] [Green Version]
- Nichols, P.D.; Kitessa, S.M.; Abeywardena, M. Commentary on a trial comparing krill oil versus fish oil. Lipids Health Dis. 2014, 13, 2. [Google Scholar] [CrossRef] [PubMed] [Green Version]
- Kutzner, L.; Ostermann, A.I.; Konrad, T.; Riegel, D.; Hellhake, S.; Schuchardt, J.P.; Schebb, N.H. Lipid Class Specific Quantitative Analysis of n-3 Polyunsaturated Fatty Acids in Food Supplements. J. Agric. Food Chem. 2016, 65, 139–147. [Google Scholar] [CrossRef] [PubMed]
- Iketani, T.; Takazawa, K.; Yamashina, A. Effect of eicosapentaenoic acid on central systolic blood pressure. Prostaglandins Leukot. Essent. Fat. Acids 2013, 88, 191–195. [Google Scholar] [CrossRef] [PubMed]
- Ishida, T.; Yoshida, M.; Arita, M.; Nishitani, Y.; Nishiumi, S.; Masuda, A.; Mizuno, S.; Takagawa, T.; Morita, Y.; Kutsumi, H.; et al. Resolvin E1, an endogenous lipid mediator derived from eicosapentaenoic acid, prevents dextran sulfate sodium–induced colitis. Inflamm. Bowel Dis. 2010, 16, 87–95. [Google Scholar] [CrossRef] [PubMed] [Green Version]
- Borow, K.M.; Nelson, J.R.; Mason, R.P. Biologic plausibility, cellular effects, and molecular mechanisms of eicosapentaenoic acid (EPA) in atherosclerosis. Atherosclerosis 2015, 242, 357–366. [Google Scholar] [CrossRef] [Green Version]
- Brossard, N.; Croset, M.; Normand, S.; Pousin, J.; Lecerf, J.; Laville, M.; Tayot, J.; Lagarde, M. Human plasma albumin transports [13C] docosahexaenoic acid in two lipid forms to blood cells. J. Lipid Res. 1997, 38, 1571–1582. [Google Scholar]
- Lemaitre-Delaunay, D.; Pachiaudi, C.; Laville, M.; Pousin, J.; Armstrong, M.; Lagarde, M. Blood compartmental metabolism of docosahexaenoic acid (DHA) in humans after ingestion of a single dose of [13C]DHA in phosphatidylcholine. J. Lipid Res. 1999, 40, 1867–1874. [Google Scholar]
- Bazinet, R.P.; Bernoud-Hubac, N.; Lagarde, M. How the plasma lysophospholipid and unesterified fatty acid pools supply the brain with docosahexaenoic acid. Prostaglandins Leukot. Essent. Fat. Acids 2019, 142, 1–3. [Google Scholar] [CrossRef]
- Rundblad, A.; Holven, K.B.; Bruheim, I.; Myhrstad, M.C.; Ulven, S.M. Effects of krill oil and lean and fatty fish on cardiovascular risk markers: A randomised controlled trial. J. Nutr. Sci. 2018, 7. [Google Scholar] [CrossRef] [Green Version]
- Sinclair, A.J. Docosahexaenoic acid and the brain-what is its role? Asia Pac. J. Clin. Nutr. 2019, 28, 675. [Google Scholar]


© 2020 by the authors. Licensee MDPI, Basel, Switzerland. This article is an open access article distributed under the terms and conditions of the Creative Commons Attribution (CC BY) license (http://creativecommons.org/licenses/by/4.0/).
Share and Cite
Sung, H.H.; Sinclair, A.J.; Huynh, K.; Smith, A.A.T.; Mellett, N.A.; Meikle, P.J.; Su, X.Q. Krill Oil Has Different Effects on the Plasma Lipidome Compared with Fish Oil Following 30 Days of Supplementation in Healthy Women: A Randomized Controlled and Crossover Study. Nutrients 2020, 12, 2804. https://doi.org/10.3390/nu12092804
Sung HH, Sinclair AJ, Huynh K, Smith AAT, Mellett NA, Meikle PJ, Su XQ. Krill Oil Has Different Effects on the Plasma Lipidome Compared with Fish Oil Following 30 Days of Supplementation in Healthy Women: A Randomized Controlled and Crossover Study. Nutrients. 2020; 12(9):2804. https://doi.org/10.3390/nu12092804
Chicago/Turabian StyleSung, Hyunsin H., Andrew J. Sinclair, Kevin Huynh, Adam A. T. Smith, Natalie A. Mellett, Peter J. Meikle, and Xiao Q. Su. 2020. "Krill Oil Has Different Effects on the Plasma Lipidome Compared with Fish Oil Following 30 Days of Supplementation in Healthy Women: A Randomized Controlled and Crossover Study" Nutrients 12, no. 9: 2804. https://doi.org/10.3390/nu12092804