
Dietary Methyl-Group Donor Intake and Breast Cancer Risk in the European Prospective Investigation into Cancer and Nutrition (EPIC)

 , , , , , , , , , , , , , , add
Show full author list
, , , , , , , , , , , , , , add
Show full author list
Abstract
:1. Introduction
2. Materials and Methods
2.1. Research Design and Study Population
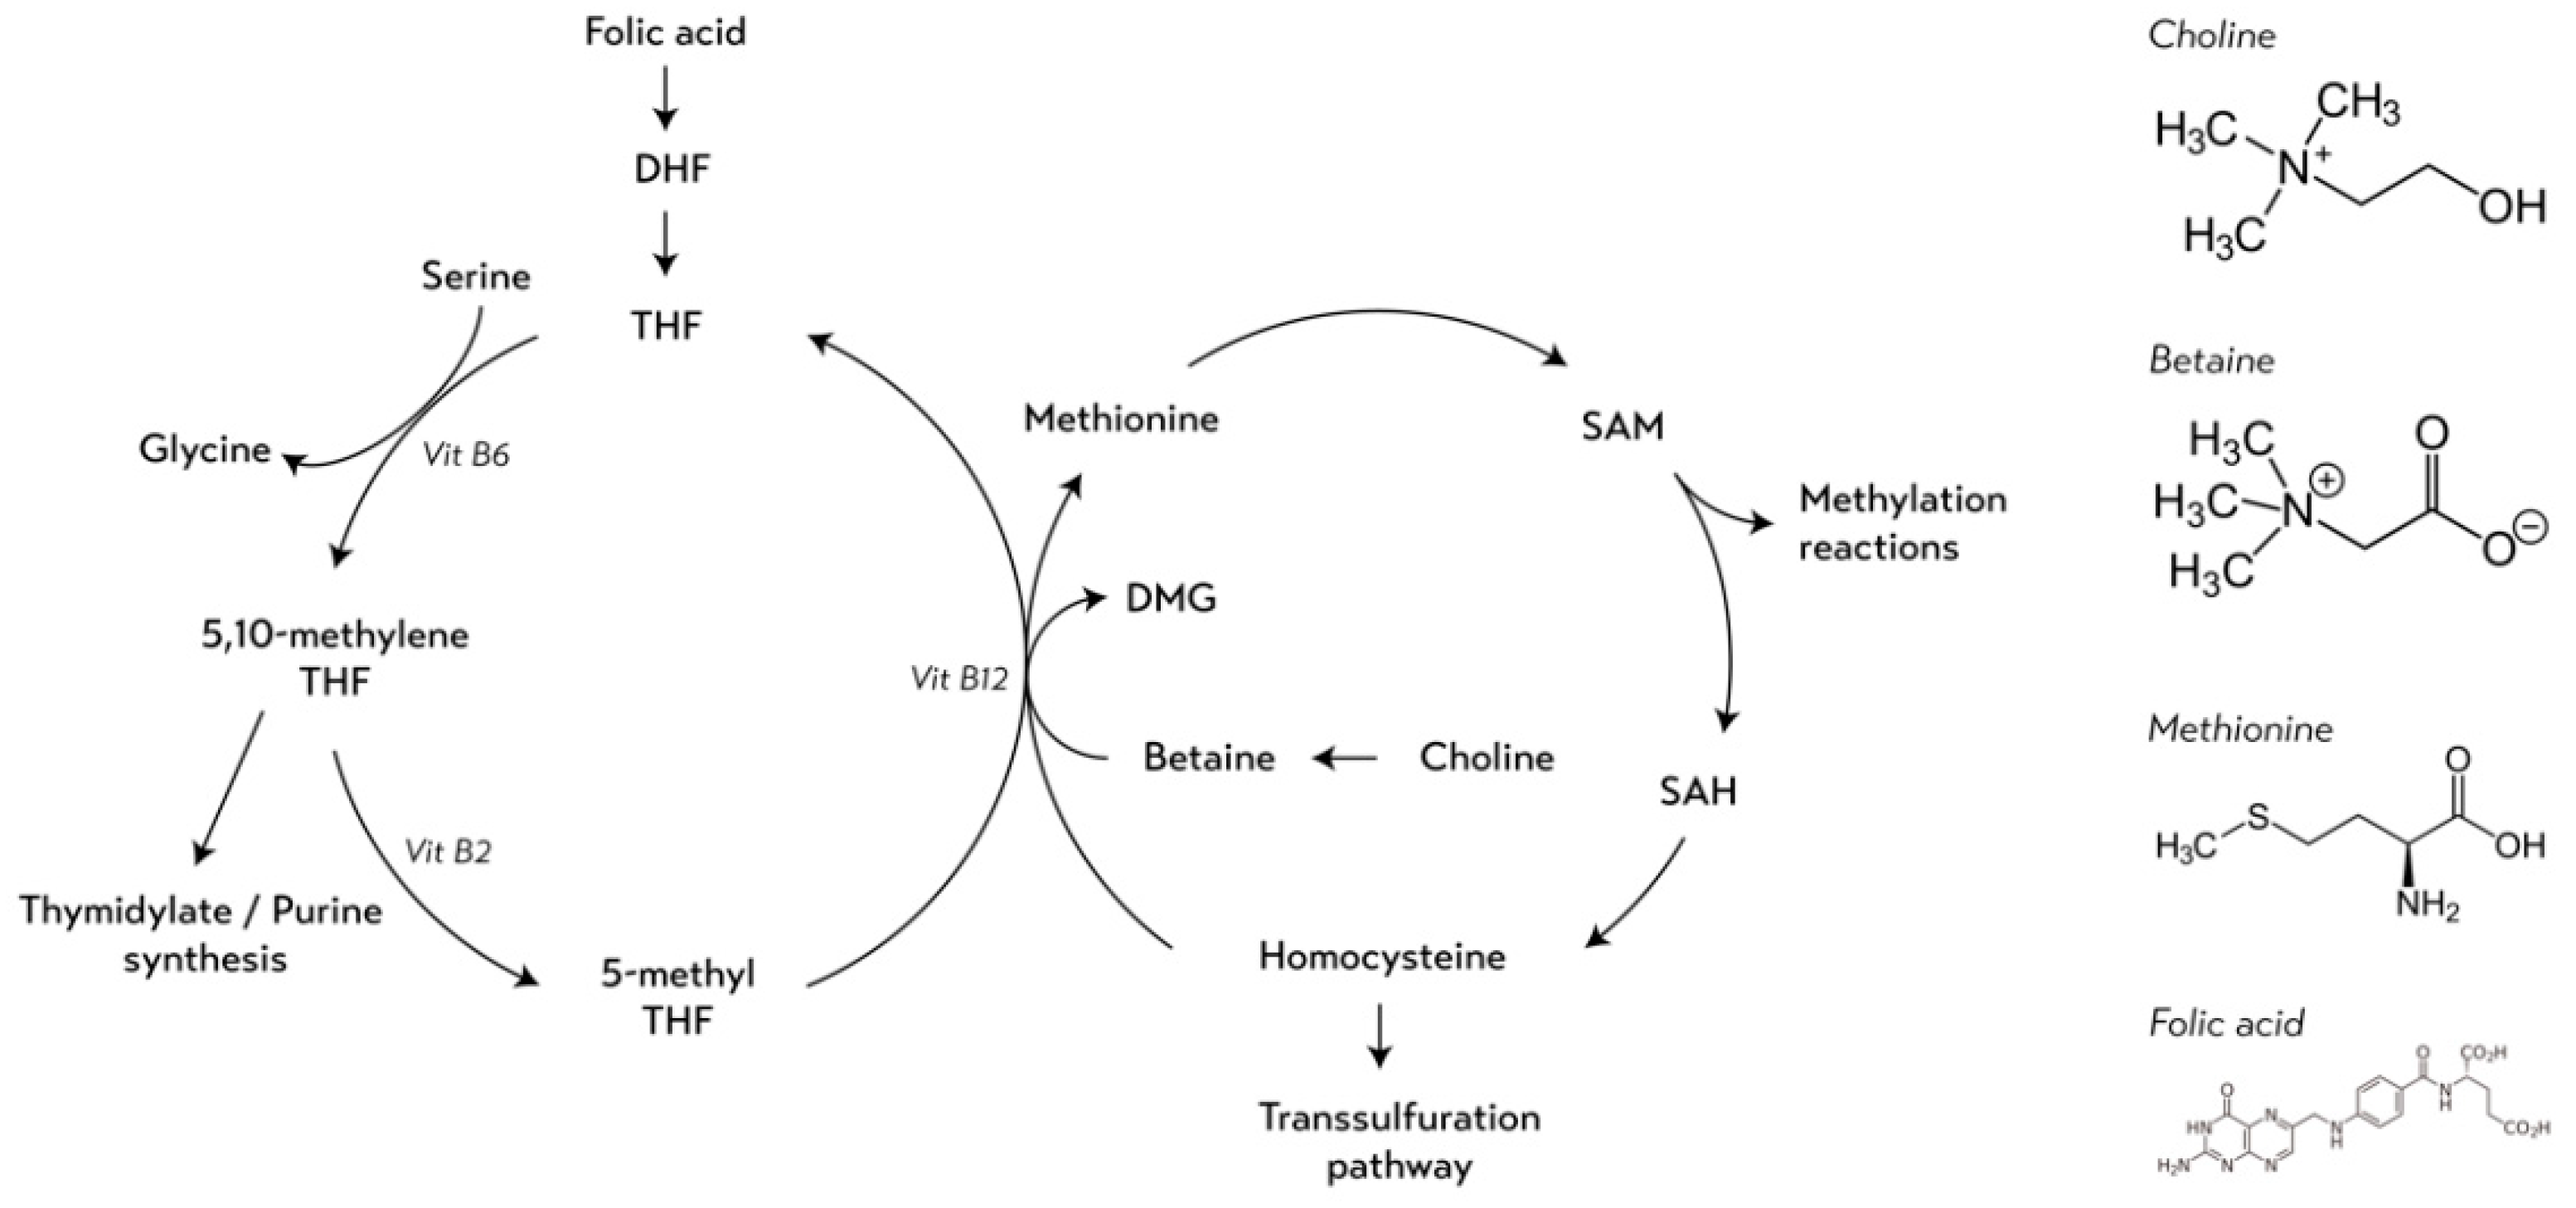
2.2. Assessment of Dietary Methyl-Group Donor Intake
2.3. Lifestyle Variables and Anthropometric Measurements
2.4. Outcome Assessment
2.5. Data Analysis
3. Results
4. Discussion
5. Conclusions
Supplementary Materials
Author Contributions
Funding
Institutional Review Board Statement
Informed Consent Statement
Data Availability Statement
Conflicts of Interest
References
- Bray, F.; Ferlay, J.; Soerjomataram, I.; Siegel, R.L.; Torre, L.A.; Jemal, A. Global cancer statistics 2018: Globocan estimates of incidence and mortality worldwide for 36 cancers in 185 countries. CA Cancer J. Clin. 2018, 68, 394–424. [Google Scholar] [CrossRef] [Green Version]
- Ferlay, J.; Colombet, M.; Soerjomataram, I.; Dyba, T.; Randi, G.; Bettio, M.; Gavin, A.; Visser, O.; Bray, F. Cancer incidence and mortality patterns in europe: Estimates for 40 countries and 25 major cancers in 2018. Eur. J. Cancer 2018, 103, 356–387. [Google Scholar] [CrossRef] [PubMed]
- Anothaisintawee, T.; Wiratkapun, C.; Lerdsitthichai, P.; Kasamesup, V.; Wongwaisayawan, S.; Srinakarin, J.; Hirunpat, S.; Woodtichartpreecha, P.; Boonlikit, S.; Teerawattananon, Y.; et al. Risk factors of breast cancer: A systematic review and meta-analysis. Asia Pac. J. Public Health 2013, 25, 368–387. [Google Scholar] [CrossRef]
- Collaborative Group on Hormonal Factors in Breast Cancer. Breast cancer and breastfeeding: Collaborative reanalysis of individual data from 47 epidemiological studies in 30 countries, including 50,302 women with breast cancer and 96,973 women without the disease. Lancet 2002, 360, 187–195.
- Collaborative Group on Hormonal Factors in Breast Cancer. Menarche, menopause, and breast cancer risk: Individual participant meta-analysis, including 118,964 women with breast cancer from 117 epidemiological studies. Lancet Oncol. 2012, 13, 1141–1151. [CrossRef]
- Collaborative Group on Hormonal Factors in Breast Cancer. Familial breast cancer: Collaborative reanalysis of individual data from 52 epidemiological studies including 58,209 women with breast cancer and 101,986 women without the disease. Lancet 2001, 358, 1389–1399. [CrossRef]
- Wirén, S.; Häggström, C.; Ulmer, H.; Manjer, J.; Bjørge, T.; Nagel, G.; Johansen, D.; Hallmans, G.; Engeland, A.; Concin, H.; et al. Pooled cohort study on height and risk of cancer and cancer death. Cancer Causes Control 2014, 25, 151–159. [Google Scholar] [CrossRef] [Green Version]
- WCRF. Diet, Nutrition, Physical Activity and Breast Cancer; World Cancer Research Fund/American Institute for Cancer Research: London, UK, 2018; Available online: Dietandcancerreport.org (accessed on 21 September 2020).
- U.S. Department of Agriculture, Agricultural Research Service. USDA National Nutrient Database for Standard Reference, Release 28. 2015. Documentation and User Guide. 2020. Available online: http://www.ars.usda.gov/ba/bhnrc/ndl (accessed on 20 March 2020).
- Friso, S.; Udali, S.; De Santis, D.; Choi, S.W. One-carbon metabolism and epigenetics. Mol. Asp. Med. 2017, 54, 28–36. [Google Scholar] [CrossRef]
- Jiménez-Chillarón, J.C.; Díaz, R.; Martínez, D.; Pentinat, T.; Ramón-Krauel, M.; Ribó, S.; Plösch, T. The role of nutrition on epigenetic modifications and their implications on health. Biochimie 2012, 94, 2242–2263. [Google Scholar] [CrossRef]
- Anderson, O.S.; Sant, K.E.; Dolinoy, D.C. Nutrition and epigenetics: An interplay of dietary methyl donors, one-carbon metabolism and DNA methylation. J. Nutr. Biochem. 2012, 23, 853–859. [Google Scholar] [CrossRef] [Green Version]
- Zhang, Y.-F.; Shi, W.-W.; Gao, H.-F.; Zhou, L.; Hou, A.-J.; Zhou, Y.-H. Folate intake and the risk of breast cancer: A dose-response meta-analysis of prospective studies. PLoS ONE 2014, 9, e100044. [Google Scholar] [CrossRef] [Green Version]
- Liu, M.; Cui, L.H.; Ma, A.G.; Li, N.; Piao, J.M. Lack of effects of dietary folate intake on risk of breast cancer: An updated meta-analysis of prospective studies. Asian Pac. J. Cancer Prev. 2014, 15, 2323–2328. [Google Scholar] [CrossRef] [Green Version]
- Chen, P.; Li, C.; Li, X.; Li, J.; Chu, R.; Wang, H. Higher dietary folate intake reduces the breast cancer risk: A systematic review and meta-analysis. Br. J. Cancer 2014, 110, 2327–2338. [Google Scholar] [CrossRef]
- Zeng, J.; Gu, Y.; Fu, H.; Liu, C.; Zou, Y.; Chang, H. Association between one-carbon metabolism-related vitamins and risk of breast cancer: A systematic review and meta-analysis of prospective studies. Clin. Breast Cancer 2020, 20, e469–e480. [Google Scholar] [CrossRef]
- Tio, M.; Andrici, J.; Cox, M.R.; Eslick, G.D. Folate intake and the risk of prostate cancer: A systematic review and meta-analysis. Prostate Cancer Prostatic Dis. 2014, 17, 213–219. [Google Scholar] [CrossRef]
- Lewis, S.J.; Harbord, R.M.; Harris, R.; Smith, G.D. Meta-analyses of observational and genetic association studies of folate intakes or levels and breast cancer risk. JNCI J. Natl. Cancer Inst. 2006, 98, 1607–1622. [Google Scholar] [CrossRef] [PubMed] [Green Version]
- Larsson, S.C.; Giovannucci, E.; Wolk, A. Folate and risk of breast cancer: A meta-analysis. JNCI J. Natl. Cancer Inst. 2007, 99, 64–76. [Google Scholar] [CrossRef] [PubMed] [Green Version]
- De Batlle, J.; Ferrari, P.; Chajes, V.; Park, J.Y.; Slimani, N.; McKenzie, F.; Overvad, K.; Roswall, N.; Tjonneland, A.; Boutron-Ruault, M.C.; et al. Dietary folate intake and breast cancer risk: European prospective investigation into cancer and nutrition. J. Natl. Cancer Inst. 2015, 107, 367. [Google Scholar] [CrossRef] [PubMed] [Green Version]
- Sun, S.W.; Li, X.; Ren, A.J.; Du, M.L.; Du, H.N.; Shu, Y.Q.; Zhu, L.J.; Wang, W. Choline and betaine consumption lowers cancer risk: A meta-analysis of epidemiologic studies. Sci. Rep. 2016, 6, 1–11. [Google Scholar] [CrossRef] [Green Version]
- Wu, W.; Kang, S.; Zhang, D. Association of vitamin b6, vitamin b12 and methionine with risk of breast cancer: A dose-response meta-analysis. Br. J. Cancer 2013, 109, 1926–1944. [Google Scholar] [CrossRef] [Green Version]
- Maruti, S.S.; Ulrich, C.M.; White, E. Folate and one-carbon metabolism nutrients from supplements and diet in relation to breast cancer risk. Am. J. Clin. Nutr. 2009, 89, 624–633. [Google Scholar] [CrossRef] [PubMed] [Green Version]
- Bassett, J.K.; Baglietto, L.; Hodge, A.M.; Severi, G.; Hopper, J.L.; English, D.R.; Giles, G.G. Dietary intake of b vitamins and methionine and breast cancer risk. Cancer Causes Control 2013, 24, 1555–1563. [Google Scholar] [CrossRef] [PubMed]
- Rohan, T.E.; Jain, M.G.; Howe, G.R.; Miller, A.B. Dietary folate consumption and breast cancer risk. J. Natl. Cancer Inst. 2000, 92, 266–269. [Google Scholar] [CrossRef]
- Shrubsole, M.J.; Shu, X.O.; Li, H.L.; Cai, H.; Yang, G.; Gao, Y.T.; Gao, J.; Zheng, W. Dietary b vitamin and methionine intakes and breast cancer risk among chinese women. Am. J. Epidemiol. 2011, 173, 1171–1182. [Google Scholar] [CrossRef] [PubMed] [Green Version]
- Kabat, G.; Miller, A.; Jain, M.; Rohan, T. Dietary intake of selected b vitamins in relation to risk of major cancers in women. Br. J. Cancer 2008, 99, 816–821. [Google Scholar] [CrossRef]
- Nijhout, H.F.; Reed, M.C.; Anderson, D.F.; Mattingly, J.C.; James, S.J.; Ulrich, C.M. Long-range allosteric interactions between the folate and methionine cycles stabilize DNA methylation reaction rate. Epigenetics 2006, 1, 81–87. [Google Scholar] [CrossRef] [Green Version]
- Riboli, E.; Hunt, K.; Slimani, N.; Ferrari, P.; Norat, T.; Fahey, M.; Charrondiere, U.; Hemon, B.; Casagrande, C.; Vignat, J. European prospective investigation into cancer and nutrition (epic): Study populations and data collection. Public Health Nutr. 2002, 5, 1113–1124. [Google Scholar] [CrossRef]
- Riboli, E.; Kaaks, R. The epic project: Rationale and study design. European prospective investigation into cancer and nutrition. Int. J. Epidemiol. 1997, 26, 6–14. [Google Scholar] [CrossRef]
- Van Puyvelde, H.; Versele, V.; De Backer, M.; Casagrande, C.; Nicolas, G.; Clasen, J.L.; Julián, C.; Skeie, G.; Chirlaque, M.-D.; Mahamat-Saleh, Y.; et al. Methodological approaches to compile and validate a food composition database for methyl-group carriers in the european prospective investigation into cancer and nutrition (epic) study. Food Chem. 2020, 330, 127231. [Google Scholar] [CrossRef]
- Bouckaert, K.P.; Slimani, N.; Nicolas, G.; Vignat, J.; Wright, A.J.; Roe, M.; Witthöft, C.M.; Finglas, P.M. Critical evaluation of folate data in european and international databases: Recommendations for standardization in international nutritional studies. Mol. Nutr. Food Res. 2011, 55, 166–180. [Google Scholar] [CrossRef]
- Slimani, N.; Deharveng, G.; Unwin, I.; Southgate, D.; Vignat, J.; Skeie, G.; Salvini, S.; Parpinel, M.; Møller, A.; Ireland, J. The epic nutrient database project (endb): A first attempt to standardize nutrient databases across the 10 european countries participating in the epic study. Eur. J. Clin. Nutr. 2007, 61, 1037–1056. [Google Scholar] [CrossRef] [Green Version]
- Nicolas, G.; Witthöft, C.M.; Vignat, J.; Knaze, V.; Huybrechts, I.; Roe, M.; Finglas, P.; Slimani, N. Compilation of a standardised international folate database for epic. Food Chem. 2016, 193, 134–140. [Google Scholar] [CrossRef]
- Tjonneland, A.; Christensen, J.; Olsen, A.; Stripp, C.; Thomsen, B.L.; Overvad, K.; Peeters, P.H.; van Gils, C.H.; Bueno-de-Mesquita, H.B.; Ocke, M.C.; et al. Alcohol intake and breast cancer risk: The european prospective investigation into cancer and nutrition (epic). Cancer Causes Control 2007, 18, 361–373. [Google Scholar] [CrossRef]
- Ulrich, C.M. Folate and cancer prevention: A closer look at a complex picture. Am. J. Clin. Nutr. 2007, 86, 271–273. [Google Scholar] [CrossRef] [Green Version]
- Xu, X.; Chen, J. One-carbon metabolism and breast cancer: An epidemiological perspective. J. Genet. Genom. 2009, 36, 203–214. [Google Scholar] [CrossRef] [Green Version]
- Newman, A.C.; Maddocks, O.D.K. One-carbon metabolism in cancer. Br. J. Cancer 2017, 116, 1499–1504. [Google Scholar] [CrossRef] [Green Version]
- Cho, E.; Zeisel, S.H.; Jacques, P.; Selhub, J.; Dougherty, L.; Colditz, G.A.; Willett, W.C. Dietary choline and betaine assessed by food-frequency questionnaire in relation to plasma total homocysteine concentration in the framingham offspring study. Am. J. Clin. Nutr. 2006, 83, 905–911. [Google Scholar] [CrossRef] [Green Version]
- Zeisel, S.H. Dietary choline deficiency causes DNA strand breaks and alters epigenetic marks on DNA and histones. Mutat. Res. Fundam. Mol. Mech. Mutagenesis 2012, 733, 34–38. [Google Scholar] [CrossRef] [Green Version]
- Cavuoto, P.; Fenech, M.F. A review of methionine dependency and the role of methionine restriction in cancer growth control and life-span extension. Cancer Treat. Rev. 2012, 38, 726–736. [Google Scholar] [CrossRef]
- Matejcic, M.; de Batlle, J.; Ricci, C.; Biessy, C.; Perrier, F.; Huybrechts, I.; Weiderpass, E.; Boutron-Ruault, M.C.; Cadeau, C.; His, M.; et al. Biomarkers of folate and vitamin b12 and breast cancer risk: Report from the epic cohort. Int. J. Cancer 2017, 140, 1246–1259. [Google Scholar] [CrossRef]
- Du, Y.F.; Lin, F.Y.; Long, W.Q.; Luo, W.P.; Yan, B.; Xu, M.; Mo, X.F.; Zhang, C.X. Serum betaine but not choline is inversely associated with breast cancer risk: A case-control study in china. Eur. J. Nutr. 2017, 56, 1329–1337. [Google Scholar] [CrossRef]
- His, M.; Viallon, V.; Dossus, L.; Gicquiau, A.; Achaintre, D.; Scalbert, A.; Ferrari, P.; Romieu, I.; Onland-Moret, N.C.; Weiderpass, E.; et al. Prospective analysis of circulating metabolites and breast cancer in epic. BMC Med. 2019, 17, 178. [Google Scholar] [CrossRef] [PubMed]
- Scoccianti, C.; Lauby-Secretan, B.; Bello, P.-Y.; Chajes, V.; Romieu, I. Female breast cancer and alcohol consumption: A review of the literature. Am. J. Prev. Med. 2014, 46, 16–25. [Google Scholar] [CrossRef] [PubMed] [Green Version]
- Purohit, V.; Khalsa, J.; Serrano, J. Mechanisms of alcohol-associated cancers: Introduction and summary of the symposium. Alcohol 2005, 35, 155–160. [Google Scholar] [CrossRef] [Green Version]
- Varela-Rey, M.; Woodhoo, A.; Martinez-Chantar, M.L.; Mato, J.M.; Lu, S.C. Alcohol, DNA methylation, and cancer. Alcohol Res. 2013, 35, 25–35. [Google Scholar]


| Country | Study Participants | BC Cases | Age Range at Enrolment | Follow-Up | Person-Years | MGD Score | Dietary Folate Intake | Dietary Choline Intake | Dietary Betaine Intake | Dietary Methionine Intake |
|---|---|---|---|---|---|---|---|---|---|---|
| N | N | years | years a | unit b | µg/day b | mg/day b | mg/day b | g/day b | ||
| Total | 318,686 | 13,320 | 19.9–98.5 | 14.1 (3.8) | 4,492,761 | −0.4 (−2.2; 1.7) | 327 (257; 415) | 264 (214; 323) | 112 (50; 174) | 1.41 (1.12; 1.76) |
| Denmark | 28,720 | 1869 | 50.1–65.8 | 15.1 (3.9) | 432,423 | −1.4 (−2.9; 0.3) | 283 (235; 338) | 276 (219; 345) | 32 (20; 52) | 1.46 (1.18; 1.79) |
| France | 67,403 | 3324 | 41.8–71.4 | 12.9 (3.4) | 869,372 | 1.5 (−0.4; 3.8) | 421 (344; 510) | 296 (242; 363) | 136 (88; 194) | 1.66 (1.33; 2.04) |
| Germany | 27,379 | 817 | 19.9–70.1 | 10.4 (3.0) | 284,937 | −2.6 (−3.8; 1.2) | 302 (252; 360) | 208 (172; 251) | 17 (12; 24) | 1.30 (1.06; 1.58) |
| Italy | 30,513 | 1211 | 29.1–77.8 | 14.3 (3.03) | 434,997 | 0.7 (−1.4; 3.1) | 340 (269; 431) | 244 (202; 292) | 168 (110; 249) | 1.67 (1.35; 2.03) |
| The Netherlands | 26,912 | 1049 | 20.1–70.1 | 14.3 (3.4) | 384,249 | −0.5(−1.9; 0.9) | 304 (261; 352) | 256 (215; 301) | 146 (107; 189) | 1.31 (1.08; 1.55) |
| Norway | 33,975 | 1201 | 40.9–55.9 | 13.3 (2.5) | 452,171 | −1.0 (−2.5; 0.5) | 230 (190; 275) | 255 (212; 303) | 135 (117; 207) | 1.33 (1.09; 1.61) |
| Spain | 24,850 | 655 | 29.0–69.8 | 16.0 (2.9) | 398,837 | 0.2 (−1.4; 2.1) | 359 (292; 440) | 271 (224; 322) | 129 (86; 178) | 1.45 (1.19; 1.76) |
| Sweden | 26,368 | 1314 | 29.2–73.6 | 16.8 (4.8) | 442,242 | −2.1 (−3.7; −0.4) | 256 (207; 312) | 227 (175; 288) | 49 (30; 79) | 1.35 (1.05; 1.67) |
| UK General Population | 17,169 | 817 | 36.0–78.2 | 14.9 (4.0) | 255,137 | 0.1 (−1.5; 1.9) | 355 (293; 426) | 300 (251; 352) | 111 (71; 157) | 1.36 (1.13; 1.62) |
| UK Health Conscious | 35,397 | 1063 | 20.0–98.5 | 15.2 (3.4) | 538,396 | −0.04 (−1.7; 1.9) | 388 (314; 476) | 285 (234; 341) | 130 (82; 182) | 1.09 (0.82; 1.40) |
| Overall Breast Cancer Risk (N = 318,686) | Premenopausal Breast Cancer Risk (N = 110,678) | Postmenopausal Breast Cancer Risk (N = 145,212) | ||||||||
|---|---|---|---|---|---|---|---|---|---|---|
| BC Cases | Person Years | Multivariable Model a HR (95% CI) | BC cases | Person years | Multivariable Model b HR (95% CI) | BC Cases | Person Years | Multivariable Model b HR (95% CI) | Pinteraction b, c | |
| MGD score | ||||||||||
| Continuous (1 unit) | 13,320 | 4,492,760 | 1.00 (0.98–1.01) | 3314 | 1,592,971 | 0.99 (0.97–1.02) | 7002 | 2,015,866 | 1.00 (0.99–1.02) | 0.199b |
| Q1: ≤ −2.58 | 2568 | 885,323 | 1 (Ref.) | 562 | 305,808 | 1 (Ref.) | 1429 | 410,789 | 1 (Ref.) | |
| Q2: > −2.5–−1.00 | 2589 | 898,478 | 0.96 (0.91–1.02) | 608 | 305,208 | 1.03 (0.91–1.16) | 1421 | 420,851 | 0.98 (0.90–1.06) | |
| Q3: > −1.00–0.39 | 2700 | 905,782 | 0.99 (0.93–1.06) | 680 | 320,068 | 1.06 (0.93–1.22) | 1448 | 410,339 | 1.03 (0.94–1.12) | |
| Q4: > 0.39–2.31 | 2668 | 909,636 | 0.96 (0.89–1.04) | 702 | 329,377 | 1.05 (0.90–1.22) | 1352 | 400,920 | 0.98 (0.89–1.09) | |
| Q5: > 2.31 | 2795 | 893,541 | 0.98 (0.89–1.08) | 762 | 332,509 | 1.05 (0.86–1.29) | 1352 | 372,967 | 1.05 (0.92–1.20) | 0.596c |
| Ptrend | 0.857 | 0.675 | 0.449 | |||||||
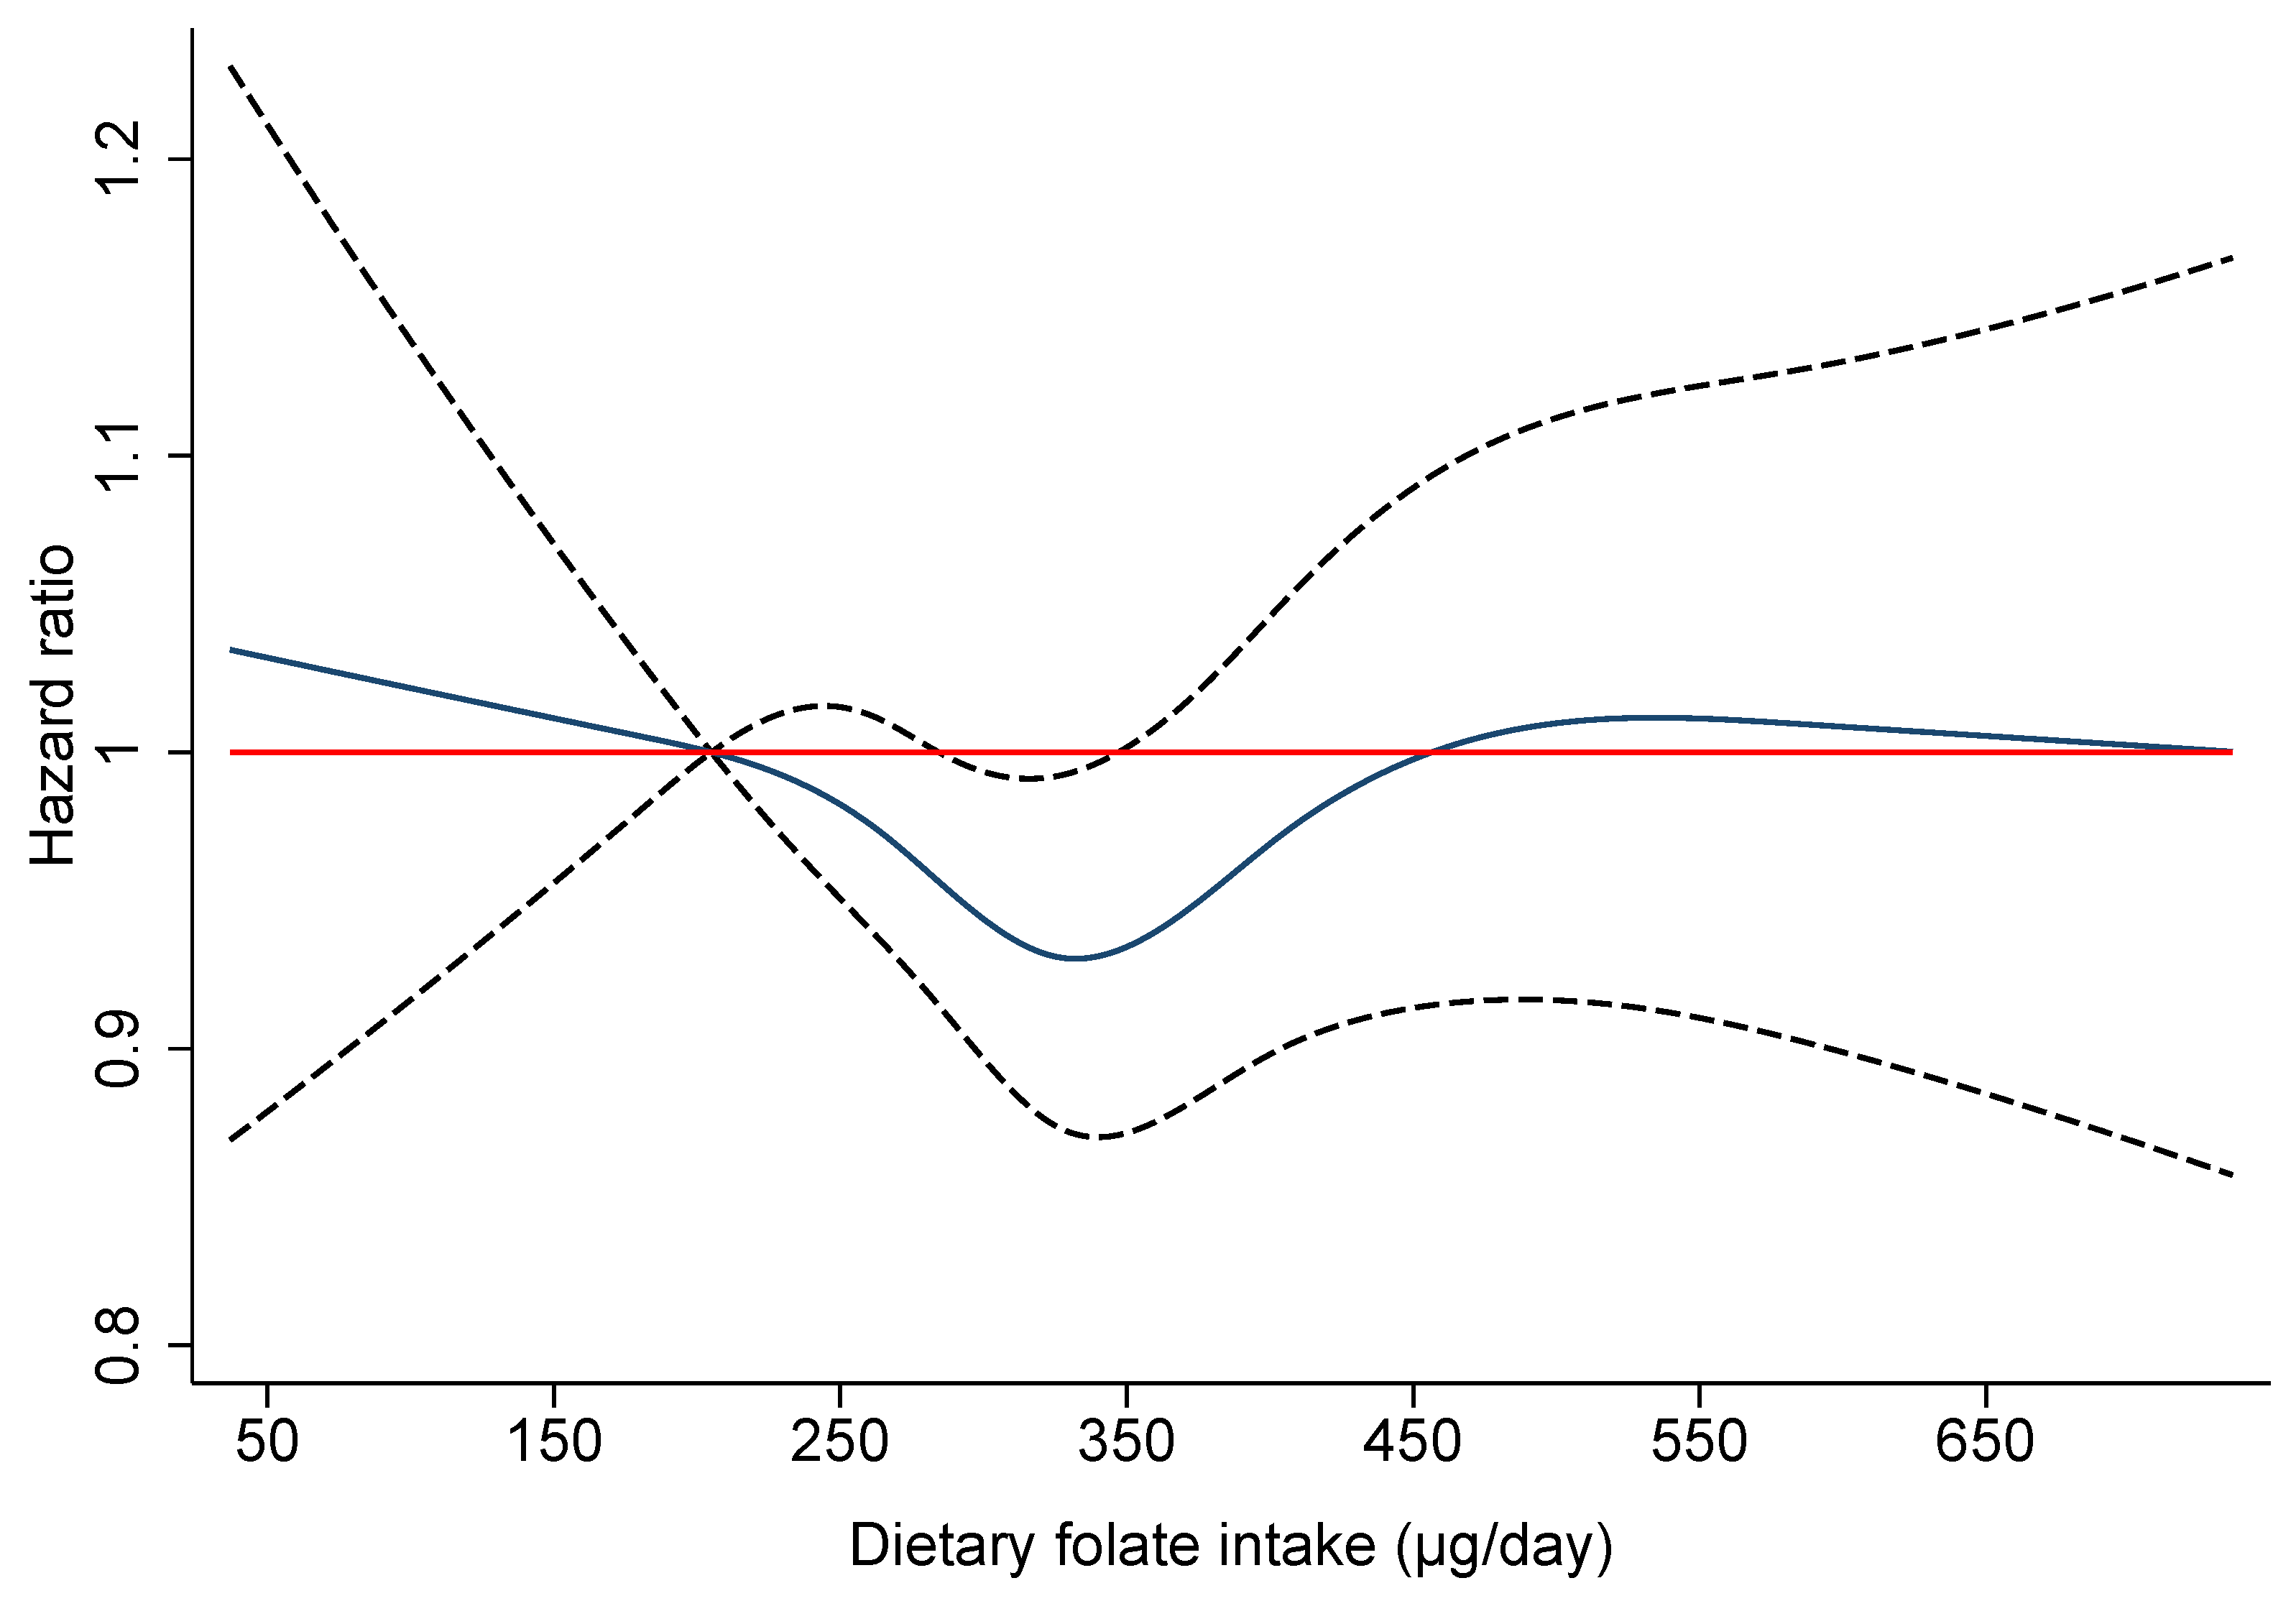
| Dietary folate (µg/day) | ||||||||||
| Continuous (per 1 SD = 128 µg/day) | 13,320 | 4,492,760 | 1.01 (0.98–1.05) | 3314 | 1,592,971 | 1.02 (0.95–1.09) | 7002 | 2,015,866 | 1.02 (0.97–1.07) | 0.234 b |
| Q1: ≤ 242 | 2724 | 903,078 | 1 (Ref.) | 568 | 275,216 | 1 (Ref.) | 1470 | 420,708 | 1 (Ref.) | |
| Q2: > 242–298 | 2684 | 901223 | 0.97 (0.91–1.02) | 597 | 296,441 | 0.96 (0.85–1.09) | 1501 | 427,502 | 0.97 (0.90–1.05) | |
| Q3: > 298–357 | 2569 | 899,889 | 0.93 (0.87–1.00) | 648 | 319,253 | 0.97 (0.85–1.11) | 1412 | 418,308 | 0.94 (0.86–1.03) | |
| Q4: > 357–440 | 2683 | 896,336 | 0.98 (0.91–1.06) | 739 | 341,300 | 1.04 (0.89–1.21) | 1361 | 390,803 | 0.96 (0.86–1.06) | |
| Q5: > 440 | 2660 | 892,233 | 0.98 (0.89–1.08) | 762 | 360,761 | 1.02 (0.84–1.23) | 1258 | 358,544 | 0.96 (0.84–1.10) | 0.665 c |
| Ptrend | 0.999 | 0.609 | 0.618 | |||||||
| Choline (mg/day) | ||||||||||
| Continuous (per 1 SD = 90 mg/day) | 13,320 | 4,492,760 | 1.00 (0.98–1.03) | 3314 | 1,592,971 | 0.99 (0.94–1.05) | 7002 | 2,015,866 | 1.02 (0.98–1.05) | 0.088 b |
| Q1: ≤ 202 | 2448 | 881,386 | 1 (Ref.) | 576 | 320,398 | 1 (Ref.) | 1297 | 392,442 | 1 (Ref.) | |
| Q2: < 202–244 | 2626 | 893,846 | 1.01 (0.96–1.07) | 710 | 320,444 | 1.15 (1.02–1.29) | 1350 | 401,919 | 0.99 (0.92–1.08) | |
| Q3: < 244–285 | 2554 | 904,412 | 0.96 (0.90–1.02) | 625 | 326,142 | 0.98 (0.86–1.11) | 1364 | 402,297 | 0.99 (0.91–1.08) | |
| Q4: < 285–339 | 2716 | 909,864 | 0.98 (0.92–1.05) | 698 | 326,899 | 1.07 (0.93–1.23) | 1392 | 402,238 | 0.98 (0.90–1.08) | |
| Q5: > 339 | 2976 | 903,251 | 1.00 (0.93–1.08) | 705 | 299,087 | 1.13 (0.96–1.33) | 1599 | 416,970 | 1.03 (0.93–1.14) | 0.110 c |
| Ptrend | 0.995 | 0.307 | 0.580 | |||||||
| Betaine (mg/day) | ||||||||||
| Continuous (per 1 SD = 88 mg/day) | 13,320 | 4,492,760 | 0.99 (0.96–1.02) | 3314 | 1,592,971 | 0.99 (0.94–1.04) | 7002 | 2,015,866 | 0.99 (0.96–1.03) | 0.303 b |
| Q1: ≤ 39 | 2783 | 840,795 | 1 (Ref.) | 488 | 233,239 | 1 (Ref.) | 1776 | 455,887 | 1 (Ref.) | |
| Q2: < 39–88 | 2816 | 936,529 | 0.97 (0.91–1.03) | 617 | 302,013 | 0.99 (0.85–1.16) | 1559 | 448,325 | 0.95 (0.88–1.03) | |
| Q3: < 88–132 | 2659 | 906,530 | 1.00 (0.94–1.08) | 655 | 322,004 | 0.94 (0.80–1.12) | 1352 | 392,397 | 1.02 (0.93–1.12) | |
| Q4: < 132–193 | 2642 | 909,235 | 1.01 (0.94–1.09) | 808 | 360,323 | 1.04 (0.88–1.23) | 1248 | 382,114 | 0.99 (0.89–1.09) | |
| Q5: > 193 | 2420 | 899,670 | 0.97 (0.89–1.05) | 746 | 375,393 | 0.93 (0.78–1.12) | 1067 | 337,143 | 0.98 (0.88–1.09) | 0.269 c |
| Ptrend | 0.741 | 0.513 | 0.985 | |||||||
| Methionine (g/day) | ||||||||||
| Continuous (per 1 g/day) | 13,320 | 449,2760 | 0.97 (0.92–1.02) | 3314 | 1,592,971 | 0.95 (0.85–1.06) | 7002 | 2,015,866 | 0.99 (0.92–1.06) | 0.199 b |
| Q1: ≤ 1.06 | 2282 | 910,975 | 1 (Ref.) | 661 | 396,925 | 1 (Ref.) | 1168 | 363,005 | 1 (Ref.) | |
| Q2: < 1.06–1.30 | 2591 | 896,369 | 1.02 (0.96–1.08) | 630 | 317,619 | 0.99 (0.89–1.12) | 1362 | 410,524 | 0.99 (0.92–1.08) | |
| Q3: < 1.30–1.54 | 2731 | 899,018 | 1.03 (0.96–1.09) | 646 | 302,725 | 1.00 (0.89–1.13) | 1497 | 419,107 | 1.05 (0.97–1.14) | |
| Q4: < 1.54–1.85 | 2815 | 898,204 | 1.01 (0.95–1.08) | 673 | 291,694 | 1.01 (0.88–1.15) | 1520 | 421,103 | 1.04 (0.95–1.13) | |
| Q5: > 1.85 | 2901 | 888,193 | 0.99 (0.91–1.07) | 704 | 284,007 | 0.98 (0.84–1.15) | 1455 | 402,128 | 1.00 (0.90–1.11) | 0.596 c |
| Ptrend | 0.572 | 0.889 | 0.896 | |||||||
| Low Alcohol Intake (<2 Drinks/Week) (N = 157,363) | Moderate Alcohol Intake (2–12 Drinks/Week) (N = 124,578) | High Alcohol Intake (>12 Drinks/Week) (N = 36,745) | ||||||||
|---|---|---|---|---|---|---|---|---|---|---|
| BC Cases | Person Years | Multivariable Model a HR (95% CI) | BC Cases | Person Years | Multivariable Model a HR (95% CI) | BC Cases | Person Years | Multivariable Model a HR (95% CI) | Pinteraction b, c | |
| MGD score | ||||||||||
| Continuous (1 unit) | 5882 | 2,241,059 | 0.99 (0.97–1.01) | 5448 | 1,748,126 | 1.00 (0.98–1.02) | 1990 | 503,575 | 1.00 (0.97–1.03) | 0.049 b |
| Q1: ≤ −2.58 | 1324 | 504,409 | 1 (Ref.) | 963 | 307,475 | 1 (Ref.) | 281 | 73,439 | 1 (Ref.) | |
| Q2: > −2.58–−1.00 | 1175 | 459,463 | 0.92 (0.85–1.01) | 1039 | 349,334 | 0.95 (0.86–1.04) | 375 | 89,680 | 1.12 (0.95–1.32) | |
| Q3: > −1.00–0.39 | 1154 | 450,289 | 0.91 (0.82–1.00) | 1134 | 362,348 | 1.00 (0.91–1.11) | 412 | 93,145 | 1.20 (1.01–1.44) | |
| Q4: > 0.39–2.31 | 1127 | 433,205 | 0.90 (0.81–1.01) | 1151 | 369,993 | 1.00 (0.89–1.12) | 390 | 106,439 | 1.02 (0.83–1.24) | |
| Q5: > 2.31 | 1102 | 393,694 | 0.90 (0.78–1.04) | 1161 | 358,976 | 1.02 (0.87–1.19) | 532 | 140,871 | 1.10 (0.86–1.41) | 0.025 c |
| Ptrend | 0.210 | 0.586 | 0.867 | |||||||
| Dietary folate (µg/day) | ||||||||||
| Continuous (per 1 SD = 128 µg/day) | 5882 | 2,241,059 | 0.96 (0.91–1.02) | 5448 | 1,748,126 | 1.03 (0.97–1.09) | 1990 | 503,575 | 1.10 (1.00–1.20) | 0.063 b |
| Q1: ≤ 242 | 1438 | 533,297 | 1 (Ref.) | 975 | 298,193 | 1 (Ref.) | 311 | 71,589 | 1 (Ref.) | |
| Q2: > 242–298 | 1211 | 458,111 | 0.93 (0.86–1.02) | 1076 | 350,013 | 0.98 (0.89–1.08) | 397 | 93,099 | 1.02 (0.87–1.19) | |
| Q3: > 298–357 | 1067 | 431,110 | 0.85 (0.77–0.94) | 1113 | 366,994 | 1.02 (0.92–1.13) | 389 | 101,785 | 0.95 (0.80–1.13) | |
| Q4: > 357–440 | 1101 | 417,655 | 0.89 (0.79–0.99) | 1152 | 368,818 | 1.09 (0.97–1.23) | 430 | 109,863 | 1.00 (0.82–1.22) | |
| Q5: > 440 | 1065 | 400,886 | 0.85 (0.74–0.98) | 1132 | 364,109 | 1.12 (0.96–1.31) | 463 | 127,239 | 1.00 (0.78–1.29) | 0.231 c |
| Ptrend | 0.052 | 0.059 | 0.998 | |||||||
| Dietary choline (mg/day) | ||||||||||
| Continuous (per 1 SD = 90 mg/day) | 5882 | 2,241,059 | 0.99 (0.95–1.02) | 5448 | 174,8126 | 1.01 (0.97–1.05) | 1990 | 503,575 | 1.01 (0.95–1.07) | 0.064 b |
| Q1: ≤ 202 | 1365 | 535,685 | 1 (Ref.) | 858 | 284,036 | 1 (Ref.) | 225 | 61,666 | 1 (Ref.) | |
| Q2: < 202–244 | 1226 | 471,093 | 0.97 (0.90–1.06) | 1055 | 337,077 | 1.03 (0.94–1.13) | 345 | 85,676 | 1.12 (0.94–1.33) | |
| Q3: < 244–285 | 1136 | 444,750 | 0.94 (0.86–1.03) | 1038 | 359,764 | 0.94 (0.85–1.03) | 380 | 99,898 | 1.06 (0.89–1.27) | |
| Q4: < 285–339 | 1106 | 418,570 | 0.94 (0.85–1.04) | 1171 | 378,671 | 0.98 (0.88–1.09) | 439 | 112,623 | 1.09 (0.91–1.31) | |
| Q5: > 339 | 1049 | 370,961 | 0.92 (0.82–1.04) | 1326 | 388,578 | 1.04 (0.92–1.17) | 601 | 143,712 | 1.13 (0.93–1.38) | 0.292 c |
| Ptrend | 0.177 | 0.577 | 0.344 | |||||||
| Dietary betaine (mg/day) | ||||||||||
| Continuous (per 1 SD = 88 mg /day) | 5882 | 2,241,059 | 1.01 (0.97–1.04) | 5448 | 1,748,126 | 0.96 (0.92–1.00) | 1990 | 503,575 | 1.02 (0.95–1.08) | 0.037 b |
| Q1: ≤ 39 | 1089 | 378,757 | 1 (Ref.) | 1254 | 359,896 | 1 (Ref.) | 440 | 102,142 | 1 (Ref.) | |
| Q2: < 39–88 | 1160 | 464,885 | 0.93 (0.85–1.03) | 1240 | 373,502 | 0.96 (0.87–1.05) | 416 | 98,141 | 1.06 (0.91–1.24) | |
| Q3: < 88–132 | 1264 | 474,910 | 1.01 (0.91–1.13) | 1031 | 342,637 | 0.92 (0.83–1.03) | 364 | 88,983 | 1.19 (0.99–1.44) | |
| Q4: < 132–193 | 1194 | 447,685 | 1.03 (0.92–1.15) | 1040 | 353,835 | 0.94 (0.83–1.05) | 408 | 107,715 | 1.13 (0.93–1.38) | |
| Q5: > 193 | 1175 | 474,821 | 0.98 (0.87–1.10) | 883 | 318,255 | 0.89 (0.79–1.02) | 362 | 106,593 | 1.12 (0.90–1.39) | 0.221 c |
| Ptrend | 0.741 | 0.126 | 0.497 | |||||||
| Dietary methionine (g/day) | ||||||||||
| Continuous (per 1 g/day) | 5882 | 2,241,059 | 0.95 (0.88–1.02) | 5448 | 1,748,126 | 1.02 (0.94–1.10) | 1990 | 503,575 | 0.88 (0.77–1.00) | 0.018 b |
| Q1: ≤ 1.06 | 1175 | 510,519 | 1 (Ref.) | 826 | 321,954 | 1 (Ref.) | 281 | 78,502 | 1 (Ref.) | |
| Q2: < 1.06–1.30 | 1230 | 469,493 | 1.05 (0.96–1.14) | 1033 | 339,137 | 1.01 (0.92–1.11) | 328 | 87,739 | 0.94 (0.80–1.11) | |
| Q3: < 1.30–1.54 | 1220 | 451,112 | 1.03 (0.95–1.13) | 1093 | 353,461 | 0.99 (0.89–1.09) | 418 | 94,445 | 1.09 (0.92–1.28) | |
| Q4: < 1.54–1.85 | 1140 | 423,892 | 0.99 (0.90–1.09) | 1226 | 367,949 | 1.02 (0.9–1.14) | 449 | 106,363 | 1.02 (0.86–1.22) | |
| Q5: > 1.85 | 1117 | 386,043 | 0.98 (0.87–1.10) | 1270 | 365,624 | 1.03 (0.91–1.16) | 514 | 136,526 | 0.87 (0.71–1.07) | 0.023 c |
| Ptrend | 0.460 | 0.581 | 0.200 | |||||||
Publisher’s Note: MDPI stays neutral with regard to jurisdictional claims in published maps and institutional affiliations. |
© 2021 by the authors. Licensee MDPI, Basel, Switzerland. This article is an open access article distributed under the terms and conditions of the Creative Commons Attribution (CC BY) license (https://creativecommons.org/licenses/by/4.0/).
Share and Cite
Van Puyvelde, H.; Papadimitriou, N.; Clasen, J.; Muller, D.; Biessy, C.; Ferrari, P.; Halkjær, J.; Overvad, K.; Tjønneland, A.; Fortner, R.T.; et al. Dietary Methyl-Group Donor Intake and Breast Cancer Risk in the European Prospective Investigation into Cancer and Nutrition (EPIC). Nutrients 2021, 13, 1843. https://doi.org/10.3390/nu13061843
Van Puyvelde H, Papadimitriou N, Clasen J, Muller D, Biessy C, Ferrari P, Halkjær J, Overvad K, Tjønneland A, Fortner RT, et al. Dietary Methyl-Group Donor Intake and Breast Cancer Risk in the European Prospective Investigation into Cancer and Nutrition (EPIC). Nutrients. 2021; 13(6):1843. https://doi.org/10.3390/nu13061843
Chicago/Turabian StyleVan Puyvelde, Heleen, Nikos Papadimitriou, Joanna Clasen, David Muller, Carine Biessy, Pietro Ferrari, Jytte Halkjær, Kim Overvad, Anne Tjønneland, Renée T. Fortner, and et al. 2021. "Dietary Methyl-Group Donor Intake and Breast Cancer Risk in the European Prospective Investigation into Cancer and Nutrition (EPIC)" Nutrients 13, no. 6: 1843. https://doi.org/10.3390/nu13061843