
Blood Levels of the SMOC1 Hepatokine Are Not Causally Linked with Type 2 Diabetes: A Bidirectional Mendelian Randomization Study

 , , and
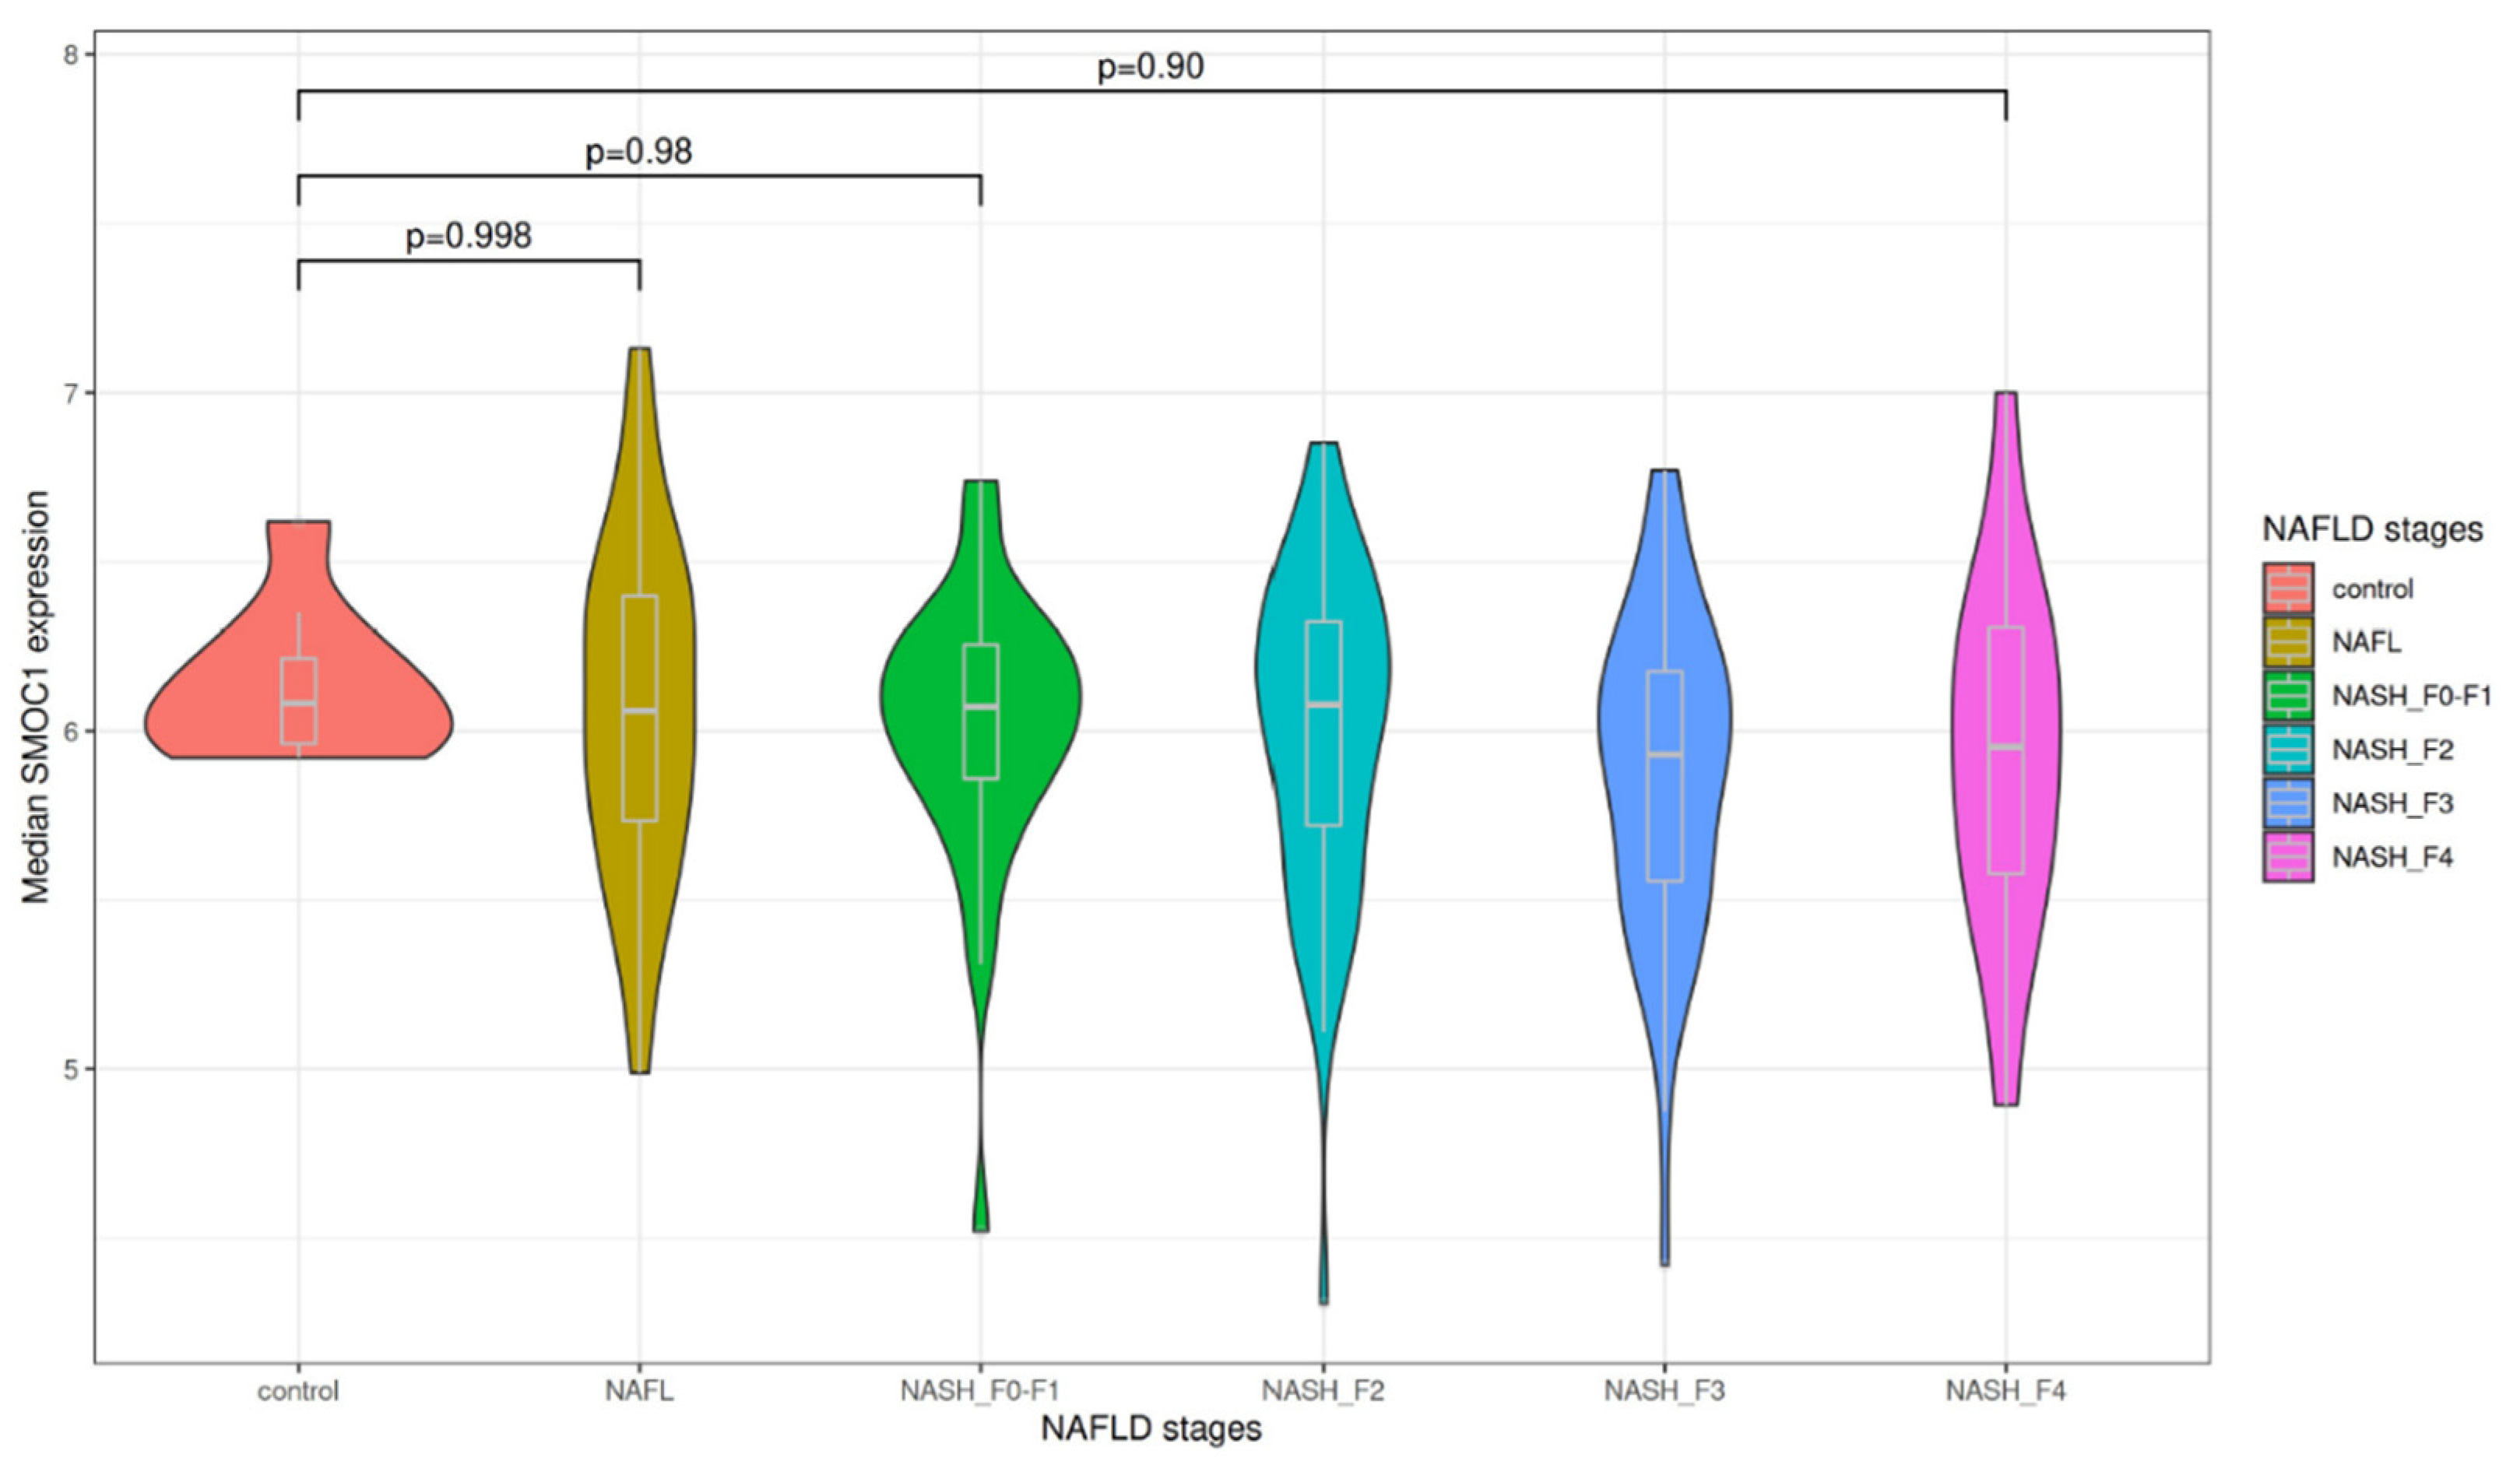
Abstract
:1. Introduction
2. Methods
2.1. Observational Analysis
2.2. Study Populations Included in the Mendelian Randomization Analyses
2.3. Mendelian Randomization Analyses
2.4. Data and Code Availability
3. Results
3.1. Association of Liver SMOC1 Expression with Liver Disease Progression
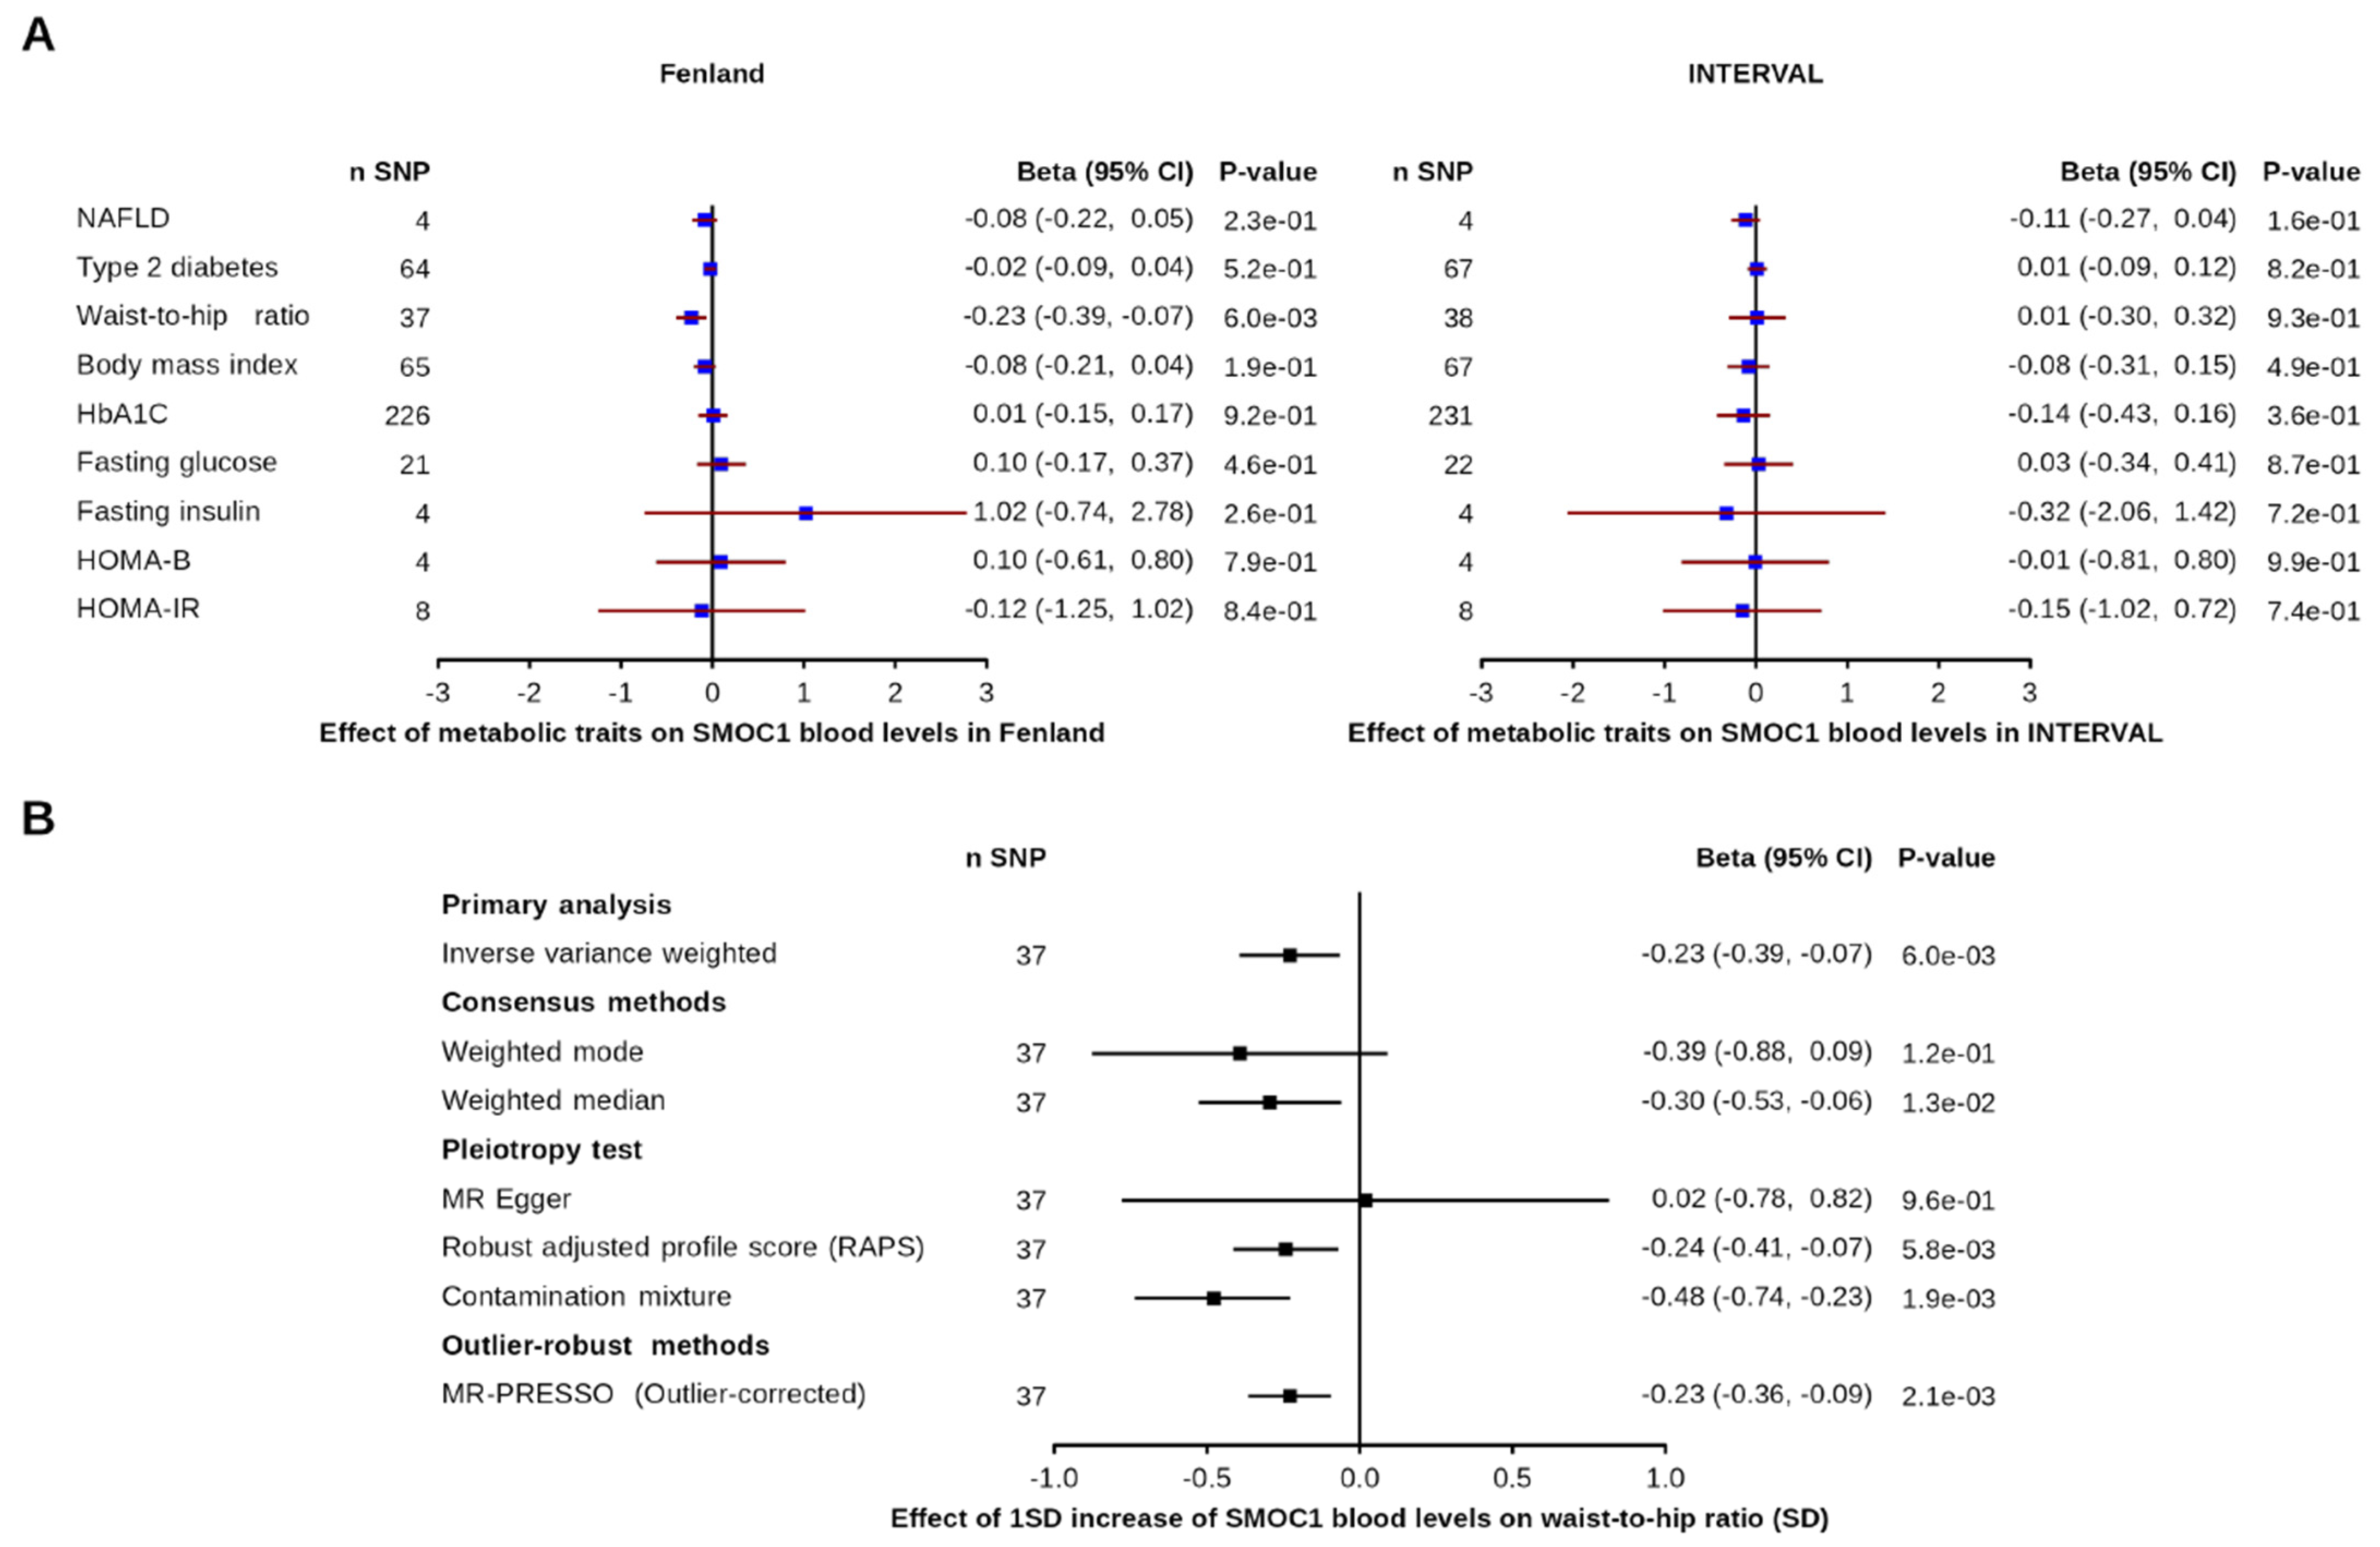
3.2. Effect of Metabolic and Disease-Related Traits on SMOC1 Levels
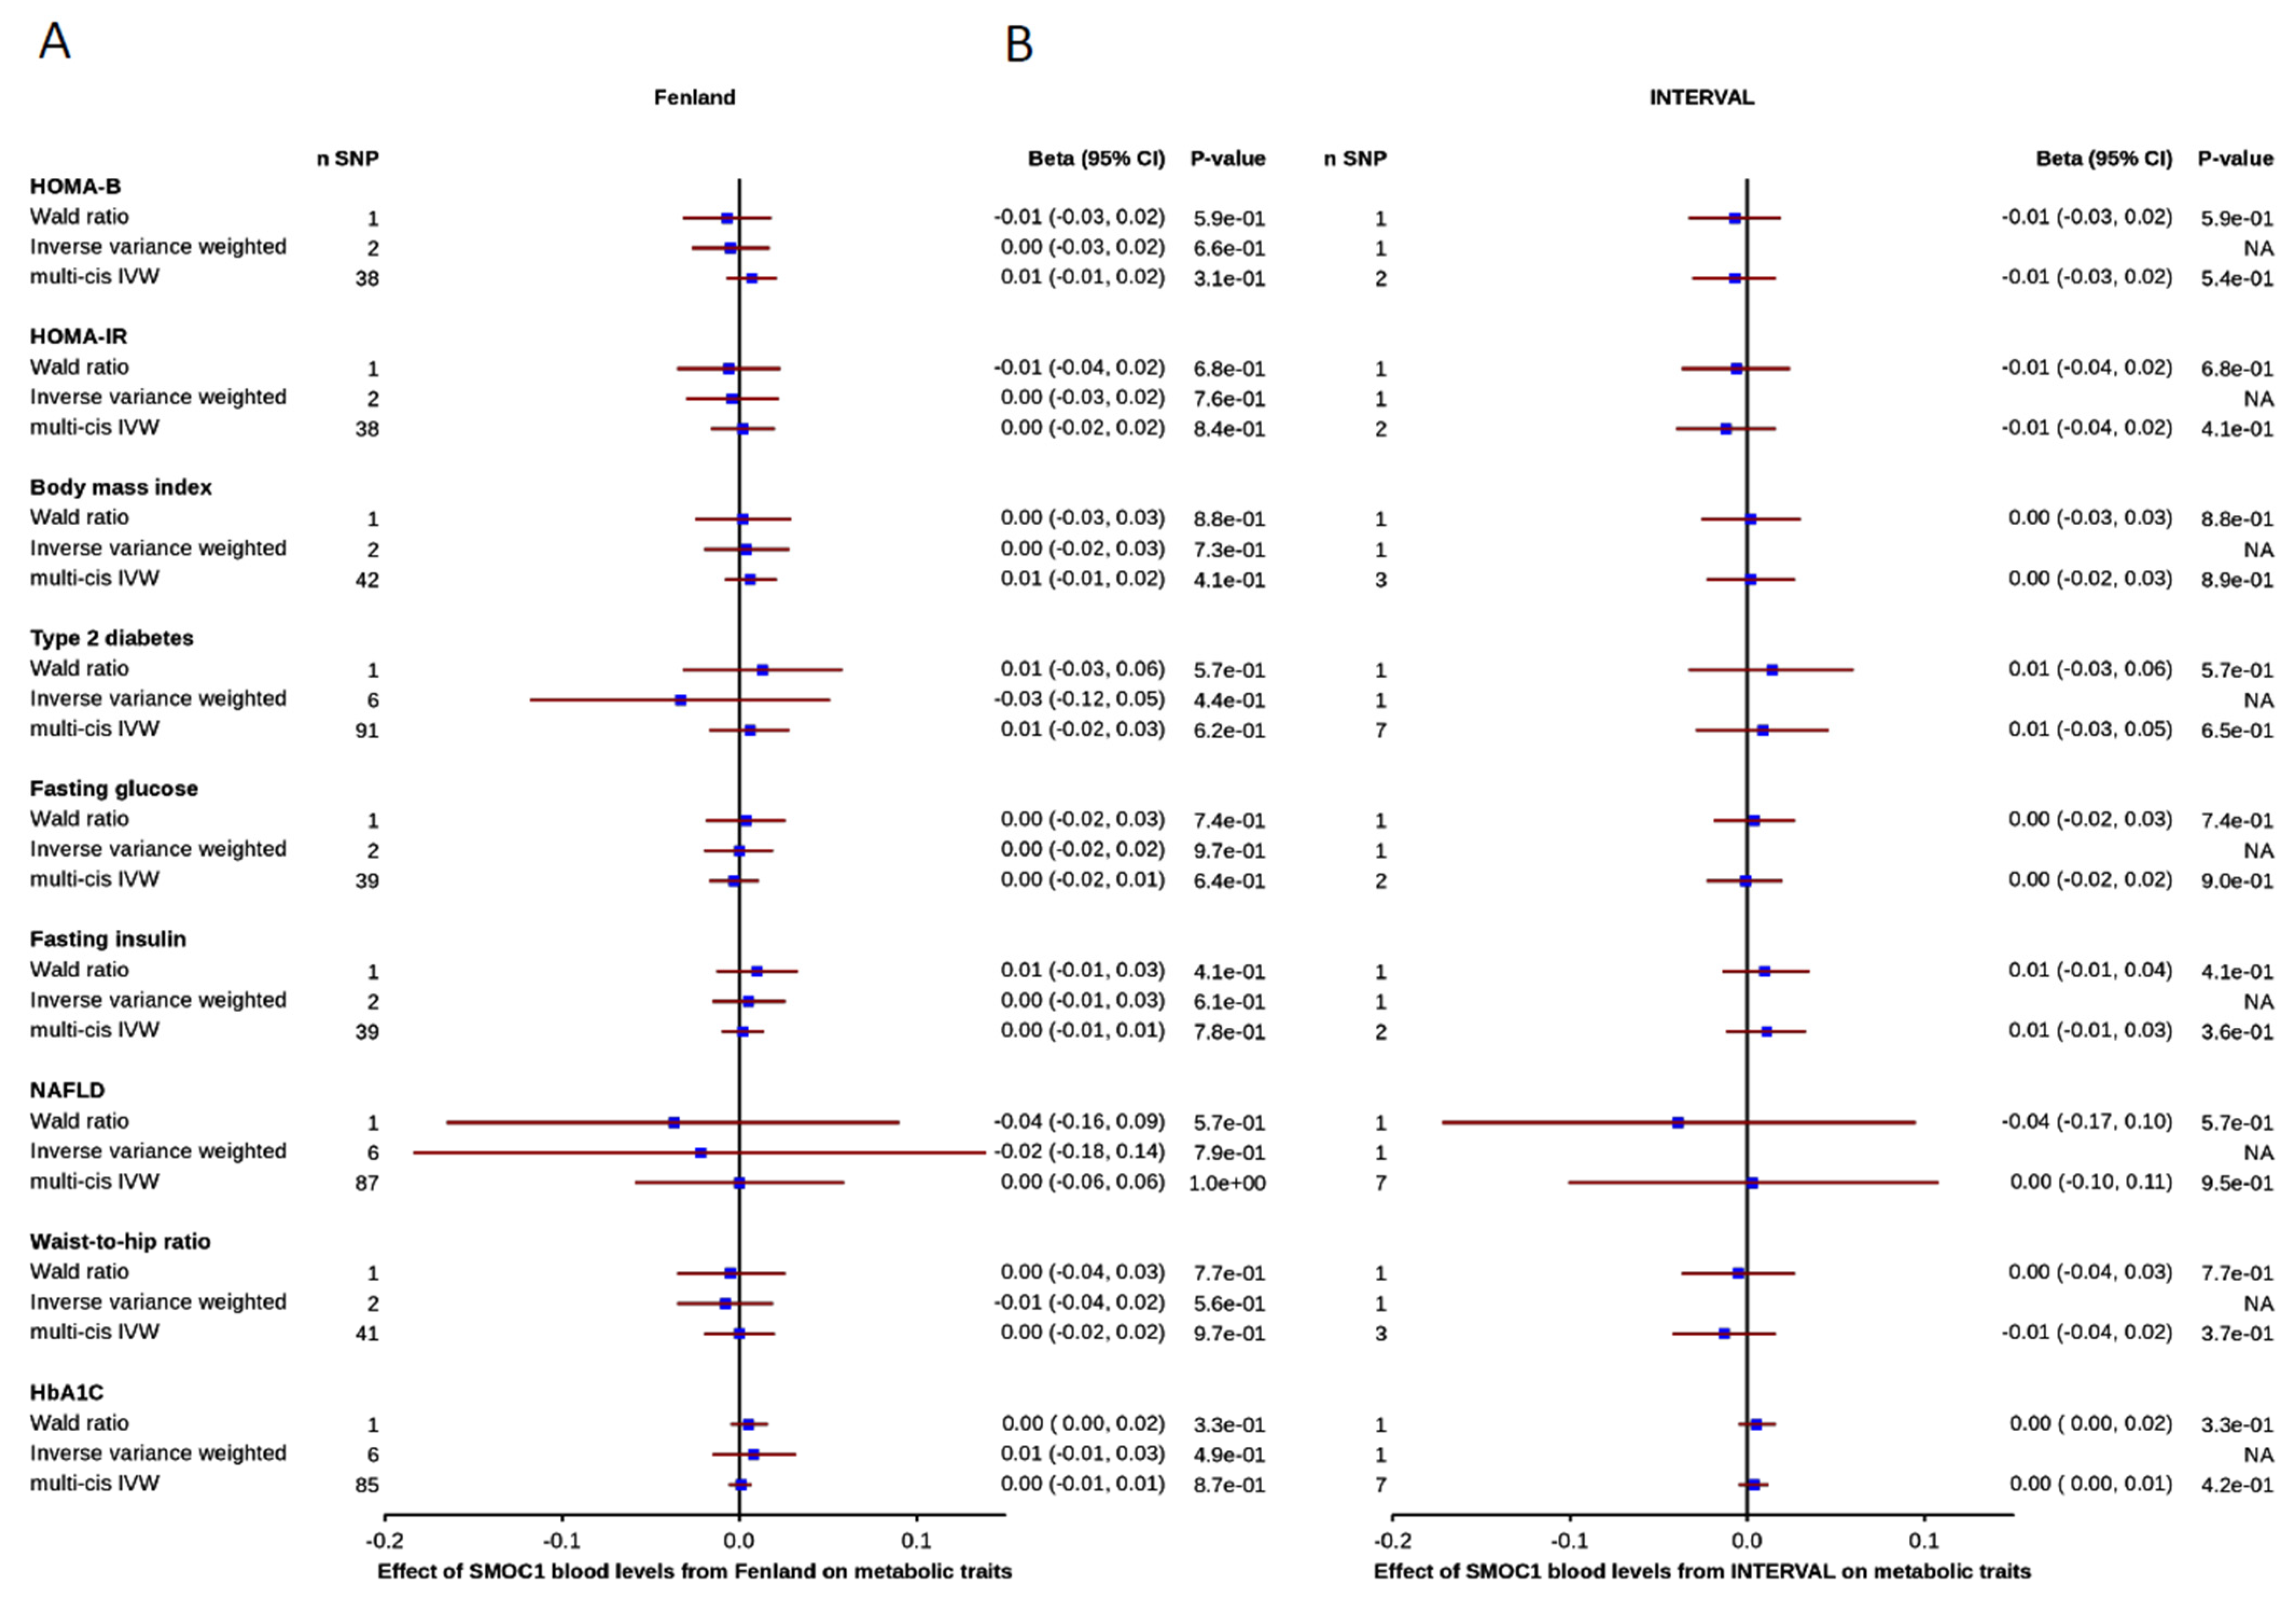
3.3. Effect of Blood SMOC1 Levels on Metabolic and Disease-Related Traits
3.4. Causal Effects of SMOC1 Levels across the Human Phenome
4. Discussion
Author Contributions
Funding
Institutional Review Board Statement
Informed Consent Statement
Acknowledgments
Conflicts of Interest
References
- Watt, M.J.; Miotto, P.M.; De Nardo, W.; Montgomery, M.K. The liver as an endocrine organ—Linking NAFLD and insulin resistance. Endocr. Rev. 2019, 40, 1367–1393. [Google Scholar] [CrossRef]
- Meex, R.C.; Watt, M.J. Hepatokines: Linking nonalcoholic fatty liver disease and insulin resistance. Nat. Rev. Endocrinol. 2017, 13, 509–520. [Google Scholar] [CrossRef]
- Meex, R.C.; Hoy, A.; Morris, A.; Brown, R.D.; Lo, J.C.; Burke, M.; Goode, R.; Kingwell, B.A.; Kraakman, M.; Febbraio, M.A.; et al. Fetuin B is a secreted hepatocyte factor linking steatosis to impaired glucose metabolism. Cell Metab. 2015, 22, 1078–1089. [Google Scholar] [CrossRef] [Green Version]
- Montgomery, M.K.; Bayliss, J.; Devereux, C.; Bezawork-Geleta, A.; Roberts, D.; Huang, C.; Schittenhelm, R.B.; Ryan, A.; Townley, S.L.; Selth, L.A.; et al. SMOC1 is a glucose-responsive hepatokine and therapeutic target for glycemic control. Sci. Transl. Med. 2020, 12. [Google Scholar] [CrossRef]
- Burgess, S.; Zuber, V. Risk Factors Mediating the Effect of Body-Mass Index and Waist-to-Hip 2 Ratio on Cardiovascular Outcomes: Mendelian Randomization Analysis. Int. J. Obes. 2021, 45, 1428–1438. [Google Scholar]
- Jensen-Cody, S.O.; Potthoff, M.J. Hepatokines and metabolism: Deciphering communication from the liver. Mol. Metab. 2020, 44, 101138. [Google Scholar] [CrossRef] [PubMed]
- Vannahme, C.; Smyth, N.; Miosge, N.; Gösling, S.; Frie, C.; Paulsson, M.; Maurer, P.; Hartmann, U. Characterization of SMOC-1, a novel modular calcium-binding protein in basement membranes. J. Biol. Chem. 2002, 277, 37977–37986. [Google Scholar] [CrossRef] [PubMed] [Green Version]
- Bellenguez, C.; Strange, A.; Freeman, C.; Donnelly, P.; Spencer, C.C. A robust clustering algorithm for identifying problematic samples in genome-wide association studies. Bioinformatics 2012, 28, 134–135. [Google Scholar] [CrossRef] [PubMed]
- Ruth, K.S.; Day, F.R.; Tyrrell, J.; Thompson, D.J.; Wood, A.R.; Mahajan, A.; Beaumont, B.N.; Wittemans, L.; Martin, S.; Busch, A.S. Using human genetics to understand the disease impacts of testosterone in men and women. Nat. Med. 2020, 26, 252–258. [Google Scholar] [CrossRef]
- Ding, E.; Song, Y.; Manson, J.E.; Hunter, D.J.; Lee, C.C.; Rifai, N.; Buring, J.E.; Gaziano, J.M.; Liu, S. Sex hormone–binding globulin and risk of type 2 diabetes in women and men. N. Engl. J. Med. 2009, 361, 1152–1163. [Google Scholar] [CrossRef] [Green Version]
- Perry, J.R.; Weedon, M.N.; Langenberg, C.; Jackson, A.U.; Lyssenko, V.; Sparsø, T.; Thorleifsson, G.; Grallert, H.; Ferrucci, L.; Maggio, M.; et al. Genetic evidence that raised sex hormone binding globulin (SHBG) levels reduce the risk of type 2 diabetes. Hum. Mol. Genet. 2010, 19, 535–544. [Google Scholar] [CrossRef] [Green Version]
- Govaere, O.; Cockell, S.; Tiniakos, D.; Queen, R.; Younes, R.; Vacca, M.; Alexander, L.; Ravaioli, F.; Palmer, J.; Petta, S.; et al. Transcriptomic profiling across the nonalcoholic fatty liver disease spectrum reveals gene signatures for steatohepatitis and fibrosis. Sci. Transl. Med. 2020, 12, 572. [Google Scholar] [CrossRef]
- Robinson, M.D.; Oshlack, A. A scaling normalization method for differential expression analysis of RNA-seq data. Genome Biol. 2010, 11, R25. [Google Scholar] [CrossRef] [Green Version]
- Ritchie, M.E.; Phipson, B.; Wu, D.; Hu, Y.; Law, C.W.; Shi, W.; Smyth, G.K. Limma powers differential expression analyses for RNA-sequencing and microarray studies. Nucleic Acids Res. 2015, 43, e47. [Google Scholar] [CrossRef]
- Sun, B.; Maranville, J.C.; Peters, J.; Stacey, D.; Staley, J.; Blackshaw, J.; Burgess, S.; Jiang, T.; Paige, E.; Surendran, P.; et al. Genomic atlas of the human plasma proteome. Nature 2018, 558, 73–79. [Google Scholar] [CrossRef]
- Pietzner, M.; Wheeler, E.; Carrasco-Zanini, J.; Raffler, J.; Kerrison, N.D.; Oerton, E.; Auyeung, V.P.W.; Luan, J.; Finan, C.; Casas, J.P.; et al. Genetic architecture of host proteins involved in SARS-CoV-2 infection. Nat. Commun. 2020, 11, 6397. [Google Scholar] [CrossRef] [PubMed]
- Ghodsian, N.; Abner, E.; Emdin, C.A.; Gobeil, É.; Taba, N.; Haas, M.E.; Perrot, N.; Manikpurage, H.D.; Gagnon, É.; Bourgault, J.; et al. Electronic health record-based genome-wide meta-analysis provides insights on the genetic architecture of non-alcoholic fatty liver disease. Cell Rep. Med. 2021, 2, 100437. [Google Scholar] [CrossRef]
- Mahajan, A.; Taliun, D.; Thurner, M.; Robertson, N.R.; Torres, J.M.; Rayner, N.W.; Payne, A.J.; Steinthorsdottir, V.; Scott, R.A.; Grarup, N.; et al. Fine-mapping type 2 diabetes loci to single-variant resolution using high-density imputation and islet-specific epigenome maps. Nat. Genet. 2018, 50, 1505–1513. [Google Scholar] [CrossRef] [PubMed] [Green Version]
- Locke, A.E.; Kahali, B.; Berndt, S.I.; Justice, A.E.; Pers, T.H.; Day, F.R.; Powell, C.; Vedantam, S.; Buchkovich, M.L.; Yang, J.; et al. Genetic studies of body mass index yield new insights for obesity biology. Nature 2015, 518, 197–206. [Google Scholar] [CrossRef] [Green Version]
- Shungin, D.; Winkler, T.W.; Croteau-Chonka, D.C.; Ferreira, T.; Locke, A.E.; Mägi, R.; Strawbridge, R.J.; Pers, T.H.; Fischer, K.; Justice, A.E.; et al. New genetic loci link adipose and insulin biology to body fat distribution. Nature 2015, 518, 187–196. [Google Scholar] [CrossRef] [PubMed] [Green Version]
- Manning, A.K.; DIAbetes Genetics Replication and Meta-analysis (DIAGRAM) Consortium; Hivert, M.-F.; Scott, A.R.; Grimsby, J.L.; Bouatia-Naji, N.; Chen, H.; Rybin, D.; Liu, C.-T.; Bielak, L.F.; et al. A genome-wide approach accounting for body mass index identifies genetic variants influencing fasting glycemic traits and insulin resistance. Nat. Genet. 2012, 44, 659–669. [Google Scholar] [CrossRef]
- Dupuis, J.; Langenberg, C.; Prokopenko, I.; Saxena, R.; Soranzo, N.; Jackson, A.U.; Wheeler, E.; Glazer, N.L.; Bouatia-Naji, N.; Gloyn, A.L.; et al. New genetic loci implicated in fasting glucose homeostasis and their impact on type 2 diabetes risk. Nat. Genet. 2010, 42, 105–116. [Google Scholar] [CrossRef] [PubMed]
- Soranzo, N.; Sanna, S.; Wheeler, E.; Gieger, C.; Radke, D.; Dupuis, J.; Bouatia-Naji, N.; Langenberg, C.; Prokopenko, I.; Stolerman, E.; et al. Common variants at 10 genomic loci influence hemoglobin A1C levels via glycemic and nonglycemic pathways. Diabetes 2010, 59, 3229–3239. [Google Scholar] [CrossRef] [Green Version]
- Zhao, Q.; Chen, Y.; Wang, J.; Small, D.S. Powerful genome-wide design and robust statistical inference in two-sample summary-data Mendelian randomization. arXiv 2018, arXiv:1804.07371. [Google Scholar]
- Slob, E.A.; Burgess, S. A comparison of robust Mendelian randomization methods using summary data. Genet. Epidemiol. 2020, 44, 313–329. [Google Scholar] [CrossRef] [Green Version]
- Bowden, J.; Smith, G.D.; Burgess, S. Mendelian randomization with invalid instruments: Effect estimation and bias detection through Egger regression. Int. J. Epidemiol. 2015, 44, 512–525. [Google Scholar] [CrossRef] [PubMed] [Green Version]
- Verbanck, M.; Chen, C.-Y.; Neale, B.; Do, R. Detection of widespread horizontal pleiotropy in causal relationships inferred from Mendelian randomization between complex traits and diseases. Nat. Genet. 2018, 50, 693–698. [Google Scholar] [CrossRef]
- Burgess, S.; Thompson, S.G.; Collaboration, C.C.G. Avoiding bias from weak instruments in Mendelian randomization studies. Int. J. Epidemiol. 2011, 40, 755–764. [Google Scholar] [CrossRef] [PubMed] [Green Version]
- Pierce, B.L.; Ahsan, H.; VanderWeele, T.J. Power and instrument strength requirements for Mendelian randomization studies using multiple genetic variants. Int. J. Epidemiol. 2011, 40, 740–752. [Google Scholar] [CrossRef] [Green Version]
- Burgess, S.; Bowden, J.; Fall, T.; Ingelsson, E.; Thompson, S.G. Sensitivity analyses for robust causal inference from Mendelian randomization analyses with multiple genetic variants. Epidemiology 2017, 28, 30. [Google Scholar] [CrossRef] [Green Version]
- Burgess, S.; Zuber, V.; Valdes-Marquez, E.; Sun, B.B.; Hopewell, J.C. Mendelian randomization with fine-mapped genetic data: Choosing from large numbers of correlated instrumental variables. Genet. Epidemiol. 2017, 41, 714–725. [Google Scholar] [CrossRef] [PubMed]
- Gkatzionis, A.; Burgess, S.; Newcombe, P.J. Statistical Methods for cis-Mendelian Randomization. arXiv 2021, arXiv:2101.04081. [Google Scholar]
- Staley, J.R.; Blackshaw, J.; Kamat, M.A.; Ellis, S.; Surendran, P.; Sun, B.B.; Paul, D.S.; Freitag, D.; Burgess, S.; Danesh, J.; et al. PhenoScanner: A database of human genotype–phenotype associations. Bioinformatics 2016, 32, 3207–3209. [Google Scholar] [CrossRef] [Green Version]
- Kamat, M.A.; Blackshaw, J.A.; Young, R.; Surendran, P.; Burgess, S.; Danesh, J.; Butterworth, A.S.; Staley, J.R. PhenoScanner V2: An expanded tool for searching human genotype–phenotype associations. Bioinformatics 2019, 35, 4851–4853. [Google Scholar] [CrossRef] [PubMed] [Green Version]
- Lagos, F.A.D.; Elgheznawy, A.; Kyselova, A.; Zu Heringdorf, D.M.; Ratiu, C.; Randriamboavonjy, V.; Mann, A.W.; Fisslthaler, B.; Siragusa, M.; Fleming, I. Secreted modular calcium-binding protein 1 binds and activates thrombin to account for platelet hyperreactivity in diabetes. Blood 2021, 137, 1641–1651. [Google Scholar] [CrossRef] [PubMed]


Publisher’s Note: MDPI stays neutral with regard to jurisdictional claims in published maps and institutional affiliations. |
© 2021 by the authors. Licensee MDPI, Basel, Switzerland. This article is an open access article distributed under the terms and conditions of the Creative Commons Attribution (CC BY) license (https://creativecommons.org/licenses/by/4.0/).
Share and Cite
Ghodsian, N.; Gagnon, E.; Bourgault, J.; Gobeil, É.; Manikpurage, H.D.; Perrot, N.; Girard, A.; Mitchell, P.L.; Arsenault, B.J. Blood Levels of the SMOC1 Hepatokine Are Not Causally Linked with Type 2 Diabetes: A Bidirectional Mendelian Randomization Study. Nutrients 2021, 13, 4208. https://doi.org/10.3390/nu13124208
Ghodsian N, Gagnon E, Bourgault J, Gobeil É, Manikpurage HD, Perrot N, Girard A, Mitchell PL, Arsenault BJ. Blood Levels of the SMOC1 Hepatokine Are Not Causally Linked with Type 2 Diabetes: A Bidirectional Mendelian Randomization Study. Nutrients. 2021; 13(12):4208. https://doi.org/10.3390/nu13124208
Chicago/Turabian StyleGhodsian, Nooshin, Eloi Gagnon, Jérôme Bourgault, Émilie Gobeil, Hasanga D. Manikpurage, Nicolas Perrot, Arnaud Girard, Patricia L. Mitchell, and Benoit J. Arsenault. 2021. "Blood Levels of the SMOC1 Hepatokine Are Not Causally Linked with Type 2 Diabetes: A Bidirectional Mendelian Randomization Study" Nutrients 13, no. 12: 4208. https://doi.org/10.3390/nu13124208