
The Effect of ß-Glucan Prebiotic on Kidney Function, Uremic Toxins and Gut Microbiome in Stage 3 to 5 Chronic Kidney Disease (CKD) Predialysis Participants: A Randomized Controlled Trial

 , , ,
, , ,
Abstract
:1. Introduction
2. Materials and Methods
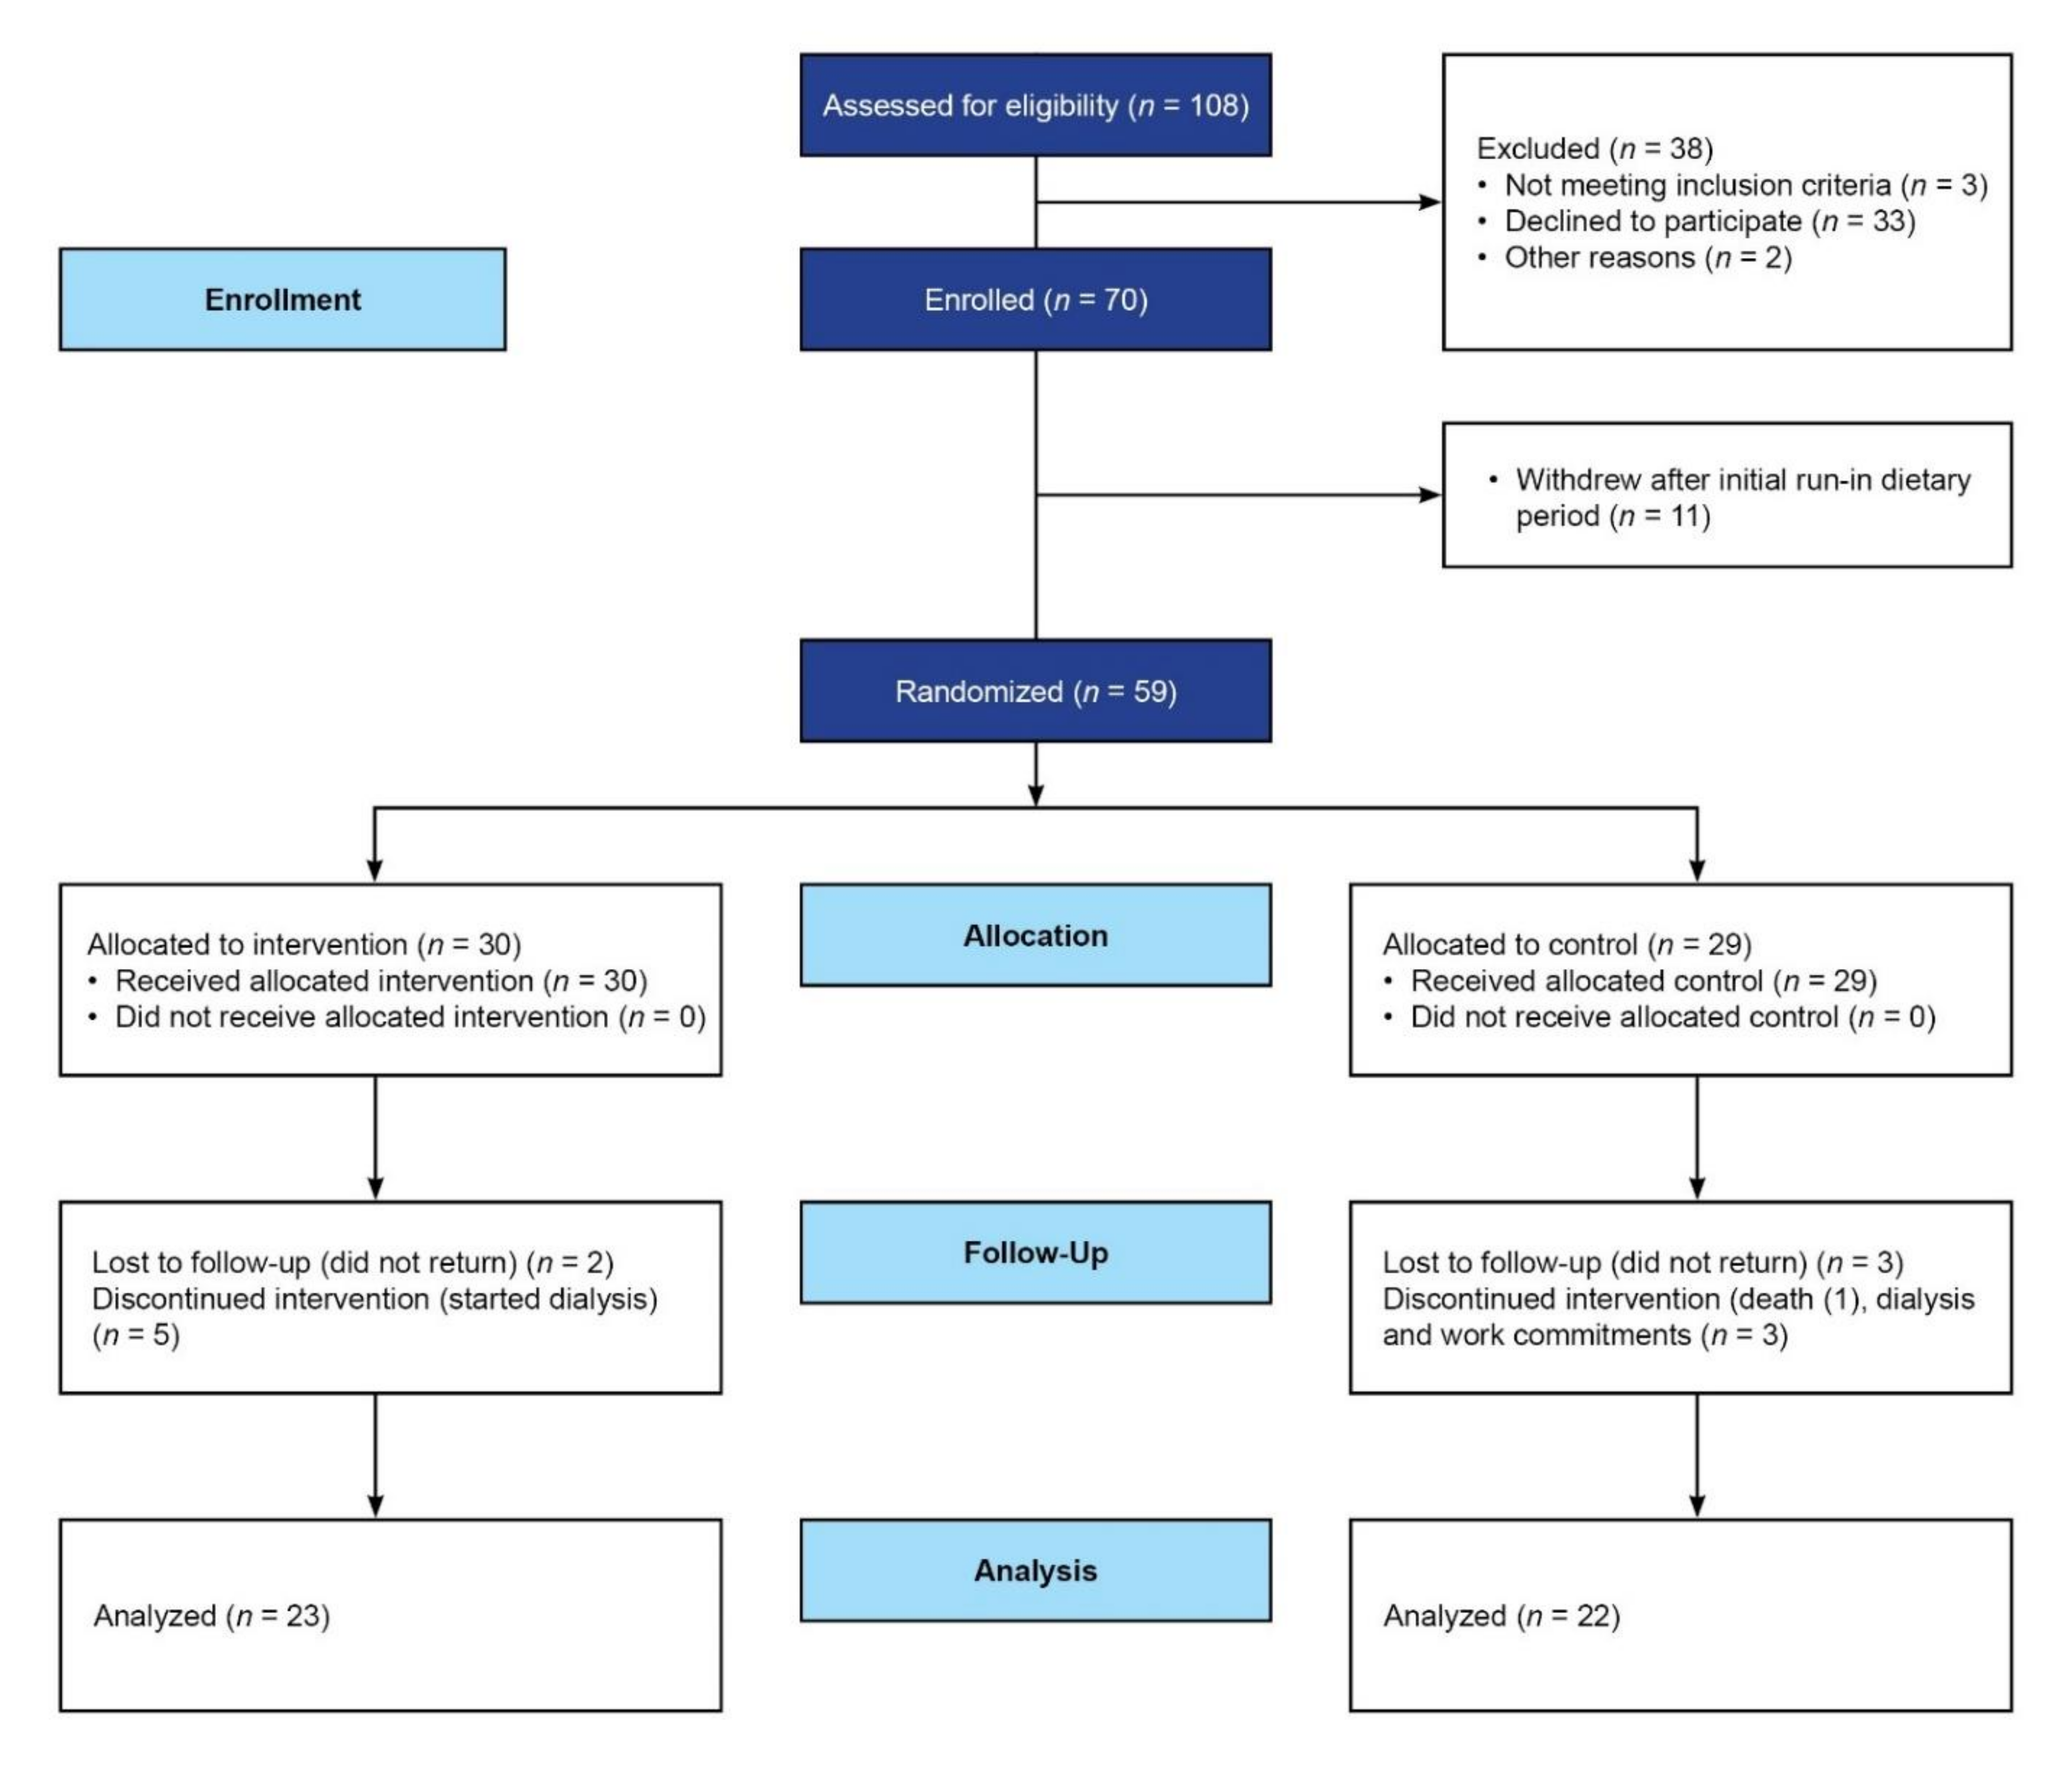
2.1. Participants
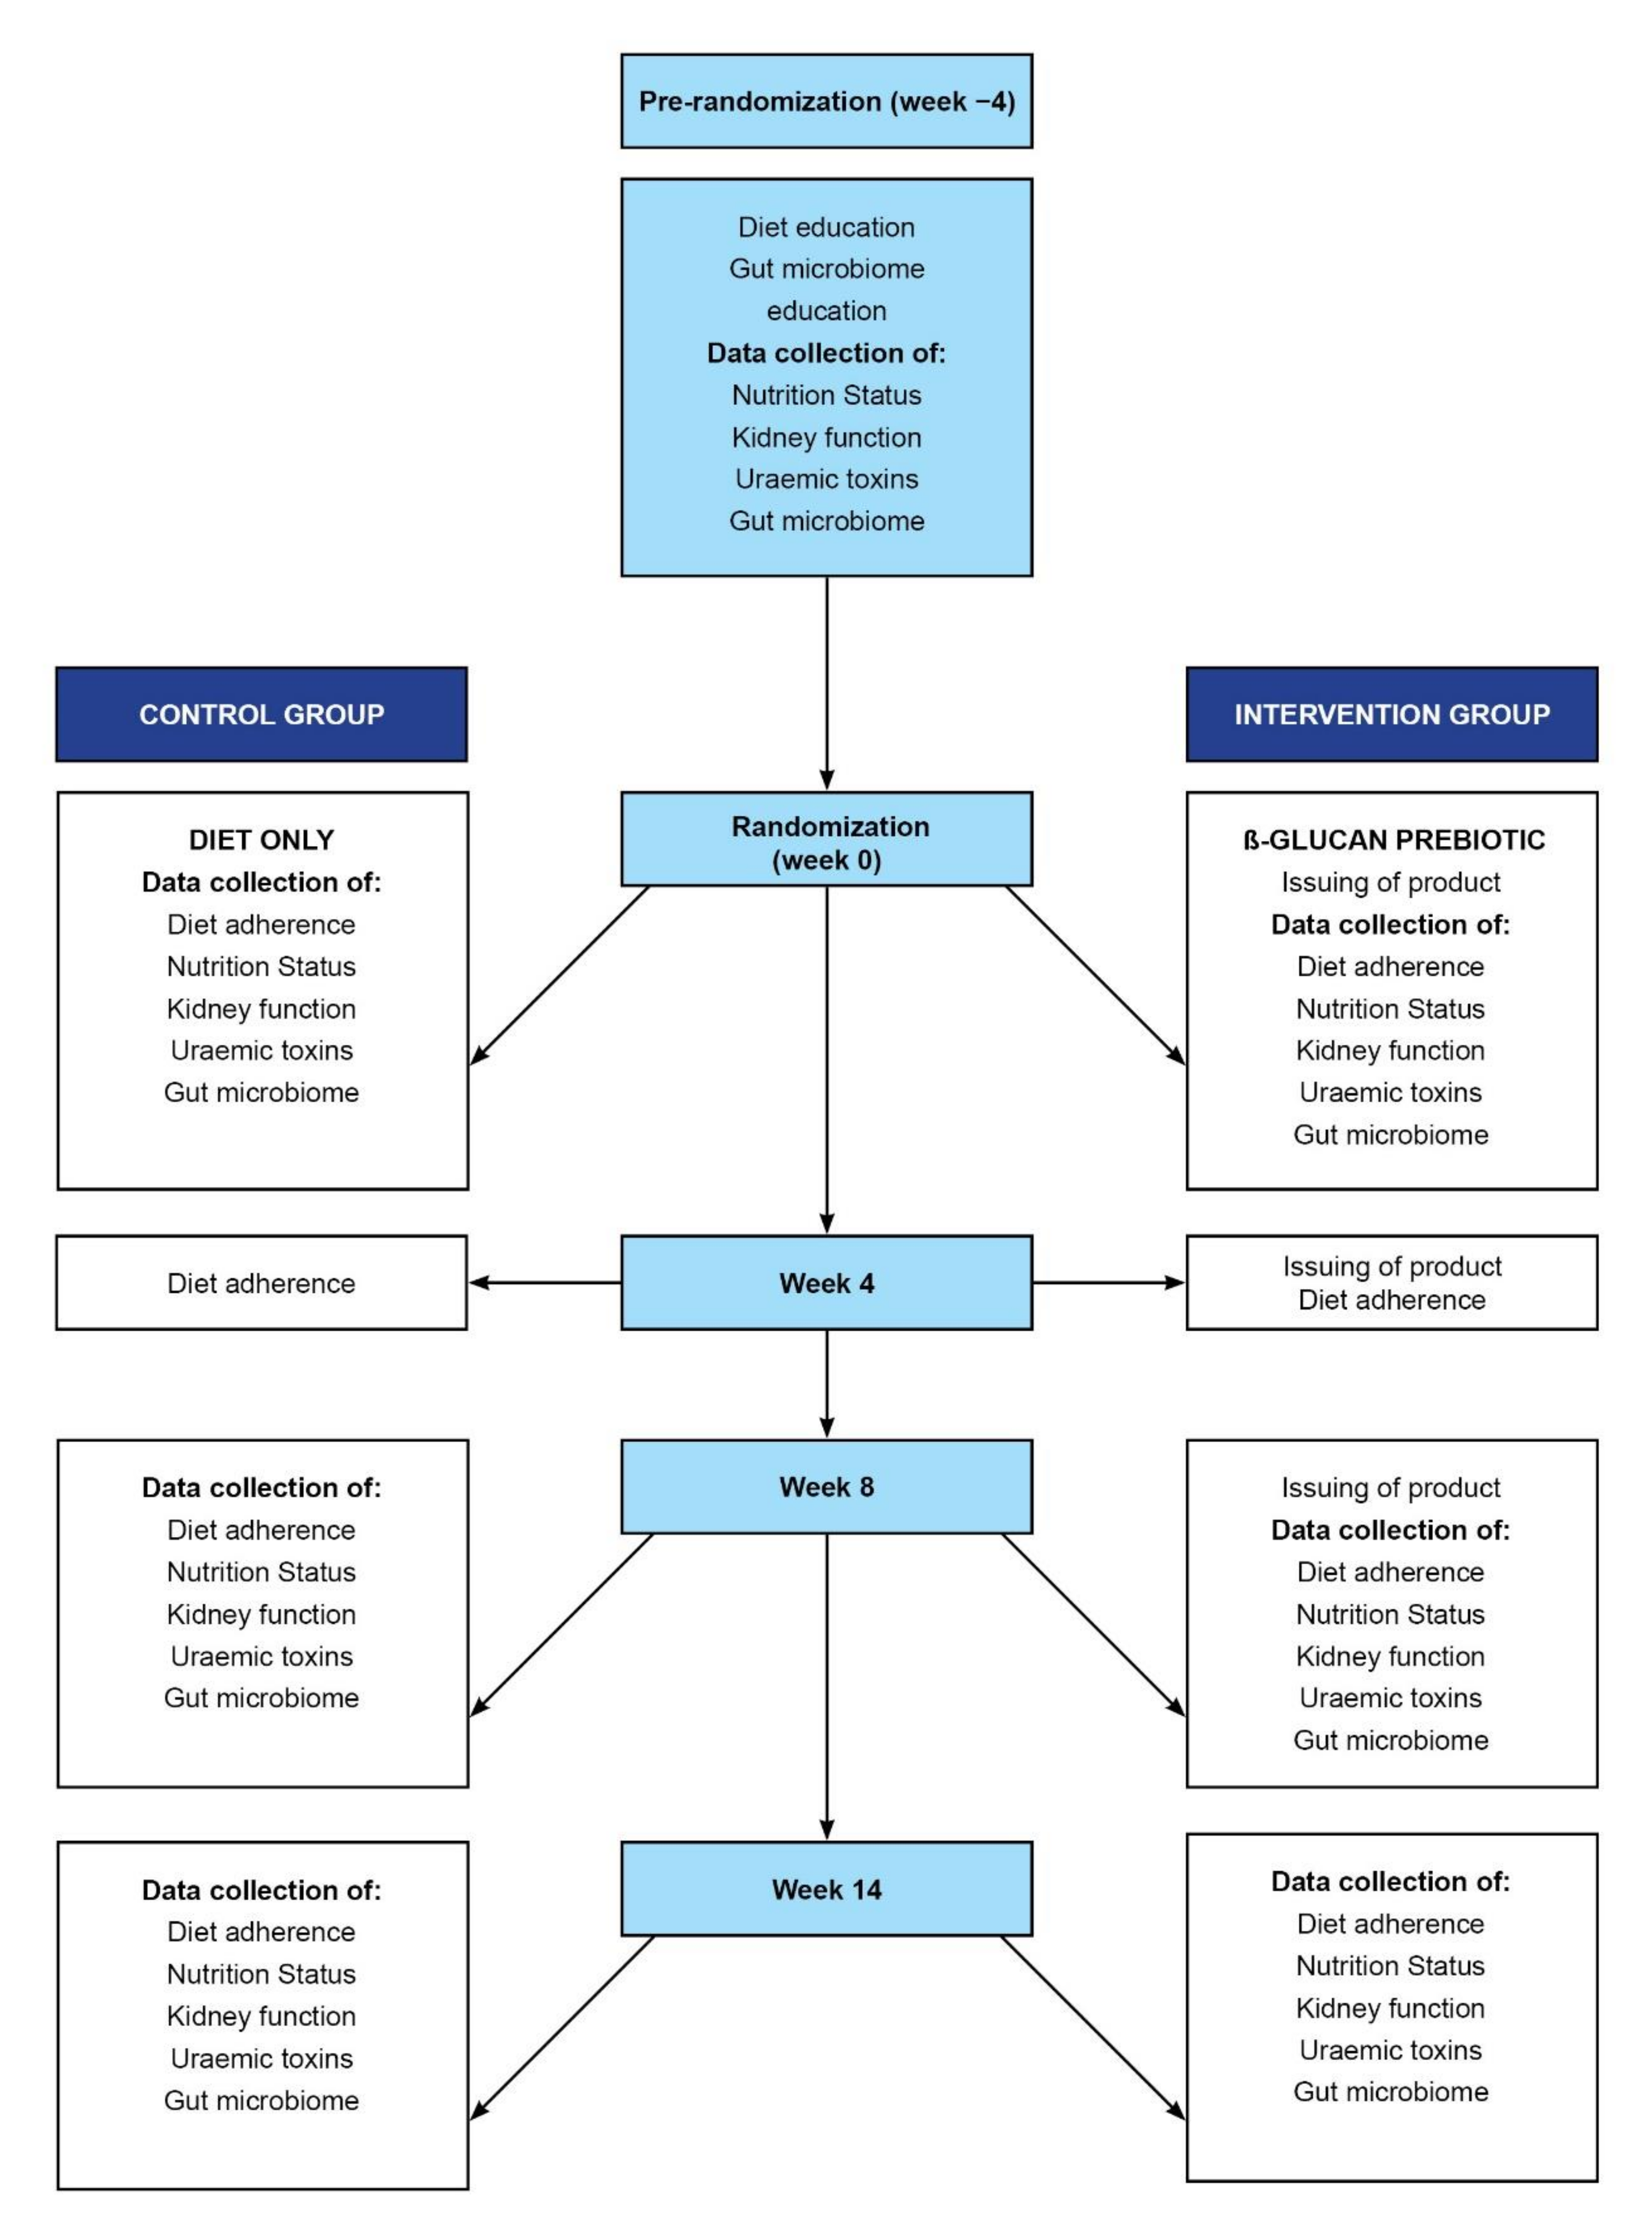
2.2. Design
2.3. Sample Size
2.4. Anthropometry and Biochemistry Methods
2.5. Dietary Intake, Education and Prebiotic Product
2.6. Uremic Toxin Quantification
2.7. Stool-Sample Collection
2.8. Analysis of Gut Microbiome
2.9. Statistical Analysis
2.10. Gut Microbiome Statistical Analysis
3. Results
3.1. Baseline Data
3.2. Post-Intervention Data
3.3. Kidney Function and Biochemistry
3.4. Plasma Levels of Colon-Derived Uremic Toxins
3.5. Anthropometry, Dietary Changes and Adherence to the Diet
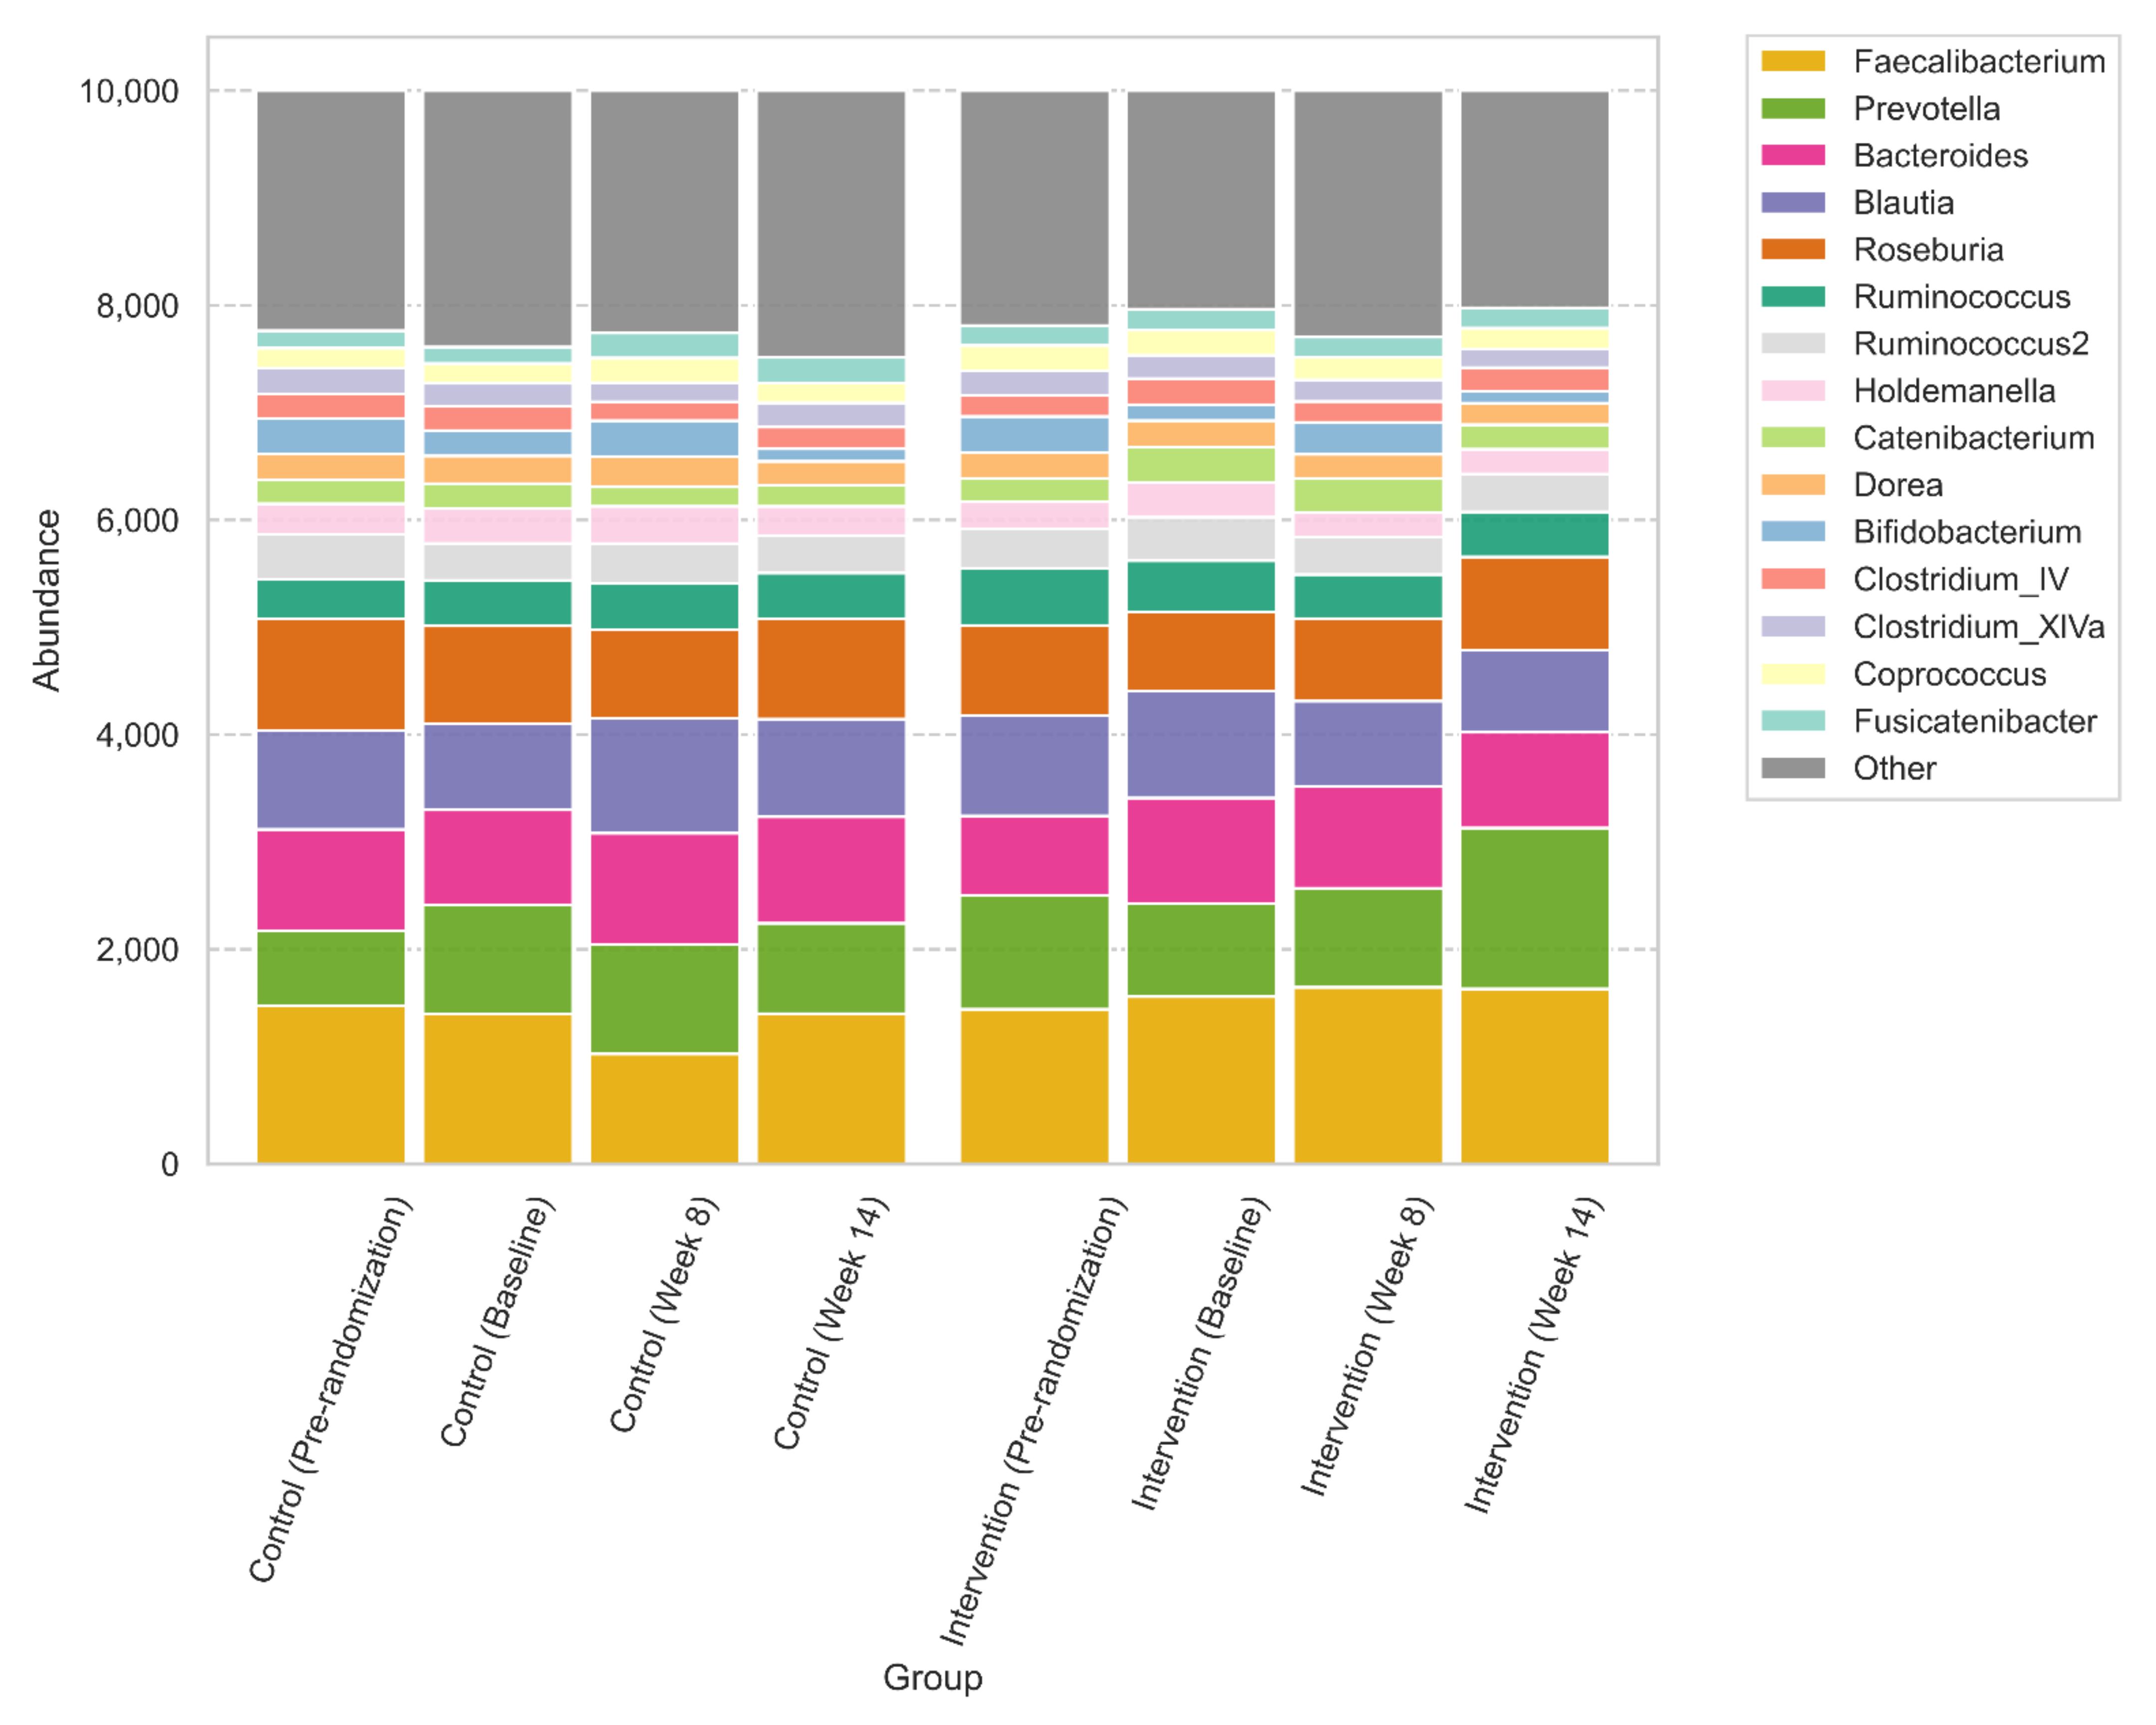
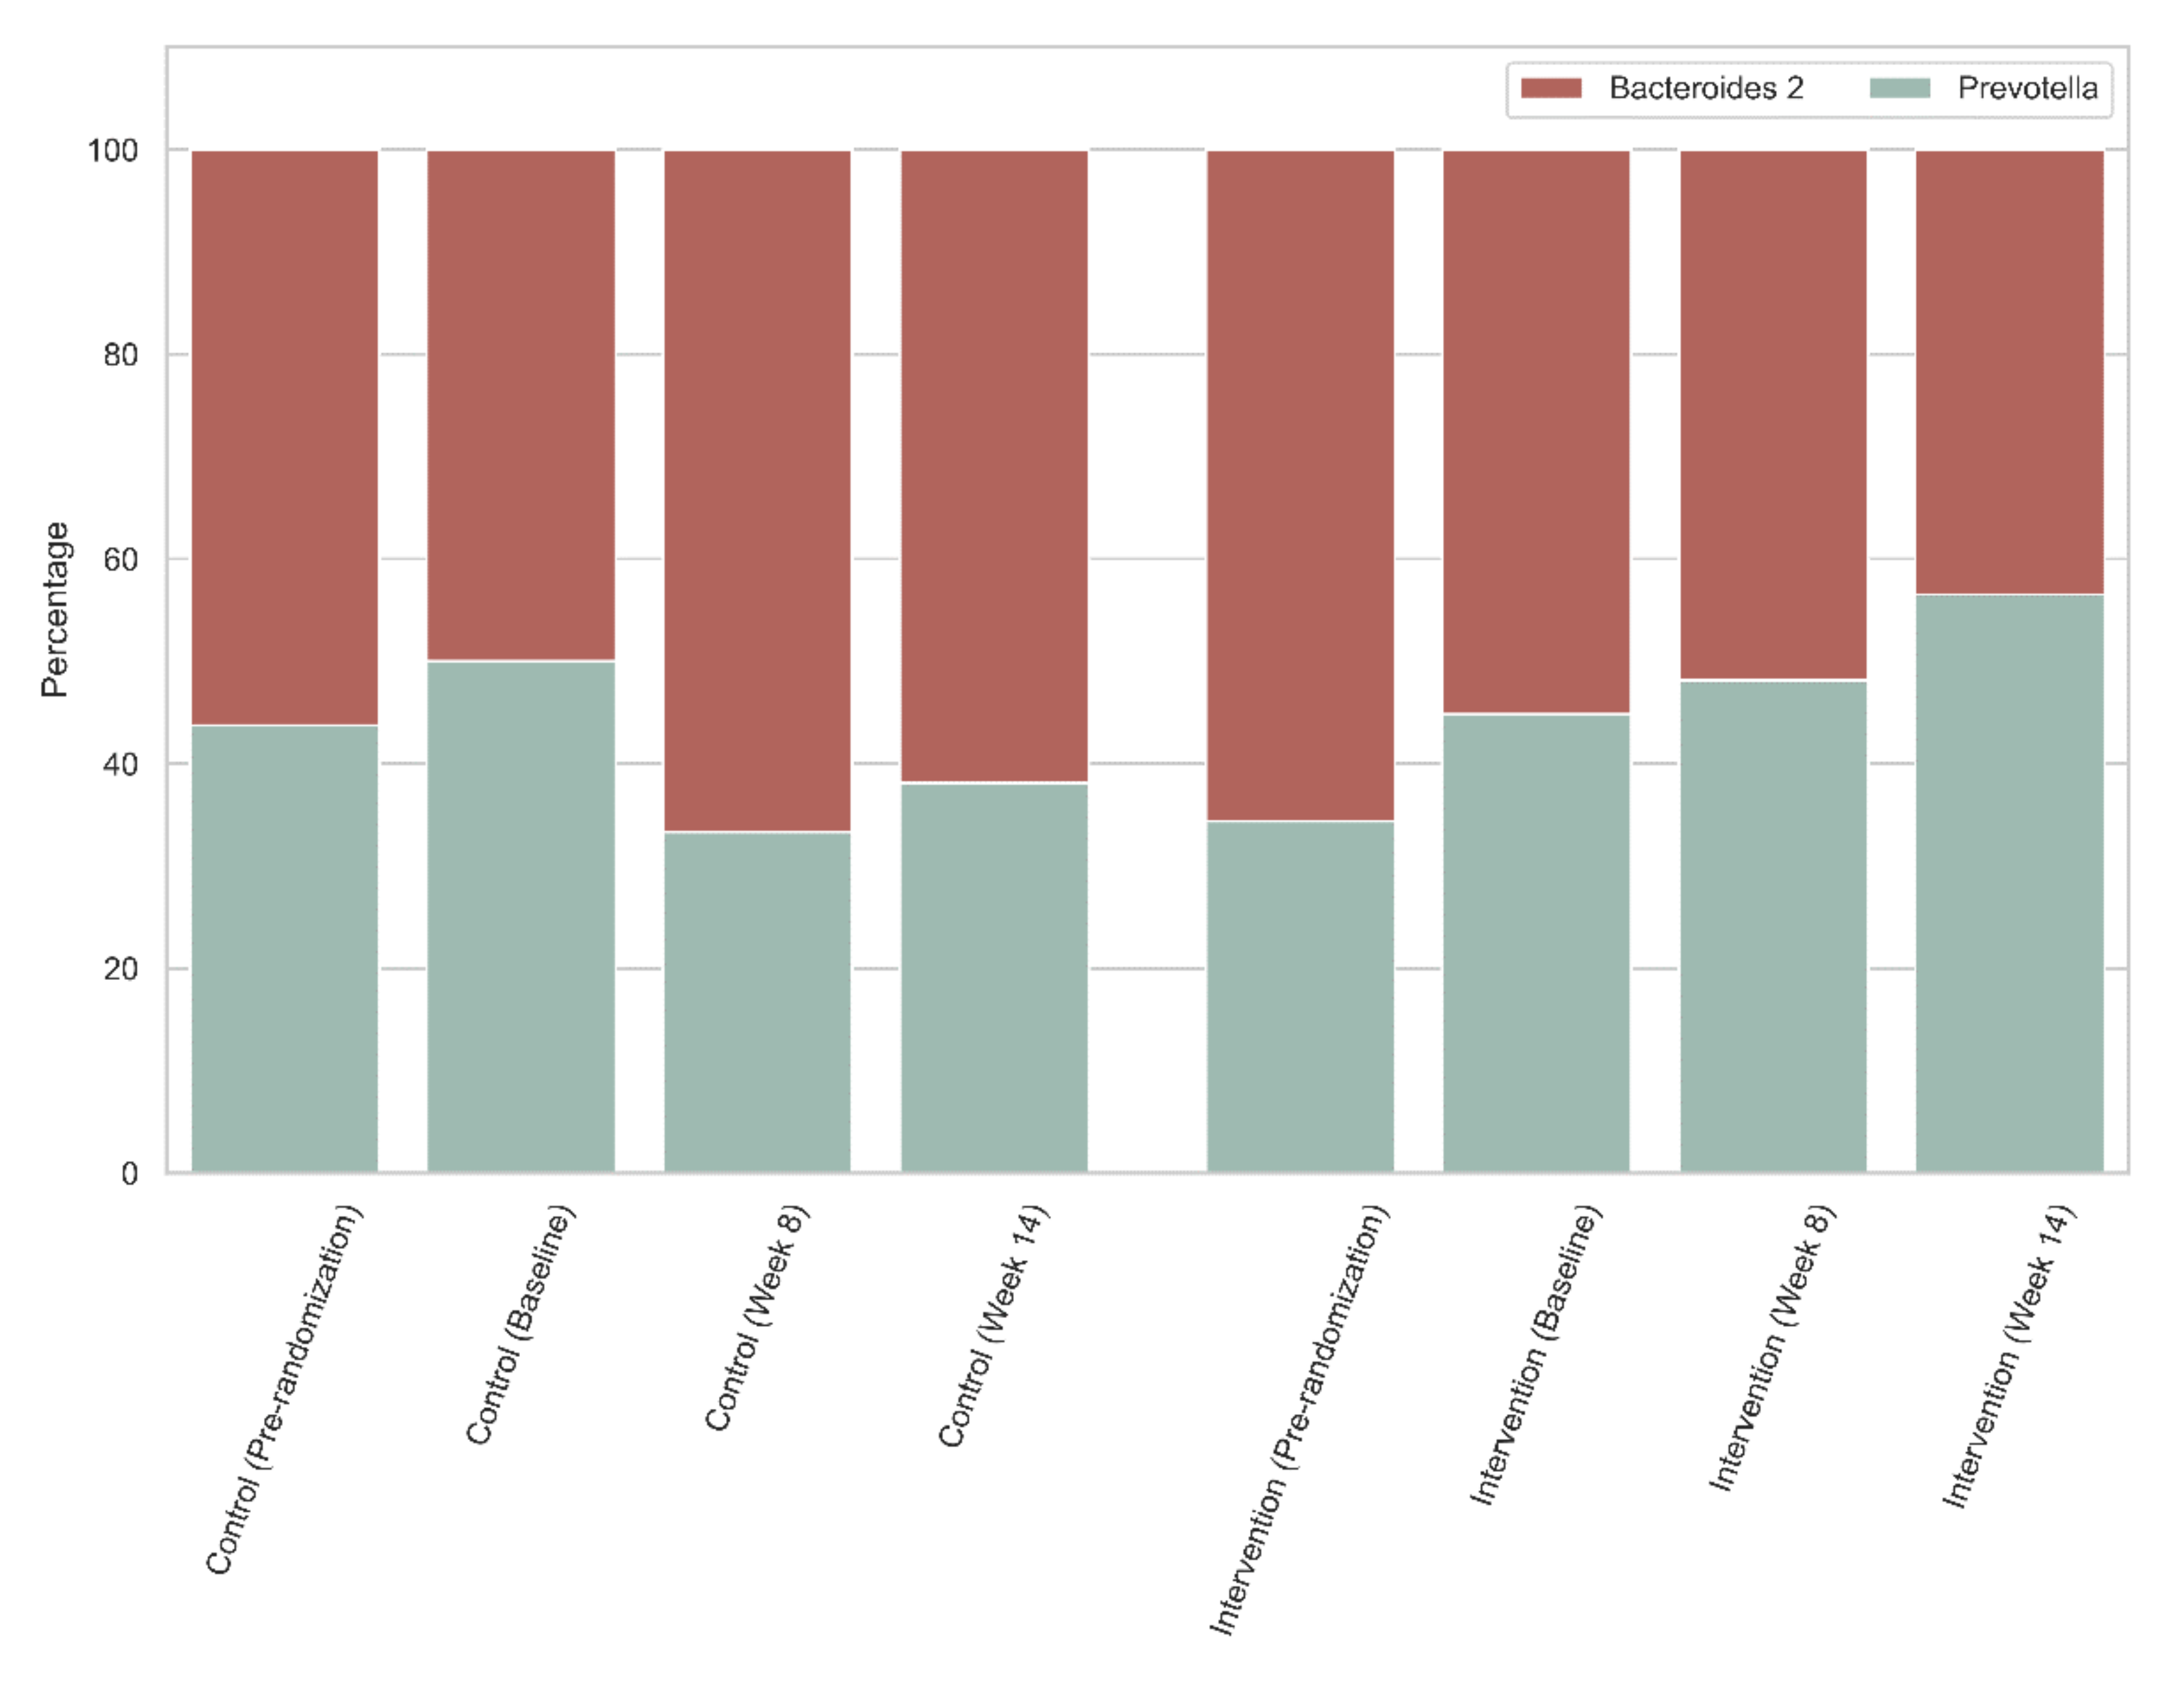
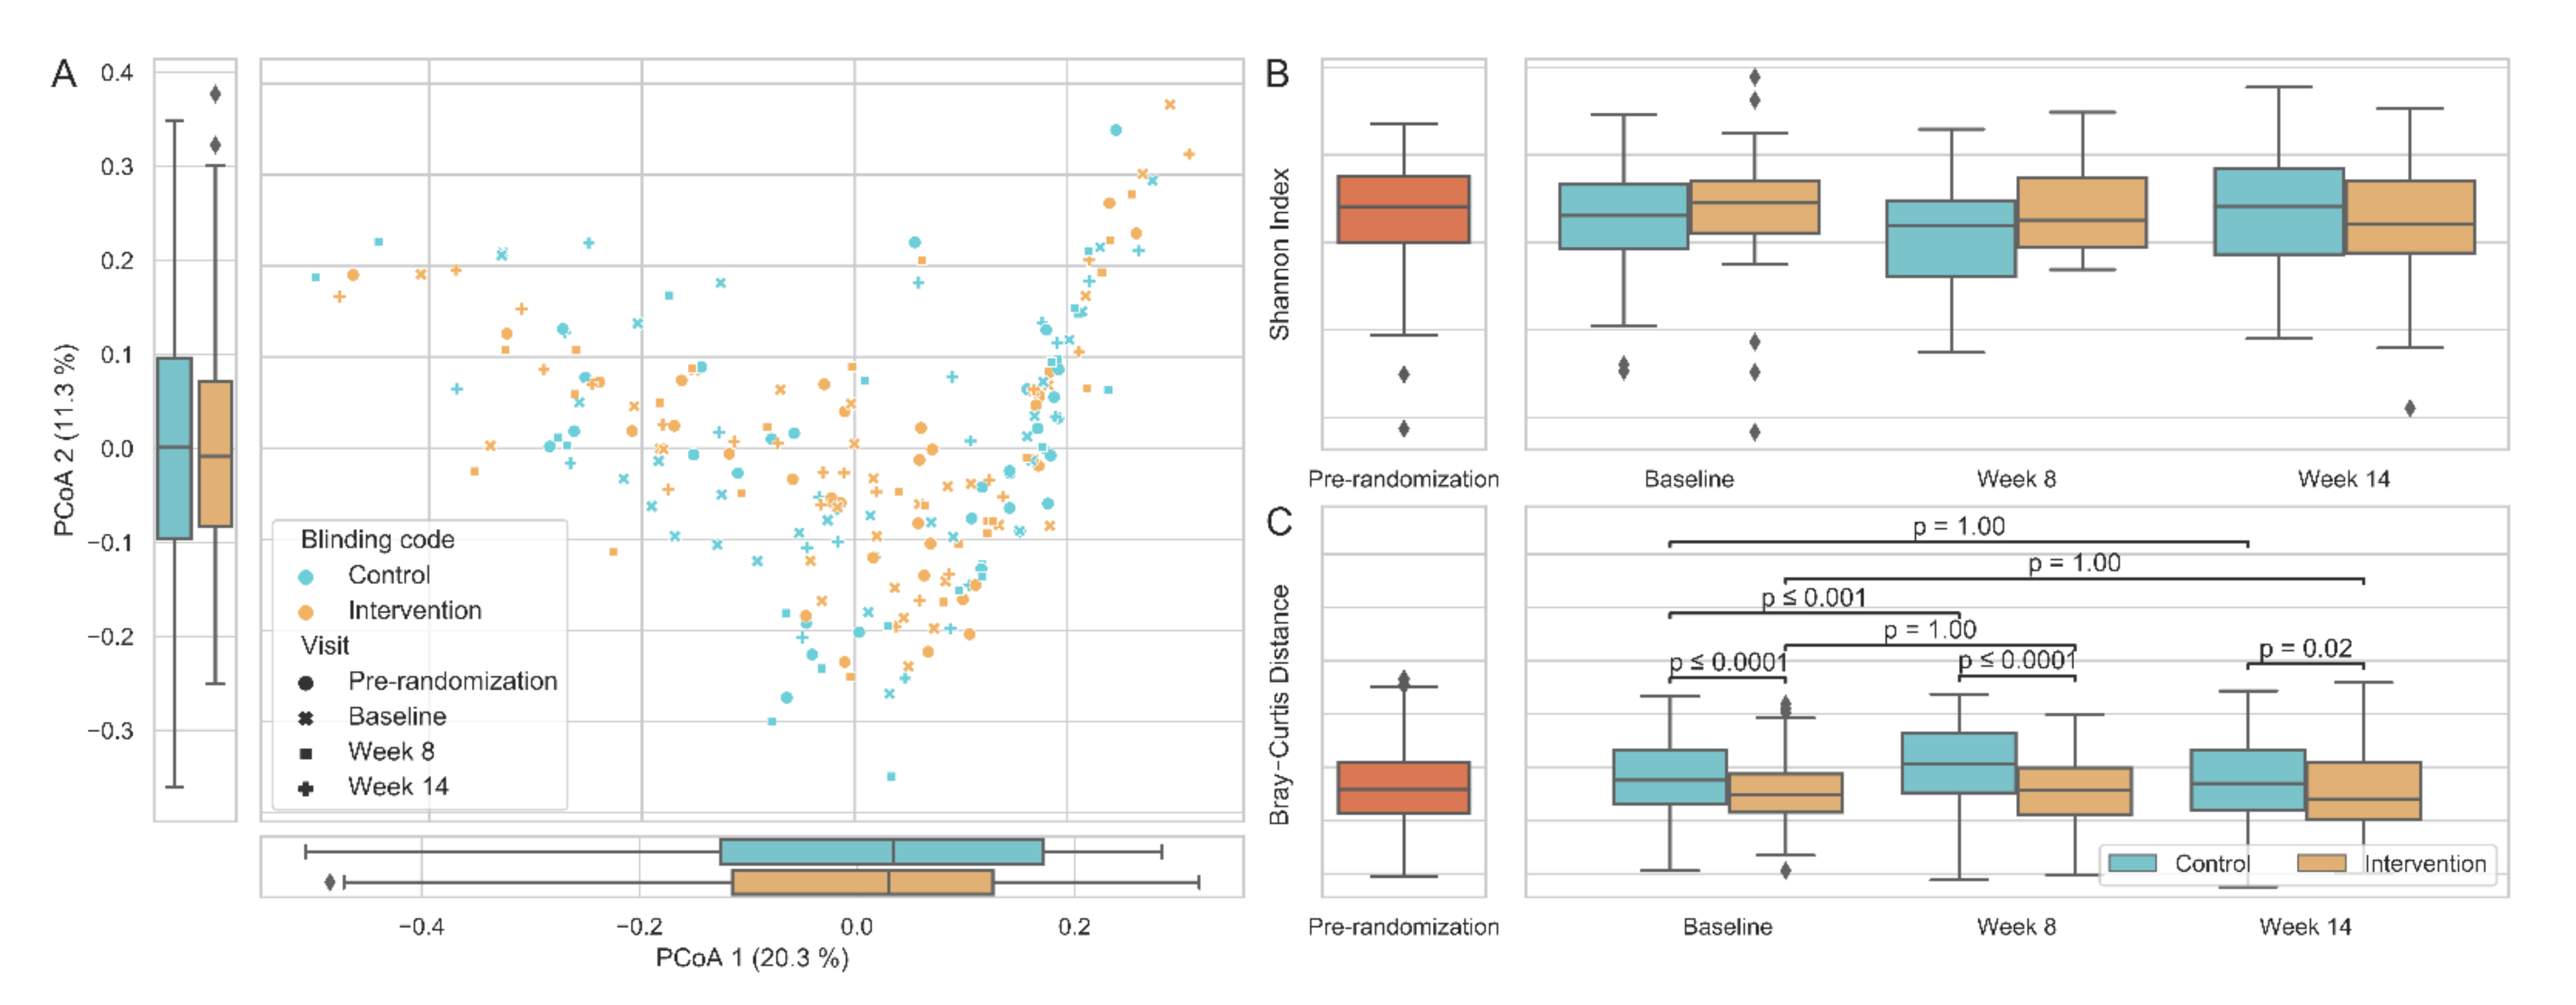
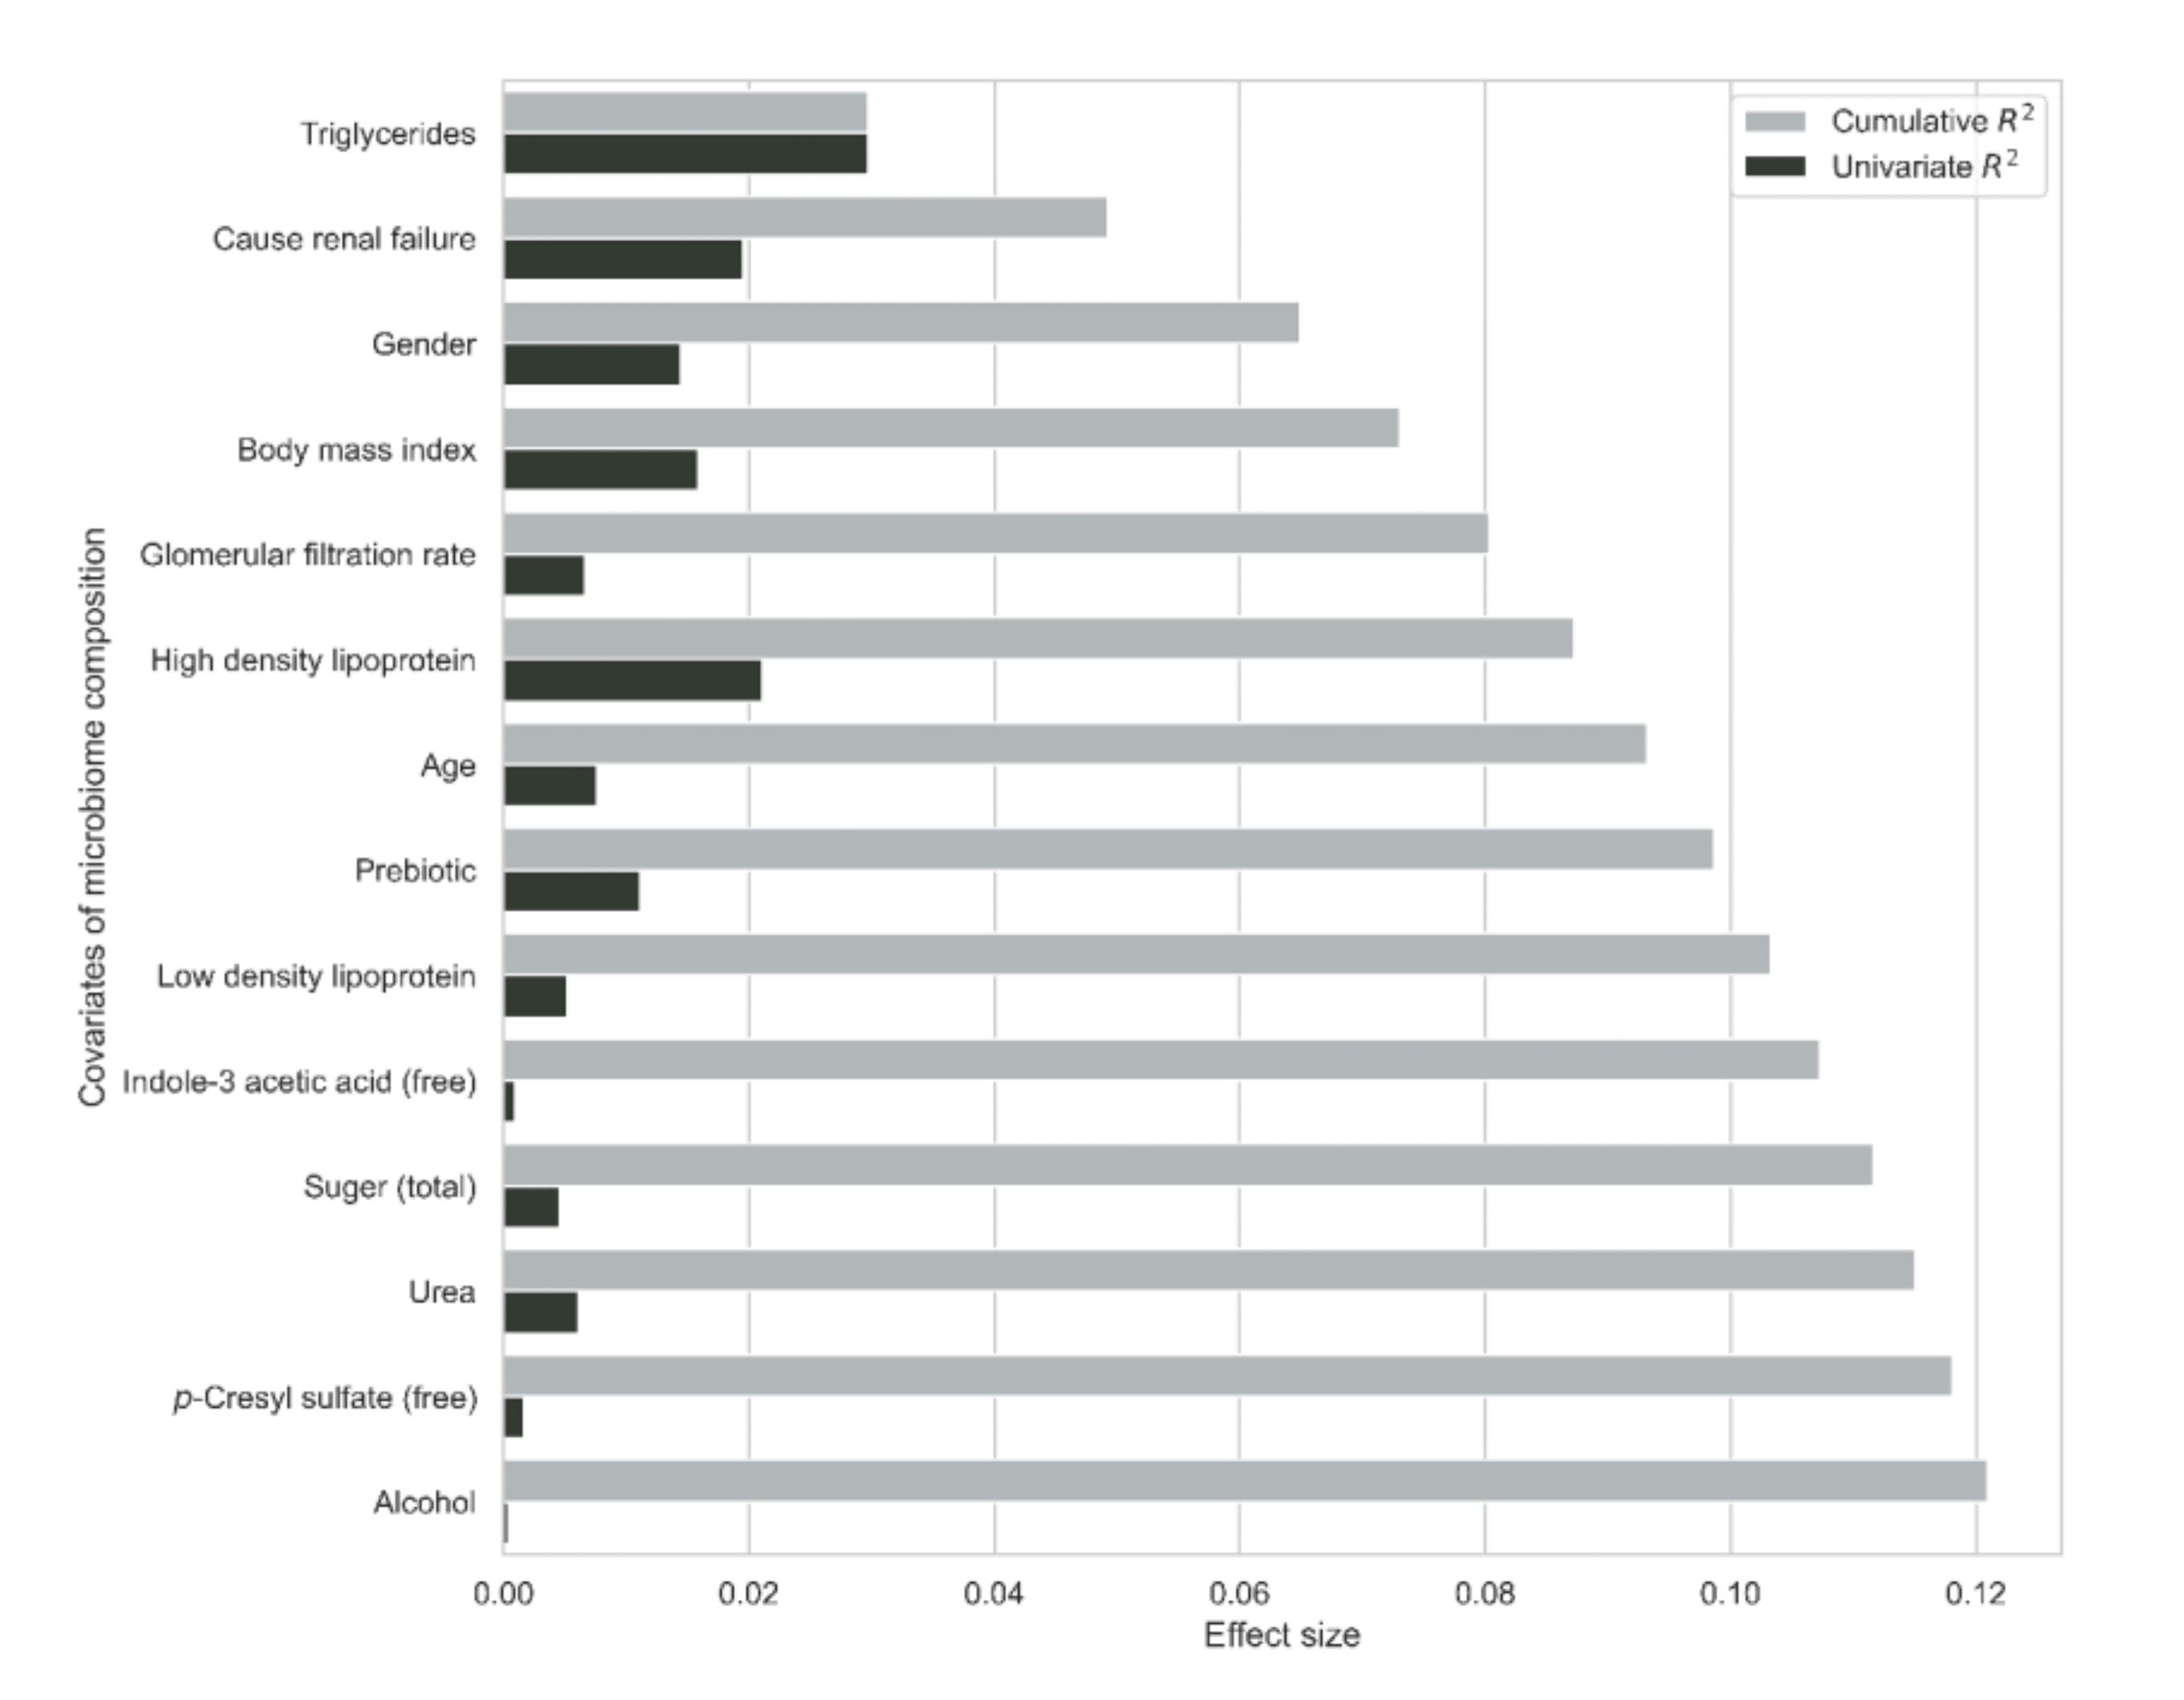
3.6. Gut Microbiome
4. Discussion
4.1. Strengths of the Study
4.2. Limitations of the Study
4.3. Recommendations
5. Conclusions
Supplementary Materials
Author Contributions
Funding
Institutional Review Board Statement
Informed Consent Statement
Data Availability Statement
Acknowledgments
Conflicts of Interest
References
- Bikbov, B.; Purcell, C.A.; Levey, A.S.; Smith, M.; Abdoli, A.; Abebe, M.; Adebayo, O.M.; Afarideh, M.; Agarwal, S.K.; Agudelo-Botero, M.; et al. Global, regional, and national burden of chronic kidney disease, 1990–2017: A systematic analysis for the Global Burden of Disease Study 2017. Lancet 2020, 395, 709–733. [Google Scholar] [CrossRef] [Green Version]
- Hill, N.R.; Fatoba, S.T.; Oke, J.L.; Hirst, J.A.; O’Callaghan, C.A.; Lasserson, D.S.; Hobbs, F.D.R. Global Prevalence of Chronic Kidney Disease—A Systematic Review and Meta-Analysis. PLoS ONE 2016, 11, e0158765. [Google Scholar] [CrossRef] [Green Version]
- Perico, N.; Remuzzi, G. Chronic kidney disease in sub-Saharan Africa: A public health priority. Lancet Glob. Health 2014, 2, e124–e125. [Google Scholar] [CrossRef] [Green Version]
- Arogundade, F.A.; Omotoso, B.A.; Adelakun, A.; Bamikefa, T.; Ezeugonwa, R.; Omosule, B.; Sanusi, A.A.; Balogun, R.A. Burden of end-stage renal disease in sub-Saharan Africa. Clin. Nephrol. 2020, 93, 3–7. [Google Scholar] [CrossRef] [PubMed]
- Thompson, S.; James, M.; Wiebe, N.; Hemmelgarn, B.; Manns, B.; Klarenbach, S.; Tonelli, M. Cause of Death in Patients with Reduced Kidney Function. J. Am. Soc. Nephrol. 2015, 26, 2504–2511. [Google Scholar] [CrossRef] [PubMed]
- Kim, S.M.; Song, I.H. The clinical impact of gut microbiota in chronic kidney disease. Korean J. Intern. Med. 2020, 35, 1305–1316. [Google Scholar] [CrossRef]
- Fernandez-Prado, R.; Esteras, R.; Perez-Gomez, M.V.; Gracia-Iguacel, C.; Gonzalez-Parra, E.; Sanz, A.B.; Ortiz, A.; Sanchez-Niño, M.D. Nutrients Turned into Toxins: Microbiota Modulation of Nutrient Properties in Chronic Kidney Disease. Nutrients 2017, 9, 489. [Google Scholar] [CrossRef] [Green Version]
- Chen, Y.-Y.; Chen, D.-Q.; Chen, L.; Liu, J.-R.; Vaziri, N.D.; Guo, Y.; Zhao, Y.-Y. Microbiome–metabolome reveals the contribution of gut–kidney axis on kidney disease. J. Transl. Med. 2019, 17, 1–11. [Google Scholar] [CrossRef] [Green Version]
- Ramakrishna, B.S. Role of the Gut Microbiota in Human Nutrition and Metabolism. J. Gastroenterol. Hepatol. 2013, 28, 9–17. [Google Scholar] [CrossRef]
- Nallu, A.; Sharma, S.; Ramezani, A.; Muralidharan, J.; Raj, D. Gut Microbiome in Chronic Kidney Disease: Challenges and Opportunities. Transl. Res. 2017, 179, 24–37. [Google Scholar] [CrossRef] [Green Version]
- Vaziri, N.D.; Zhao, Y.Y.; Pahl, M.V. Altered Intestinal Microbial Flora and Impaired Epithelial Barrier Structure and Function in CKD: The Nature, Mechanisms, Consequences and Potential Treatment. Nephrol. Dial. Transplant. 2016, 31, 737–746. [Google Scholar] [CrossRef] [Green Version]
- Lau, W.L.; Kalantar-Zadeh, K.; Vaziri, N.D. The Gut as a Source of Inflammation in Chronic Kidney Disease. Nephron 2015, 130, 92–98. [Google Scholar] [CrossRef] [Green Version]
- Glorieux, G.; Gryp, T.; Perna, A. Gut-Derived Metabolites and Their Role in Immune Dysfunction in Chronic Kidney Disease. Toxins 2020, 12, 245. [Google Scholar] [CrossRef] [PubMed] [Green Version]
- Ito, S.; Yoshida, M. Protein-bound Uremic toxins: Protein-Bound Uremic Toxins: New Culprits of Cardiovascular Events in Chronic Kidney Disease Patients. Toxins 2014, 6, 665–678. [Google Scholar] [CrossRef] [PubMed] [Green Version]
- Leong, S.C.; Sirich, T.L. Indoxyl Sulfate-Review of Toxicity and Therapeutic Strategies. Toxins 2016, 8, 358. [Google Scholar] [CrossRef] [PubMed]
- Gryp, T.; Huys, G.R.B.; Joossens, M.; Van Biesen, W.; Glorieux, G.; Vaneechoutte, M. Isolation and Quantification of Uremic Toxin Precursor-Generating Gut Bacteria in Chronic Kidney Disease Patients. Int. J. Mol. Sci. 2020, 21, 1986. [Google Scholar] [CrossRef] [PubMed] [Green Version]
- Stanford, J.; Charlton, K.; Stefoska-Needham, A.; Ibrahim, R.; Lambert, L.T. The Gut Microbiota Profile of Adults with Kidney Disease and Kidney Stones: A Systematic Review of the Literature. BMC. Nephrol. 2020, 21, 1–23. [Google Scholar] [CrossRef] [PubMed]
- Vandeputte, D.; Kathagen, G.; D’hoe, K.; Vieira-Silva, l.; Valles-Colomer, M.; Sabino, J.; Wang, Y.; Tito, R.Y.; De Commer, L.; Darzi, Y.; et al. Quantitative Microbiome Profiling Links Gut Community Variation to Microbial Load. Nature 2017, 551, 507–511. [Google Scholar] [CrossRef]
- Vieira-Silva, S.; Sabino, J.; Valles-Colomer, M.; Falony, G.; Kathagen, G.; Caenepeel, C.; Cleynen, I.; van der Merwe, S.; Vermeire, S.; Raes, J. Quantitative Microbiome Profiling Disentangles Inflammation- and Bile Duct Obstruction-Associated Microbiota Alterations across PSC/IBD Diagnoses. Nat. Microbiol. 2019, 4, 1826–1831. [Google Scholar] [CrossRef]
- Vieira-Silva, S.; Falony, G.; Belda, E.; Nielsen, T.; Aron-Wisnewsky, J.; Chakaroun, R.; Forslund, S.F.; Assmann, K.; Valles-Colomer, M.; Nguyen, T.T.D.; et al. Statin Therapy Is Associated with Lower Prevalence of Gut Microbiota Dysbiosis. Nature 2020, 581, 310–315. [Google Scholar] [CrossRef]
- Valles-Colomer, M.; Falony, G.; Darzi, Y.; Tigchelaar, E.F.; Wang, J.; Tito, R.Y.; Schiweck, C.; Kurilshikov, A.; Joossens, M.; Wijmenga, C.; et al. The Neuroactive Potential of the Human Gut Microbiota in Quality of Life and Depression. Nat. Microbiol. 2019, 4, 623–632. [Google Scholar] [CrossRef]
- McFarlane, C.; Ramos, C.I.; Johnson, D.W.; Campbell, K.L. Prebiotic, Probiotic, and Synbiotic Supplementation in Chronic Kidney Disease: A Systematic Review And Meta-analysis. J. Ren. Nutr. 2019, 29, 209–220. [Google Scholar] [CrossRef] [Green Version]
- Connolly, M.L.; Tzounis, X.; Tuohy, K.M.; Lovegrove, J.A. Hypocholesterolemic and Prebiotic Effects of a Whole-Grain Oat-Based Granola Breakfast Cereal in a Cardio-Metabolic “At Risk” Population. Front. Microbiol. 2016, 7, 1–9. [Google Scholar] [CrossRef] [Green Version]
- Valeur, J.; Puaschitz, N.G.; Midtvedt, T.; Berstad, A. Oatmeal Porridge: Impact on Microflora-Associated Characteristics in Healthy Subjects. Br. J. Nutr. 2016, 115, 62–67. [Google Scholar] [CrossRef]
- Cosola, C.; De Angelis, M.; Rocchetti, M.T.; Montemurno, E.; Maranzano, V.; Dalfino, G.; Manno, M.; Zito, A.; Gesualdo, M.; Matteo, M.; et al. Beta-Glucans Supplementation Associates with Reduction in P-Cresyl Sulfate Levels and Improved Endothelial Vascular Reactivity in Healthy Individuals. PLoS ONE 2017, 12, 1–16. [Google Scholar] [CrossRef] [PubMed] [Green Version]
- Bouhnik, Y.; Attar, A.; Joly, F.; Riottot, M.; Dyard, F.; Flourié, B. Lactulose Ingestion Increases Faecal Bifidobacterial Counts: A Randomised Double-Blind Study in Healthy Humans. Eur. J. Clin. Nutr. 2004, 58, 462–466. [Google Scholar] [CrossRef]
- NHANES. Anthropometry procedures manual. Natl. Health Nutr. Examinatory Surv. 2007, 1–102. Available online: https://www.cdc.gov/nchs/data/nhanes/nhanes_07_08/manual_an.pdf (accessed on 8 August 2021).
- WHO. Body Mass Index. Available online: https://www.euro.who.int/en/health-topics/disease-prevention/nutrition/a-healthy-lifestyle/body-mass-index-bmi?source (accessed on 8 August 2021).
- Ebrahim, Z.; Glorieux, G.; Blaauw, R.; Moosa, M.R.M. Effect of Simplified Dietary Advice on Nutritional Status and Uremic Toxins in Chronic Kidney Disease Participants. S. Afr. J. Clin. Nutr. 2022, 1–9. [Google Scholar] [CrossRef]
- SAFOODS. SAMRC Food Composition Tables for South Africa, 5th ed.; South African Medical Research Council: Cape Town, South Africa, 2017; Available online: http://safoods.mrc.ac.za (accessed on 8 August 2021).
- Glorieux, G.; Vanholder, R.; Van Biesen, W.; Pletinck, A.; Schepers, E.; Neirynck, N.; Speeckaert, M.; De Bacquer, D.; Verbeke, F. Free p -cresyl Sulfate Shows the Highest Association with Cardiovascular Outcome in Chronic Kidney Disease. Nephrol. Dial. Transplant. 2021, 1–8. [Google Scholar] [CrossRef] [PubMed]
- Tito, R.Y.; Cypers, H.; Joossens, M.; Varkas, G.; Van Praet, L.; Glorieus, E.; Van den Bosch, F.; De Vos, M.; Raes, J.; Elewaut, D. Brief Report: Dialister as a Microbial Marker of Disease Activity in Spondyloarthritis. Arthritis Rheumatol. 2017, 69, 114–121. [Google Scholar] [CrossRef]
- Tito, R.Y.; Chaffron, S.; Caenepeel, C.; Lima-Mendez, G.; Wang, J.; Vieira-Silva, S.; Falony, G.; Hildebrand, F.; Darzi, Y.; Rymenans, L.; et al. Population-Level Analysis of Blastocystis Subtype Prevalence and Variation in the Human Gut Microbiota. Gut 2019, 68, 1180–1189. [Google Scholar] [CrossRef] [Green Version]
- Callahan, B.J.; Mcmurdie, P.J.; Han, A.W.; Johnson, A.J.A.; Holmes, S.P. Dada2: High Resolution Sample Inference from Illumina Amplicon Data. Nat. Methods 2016, 13, 581–583. [Google Scholar] [CrossRef] [PubMed] [Green Version]
- Hildebrand, F.; Tadeo, R.; Voigt, A.Y.; Bork, P.; Raes, J. LotuS: An Efficient and User-Friendly OTU Processing Pipeline. Microbiome 2014, 2, 1–7. [Google Scholar] [CrossRef] [Green Version]
- The Scikit-bio Development Team. A Bioinformatics Library for Data Scientists. Available online: http://scikit-bio.org (accessed on 10 August 2021).
- Pedregosa, F.; Varoquaux, G.; Gramfort, A.; Michel, V. Scikit Learn: Machine Learning in Python. J. Mach. Learn. Res. 2011, 12, 2825–2830. [Google Scholar] [CrossRef]
- Oksanen, J.; Blanchet, F.G.; Friendly, M.; Kindt, R.; Legendre, P.; McGlinn, D.; Minchin, P.R.; O’Hara, R.B.; Simpson, G.L. Vegan: Community Ecology Package; Version 2.5-6. 2019. Available online: https://CRAN.R-project.org/package=vegan (accessed on 10 August 2021).
- Fernandes, A.D.; Reid, J.N.S.; Macklaim, J.M.; McMurrough, T.A.; Edgell, D.R.; Gloor, G.B. Unifying the Analysis of High-Throughput Sequencing Datasets: Characterizing RNA-Seq, 16S RRNA Gene Sequencing and Selective Growth Experiments by Compositional Data Analysis. Microbiome 2014, 2, 1–13. [Google Scholar] [CrossRef] [Green Version]
- Tackmann, J.; Matias Rodrigues, J.F.; von Mering, C. Rapid Inference of Direct Interactions in Large-Scale Ecological Networks from Heterogeneous Microbial Sequencing Data. Cell Syst. 2019, 9, 286–296. [Google Scholar] [CrossRef] [Green Version]
- Falony, A.G.; Joossens, M.; Wang, J.; Darzi, Y. Population—Level Analysis of Gut Microbiome Variation. Science 2016, 352, 560–564. [Google Scholar] [CrossRef]
- Koppe, L.; Fouque, D. Microbiota and Prebiotics Modulation of Uremic Toxin Generation. Panminerva Med. 2017, 59, 173–187. [Google Scholar] [CrossRef] [PubMed]
- Yang, H.L.; Feng, P.; Xu, Y.; Hou, Y.Y.; Ojo, O.; Wang, X.H. The Role of Dietary Fiber Supplementation in Regulating Uremic Toxins in Patients With Chronic Kidney Disease: A Meta-Analysis of Randomized Controlled Trials. J. Ren. Nutr. 2021, 31, 438–447. [Google Scholar] [CrossRef] [PubMed]
- Chen, T.K.; Knicely, D.H.; Grams, M.E. Chronic Kidney Disease Diagnosis and Management: A Review. JAMA 2019, 322, 1294–1304. [Google Scholar] [CrossRef] [PubMed]
- Velasquez, M.T.; Centron, P.; Barrows, I.; Dwivedi, R.; Raj, D.S. Gut Microbiota and Cardiovascular Uremic Toxicities. Toxins 2018, 10, 287. [Google Scholar] [CrossRef] [PubMed] [Green Version]
- Mikolasevic, I.; Zutelija, M.; Mavrinac, V.; Orlic, L. Dyslipidemia in Patients with Chronic Kidney Disease: Etiology and Management. Int. J. Nephrol. Renovasc. Dis. 2017, 10, 36–45. [Google Scholar] [CrossRef] [PubMed] [Green Version]
- Vojinovic, D.; Radjabzadeh, D.; Kurilshikov, A.; Amin, N.; Wijmenga, C.; Franke, L.; Ikram, M.A.; Uitterlinden, A.G.; Zhernakova, A.; Fu, J.; et al. Relationship between Gut Microbiota and Circulating Metabolites in Population-Based Cohorts. Nat. Commun. 2019, 10, 1–7. [Google Scholar] [CrossRef] [PubMed] [Green Version]
- Evenepoel, P.; Meijers, B.K.I.; Bammens, B.R.M.; Verbeke, K. Uremic Toxins Originating from Colonic Microbial Metabolism. Kidney Int. 2009, 76, S12–S19. [Google Scholar] [CrossRef] [PubMed] [Green Version]
- Koppe, L.; Alix, P.M.; Croze, M.L.; Chambert, S.; Vanholder, R.; Glorieux, G.; Fouque, D.; Soulage, C.O. P-Cresyl Glucuronide Is a Major Metabolite of p-Cresol in Mouse: In Contrast to p-Cresyl Sulphate, p-Cresyl Glucuronide Fails to Promote Insulin Resistance. Nephrol. Dial. Transplant. 2017, 32, 2000–2009. [Google Scholar] [CrossRef]
- Poesen, R.; Evenepoel, P.; de Loor, H.; Kuypers, D.; Augustijns, P.; Meijers, B. Metabolism, Protein Binding, and Renal Clearance of Microbiota-Derived p-Cresol in Patients with CKD. Clin. J. Am. Soc. Nephrol. 2016, 11, 1136–1144. [Google Scholar] [CrossRef] [Green Version]
- Meijers, B.K.I.; De Preter, V.; Verbeke, K.; Vanrenterghem, Y.; Evenepoel, P. p-Cresyl Sulfate Serum Concentrations in Haemodialysis Patients are Reduced by the Prebiotic Oligofructose-enriched Inulin. Nephrol. Dial. Transplant. 2010, 25, 219–224. [Google Scholar] [CrossRef] [PubMed] [Green Version]
- Rossi, M.; Johnson, D.W.; Morrison, M.; Pascoe, E.M.; Coombes, J.S.; Forbes, J.M.; Szeto, C.C.; McWhinney, B.C.; Ungerer, J.P.J.; Campbell, K.L. Synbiotics Easing Renal Failure by Improving Gut Microbiology (SYNERGY): A Randomized Trial. Clin. J. Am. Soc. Nephrol. 2016, 11, 223–231. [Google Scholar] [CrossRef]
- Guida, B.; Germanò, R.; Trio, R.; Russo, D.; Memoli, B.; Grumetto, L.; Barbato, F.; Cataldi, M. Effect of Short-Term Synbiotic Treatment on Plasma p-Cresol Levels in Patients with Chronic Renal Failure: A Randomized Clinical Trial. Nutr. Metab. Cardiovasc. Dis. 2014, 24, 1043–1049. [Google Scholar] [CrossRef]
- Lopes, R.D.C.S.O.; Theodoro, J.M.V.; da Silva, B.P.; Queiroz, V.A.V.; de Castro Moreira, M.E.; Mantovani, H.C.; Hermsdorff, H.H.; Martino, H.S.D. Synbiotic Meal Decreases Uremic Toxins in Hemodialysis Individuals: A Placebo-Controlled Trial. Food Res. Int. 2019, 116, 241–248. [Google Scholar] [CrossRef] [Green Version]
- Wu, M.; Cai, X.; Lin, J.; Zhang, X.; Scott, E.M.; Li, X. Association between Fibre Intake and Indoxyl Sulphate/P-Cresyl Sulphate in Patients with Chronic Kidney Disease: Meta-Analysis and Systematic Review of Experimental Studies. Clin. Nutr. 2019, 38, 2016–2022. [Google Scholar] [CrossRef]
- Stanford, J.; Charlton, K.; Stefoska-Needham, A.; Zheng, H.; Bird, L.; Borst, A.; Fuller, A.; Lambert, K. Associations Among Plant-Based Diet Quality, Uremic Toxins, and Gut Microbiota Profile in Adults Undergoing Hemodialysis Therapy. J. Ren. Nutr. 2020, 31, 177–188. [Google Scholar] [CrossRef] [PubMed]
- Li, F.; Wang, M.; Wang, J.; Li, R.; Zhang, Y. Alterations to the Gut Microbiota and Their Correlation With Inflammatory Factors in Chronic Kidney Disease. Front. Cell. Infect. Microbiol. 2019, 9, 206. [Google Scholar] [CrossRef] [PubMed] [Green Version]
- Mazidi, M.; Shekoohi, N.; Covic, A.; Mikhailidis, D.P. Role of Anaerostipes Spp. on Renal Function: Insights from a Mendelian Randomization Analysis. Nutrients 2020, 12, 2216. [Google Scholar] [CrossRef]
- Giri., S.; Mangalam, A. The Gut Microbiome and Metabolome in Multiple Sclerosis. In Microbiome and Metabolome in Diagnosis, Therapy and Other Strategic Applications; Faintuch, J., Faintuch, S., Eds.; Academic Press: London, UK, 2019; pp. 333–340. [Google Scholar]
- Sufiawati, I.; Lefaan, Y.F.M. Peptococcus Sp. Associated with Necrotizing Ulcerative Gingivitis in a Child with Leukemia Undergoing Chemotherapy: A Case Report. Int. J. Med. Dent. Case Rep. 2021, 10, 1–4. [Google Scholar] [CrossRef]
- Satokari, R. High Intake of Sugar and the Balance between Pro-and Anti-Inflammatory Gut Bacteria. Nutrients 2020, 12, 1348. [Google Scholar] [CrossRef]
- Simpson, H.L.; Campbell, B.J. Review Article: Dietary Fibre-Microbiota Interactions. Aliment. Pharmacol. Ther. 2015, 42, 158–179. [Google Scholar] [CrossRef] [PubMed] [Green Version]
- Dahl, W.J.; Rivero Mendoza, D.; Lambert, J.M. Diet, Nutrients and the Microbiome. Prog. Mol. Biol. Transl. Sci. 2020, 171, 237–263. [Google Scholar] [CrossRef] [PubMed]
- Tayebi-Khosroshahi, H.; Habibzadeh, A.; Niknafs, B.; Ghotaslou, R.; Yeganeh Sefidan, F.; Ghojazadeh, M.; Moghaddaszadeh, M.; Parkhide, S. The Effect of Lactulose Supplementation on Fecal Microflora of Patients with Chronic Kidney Disease: A Randomized Clinical Trial. J. Ren. Inj. Prev. 2016, 5, 162–167. [Google Scholar] [CrossRef] [Green Version]
- Sampaio-Maia, B.; Simões-Silva, L.; Pestana, M.; Araujo, R.; Soares-Silva, I.J. The Role of the Gut Microbiome on Chronic Kidney Disease. Adv. Appl. Microbiol. 2016, 96, 65–94. [Google Scholar] [CrossRef]
- Wang, Y.; Ames, N.P.; Tun, H.M.; Tosh, S.M.; Jones, P.J.; Khafipour, E. High Molecular Weight Barley β-Glucan Alters Gut Microbiota toward Reduced Cardiovascular Disease Risk. Front. Microbiol. 2016, 7, 1–15. [Google Scholar] [CrossRef] [Green Version]
- Vandeputte, D.; Falony, G.; Vieira-Silva, S.; Tito, R.Y.; Joossens, M.; Raes, J. Stool Consistency Is Strongly Associated with Gut Microbiota Richness and Composition, Enterotypes and Bacterial Growth Rates. Gut 2016, 65, 57–62. [Google Scholar] [CrossRef] [Green Version]
- Herrington, W.G.; Smith, M.; Bankhead, C.; Matsushita, K.; Stevens, S.; Holt, T.; Hobbs, F.D.R.; Coresh, J.; Woodward, M. Body-Mass Index and Risk of Advanced Chronic Kidney Disease: Prospective Analyses from a Primary Care Cohort of 1.4 Million Adults in England. PLoS ONE 2017, 12, 1–15. [Google Scholar] [CrossRef]
- Angelakis, E.; Armougom, F.; Million, M.; Raoult, D. The Relationship between Gut Microbiota and Weight Gain in Humans. Future Microbiol. 2012, 7, 91–109. [Google Scholar] [CrossRef] [PubMed]
- Zeng, Q.; Li, D.; He, Y.; Li, Y.; Yang, Z.; Zhao, X.; Liu, Y.; Wang, Y.; Sun, J.; Feng, X. Discrepant Gut Microbiota Markers for the Classification of Obesity-Related Metabolic Abnormalities. Sci. Rep. 2019, 9, 1–10. [Google Scholar] [CrossRef] [PubMed] [Green Version]
- Kaddurah-Daouk, R.; Baillie, R.A.; Zhu, H.; Zeng, Z.B.; Wiest, M.M.; Nguyen, U.T.; Wojnoonski, K.; Watkins, S.M.; Trupp, M.; Krauss, R.M. Enteric Microbiome Metabolites Correlate with Response to Simvastatin Treatment. PLoS ONE 2011, 6, 1–10. [Google Scholar] [CrossRef] [Green Version]
- Kakiyama, G.; Pandak, M.; Gillevet, P.M.; Hylemon, P.B.; Heuman, D.M.; Daita, K.; Takei, H.; Muto, A.; Nittono, H.; Ridlon, J.M.; et al. Modulation of the Fecal Bile Acid Profile by Gut Microbiota in Cirrhosis. J. Hepatol. 2014, 58, 949–955. [Google Scholar] [CrossRef] [Green Version]
- Urdaneta, V.; Casadesús, J. Interactions between Bacteria and Bile Salts in the Gastrointestinal and Hepatobiliary Tracts. Front. Med. 2017, 4, 1–13. [Google Scholar] [CrossRef] [PubMed]
- Joyce, S.A.; Kamil, A.; Fleige, L.; Gahan, C.G.M. The Cholesterol-Lowering Effect of Oats and Oat Beta Glucan: Modes of Action and Potential Role of Bile Acids and the Microbiome. Front. Nutr. 2019, 6, 1–15. [Google Scholar] [CrossRef] [PubMed]


| Total (N = 59) | Intervention Group (N = 30) | Control Group (N = 29) | p Value | ||
|---|---|---|---|---|---|
| Age (years) (mean) | 41.0 ± 11.6 | 40.6 ± 11.4 | 41.3 ± 12.0 | 0.082 | |
| Socio-demographics | N(%) | N(%) | N(%) | ||
| Sex | Male | 25 (42.4) | 11 (44) | 14(56) | 0.367 |
| Female | 34 (57.6) | 19 (55.6) | 15 (44.1) | ||
| Income (/month) | $0−$126 | 24 (40.7) | 10 (41.6) | 14 (58.3) | 0.332 |
| $127–$316 | 16 (27.1) | 7 (43.8) | 9 (56.2) | ||
| $317–$633 | 13 (22.0) | 8 (61.5) | 5 (38.4) | ||
| $634–$949 | 4 (6.8) | 3 (75.0) | 1 (25.0) | ||
| >$949 | 2 (3.4) | 2 (100.0) | 0 | ||
| Employment | Employed | 29 (49.2) | 17 (58.6) | 12 (41.3) | 0.240 |
| Unemployed | 30 (50.8) | 13 (43.3) | 17 (56.6) | ||
| Clinical data | N (%) | N (%) | N (%) | ||
| Cause of kidney failure | Polycystic kidneys | 3 (5.1) | 1 (33.3) | 2 (66.6) | |
| Hypertension | 29 (49.2) | 13 (44.8) | 16 (55.2) | 0.456 | |
| Glomerular disease | 13 (22.0) | 9 (69.2) | 4 (30.7) | ||
| Other | 14 (23.7) | 7 (50.0) | 7 (50.0) | ||
| GFR categories (mL/min/1.73 m2) | 30–59 Stage 3 | 19 (32.2) | 9 (47.3) | 10 (52.6) | 0.867 |
| 15–29 Stage 4 | 16 (27.1) | 9 (56.2) | 7 (43.8) | ||
| <15 Stage 5 | 24 (40.7) | 12 (50.0) | 12 (50.0) | ||
| Median Interquartile range (IQR) | Median (IQR) | Median (IQR) | |||
| Blood pressure | Systolic (mmHg) | 142.0 (128.3, 168,3) | 145.0 (134.0, 170.0) | 140.0 (136.0, 147.0) | 0.549 |
| Diastolic (mmHg) | 80.0 (72.0, 92.8) | 82.0 (72.0, 93.0) | 80.0 (78.0, 91.0) | 0.765 | |
| Anthropometry | Mean ± standard deviation (SD) | Mean ± SD | Mean ± SD | ||
| Weight (kg) | 75.7 ± 20.7 | 73.5 ± 18.5 | 78 ± 22.9 | 0.461 | |
| BMI (kg/m2) | 28.3 ± 6.6 | 27.4 ± 6.2 | 29.2 ± 6.99 | 0.300 | |
| Waist circumference (cm) | 89.6 ± 15.0 | 86.9 ± 13.1 | 92.4 ± 16.5 | 0.161 | |
| MUAC (cm) | 30.2 ± 5.1 | 29.8 ± 5.2 | 30.7 ± 5.1 | 0.527 | |
| N (%) | N (%) | N (%) | |||
| BMI categories | Underweight | 3 (5.0) | 2 (6.7) | 1 (3.4) | 0.791 |
| Normal weight | 16 (27.1) | 10 (62.5) | 6 (37.5) | ||
| Overweight | 19 (32.2) | 8 (42.1) | 11 (57.9) | ||
| Obese | 21 (35.5) | 10 (47.6) | 11 (52.3) | ||
| Total (N = 59) | Intervention Group (N = 30) | Control Group (N = 29) | p Value | |
|---|---|---|---|---|
| Biochemistry | Median (IQR) | Median (IQR) | Median (IQR) | |
| Urea (mmol/L) | 14.2 (9.1, 28.6) | 14.4 (11.5, 21.0) | 14.1 (10.9, 28.1), | 0.952 |
| Creatinine (mmol/L) | 232.0 (175.0, 461.0) | 230.0 (208.0, 53.0) | 308.0 (187.0, 33.0) | 0.921 |
| GFR (mL/min.1.73) m2 | 20.0 (11.0, 35.0) | 21.0 (13.0, 27.0) | 19.0 (11.0, 35.0) | 0.976 |
| Potassium (mmol/L) | 5.0 ± 0.7 | 4.9 ± 0.8 | 5.0 ± 0.7 | 0.509 |
| Phosphate (mmol/L) | 1.16 (1.0, 1.5) | 1.2 (1.1, 1.4) | 1.1 (1.0, 1.5) | 0.844 |
| Cholesterol (mmol/L) | 4.7 ± 1.1 | 4.7 ± 1.1 | 4.8 ± 1.2 | 0.958 |
| LDL (mmol/L) | 2.6 ± 1.0 | 2.6 ± 0.8 | 2.6 ± 1.1 | 0.859 |
| HDL (mmol/L) | 1.1 (0.9, 1.3) | 1.2 (1.1, 1.4) | 1.0 (0.9, 1.1) | 0.032 |
| Triglycerides (mmol/L) | 1.6 (1.2, 2.4) | 1.4 (1.2, 1.9) | 1.9 (1.4, 2.6) | 0.079 |
| CRP (mg/L) | 4.0 (2.0, 8.0) | 5.0 (2.0, 8.0) | 3.0 (2.0, 5.0) | 0.760 |
| Uremic toxins | Median (IQR) | Median (IQR) | Median (IQR) | |
| Total IxS (mg/L) | 3.96 (1.55, 10.27) | 3.44 (2.01, 4.93) | 5.28 (2.84, 8.32) | 0.533 |
| Free IxS (mg/L) | 0.10 (0.03, 0.26) | 0.06 (0.06, 0.14) | 0.13 (0.64, 0.22) | 0.724 |
| Total pCS (mg/L) | 5.69 (2.86, 10.37) | 5.08 (4.20, 7.12) | 5.81 (4.09, 7.24) | 0.840 |
| Free pCS (mg/L) | 0.14 (0.06, 0.30) | 0.14 (0.09, 0.28) | 0.14 (0.67, 0.19) | 0.391 |
| Total pCG (mg/L) | 0.10 (0.03, 0.26) | 0.11 (0.03, 0.21) | 0.10 (0.04, 0.17) | 0.920 |
| Free pCG (mg/L) | 0.09 (0.02, 0.20) | 0.10 (0.03, 0.18) | 0.09 (0.03, 0.15) | 0.933 |
| Total IAA (mg/L) | 0.80 (0.49, 1.33) | 0.66 (0.55, 1.12) | 0.92 (0.70, 1.06) | 0.662 |
| Free IAA (mg/L) | 0.12 (0.09, 0.25) | 0.11 (0.10, 0.24) | 0.14 (0.11, 0.23) | 0.906 |
| Dietary intake | Median (IQR) Mean ± SD | Median (IQR) Mean ± SD | Median (IQR) Mean ± SD | |
| Energy (kcal) | 5710 (4480.0, 6982.0) | 5685.6 (5149.9, 6662.1) | 5955.52 (4528.0, 6704.8) | 0.773 |
| Protein (g) | 51.9 ± 20.5 | 54.3 ± 17.0 | 49.5 ± 23.7 | 0.085 |
| Plant protein (g) | 16.6 (14.0, 21.1) | 16.7 (15.1, 19.5) | 15.6 (14.5,20.7) | 0.544 |
| Animal protein (g) | 32.5 ± 14.5 | 34.5 ± 12.0 | 30.3 ± 16.6 | 0.127 |
| Total sugar (g) | 61.5 ± 23 | 60.3 ± 21.5 | 62.6 ± 24.7 | 0.298 |
| Fiber (g) | 17.6 (14.1, 21.3) | 17.6 (16.9, 19.9) | 16.2 (14.1, 20.5) | 0.448 |
| Fat intake (g) | 50 (35.1, 60.8) | 47.7 (40.5, 53.7) | 50.3 (38.4, 55.4) | 0.785 |
| Saturated fat (g) | 13.05 (9.6,18.8) | 13.1 (11.7, 17.0) | 13.1 (9.4, 15.4) | 0.371 |
| Trans fat (g) | 0.3 (0.1,0.6) | 0.3 (0.2, 0.5) | 0.3 (0.2, 0.6) | 0.844 |
| Potassium (mg) | 1923.0 (1553.5, 2405.4) | 2048.9 (1751.9, 2338.6) | 1774.5 (1564.4, 2267.7) | 0.396 |
| Phosphate (mg) | 735.6 (523.0, 939.7) | 767.8 (638.6, 865.3) | 581.3 (521.4, 848.4) | 0.102 |
| Sodium (mg) | 1829.23 (1290.4, 2584.8) | 1999.3 (1666.6, 2435.5) | 1803.8 (1186.5, 2090.0) | 0.907 |
| Model 1 Outcome: Urea | Model 2 Outcome: Creatinine | Model 3 Outcome: eGFR | |||||||
|---|---|---|---|---|---|---|---|---|---|
| Parameter | Exp (b) | 95% CI | p | Exp (b) | 95% CI | p | Exp (b) | 95% CI * | p |
| [Intervention group] | 0.93 | 0.66–1.30 | 0.669 | 0.92 | 0.63–0.35 | 0.625 | 0.97 | 0.66–1.43 | 0.869 |
| [week 8] | 1.05 | 0.92–1.19 | 0.479 | 1.02 | 0.94–1.10 | 0.613 | 1.02 | 0.93–1.12 | 0.710 |
| [week 14] | 1.01 | 0.88–1.16 | 0.850 | 1.01 | 0.89–1.14 | 0.891 | 1.02 | 0.93–1.12 | 0.636 |
| [Intervention group] * [week 8] | 1.14 | 0.98–1.33 | 0.092 | 1.12 | 0.97–1.28 | 0.118 | 0.95 | 0.84–1.06 | 0.244 |
| [Intervention group] * [week 14] | 1.06 | 0.90–1.25 | 0.514 | 1.03 | 0.87–1.22 | 0.718 | 0.93 | 0.81–1.05 | 0.340 |
| Model 4: Outcome: Total Cholesterol | Model 5 Outcome: LDL Cholesterol | Model 6 Outcome: HDL | Model 7 Outcome: TG | |||||||||
|---|---|---|---|---|---|---|---|---|---|---|---|---|
| Parameter | Exp (b) | 95% CI | p | Exp (b) | 95% CI | p | Exp (b) | 95% CI | p | Exp (b) | 95% CI | p |
| [Intervention group] | 0.98 | 0.88–1.12 | 0.997 | 1.01 | 0.84–1.24 | 0.856 | 1.25 | 1.02–1.54 | 0.031 | 0.69 | 0.50–0.95 | 0.694 |
| [week 8] | 1.02 | 0.96–1.08 | 0.476 | 1.07 | 0.97–1.17 | 0.170 | 1.07 | 1.02–1.13 | 0.010 | 0.86 | 0.75–1.00 | 0.057 |
| [week 14] | 0.98 | 0.91–1.05 | 0.594 | 1.00 | 0.88–1.14 | 0.971 | 1.01 | 0.91–1.11 | 0.866 | 0.90 | 0.74–1.10 | 0.307 |
| [Intervention group] * [week 8] | 0.93 | 0.86–1.01 | 0.571 | 0.88 | 0.76–0.99 | 0.037 | 0.97 | 0.90–1.05 | 0.486 | 1.03 | 0.84–1.26 | 0.777 |
| [Intervention group] * [week 14] | 1.03 | 0.93–1.15 | 0.105 | 1.02 | 0.86–1.22 | 0.776 | 1.03 | 0.91–1.15 | 0.661 | 1.02 | 0.81–1283 | 0.858 |
| Model 1: Outcome: Total IxS | Model 2: Outcome: Free IxS | Model 3: Outcome: Total pCS | Model 4 Outcome: Free pCS | Model 5 Outcome: Total pCG | Model 6 Outcome: Free pCG | Model 7 Outcome: Total IAA | Model 8 Outcome: Free IAA | |||||||||||||||||
|---|---|---|---|---|---|---|---|---|---|---|---|---|---|---|---|---|---|---|---|---|---|---|---|---|
| Parameter | Exp (b) | 95% CI | p | Exp (b) | 95% CI | p | Exp (b) | 95% CI | p | Exp (b) | 95% CI | p | Exp (b) | 95% CI | p | Exp (b) | 95% CI | p | Exp (b) | 95% CI | p | Exp (b) | 95% CI | p |
| [Intervention group] | 0.88 | 0.47–1.62 | 0.674 | 1.78 | 0.65–0.09 | 0.264 | 1.16 | 0.76–1.78 | 0.479 | 1.61 | 0.77–3.40 | 0.208 | 3.40 | 0.86–13.5 | 0.081 | 0.34 | 0.84–1.44 | 0.087 | 1.06 | 0.65–1.74 | 0.798 | 1.72 | 0.77–0.86 | 0.185 |
| [week 8] | 1.08 | 0.95–1.24 | 0.211 | 1.14 | 0.93–1.40 | 0.211 | 0.87 | 0.83–1.20 | 0.968 | 1.06 | 0.82–1.38 | 0.630 | 0.77 | 0.35–1.87 | 0.508 | 0.35 | 0.12–0.98 | 0.045 | 1.13 | 1.00–1.28 | 0.050 | 1.13 | 0.96–1.33 | 0.148 |
| [week 14] | 1.09 | 0.96–1.21 | 0.227 | 1.06 | 0.84–1.33 | 0.591 | 1.00 | 0.68–1.11 | 0.258 | 0.83 | 0.61–1.12 | 0.277 | 1.14 | 0.77–1.69 | 0.530 | 0.16 | 0.09–0.29 | <0.001 | 1.04 | 0.86–1.26 | 0.655 | 1.03 | 0.84–1.27 | 0.749 |
| [Intervention group] * [week 8] | 0.97 | 0.71–1.31 | 0.863 | 0.46 | 0.28–0.76 | 0.003 | 1.09 | 0.85–1.36 | 0.952 | 0.96 | 0.72–1.28 | 0.772 | 0.51 | 0.15–1.75 | 0.286 | 0.45 | 0.12–1.69 | 0.241 | 1.08 | 0.86–1.35 | 0.515 | 0.83 | 0.50–1.36 | 0.449 |
| [Intervention group] * [week 14] | 0.93 | 0.68–1.26 | 0.622 | 0.35 | 0.21–0.60 | <0.001 | 0.99 | 0.74–1.32 | 0.547 | 0.48 | 0.29–0.82 | 0.006 | 0.14 | 0.08–0.28 | <0.001 | 0.13 | 0.06–0.27 | <0.001 | 1.03 | 0.81–1.31 | 0.797 | 0.56 | 0.31–1.00 | 0.051 |
| Variable | Genus | * Correlation Value |
|---|---|---|
| Urea | Bifidobacterium | −0.266 |
| Creatinine | Gemmiger | −0.177 |
| LDL cholesterol | Mogibacterium | −0.218 |
| HDL cholesterol | Prevotella | 0.202 |
| TG | Blautia | 0.197 |
| Clostridium_XlVa | 0.205 | |
| Acetanaerobacterium | 0.180 | |
| Weight | Dialister | 0.236 |
| Butyricicoccus | 0.234 | |
| BMI | Howardella | −0.182 |
| Total IxS | Ruminococcus2 | 0.211 |
| Bulleidia | −0.235 | |
| Total pCS | Faecalibacterium | −0.216 |
| Methanobrevibacter | 0.288 | |
| Desulfovibrio | 0.183 | |
| Peptococcus | 0.259 | |
| Free pCS | Escherichia/Shigella | 0.222 |
| Total IAA | Mogibacterium | 0.330 |
| Howardella | 0.301 |
Publisher’s Note: MDPI stays neutral with regard to jurisdictional claims in published maps and institutional affiliations. |
© 2022 by the authors. Licensee MDPI, Basel, Switzerland. This article is an open access article distributed under the terms and conditions of the Creative Commons Attribution (CC BY) license (https://creativecommons.org/licenses/by/4.0/).
Share and Cite
Ebrahim, Z.; Proost, S.; Tito, R.Y.; Raes, J.; Glorieux, G.; Moosa, M.R.; Blaauw, R. The Effect of ß-Glucan Prebiotic on Kidney Function, Uremic Toxins and Gut Microbiome in Stage 3 to 5 Chronic Kidney Disease (CKD) Predialysis Participants: A Randomized Controlled Trial. Nutrients 2022, 14, 805. https://doi.org/10.3390/nu14040805
Ebrahim Z, Proost S, Tito RY, Raes J, Glorieux G, Moosa MR, Blaauw R. The Effect of ß-Glucan Prebiotic on Kidney Function, Uremic Toxins and Gut Microbiome in Stage 3 to 5 Chronic Kidney Disease (CKD) Predialysis Participants: A Randomized Controlled Trial. Nutrients. 2022; 14(4):805. https://doi.org/10.3390/nu14040805
Chicago/Turabian StyleEbrahim, Zarina, Sebastian Proost, Raul Yhossef Tito, Jeroen Raes, Griet Glorieux, Mohammed Rafique Moosa, and Renée Blaauw. 2022. "The Effect of ß-Glucan Prebiotic on Kidney Function, Uremic Toxins and Gut Microbiome in Stage 3 to 5 Chronic Kidney Disease (CKD) Predialysis Participants: A Randomized Controlled Trial" Nutrients 14, no. 4: 805. https://doi.org/10.3390/nu14040805