
Can Mild-to-Moderate Iodine Deficiency during Pregnancy Alter Thyroid Function? Lessons from a Mother–Newborn Cohort
 , ,
, ,
Abstract
:
1. Introduction
2. Materials and Methods
2.1. Participants, Settings, and Design
2.2. Data Collection
2.3. Assessment of Maternal Iodine Levels
2.4. Neonatal Birth Data and Iodine Measurements
2.5. Statistical Analysis
3. Results
3.1. Study Population
3.2. Maternal Characteristics by Iodine Status, Thyroid Function, and Pregnancy Outcomes
3.3. Neonatal Iodine Status, Outcomes, and Thyroid Function
4. Discussion
5. Conclusions
Author Contributions
Funding
Institutional Review Board Statement
Informed Consent Statement
Data Availability Statement
Acknowledgments
Conflicts of Interest
References
- Zimmermann, M.B. The Importance of Adequate Iodine during Pregnancy and Infancy. World Rev. Nutr. Diet. 2016, 115, 118–124. [Google Scholar] [CrossRef] [PubMed]
- Alexander, E.K.; Pearce, E.N.; Brent, G.A.; Brown, R.S.; Chen, H.; Dosiou, C.; Grobman, W.A.; Laurberg, P.; Lazarus, J.H.; Mandel, S.J.; et al. 2017 Guidelines of the American Thyroid Association for the Diagnosis and Management of Thyroid Disease During Pregnancy and the Postpartum. Thyroid 2017, 27, 315–389. [Google Scholar] [CrossRef] [PubMed] [Green Version]
- Ittermann, T.; Albrecht, D.; Arohonka, P.; Bilek, R.; de Castro, J.J.; Dahl, L.; Filipsson Nystrom, H.; Gaberscek, S.; Garcia-Fuentes, E.; Gheorghiu, M.L.; et al. Standardized Map of Iodine Status in Europe. Thyroid 2020, 30, 1346–1354. [Google Scholar] [CrossRef] [PubMed]
- Ovadia, Y.S.; Arbelle, J.E.; Gefel, D.; Brik, H.; Wolf, T.; Nadler, V.; Hunziker, S.; Zimmermann, M.B.; Troen, A.M. First Israeli National Iodine Survey Demonstrates Iodine Deficiency Among School-Aged Children and Pregnant Women. Thyroid 2017, 27, 1083–1091. [Google Scholar] [CrossRef]
- Perrine, C.G.; Herrick, K.A.; Gupta, P.M.; Caldwell, K.L. Iodine Status of Pregnant Women and Women of Reproductive Age in the United States. Thyroid 2019, 29, 153–154. [Google Scholar] [CrossRef]
- WHO. Assessment of Iodine Deficiency Disorders and Monitoring Their Elimination. A Guide for Programmed Managers, 3rd ed.; World Health Organization: Paris, France, 2007. [Google Scholar]
- Dineva, M.; Fishpool, H.; Rayman, M.P.; Mendis, J.; Bath, S.C. Systematic review and meta-analysis of the effects of iodine supplementation on thyroid function and child neurodevelopment in mildly-to-moderately iodine-deficient pregnant women. Am. J. Clin. Nutr. 2020, 112, 389–412. [Google Scholar] [CrossRef]
- Pearce, E.N.; Lazarus, J.H.; Moreno-Reyes, R.; Zimmermann, M.B. Consequences of iodine deficiency and excess in pregnant women: An overview of current knowns and unknowns. Am. J. Clin. Nutr. 2016, 104 (Suppl. S3), 918S–923S. [Google Scholar] [CrossRef] [Green Version]
- Bath, S.C. The effect of iodine deficiency during pregnancy on child development. Proc. Nutr. Soc. 2019, 78, 150–160. [Google Scholar] [CrossRef]
- Rosen, S.R.; Ovadia, Y.S.; Anteby, E.Y.; Fytlovich, S.; Aharoni, D.; Zamir, D.; Gefel, D.; Shenhav, S. Low intake of iodized salt and iodine containing supplements among pregnant women with apparently insufficient iodine status—Time to change policy? Isr. J. Health Policy Res. 2020, 9, 9. [Google Scholar] [CrossRef] [Green Version]
- Zimmermann, M.B.; Andersson, M. Assessment of iodine nutrition in populations: Past, present, and future. Nutr. Rev. 2012, 70, 553–570. [Google Scholar] [CrossRef]
- Barnett-Itzhaki, Z.; Ehrlich, D.; Troen, A.M.; Rorman, E.; Groismann, L.; Blaychfeld-Magnazi, M.; Endevelt, R.; Berman, T. Results of the national biomonitoring program show persistent iodine deficiency in Israel. Isr. J. Health Policy Res. 2022, 11, 18. [Google Scholar] [CrossRef] [PubMed]
- Zimmermann, M.B.; Andersson, M. GLOBAL ENDOCRINOLOGY: Global perspectives in endocrinology: Coverage of iodized salt programs and iodine status in 2020. Eur. J. Endocrinol. 2021, 185, R13–R21. [Google Scholar] [CrossRef] [PubMed]
- Patriota, E.S.O.; Lima, I.C.C.; Nilson, E.A.F.; Franceschini, S.C.C.; Gonçalves, V.S.S.; Pizato, N. Prevalence of insufficient iodine intake in pregnancy worldwide: A systematic review and meta-analysis. Eur. J. Clin. Nutr. 2022, 76, 703–715. [Google Scholar] [CrossRef]
- ICDC. MABAT: First Israeli National Health and Nutrition Survey 1999–2001; Food Nutrition Services, Israel Center for Disease Control, Ministry of Health: Ramat Gen, Israel, 2003. [Google Scholar]
- Condo, D.; Makrides, M.; Skeaff, S.; Zhou, S.J. Development and validation of an iodine-specific FFQ to estimate iodine intake in Australian pregnant women. Br. J. Nutr. 2015, 113, 944–952. [Google Scholar] [CrossRef] [PubMed]
- Ovadia, Y.S.; Gefel, D.; Turkot, S.; Aharoni, D.; Fytlovich, S.; Troen, A.M. Elevated Serum Thyroglobulin and Low Iodine Intake Are Associated with Nontoxic Nodular Goiter among Adults Living near the Eastern Mediterranean Coast. J. Thyroid Res. 2014, 2014, 913672. [Google Scholar] [CrossRef] [PubMed] [Green Version]
- Ovadia, Y.S.; Gefel, D.; Weizmann, N.; Raizman, M.; Goldsmith, R.; Mabjeesh, S.J.; Dahl, L.; Troen, A.M. Low Iodine Intake from Dairy Foods Despite High Milk Iodine Content in Israel. Thyroid 2018, 28, 1042–1051. [Google Scholar] [CrossRef] [PubMed]
- Agricultural Service of Israel and the Israeli Fish Breeders Association. Nutritional Composition of Fresh Water Fish; Agricultural Service of Israel and the Israeli Fish Breeders Association: Beit She’an, Israel, 2012. [Google Scholar]
- Ovadia, Y.S.; Gefel, D.; Aharoni, D.; Turkot, S.; Fytlovich, S.; Troen, A.M. Can desalinated seawater contribute to iodine-deficiency disorders? An observation and hypothesis. Public Health Nutr. 2016, 19, 2808–2817. [Google Scholar] [CrossRef] [Green Version]
- IOH. Standing Committee on the Scientific Evaluation of Dietary Reference Intakes; National Academy Press: Washington, DC, USA, 2001. [Google Scholar]
- Ma, Z.F.; Skeaff, S.A. Thyroglobulin as a biomarker of iodine deficiency: A review. Thyroid 2014, 24, 1195–1209. [Google Scholar] [CrossRef] [Green Version]
- Wortsman, J. Apparent isolated elevation of serum triiodothyronine level in a patient with a thyroid nodule. Arch. Intern. Med. 1988, 148, 1866–1868. [Google Scholar] [CrossRef]
- CDC. Laboratory Procedure Manual: Iodine in Urine. NHANES 2003–2004; Inorganic Toxicology and Nutrition Branch, Division of Laboratory Sciences, National Center for Environmental Health: Salt Lake City, UT, USA, 2007. [Google Scholar]
- Makhmudov, A.A.; Caldwell, K.L. The Challenge of Iodine Deficiency Disorder A Decade of CDC’s Ensuring the Quality of Urinary Iodine Procedures Program; Centers for Disease Control and Prevention, National Center for Environmental Health, Division of Laboratory Sciences: Atlanta, GA, USA, 2011. [Google Scholar]
- German External Quality Assessment Scheme For Analyses in Biological Materials. Available online: http://www.g-equas.de/ (accessed on 21 November 2022).
- Davidson, S.; Sokolover, N.; Erlich, A.; Litwin, A.; Linder, N.; Sirota, L. New and improved Israeli reference of birth weight, birth length, and head circumference by gestational age: A hospital-based study. Isr. Med. Assoc. J. 2008, 10, 130–134. [Google Scholar]
- Dollberg, S.; Haklai, Z.; Mimouni, F.B.; Gorfein, I.; Gordon, E.S. Birth weight standards in the live-born population in Israel. Isr. Med. Assoc. J. 2005, 7, 311–314. [Google Scholar] [PubMed]
- Abel, M.H.; Korevaar, T.I.M.; Erlund, I.; Villanger, G.D.; Caspersen, I.H.; Arohonka, P.; Alexander, J.; Meltzer, H.M.; Brantsaeter, A.L. Iodine Intake is Associated with Thyroid Function in Mild to Moderately Iodine Deficient Pregnant Women. Thyroid 2018, 28, 1359–1371. [Google Scholar] [CrossRef] [PubMed]
- Berg, V.; Nost, T.H.; Skeie, G.; Thomassen, Y.; Berlinger, B.; Veyhe, A.S.; Jorde, R.; Odland, J.O.; Hansen, S. Thyroid homeostasis in mother-child pairs in relation to maternal iodine status: The MISA study. Eur. J. Clin. Nutr. 2017, 71, 1002–1007. [Google Scholar] [CrossRef] [PubMed] [Green Version]
- Censi, S.; Watutantrige-Fernando, S.; Groccia, G.; Manso, J.; Plebani, M.; Faggian, D.; Mion, M.M.; Venturini, R.; Andrisani, A.; Casaro, A.; et al. The Effects of Iodine Supplementation in Pregnancy on Iodine Status, Thyroglobulin Levels and Thyroid Function Parameters: Results from a Randomized Controlled Clinical Trial in a Mild-to-Moderate Iodine Deficiency Area. Nutrients 2019, 11, 2639. [Google Scholar] [CrossRef] [PubMed] [Green Version]
- Obregon, M.J.; Escobar del Rey, F.; Morreale de Escobar, G. The effects of iodine deficiency on thyroid hormone deiodination. Thyroid 2005, 15, 917–929. [Google Scholar] [CrossRef] [Green Version]
- Schiller, T.; Agmon, A.; Ostrovsky, V.; Shefer, G.; Knobler, H.; Zornitzki, T. Moderate Iodine Deficiency Is Common in Pregnancy but Does Not Alter Maternal and Neonatal Thyroid Function Tests. Front. Endocrinol. 2020, 11, 523319. [Google Scholar] [CrossRef]
- Patel, J.; Landers, K.; Li, H.; Mortimer, R.H.; Richard, K. Delivery of maternal thyroid hormones to the fetus. Trends Endocrinol. Metab. 2011, 22, 164–170. [Google Scholar] [CrossRef]
- Mullan, K.; McMullan, P.; Kayes, L.; McCance, D.; Hunter, A.; Woodside, J.V. Thyroglobulin levels among iodine deficient pregnant women living in Northern Ireland. Eur. J. Clin. Nutr. 2022, 76, 1542–1547. [Google Scholar] [CrossRef]
- Hatch-McChesney, A.; Lieberman, H.R. Iodine and Iodine Deficiency: A Comprehensive Review of a Re-Emerging Issue. Nutrients 2022, 14, 3474. [Google Scholar] [CrossRef]
- Glinoer, D.; De Nayer, P.; Delange, F.; Lemone, M.; Toppet, V.; Spehl, M.; Grun, J.P.; Kinthaert, J.; Lejeune, B. A randomized trial for the treatment of mild iodine deficiency during pregnancy: Maternal and neonatal effects. J. Clin. Endocrinol. Metab. 1995, 80, 258–269. [Google Scholar] [CrossRef] [Green Version]
- Verloop, H.; Dekkers, O.M.; Peeters, R.P.; Schoones, J.W.; Smit, J.W. Genetics in endocrinology: Genetic variation in deiodinases: A systematic review of potential clinical effects in humans. Eur. J. Endocrinol. 2014, 171, R123–R135. [Google Scholar] [CrossRef] [PubMed]


| Characteristics | Study Population N = 178 |
|---|---|
| Age (years) | 31 ± 5 |
| Israeli born | 147 (83%) |
| Tertiary education | 136 (76%) |
| Alcohol consumption | 1 (~0%) |
| Smoking | |
| Current smoker | 25 (14%) |
| Past smoker | 37 (21%) |
| Previous X-ray examinations | 40 (22%) |
| Post-psychological stressful event | 31 (17%) |
| Prior use of possible thyroid-disrupting medication | 34 (19%) |
| Family history of TD | 53 (28%) |
| BMI (kg/cm2) | |
| Preconception | 24.1 ± 4.9 |
| At recruitment | 28.4 ± 5.2 |
| Change | 4.4 ± 2.6 |
| Gestational week at recruitment | 32.2 (27–35) |
| Parity | 2.5 ± 1.6 |
| Gravidity | 3.2 ± 2.0 |
| Estimated dietary iodine intake (μg/day) | 179 (94–268) |
| Estimated iodine intake from ICS (μg/day) b | 62 (0–150) |
| ICS initiation’s gestational age (week) | 4 (0–8) |
| serum Tg (μg/L) | 18 (11–33) |
| UIC (μg/L) | 60 (41–95) |
| Pre-pregnancy ICS initiation * | 9 (6%) |
| ICS intake a | 108 (61%) |
| Iodized salt use # | 8 (5%) |
| Iodine intake < EAR | 114 (64%) |
| Serum Tg > 13 (μg/L) | 123 (69%) |
| Daily dietary goitrogens exposure | 31 (17%) |
| Characteristics | Adequate N = 85 | Inadequate N = 114 | p |
|---|---|---|---|
| Median UIC (IQR), μg/L b | 70 (47–117) | 51 (33–78) | 0.03 c |
| Mean serum Tg ± SE, μg/L | 15.8 ± 0.1 | 20.5 ± 0.1 | 0.07 d |
| Median serum Tg (IQR), μg/L | 15.9 (10.4–31.1) | 21.5 (12.2–38.3) | <0.01 b |
| Median TSH (IQR), mIU/L | 1.6 (1.1–2.1) | 1.6 (1.1–2.1) | NS |
| Mean FT3 ± SD, pmol/L | 4.0 ± 0.6 | 4.0 ± 0.8 | NS |
| Mean FT4 ± SD, μg/L | 1.0 ± 0.1 | 1.0 ± 0.2 | NS |
| Mean FT3/FT4 ratio ± SD | 3.9 ± 0.7 | 4.0 ± 0.8 | NS |
| FT3 Deciles | |||
|---|---|---|---|
| 1–9 N = 154 | 10 N = 24 | p-Value | |
| Pregnant Women | |||
| Gestational week at recruitment | 34 (27–37) | 29 (26–32) | 0.06 |
| Iodine Intake | |||
| Estimated median dietary Iodine intake, μg/day (IQR) | 189 (102–272) | 101 (60–280) | NS |
| Iodine intake < RDA, N (%) | 95 (58%) | 18 (75%) | NS |
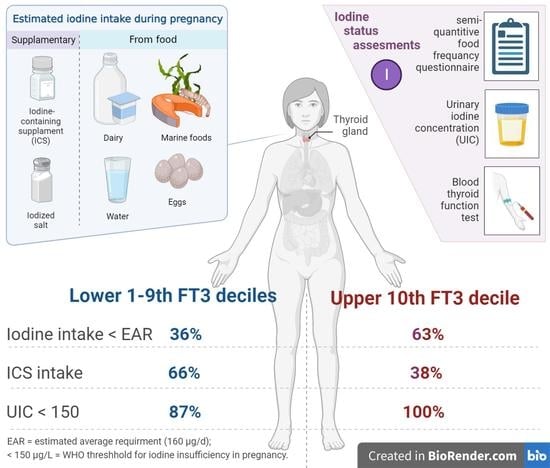
| Iodine intake < EAR, N (%) F | 60 (39%) | 15 (63%) | 0.0 |
| Iodized salt use, N (%) # | 8 (8%) | 0 (0%) | NS |
| ICS intake, N (%) F | 99 (66%) | 9 (38%) | 0.01 |
| Estimated iodine intake from ICS (μg/day), median (IQR) | 95 (0–154) | 0 (0–150) | 0.04 |
| Dietary goitrogens exposure, N (%) F | 31 (19%) | 0 (0%) | 0.02 |
| Serum Tg | |||
| Median Serum Tg, μg/L (IQR) | 17 (11–32) | 24 (14–48) | 0.08 |
| Participants with Tg > 40 μg/L, N (%) | 26 (16%) | 6 (25%) | NS |
| UIC | |||
| Median UIC, μg/L (IQR) A | 61 (42–98) | 42 (21–75) | NS |
| Participants with UIC < 150 μg/L, N (%) L | 130 (87%) | 16 (100%) | 0.04 |
| TSH | |||
| Mean TSH ± SD, mIU/L | 1.7 ± 0.9 | 2.1 ± 1.0 | NS |
| Participants with subclinical hypothyroidism, N (%) | 4 (2%) | 2 (8%) | NS |
| FT4 | |||
| Mean FT4 ± SD, μg/L * | 1.0 ± 0.1 | 0.9 ± 0.2 | 0.01 |
| Participants with isolated hypothyroxinemia, N%) L | 16 (10%) | 0 (0%) | 0.03 |
| TPO Ab, N (%) Pe | 7 (4%) | 1 (4%) | NS |
| Tg Ab, N (%) | 3 (1%) | 2 (8%) | NS |
| Newborns at birth, N (%) | 149 | 22 | |
| At birth | |||
| Mean gestational age ± SD, days | 269 ± 17 | 249 ± 59 | NS |
| Preterm birth, N (%) | 21 (14%) | 6 (27%) | NS |
| Gender (Female, Male) | 70, 79 | 4, 15 | NS |
| Mean Apgar score ± SD | |||
| At 1 min after delivery | 8.9 ± 0.8 | 9.0 ± 0.3 | NS |
| At 5 min after delivery | 9.9 ± 0.4 | 10 ± 0.0 | NS |
| Mean weight percentile ± SD Do | 52.5 ± 27.7 | 51.6 ± 24.1 | NS |
| Mean length percentile ± SD Da | 71.9 ± 26.1 | 78.5 ± 24.7 | NS |
| Mean head circumference ± SD | 34.2 ± 1.9 | 34.2 ± 1.7 | NS |
| Mean total T4 ± SD, nmol/L | 15.2 ± 3.8 | 15.8 ± 4.9 | NS |
| Median nTSH (IQR), IU/L | 5.0 (3.3–7.9) | 2.0 (0.5–6.9) | NS |
| Newborns with elevated nTSH ≥ 5 IU/L, N (%) | 29 (53%) | 1 (50%) | NS |
| Newborns with elevated nTSH ≥ 20 IU/L, N (%) T | 0 (0%) | 1 (50%) | 0.04 |
Publisher’s Note: MDPI stays neutral with regard to jurisdictional claims in published maps and institutional affiliations. |
© 2022 by the authors. Licensee MDPI, Basel, Switzerland. This article is an open access article distributed under the terms and conditions of the Creative Commons Attribution (CC BY) license (https://creativecommons.org/licenses/by/4.0/).
Share and Cite
Shenhav, S.; Benbassat, C.; Gefel, D.; Zangen, S.; Rosen, S.R.; Avrahami-Benyounes, Y.; Almashanu, S.; Groisman, L.; Rorman, E.; Fytlovich, S.; et al. Can Mild-to-Moderate Iodine Deficiency during Pregnancy Alter Thyroid Function? Lessons from a Mother–Newborn Cohort. Nutrients 2022, 14, 5336. https://doi.org/10.3390/nu14245336
Shenhav S, Benbassat C, Gefel D, Zangen S, Rosen SR, Avrahami-Benyounes Y, Almashanu S, Groisman L, Rorman E, Fytlovich S, et al. Can Mild-to-Moderate Iodine Deficiency during Pregnancy Alter Thyroid Function? Lessons from a Mother–Newborn Cohort. Nutrients. 2022; 14(24):5336. https://doi.org/10.3390/nu14245336
Chicago/Turabian StyleShenhav, Simon, Carlos Benbassat, Dov Gefel, Shmuel Zangen, Shani R. Rosen, Yael Avrahami-Benyounes, Shlomo Almashanu, Ludmila Groisman, Efrat Rorman, Shlomo Fytlovich, and et al. 2022. "Can Mild-to-Moderate Iodine Deficiency during Pregnancy Alter Thyroid Function? Lessons from a Mother–Newborn Cohort" Nutrients 14, no. 24: 5336. https://doi.org/10.3390/nu14245336