
Sentinel Surveillance Contributes to Tracking Lyme Disease Spatiotemporal Risk Trends in Southern Quebec, Canada

Abstract
:1. Introduction
2. Results
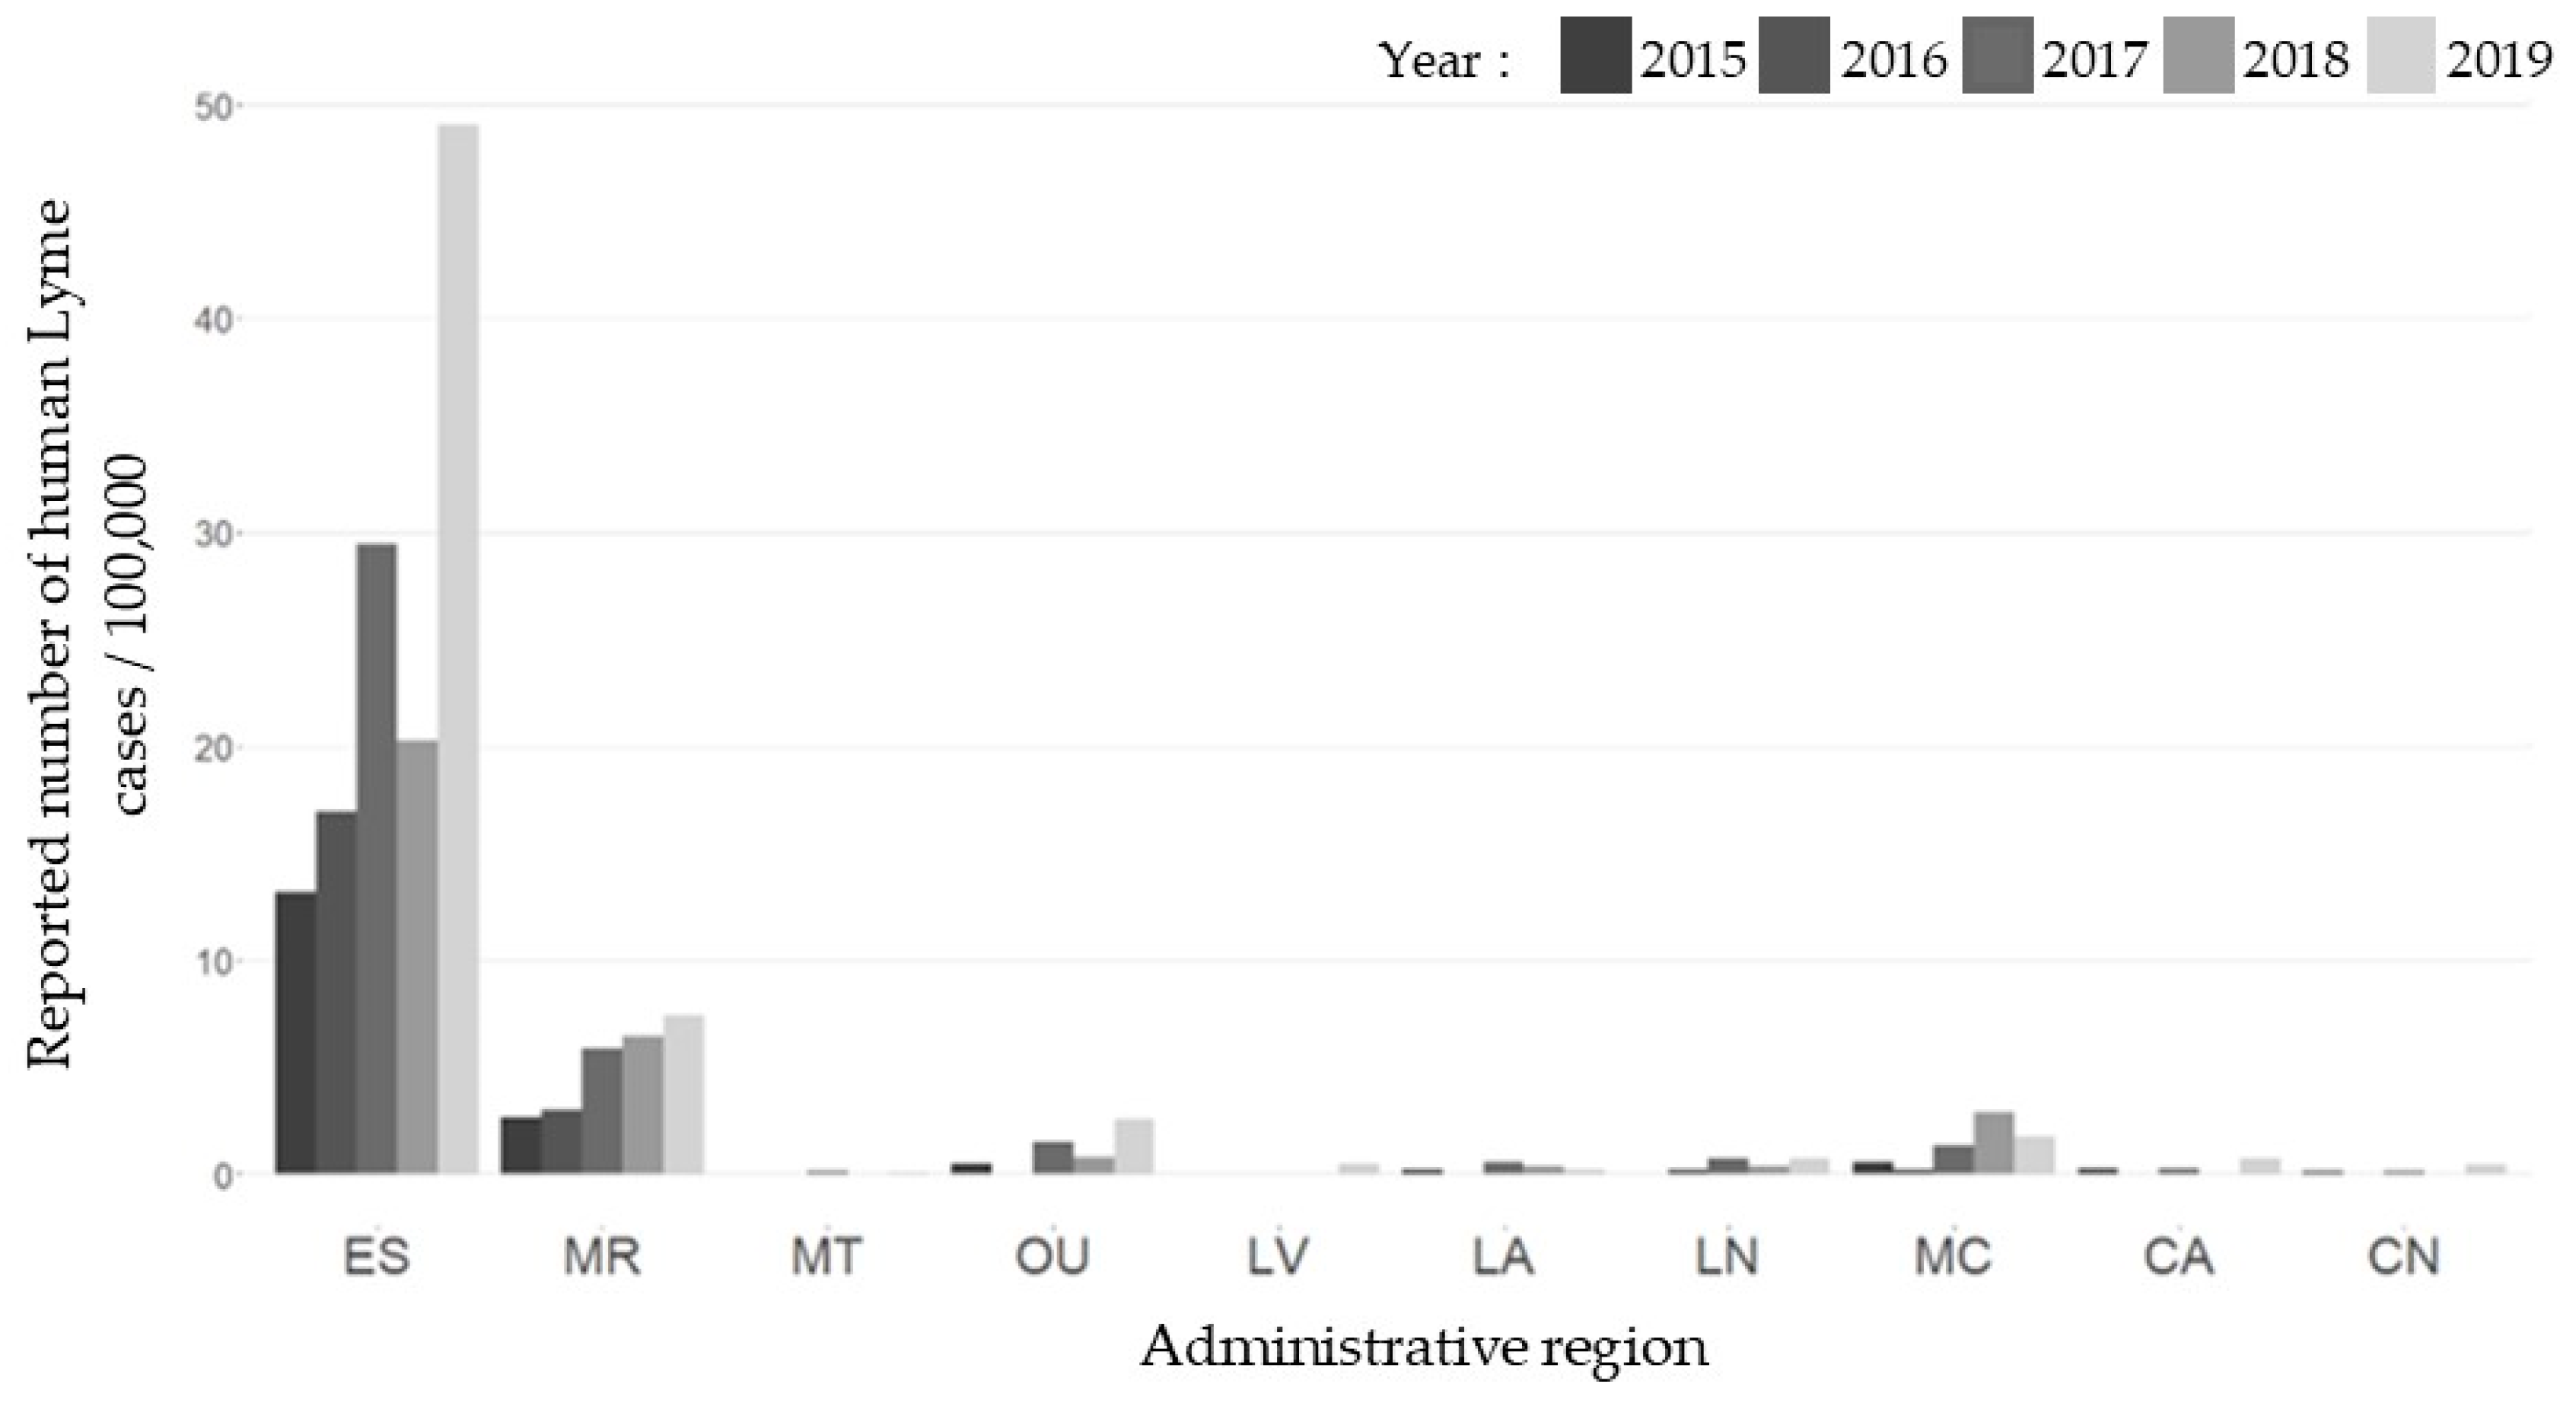
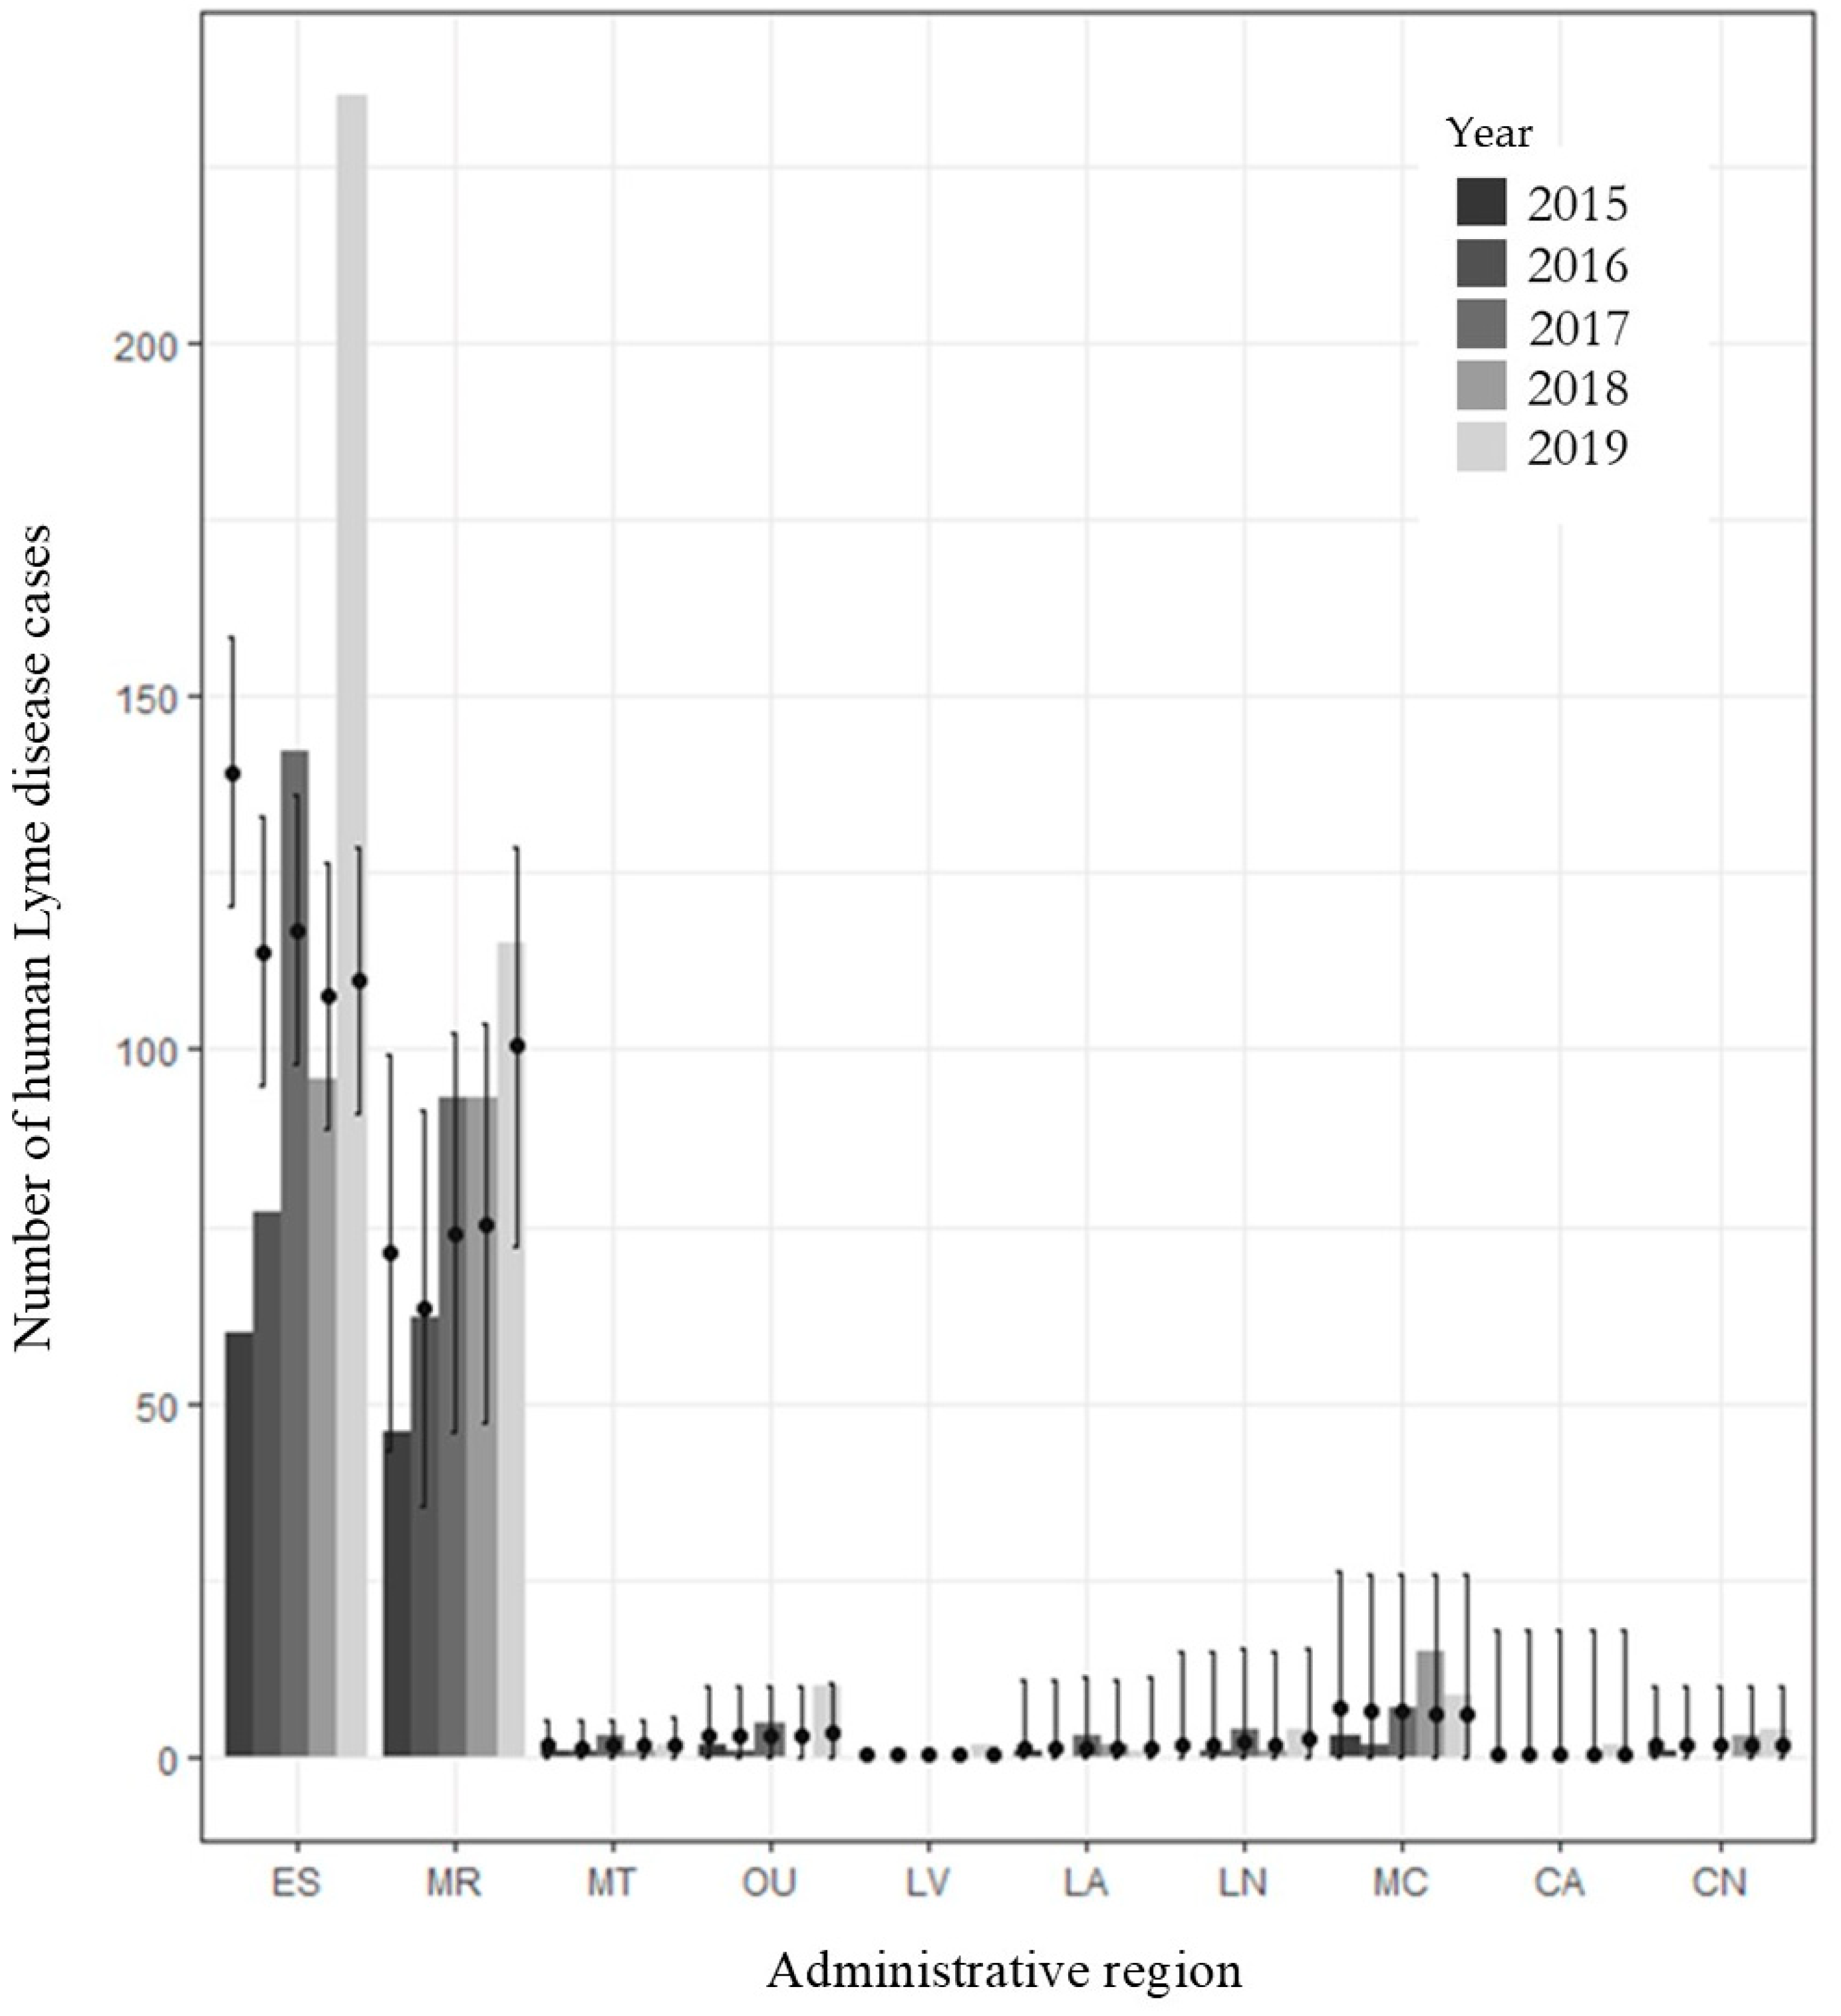
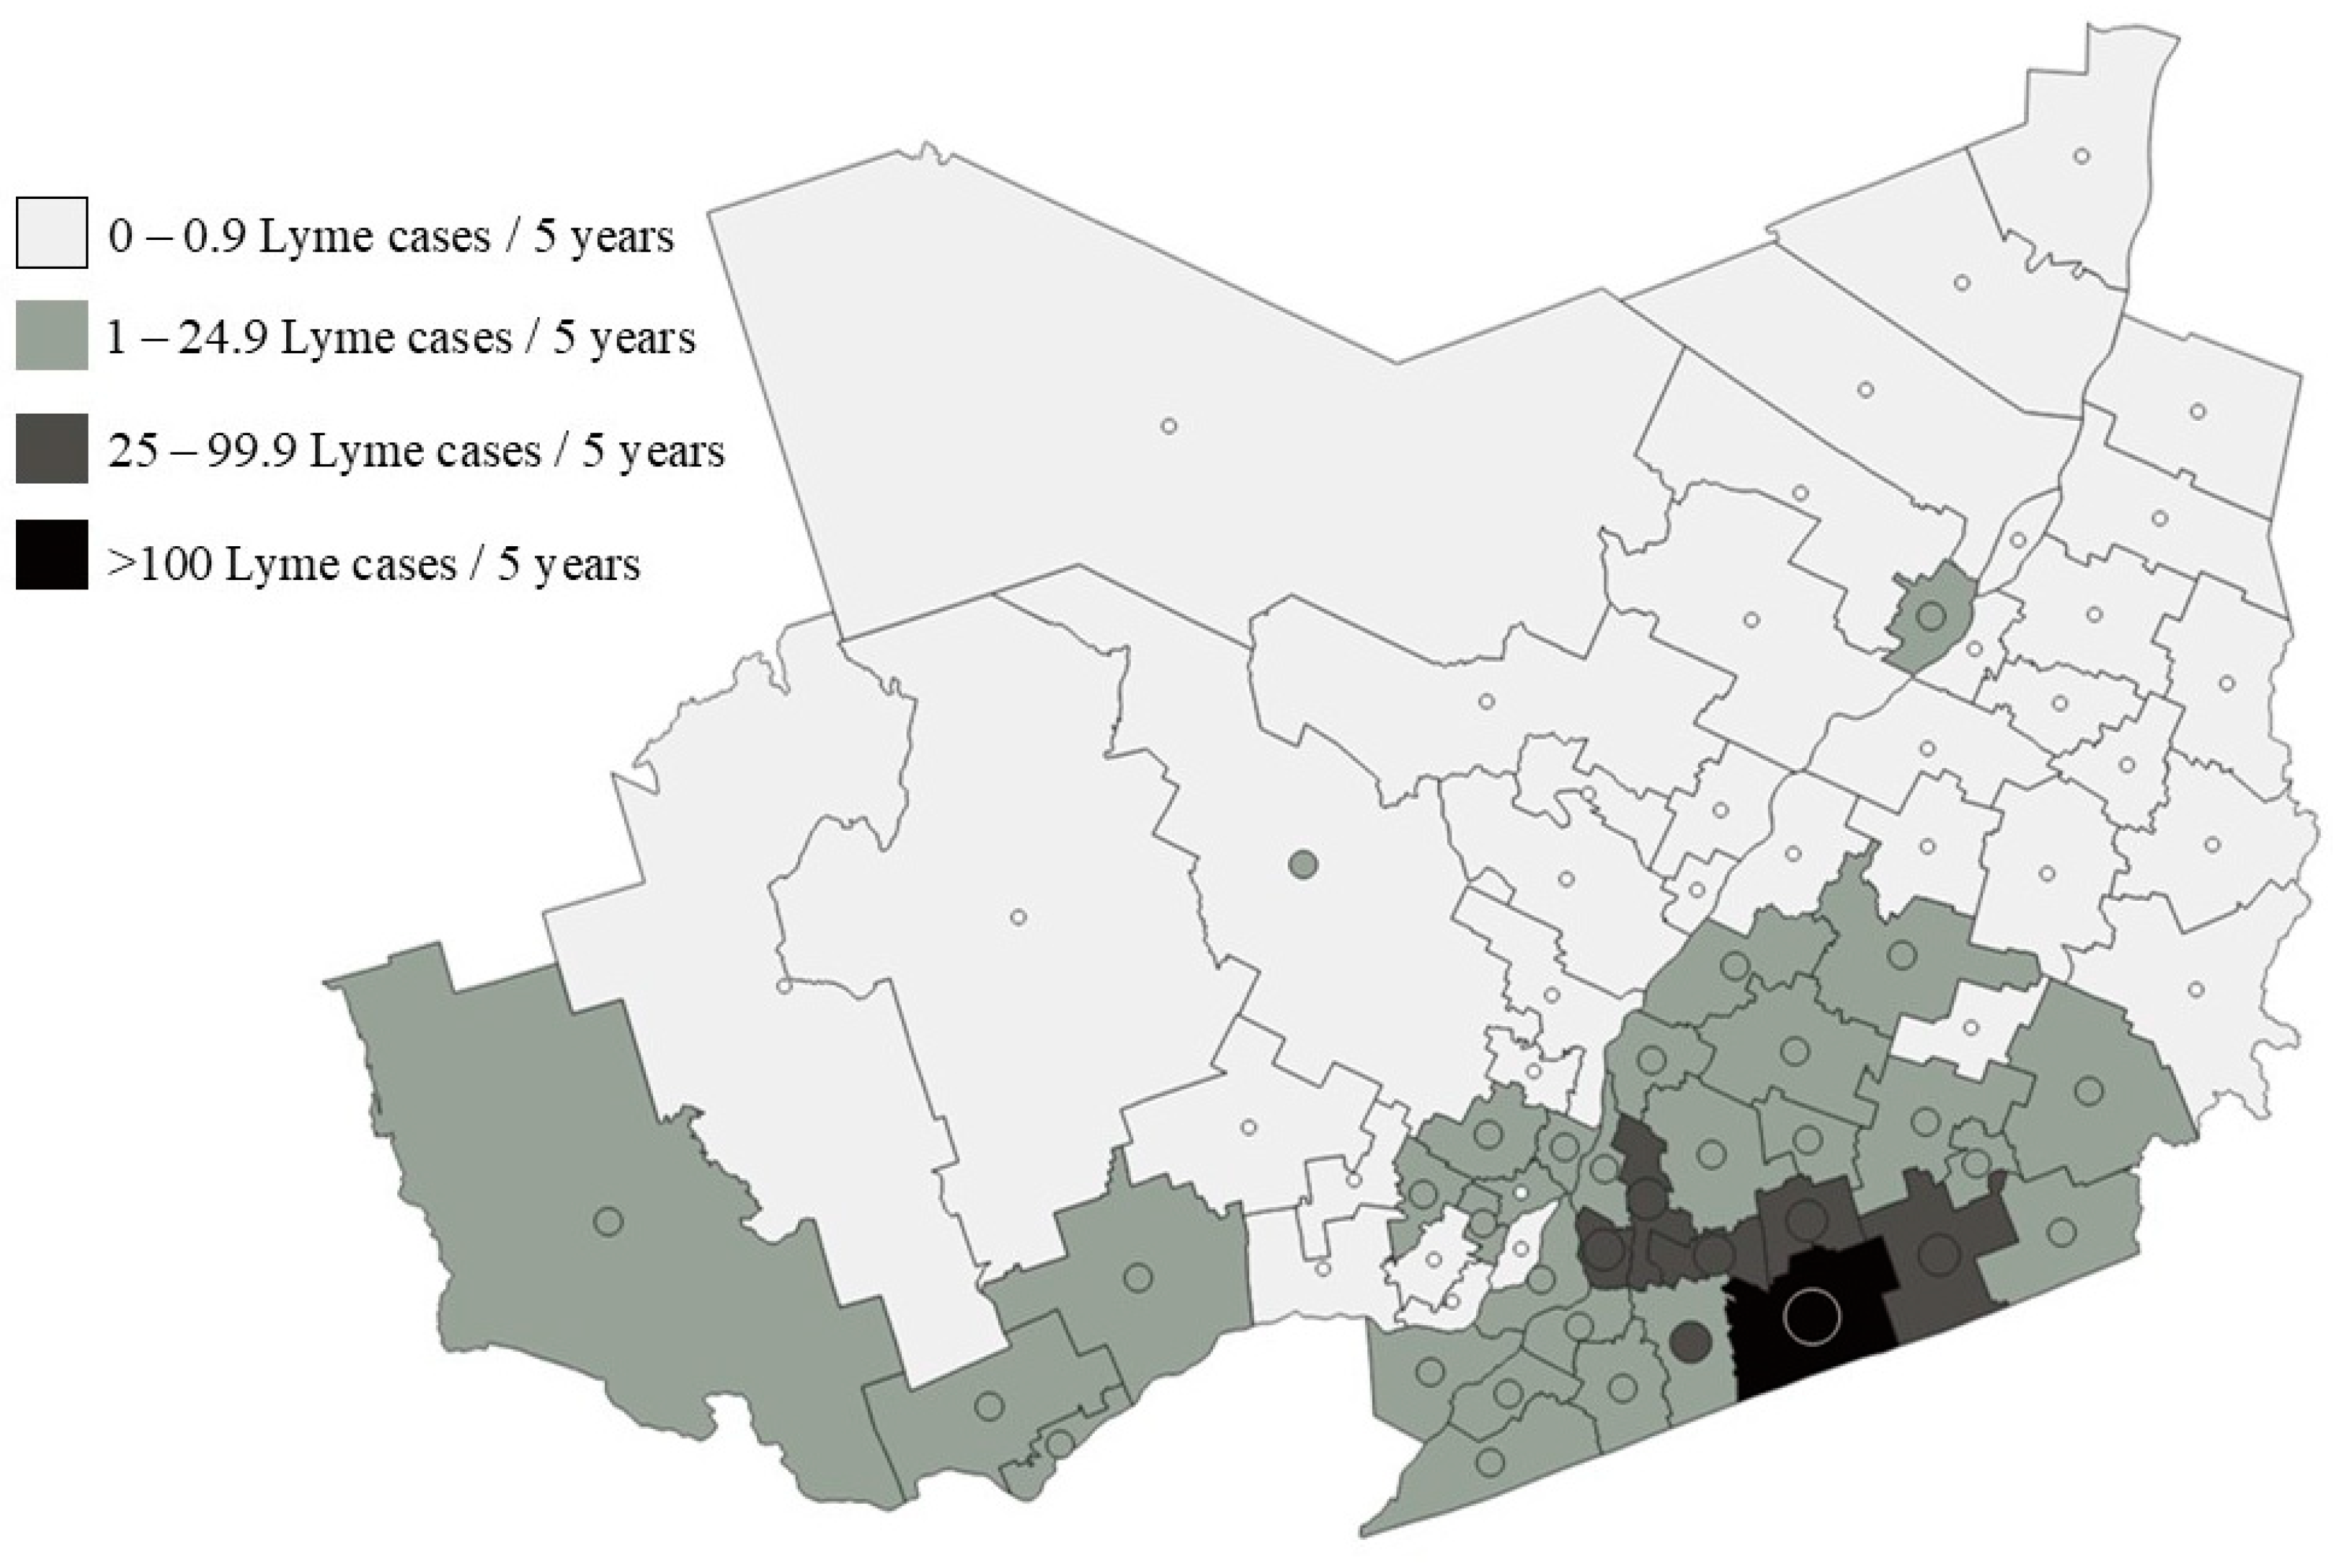
2.1. Human Cases
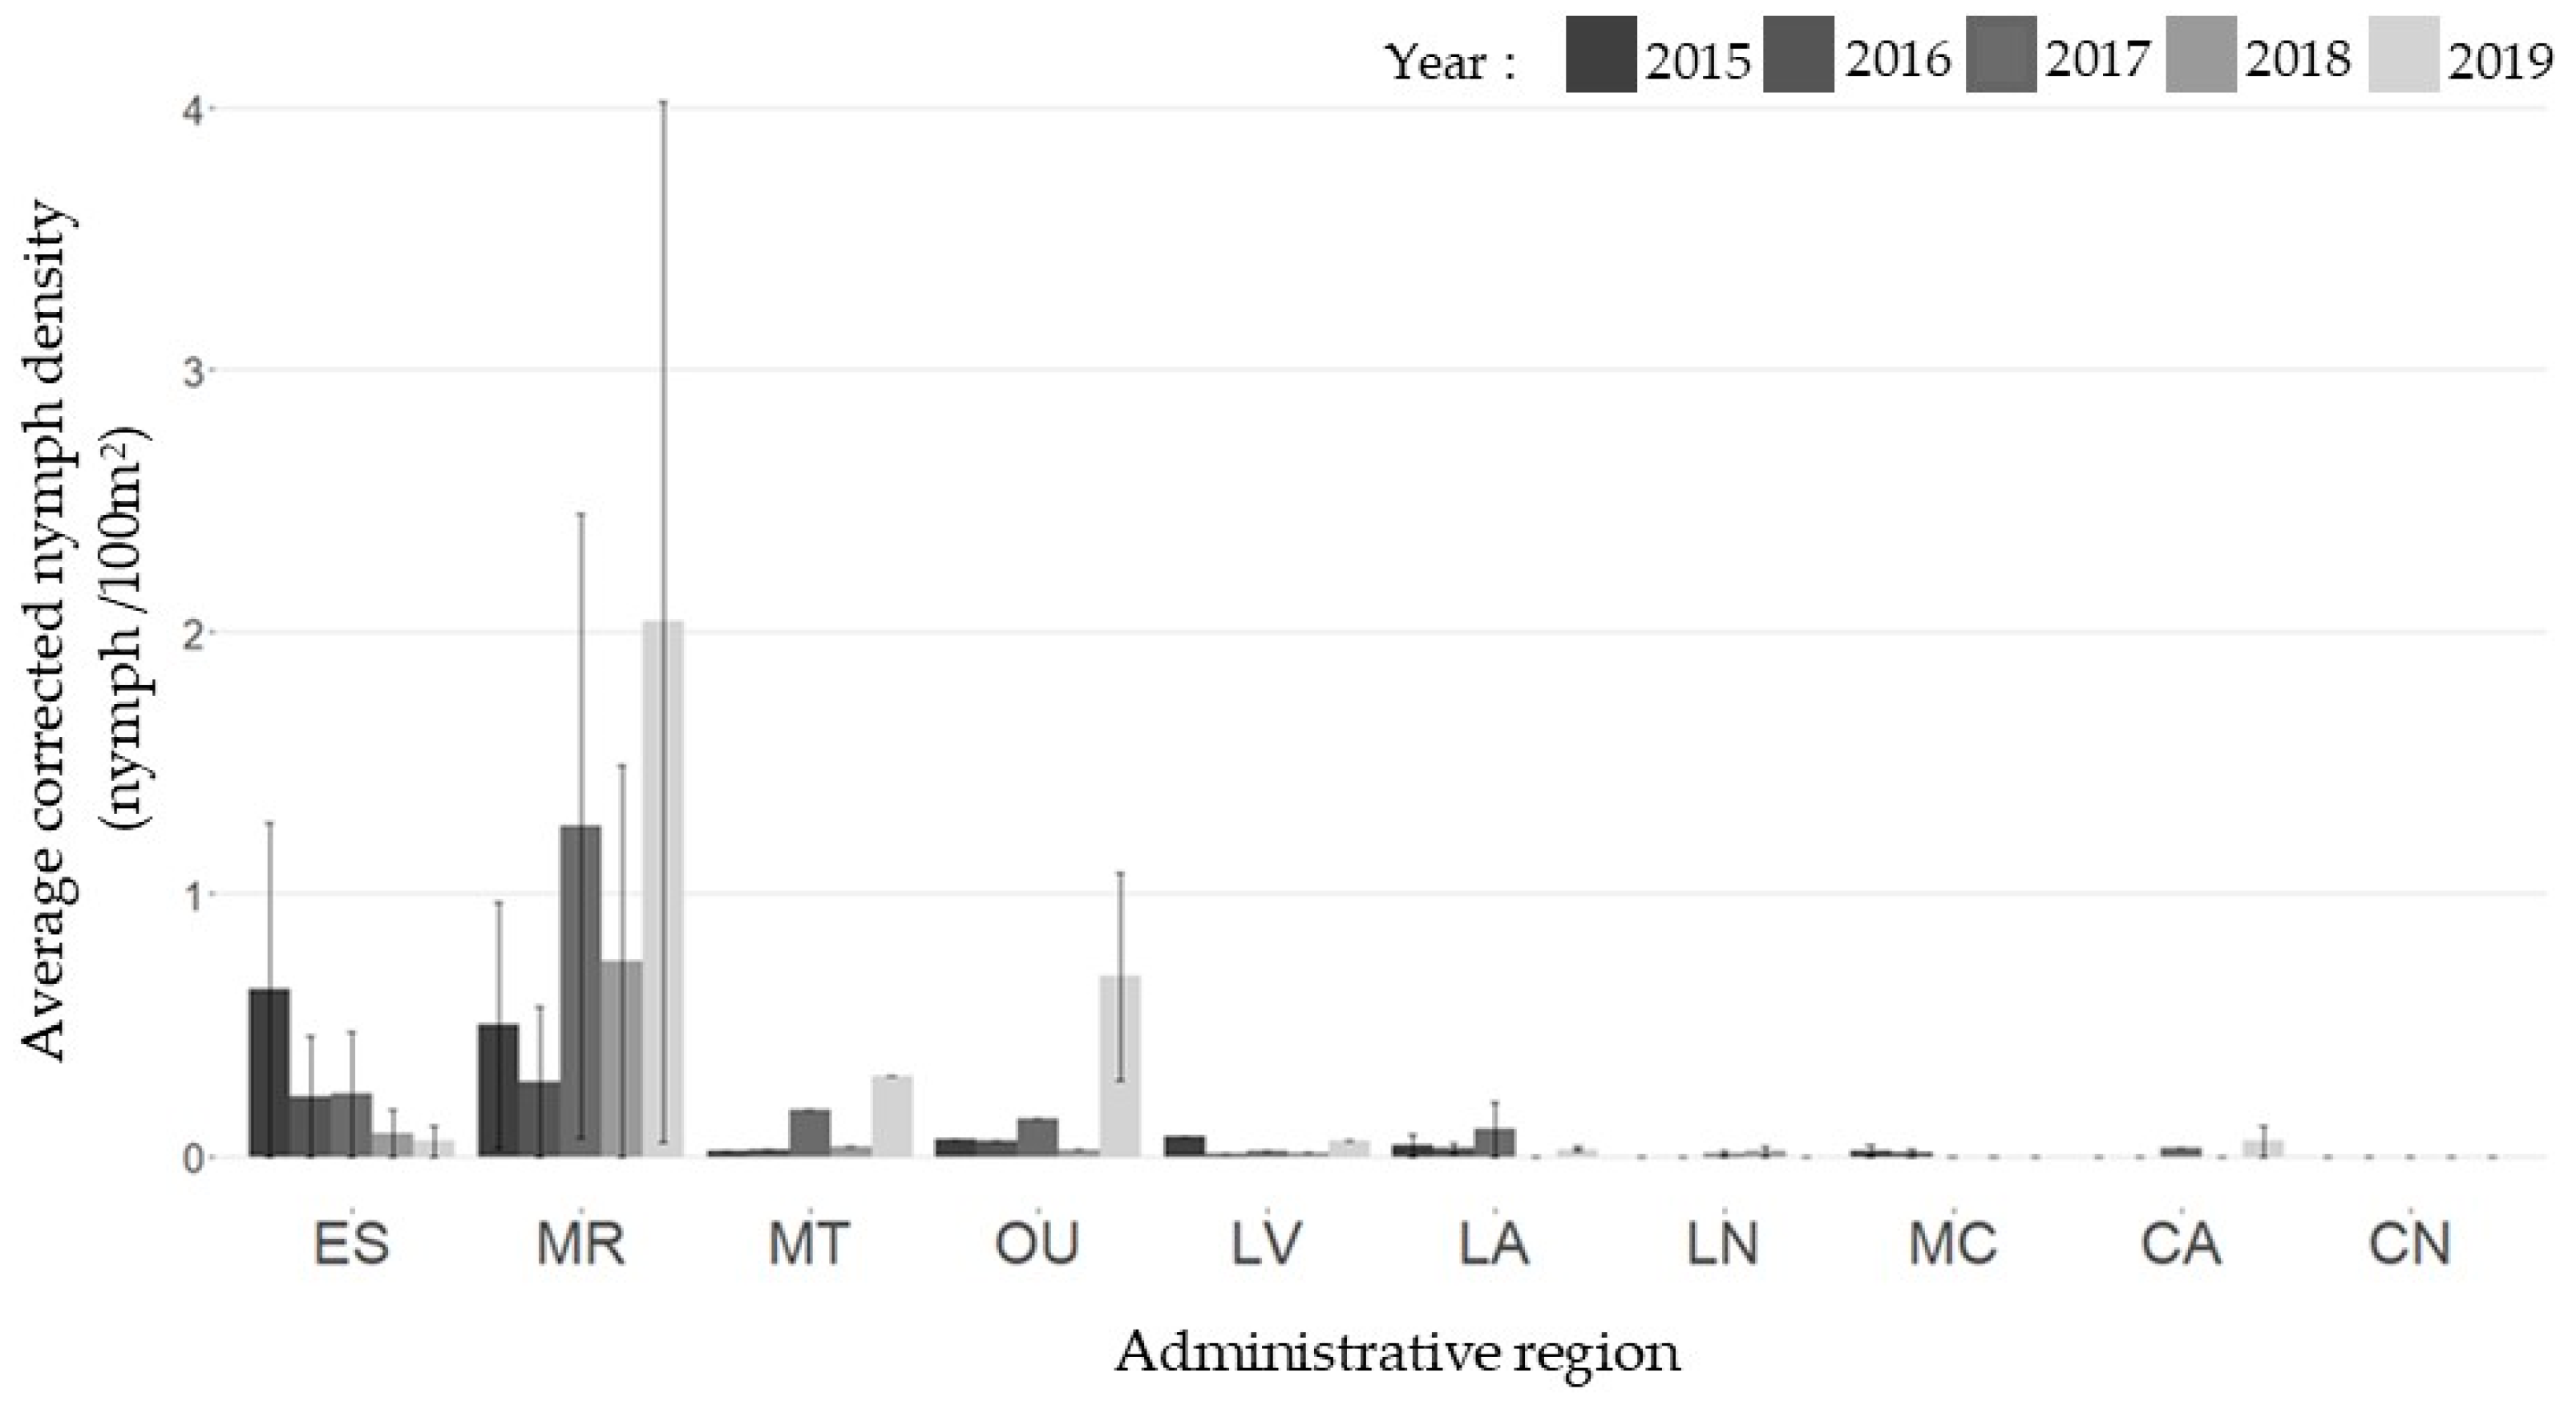
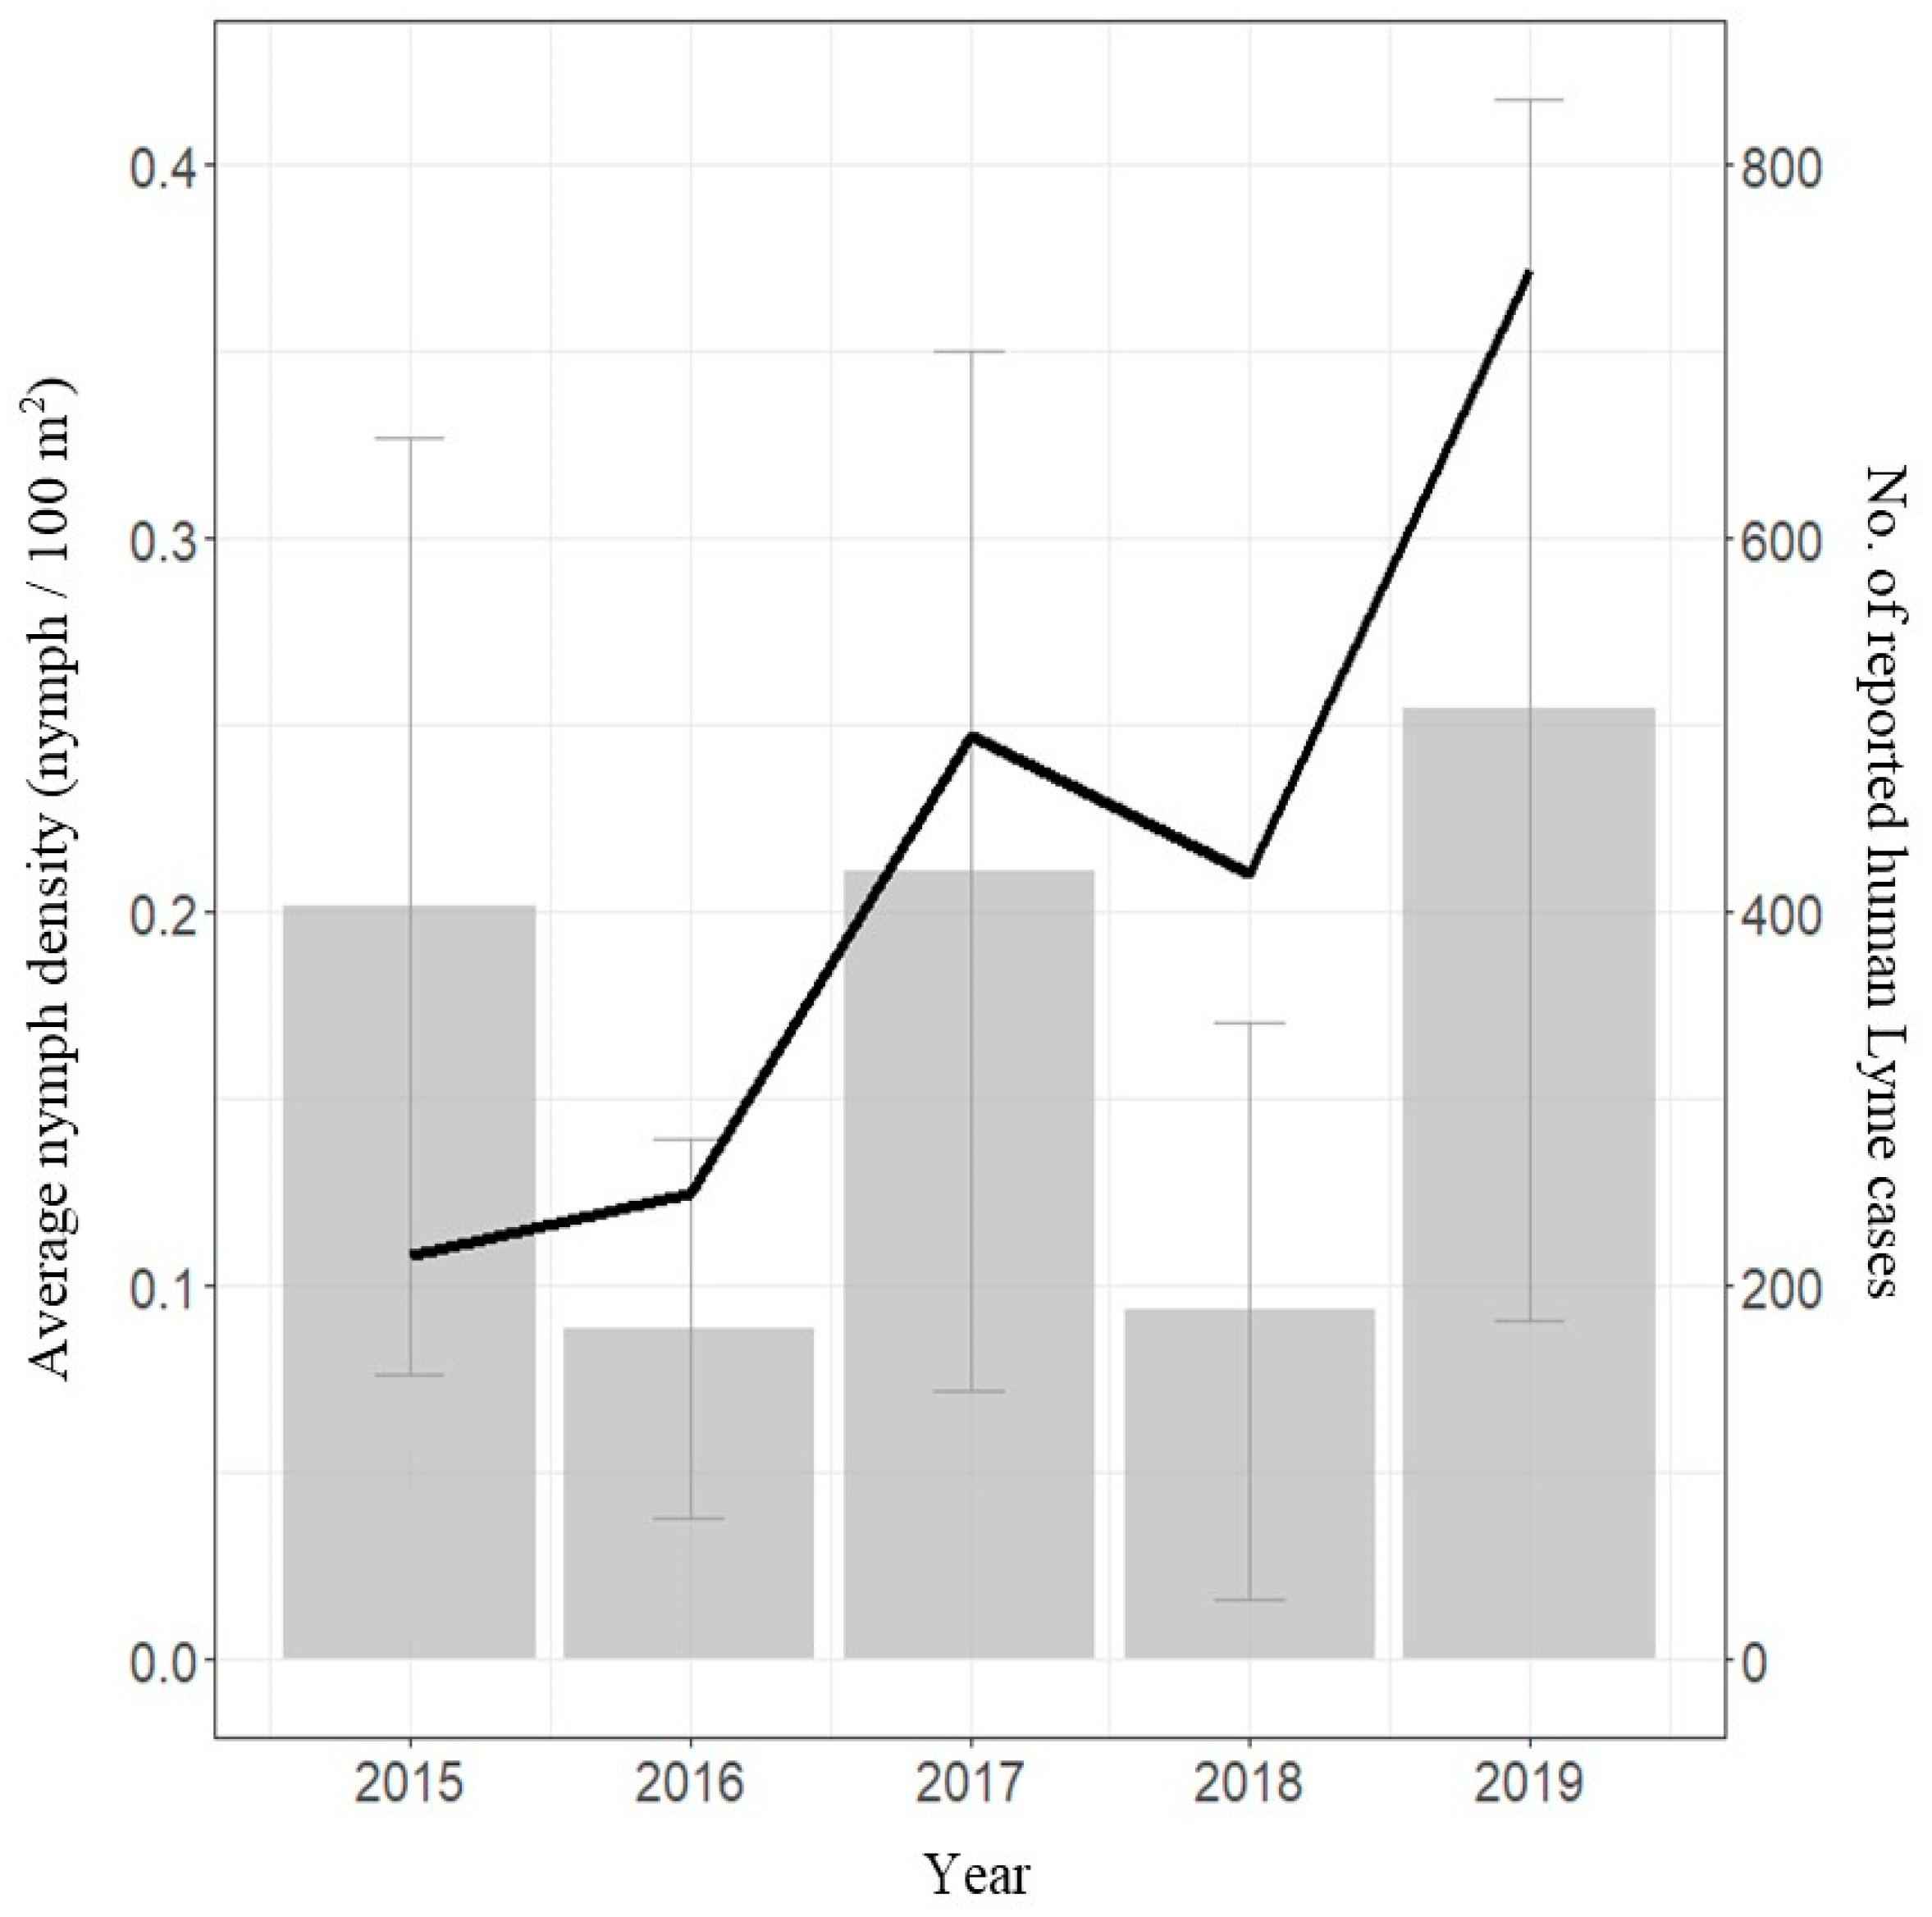
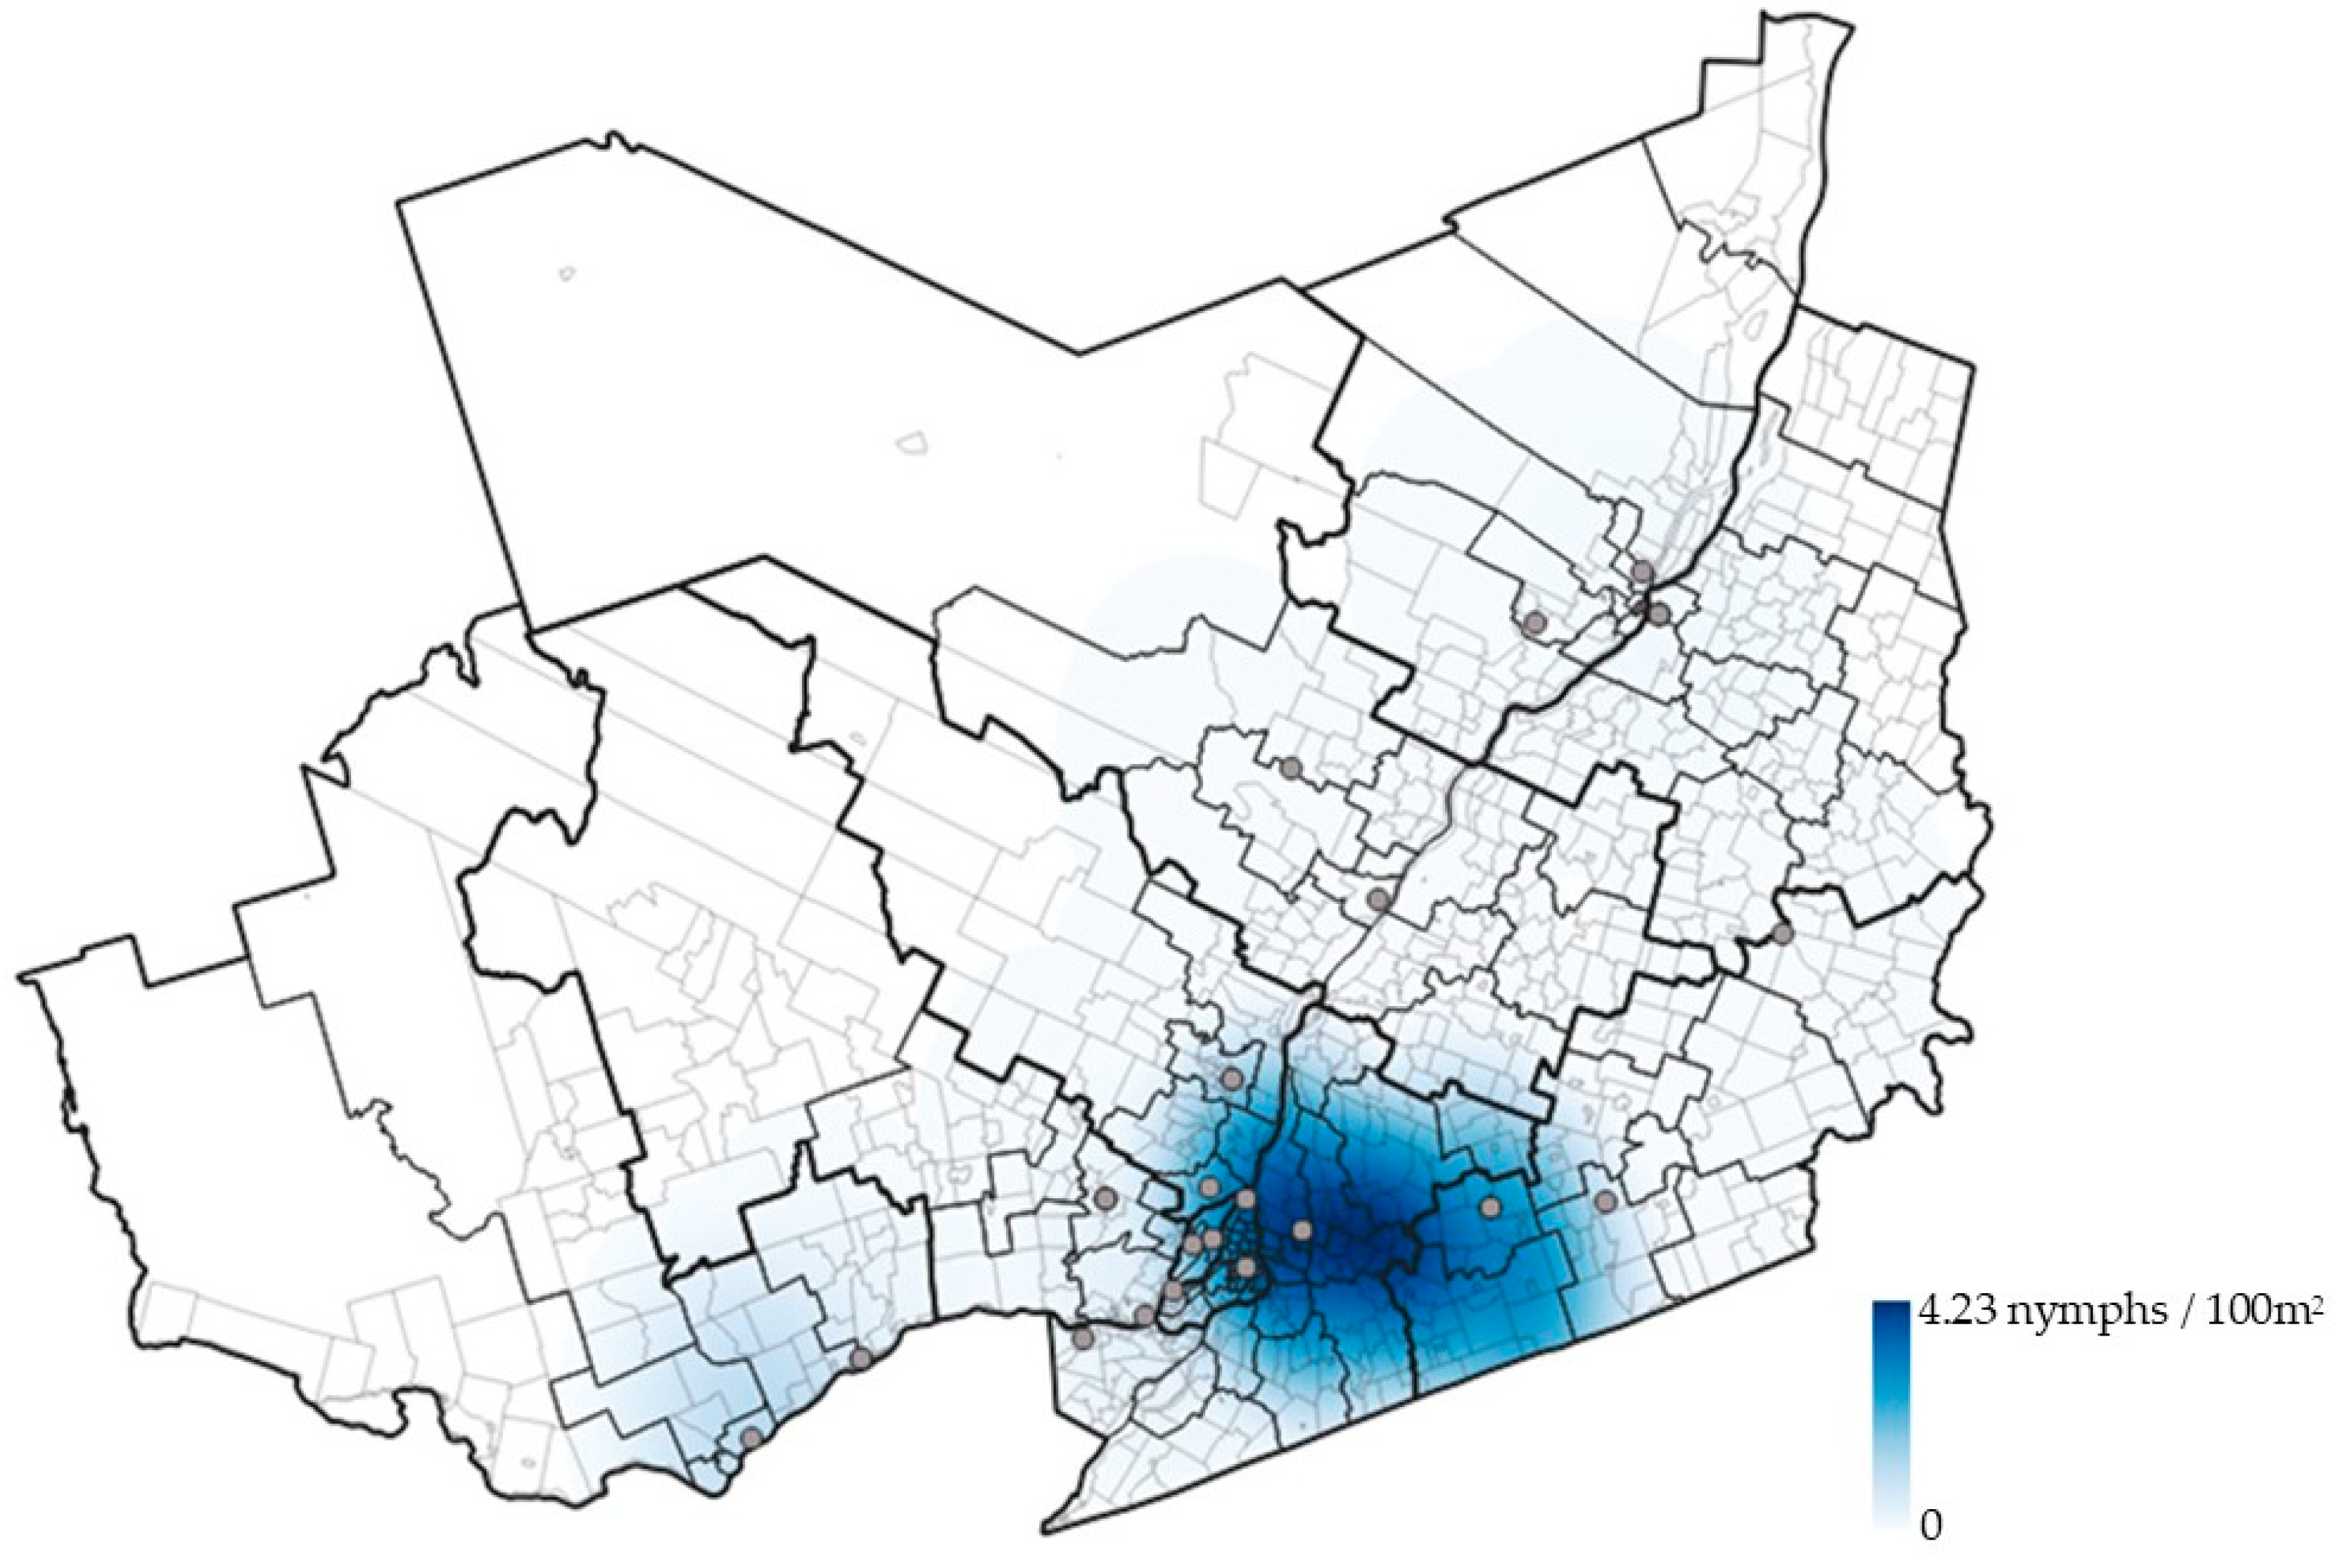
2.2. Active Surveillance
2.3. Statistical Analyses
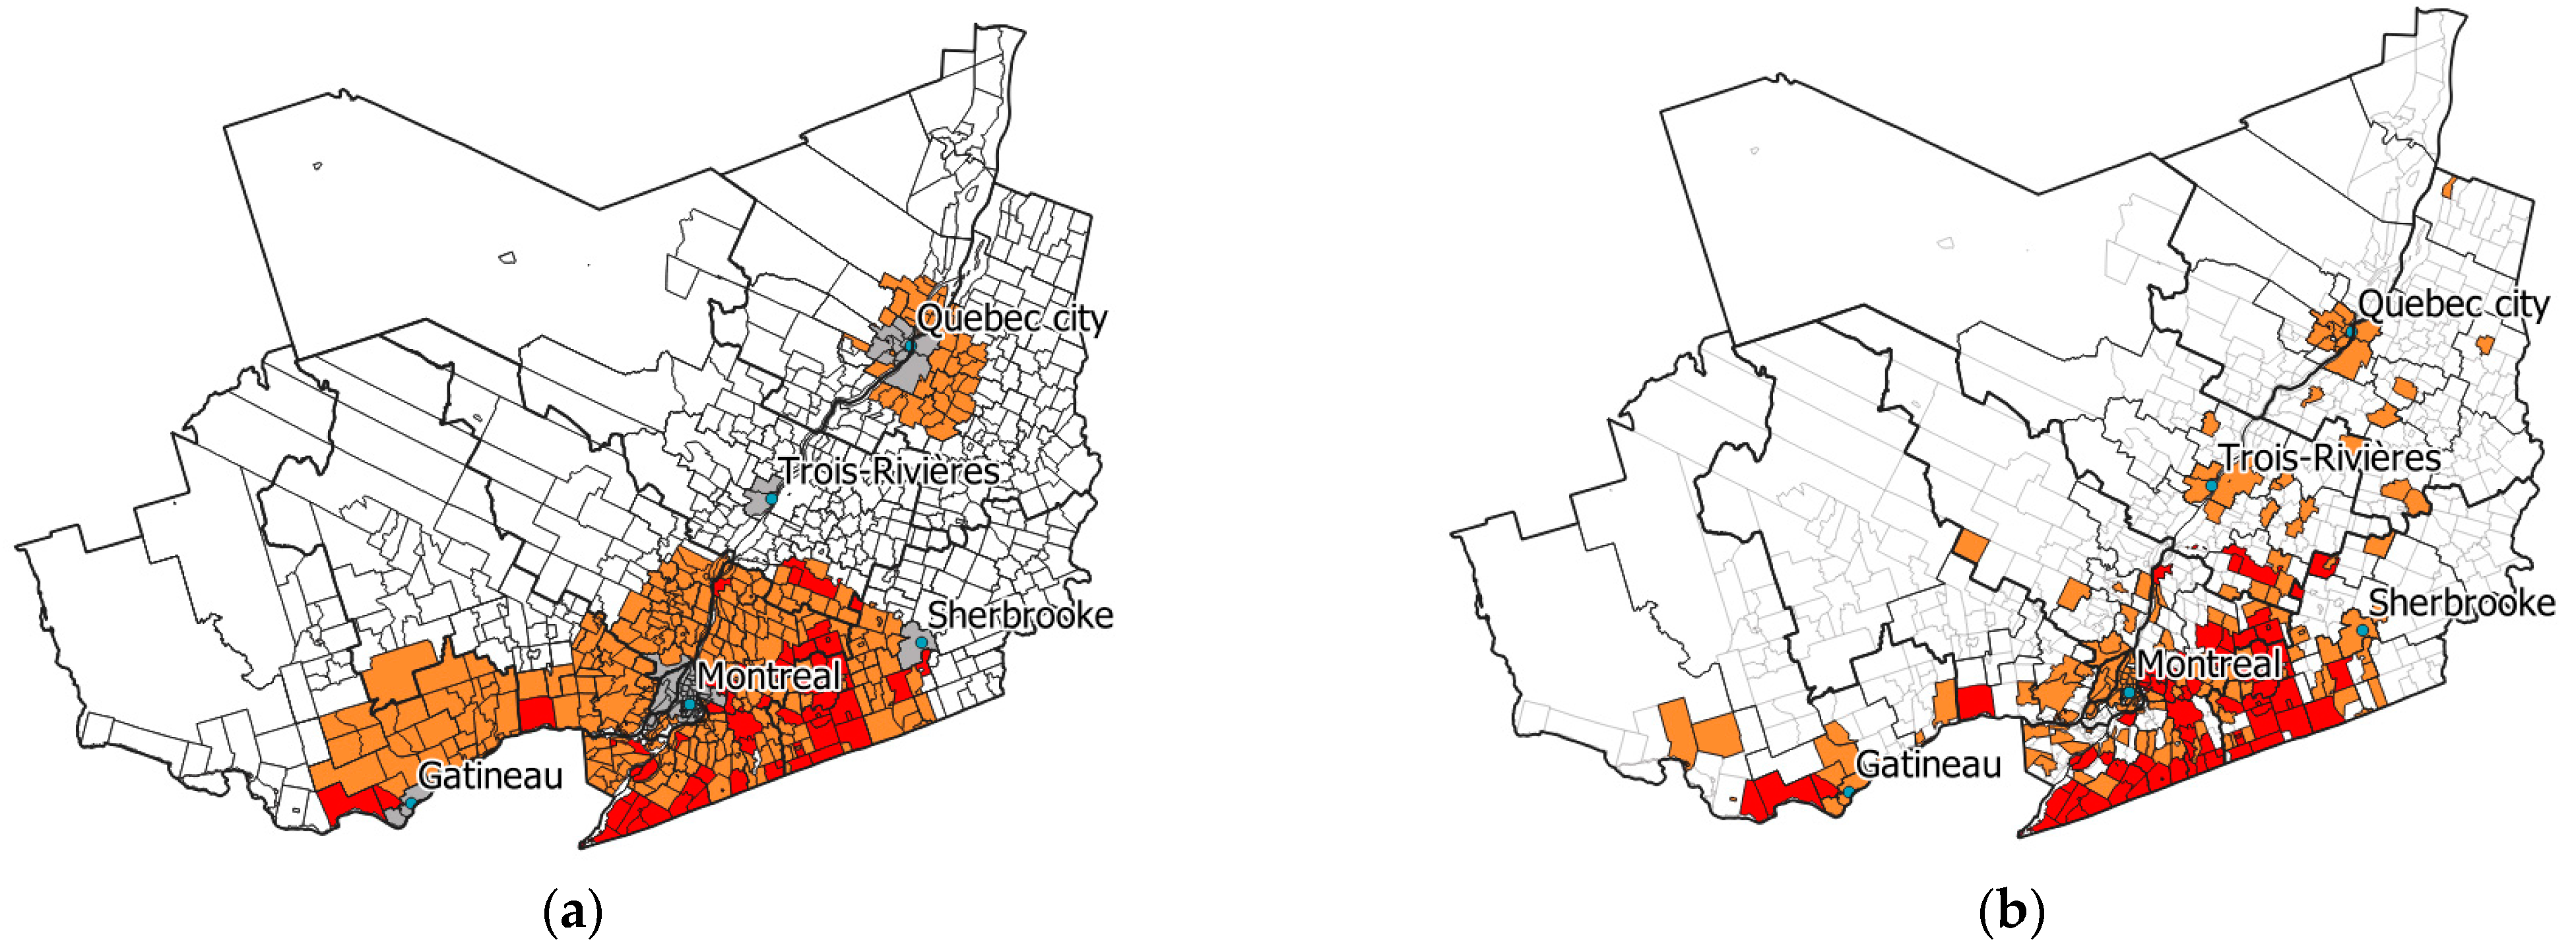
2.4. Risk Mapping with Modelling Results
3. Discussion
4. Materials and Methods
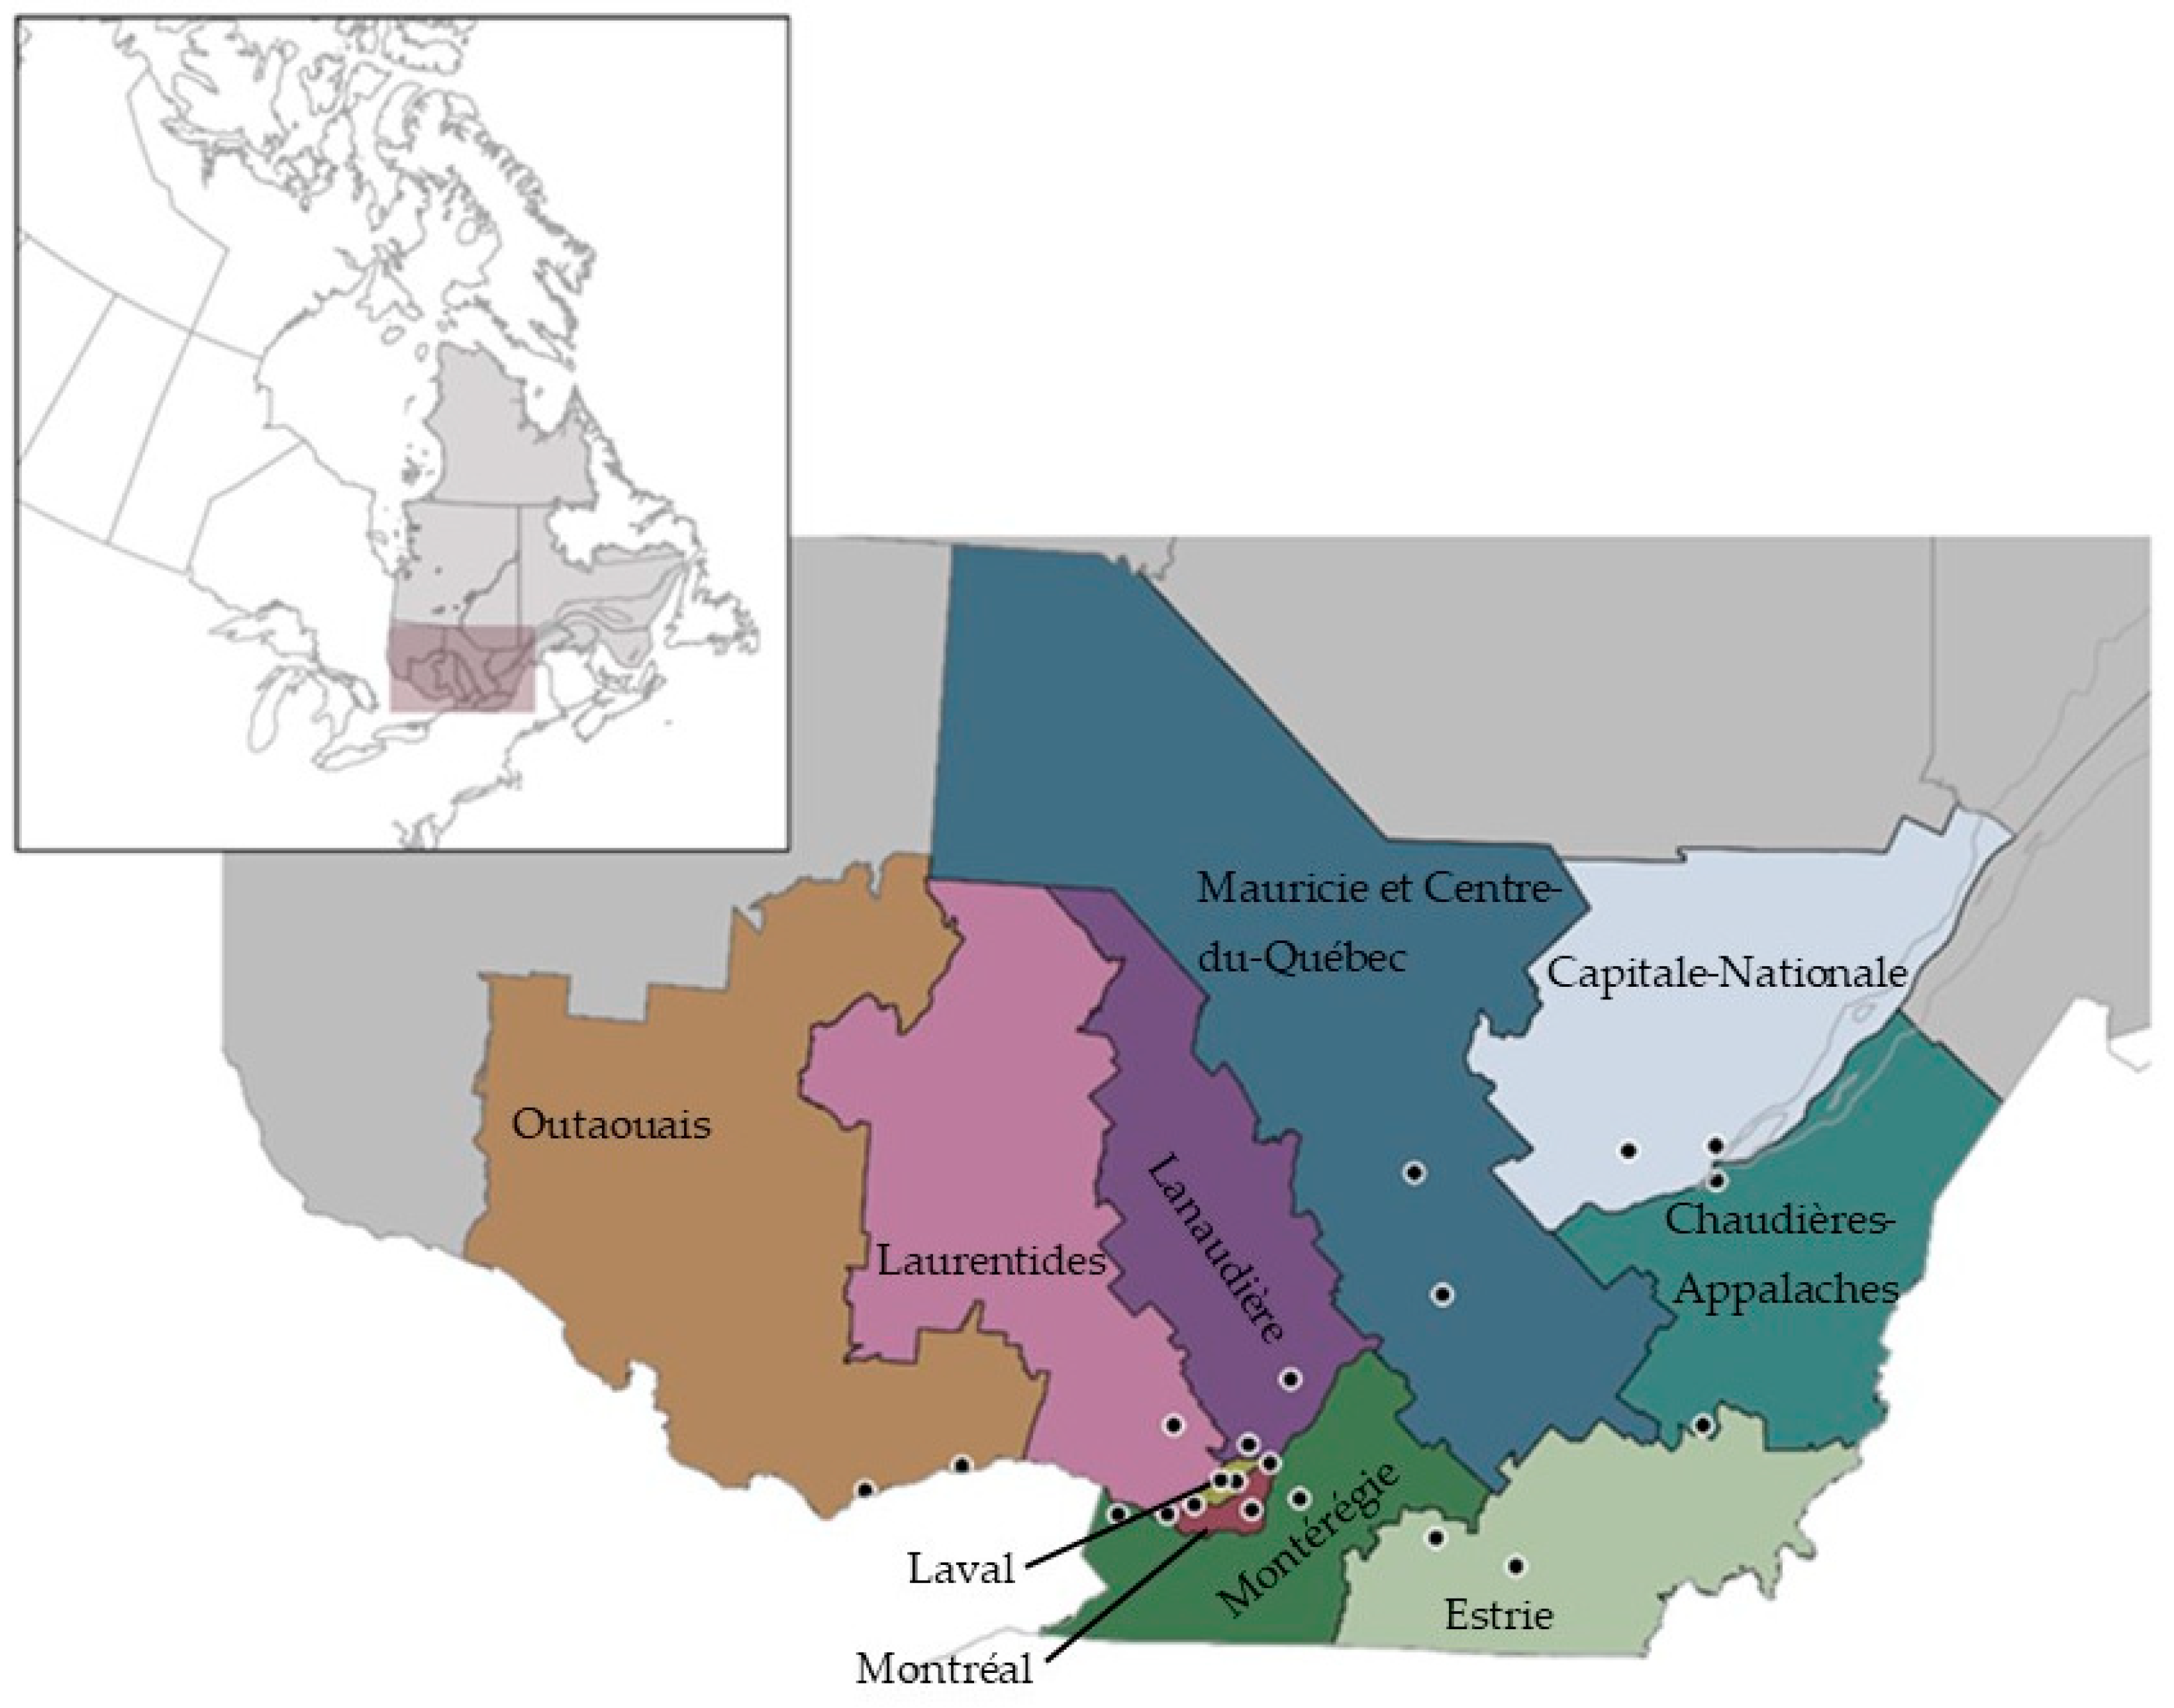
4.1. Study Area
4.2. Sentinel Surveillance in Quebec
4.3. Density of Questing Nymphs
4.4. Notifiable Disease Surveillance System
4.5. Statistical Analyses
4.6. Risk Mapping with Modelling Results
Author Contributions
Funding
Institutional Review Board Statement
Informed Consent Statement
Data Availability Statement
Acknowledgments
Conflicts of Interest
References
- Vandekerckhove, O.; De Buck, E.; Van Wijngaerden, E. Lyme disease in Western Europe: An emerging problem? A systematic review. Acta Clin. Belg. 2021, 76, 244–252. [Google Scholar] [CrossRef] [PubMed]
- Ogden, N.H.; Lindsay, L.R.; Morshed, M.; Sockett, P.N.; Artsob, H. The emergence of Lyme disease in Canada. Can. Med. Assoc. J. 2009, 180, 1221. [Google Scholar] [CrossRef] [PubMed] [Green Version]
- Bisanzio, D.; Fernández, M.P.; Martello, E.; Reithinger, R.; Diuk-Wasser, M.A. Current and Future Spatiotemporal Patterns of Lyme Disease Reporting in the Northeastern United States. JAMA Netw. Open 2020, 3, e200319. [Google Scholar] [CrossRef] [PubMed] [Green Version]
- Vollmer, S.A.; Feil, E.J.; Chu, C.Y.; Raper, S.L.; Cao, W.C.; Kurtenbach, K.; Margos, G. Spatial spread and demographic expansion of Lyme borreliosis spirochaetes in Eurasia. Infect. Genet. Evol. 2013, 14, 147–155. [Google Scholar] [CrossRef] [PubMed]
- Masuzawa, T. Terrestrial distribution of the Lyme borreliosis agent Borrelia burgdorferi sensu lato in East Asia. Jpn. J. Infect. Dis. 2004, 57, 229–235. [Google Scholar] [PubMed]
- Sonenshine, D.E. Range Expansion of Tick Disease Vectors in North America: Implications for Spread of Tick-Borne Disease. Int. J. Environ. Res. Public Health 2018, 15, 478. [Google Scholar] [CrossRef] [PubMed] [Green Version]
- Medlock, J.M.; Hansford, K.M.; Bormane, A.; Derdakova, M.; Estrada-Peña, A.; George, J.-C.; Golovljova, I.; Jaenson, T.G.; Jensen, J.K.; Jensen, P.M.; et al. Driving forces for changes in geographical distribution of Ixodes ricinus ticks in Europe. Parasites Vectors 2013, 6, 1. [Google Scholar] [CrossRef] [Green Version]
- Ogden, N. Changing geographic ranges of ticks and tick-borne pathogens: Drivers, mechanisms and consequences for pathogen diversity. Front. Cell. Infect. Microbiol. 2013, 3, 46. [Google Scholar] [CrossRef] [Green Version]
- Ripoche, M.; Gasmi, S.; Adam-Poupart, A.; Koffi, J.K.; Lindsay, L.R.; Ludwig, A.; Milord, F.; Ogden, N.H.; Thivierge, K.; Leighton, P.A. Passive Tick Surveillance Provides an Accurate Early Signal of Emerging Lyme Disease Risk and Human Cases in Southern Canada. J. Med. Entomol. 2018, 55, 1016–1026. [Google Scholar] [CrossRef]
- Diuk-Wasser, M.A.; VanAcker, M.C.; Fernandez, M.P. Impact of Land Use Changes and Habitat Fragmentation on the Eco-epidemiology of Tick-Borne Diseases. J. Med. Entomol. 2021, 58, 1546–1564. [Google Scholar] [CrossRef]
- Gasmi, S.; Ogden, N.H.; Ripoche, M.; Leighton, P.A.; Lindsay, R.L.; Nelder, M.P.; Rees, E.; Bouchard, C.; Vrbova, L.; Rusk, R.; et al. Detection of municipalities at-risk of Lyme disease using passive surveillance of Ixodes scapularis as an early signal: A province-specific indicator in Canada. PLoS ONE 2019, 14, e0212637. [Google Scholar] [CrossRef] [PubMed] [Green Version]
- Institut National de Santé Publique du Québec. Plan d’Analyse de la Surveillance Intégrée de la Maladie de Lyme. 2016. Available online: https://www.inspq.qc.ca/sites/default/files/publications/2257_plan_analyse_surveillance_lyme.pdf (accessed on 15 March 2022).
- Ogden, N.H.; Koffi, J.K.; Lindsay, L.R. Assessment of a screening test to identify Lyme disease risk. Can. Commun. Dis. Rep. 2014, 40, 83–87. [Google Scholar] [CrossRef] [PubMed]
- Matuschka, F.R.; Fischer, P.; Heiler, M.; Blümcke, S.; Spielman, A. Stage-associated risk of transmission of the Lyme disease spirochete by European Ixodes ticks. Parasitol. Res. 1992, 78, 695–698. [Google Scholar] [CrossRef] [PubMed]
- Diuk-Wasser, M.A.; Hoen, A.G.; Cislo, P.; Brinkerhoff, R.; Hamer, S.A.; Rowland, M.; Cortinas, R.; Vourc’h, G.; Melton, F.; Hickling, G.J.; et al. Human risk of infection with Borrelia burgdorferi, the Lyme disease agent, in eastern United States. Am. J. Trop. Med. Hyg. 2012, 86, 320–327. [Google Scholar] [CrossRef] [PubMed]
- Eisen, L.; Eisen, R.J. Critical Evaluation of the Linkage Between Tick-Based Risk Measures and the Occurrence of Lyme Disease Cases. J. Med. Entomol. 2016, 53, 1050–1062. [Google Scholar] [CrossRef]
- Pepin, K.M.; Eisen, R.J.; Mead, P.S.; Piesman, J.; Fish, D.; Hoen, A.G.; Hamer, S.; Diuk-Wasser, M.A. Geographic variation in the relationship between human Lyme disease incidence and density of infected host-seeking Ixodes scapularis nymphs in the Eastern United States. Am. J. Trop. Med. Hyg. 2012, 86, 1062–1071. [Google Scholar] [CrossRef] [Green Version]
- Perry, B.D.; Mwanaumo, B.; Schels, H.F.; Eicher, E.; Zaman, M.R. A study of health and productivity of traditionally managed cattle in Zambia. Prev. Vet. Med. 1984, 2, 633–653. [Google Scholar] [CrossRef]
- Colman, E.; Holme, P.; Sayama, H.; Gershenson, C. Efficient sentinel surveillance strategies for preventing epidemics on networks. PLOS Comput. Biol. 2019, 15, e1007517. [Google Scholar] [CrossRef]
- Millins, C.; Gilbert, L.; Johnson, P.; James, M.; Kilbride, E.; Birtles, R.; Biek, R. Heterogeneity in the abundance and distribution of Ixodes ricinus and Borrelia burgdorferi (sensu lato) in Scotland: Implications for risk prediction. Parasites Vectors 2016, 9, 595. [Google Scholar] [CrossRef] [Green Version]
- Burtis, J.C.; Sullivan, P.; Levi, T.; Oggenfuss, K.; Fahey, T.J.; Ostfeld, R.S. The impact of temperature and precipitation on blacklegged tick activity and Lyme disease incidence in endemic and emerging regions. Parasites Vectors 2016, 9, 606. [Google Scholar] [CrossRef] [Green Version]
- Government of Canada. Lyme disease: Monitoring. Available online: https://www.canada.ca/en/public-health/services/diseases/lyme-disease/surveillance-lyme-disease.html (accessed on 15 March 2022).
- Institut National de Santé Publique du Québec. Résultats Annuels de Surveillance de la Maladie de Lyme. 2021. Available online: https://www.inspq.qc.ca/zoonoses/maladie-de-lyme/resultats-de-surveillance#:~:text=En%202020%2C%20274%20cas%20de,%C3%A9tait%20inconnu%20(Figure%201) (accessed on 15 March 2022).
- Statistics Canada. Census Profile, 2016 Census. 2016. Available online: https://www12.statcan.gc.ca/census-recensement/2016/dp-pd/prof/search-recherche/lst/results-resultats.cfm?Lang=E&TABID=1&G=1&Geo1=&Code1=&Geo2=&Code2=&GEOCODE=24&type=0 (accessed on 15 March 2022).
- Dumas, A.; Bouchard, C.; Lindsay, L.R.; Ogden, N.H.; Leighton, P.A. Fine-scale determinants of the spatiotemporal distribution of Ixodes scapularis in Quebec (Canada). Ticks Tick-Borne Dis. 2022, 13, 101833. [Google Scholar] [CrossRef] [PubMed]
- Institut National de Santé Publique du Québec. Carte de Risque D’acquisition de la Maladie de Lyme Selon les Municipalités du Québec. 2021. Available online: https://www.inspq.qc.ca/sites/default/files/documents/zoonoses/carte_risque_acquisition_lyme2021.pdf (accessed on 15 March 2022).
- Institut National de Santé Publique du Québec. Résultats de Surveillance de la Maladie de Lyme: Année 2019. 2020. Available online: https://www.inspq.qc.ca/zoonoses/maladie-de-lyme/resultats-de-surveillance-2019 (accessed on 8 February 2022).
- Stafford, K.C., 3rd; Cartter, M.L.; Magnarelli, L.A.; Ertel, S.H.; Mshar, P.A. Temporal correlations between tick abundance and prevalence of ticks infected with Borrelia burgdorferi and increasing incidence of Lyme disease. J. Clin. Microbiol. 1998, 36, 1240–1244. [Google Scholar] [CrossRef] [PubMed] [Green Version]
- Mather, T.N.; Nicholson, M.C.; Donnelly, E.F.; Matyas, B.T. Entomologic index for human risk of Lyme disease. Am. J. Epidemiol. 1996, 144, 1066–1069. [Google Scholar] [CrossRef] [PubMed]
- Ripoche, M.; Lindsay, L.R.; Ludwig, A.; Ogden, N.H.; Thivierge, K.; Leighton, P.A. Multi-Scale Clustering of Lyme Disease Risk at the Expanding Leading Edge of the Range of Ixodes scapularis in Canada. Int. J. Environ. Res. Public Health 2018, 15, 603. [Google Scholar] [CrossRef] [PubMed] [Green Version]
- Eisen, R.J.; Eisen, L.; Ogden, N.H.; Beard, C.B. Linkages of Weather and Climate With Ixodes scapularis and Ixodes pacificus (Acari: Ixodidae), Enzootic Transmission of Borrelia burgdorferi, and Lyme Disease in North America. J. Med. Entomol. 2016, 53, 250–261. [Google Scholar] [CrossRef] [Green Version]
- Daniel, M.; Malý, M.; Danielová, V.; Kříž, B.; Nuttall, P. Abiotic predictors and annual seasonal dynamics of Ixodes ricinus, the major disease vector of Central Europe. Parasites Vectors 2015, 8, 478. [Google Scholar] [CrossRef] [PubMed] [Green Version]
- Dobson, A.D.M.; Finnie, T.J.R.; Randolph, S.E. A modified matrix model to describe the seasonal population ecology of the European tick Ixodes ricinus. J. Appl. Ecol. 2011, 48, 1017–1028. [Google Scholar] [CrossRef]
- Rodgers, S.E.; Miller, N.J.; Mather, T.N. Seasonal Variation in Nymphal Blacklegged Tick Abundance in Southern New England Forests. J. Med. Entomol. 2007, 44, 898–900. [Google Scholar] [CrossRef]
- Institut National de Santé Publique du Québec. Report on Surveillance for Lyme Disease. 2016. Available online: https://www.inspq.qc.ca/sites/default/files/publications/2417_report_surveillance_lyme_disease_2016.pdf (accessed on 5 February 2021).
- ECDC. Data Quality Monitoring and Surveillance System Evaluation—A Handbook of Methods and Applications. 2014. Available online: https://www.ecdc.europa.eu/sites/default/files/media/en/publications/Publications/Data-quality-monitoring-surveillance-system-evaluation-Sept-2014.pdf (accessed on 8 February 2022).
- Centres for Disease Control. Updated Guidelines for Evaluating Public Health Surveillance Systems. 2001. Available online: https://www.cdc.gov/mmwr/preview/mmwrhtml/rr5013a1.htm (accessed on 8 February 2022).
- Réseau des Laboratoires de Santé Publique du Canada. The laboratory diagnosis of Lyme borreliosis: Guidelines from the Canadian Public Health Laboratory Network. Can. J. Infect. Dis. Med. Microbiol. 2007, 18, 145–148. [Google Scholar] [CrossRef] [Green Version]
- QGIS Development Team. QGIS Geographic Information System. Open Source Geospatial Foundation Project. 2021. Available online: http://qgis.osgeo (accessed on 8 February 2022).
- Fletcher, R.; Fortin, M.-J. Spatial Ecology and Conservation Modeling: Applications with R; Springer International Publishing: Cham, Switzerland, 2018. [Google Scholar]
- Bates, D.; Mächler, M.; Bolker, B.; Walker, S. Fitting Linear Mixed-Effects Models Using lme4. J. Stat. Softw. 2015, 67, 1–48. [Google Scholar] [CrossRef]


| Risk Level | Criteria |
|---|---|
| Significant | At least three cases of Lyme locally acquired in the last five years |
| Present | A nymph density of at least 0.05 ticks/100 m2 Two cases of LD locally acquired in the last five years |
| Possible | Municipalities which do not meet “significant” or “present” criteria |
| Risk Level | Sensivity (%) | Specificity (%) |
|---|---|---|
| Present | 71.9 | 65.4 |
| Significant | 79.7 | 99.3 |
Publisher’s Note: MDPI stays neutral with regard to jurisdictional claims in published maps and institutional affiliations. |
© 2022 by the authors. Licensee MDPI, Basel, Switzerland. This article is an open access article distributed under the terms and conditions of the Creative Commons Attribution (CC BY) license (https://creativecommons.org/licenses/by/4.0/).
Share and Cite
Guillot, C.; Bouchard, C.; Buhler, K.; Dumas, A.; Milord, F.; Ripoche, M.; Pelletier, R.; Leighton, P.A. Sentinel Surveillance Contributes to Tracking Lyme Disease Spatiotemporal Risk Trends in Southern Quebec, Canada. Pathogens 2022, 11, 531. https://doi.org/10.3390/pathogens11050531
Guillot C, Bouchard C, Buhler K, Dumas A, Milord F, Ripoche M, Pelletier R, Leighton PA. Sentinel Surveillance Contributes to Tracking Lyme Disease Spatiotemporal Risk Trends in Southern Quebec, Canada. Pathogens. 2022; 11(5):531. https://doi.org/10.3390/pathogens11050531
Chicago/Turabian StyleGuillot, Camille, Catherine Bouchard, Kayla Buhler, Ariane Dumas, François Milord, Marion Ripoche, Roxane Pelletier, and Patrick A. Leighton. 2022. "Sentinel Surveillance Contributes to Tracking Lyme Disease Spatiotemporal Risk Trends in Southern Quebec, Canada" Pathogens 11, no. 5: 531. https://doi.org/10.3390/pathogens11050531