Article

Physiologically Based Pharmacokinetic Modeling of Metoprolol Enantiomers and α-Hydroxymetoprolol to Describe CYP2D6 Drug-Gene Interactions

1
Clinical Pharmacy, Saarland University, 66123 Saarbrücken, Germany
2
Dr. Margarete Fischer-Bosch—Institute of Clinical Pharmacology, 70376 Stuttgart, Germany
3
Department of Internal Medicine III, Cardiology, Angiology, Intensive Care Medicine, Saarland University Medical Center and Saarland University Faculty of Medicine, 66421 Homburg, Germany
4
Institute for Medical Engineering and Science, Massachusetts Institute of Technology, Cambridge, MA 02139, USA
5
Departments of Clinical Pharmacology, Pharmacy and Biochemistry, University of Tübingen, 72076 Tübingen, Germany
6
Cluster of Excellence iFIT (EXC2180) “Image-Guided and Functionally Instructed Tumor Therapies”, University of Tübingen, 72076 Tübingen, Germany
*
Author to whom correspondence should be addressed.
Pharmaceutics 2020, 12(12), 1200; https://doi.org/10.3390/pharmaceutics12121200
Submission received: 10 November 2020 / Revised: 2 December 2020 / Accepted: 5 December 2020 / Published: 11 December 2020
(This article belongs to the Special Issue Applications of Physiologically-Based Pharmacokinetic (PBPK) Modeling)

Abstract

:
The beta-blocker metoprolol (the sixth most commonly prescribed drug in the USA in 2017) is subject to considerable drug–gene interaction (DGI) effects caused by genetic variations of the CYP2D6 gene. CYP2D6 poor metabolizers (5.7% of US population) show approximately five-fold higher metoprolol exposure compared to CYP2D6 normal metabolizers. This study aimed to develop a whole-body physiologically based pharmacokinetic (PBPK) model to predict CYP2D6 DGIs with metoprolol. The metoprolol (R)- and (S)-enantiomers as well as the active metabolite α-hydroxymetoprolol were implemented as model compounds, employing data of 48 different clinical studies (dosing range 5–200 mg). To mechanistically describe the effect of CYP2D6 polymorphisms, two separate metabolic CYP2D6 pathways (α-hydroxylation and O-demethylation) were incorporated for both metoprolol enantiomers. The good model performance is demonstrated in predicted plasma concentration–time profiles compared to observed data, goodness-of-fit plots, and low geometric mean fold errors of the predicted AUClast (1.27) and Cmax values (1.23) over all studies. For DGI predictions, 18 out of 18 DGI AUClast ratios and 18 out of 18 DGI Cmax ratios were within two-fold of the observed ratios. The newly developed and carefully validated model was applied to calculate dose recommendations for CYP2D6 polymorphic patients and will be freely available in the Open Systems Pharmacology repository.

1. Introduction

Metoprolol is one of the most frequently administered beta-blockers in the U.S. with well over 50 million total prescriptions per year [1]. It is used in the treatment of hypertension, coronary artery disease, heart failure, and arterial fibrillation [2]. Metoprolol is listed by the U.S. Food and Drug Administration (FDA) as a moderately sensitive substrate for clinical drug-drug interaction (DDI) studies as it is predominantly metabolized by cytochrome P450 2D6 (CYP2D6) [3].
CYP2D6 is an important drug metabolizing enzyme which is estimated to contribute to the metabolism of 15–25% of all clinically used drugs [4,5]. The gene encoding CYP2D6 is subject to different genetic variations, ranging from null alleles to several-fold amplification [5], resulting in considerable phenotypical interindividual differences in CYP2D6-dependent drug metabolism [6]. The main purpose of the CYP2D6 activity score (AS) is to translate a patients’ CYP2D6 genotype to the corresponding phenotype [7]. For this, CYP2D6 alleles are assigned a value indicating no (0), decreased (0.25 or 0.5), normal function (1), or a copy number variation of a normal function allele (2). However, as this assignment is based on semiquantitative observations, an activity score of 0.5 does not necessarily imply a reduction of enzymatic activity by 50% [6,8]. Nevertheless, the activity score has been shown to correlate well with metoprolol oral clearance in vivo [9]. Yet, considerable interindividual variability in metoprolol plasma concentrations, caused by genetic components independent of the CYP2D6 genotype, such as the rs5758550 SNP, has been observed [9,10].
Metoprolol is a BCS Class I drug, characterized by high permeability and high solubility. After its rapid absorption, metoprolol undergoes extensive first-pass metabolism, reducing its bioavailability to 40% in CYP2D6 normal metabolizers (NMs), whereas bioavailability approaches 100% in poor metabolizers (PMs) [11]. Only 12% of metoprolol are bound to plasma proteins, primarily albumin [12]. O-demethylation, α-hydroxylation, and N-dealkylation by CYP2D6 and, to lesser extents, CYP2B6, CYP2C9, and CYP3A4, are described as the pathways of metoprolol metabolism [13,14]. Of the major metabolites, α-hydroxymetoprolol is of particular clinical interest, as it is pharmacologically active, exhibiting 10% of the β1-blocking activity of metoprolol [15], and it is almost exclusively formed via CYP2D6 [16]. Therefore, α-hydroxymetoprolol/metoprolol urinary metabolic ratios are employed for CYP2D6 phenotyping [17]. Overall, CYP2D6 is estimated to be responsible for 80% of metoprolol metabolism in normal metabolizers [14]. Depending on the CYP2D6 phenotype, only 1.5–12% of orally administered metoprolol are excreted unchanged in urine [18].
Metoprolol is a chiral molecule, marketed as a racemic mixture of (R)- and (S)-metoprolol, even though its enantiomers differ in their pharmacodynamic and pharmacokinetic properties. The (S)-enantiomer has been shown to be 33-fold more potent in blocking β1-adrenoceptors in rats than the (R)-enantiomer [19]. Moreover, in ultrarapid metabolizers (UMs) and normal metabolizers, but not in poor metabolizers, the (S)-metoprolol area under the plasma concentration–time curve (AUC) is significantly higher than the AUC of (R)-metoprolol, showing the enantiopreference of CYP2D6 towards the (R)-enantiomer [18,20]. The distribution of CYP2D6 genotypes varies substantially between ethnicities. For instance, 5.7% of the US and 0.9% of Middle Eastern or Oceanian populations were found to be poor metabolizers (AS = 0), whereas the prevalence of ultrarapid metabolizers (AS > 2) was 2.2% in the US and 11.2% in Middle Eastern or Oceanian populations [21,22]. Interestingly, the reduced-function CYP2D6*10 allele occurs more often in East Asian populations than the CYP2D6*1 allele (42% vs. 34%), which results in an overall decreased CYP2D6 activity compared to other populations [23].
Previously published metoprolol PBPK models were either based on traditional CYP2D6 phenotypes [24,25] or did not take CYP2D6 DGIs into consideration [26,27]. Moreover, none of the previously published metoprolol PBPK models incorporated the metoprolol (R)- and (S)-enantiomers to describe the enantioselective metabolism via CYP2D6.
This study aimed to develop and qualify a novel, whole-body physiologically based pharmacokinetic (PBPK) model of metoprolol to describe the effects of the different CYP2D6 genotypes and the resulting activity scores on the pharmacokinetics of metoprolol. The resulting drug–gene interaction (DGI) PBPK model includes (R)- and (S)-metoprolol with their specific CYP2D6 activity score-dependent metabolism, as well as the metabolite α-hydroxymetoprolol. In addition, the established model was applied to generate metoprolol dose adaptations for patients with different CYP2D6 activity scores and these adaptations were compared to a current guideline [28]. The model was developed as a whole-body PBPK model to allow future model applications such as DDI modeling, model scaling to special populations or PBPK-PD modeling. The final PBPK model will be publicly available in the Open Systems Pharmacology (OSP) repository (www.open-systems-pharmacology.org) [29] as a clinical research tool, and the Supplementary Materials to this article provide a detailed and transparent evaluation of the model performance to be used as a reference manual and evaluation report.

2. Materials and Methods

2.1. Software

PBPK modeling, model parameter optimization (Monte Carlo algorithm), and local sensitivity analysis were performed using PK-Sim® and MoBi® (Open Systems Pharmacology Suite 9.1). Published clinical study data were digitized with GetData Graph Digitizer 2.26.0.20 (© S. Fedorov) according to best practices [30]. Pharmacokinetic parameters (area under the plasma concentration-time curve from the time of the first concentration measurement to the time of the last concentration measurement (AUClast) and maximum plasma concentration (Cmax)) and model performance metrics (mean relative deviation (MRD), geometric mean fold error (GMFE), DGI AUClast, and Cmax ratios) were calculated using Python (version 3.7.4, Python Software Foundation, Wilmington, DE, USA) in Visual Studio Code (version 1.49.1, Microsoft Corporation, Redmond, WA, USA). Plots were also generated using Python in Visual Studio Code.

2.2. PBPK Model Building

The PBPK model building was initiated with an extensive literature search to gather information on metoprolol absorption, distribution, metabolism, and excretion (ADME) processes, to obtain physicochemical data and to collect clinical studies of the intravenous and oral administration of metoprolol, in single- and multiple-dose regimens, performed in healthy individuals. Subsequently, plasma concentration-time profiles from the published clinical studies were digitized and split into a training dataset, for model building, and a test dataset, for model evaluation. Studies for model training were selected to include different routes of administration (intravenous and oral), a wide range of administered doses, single- and multiple-dose regimens, as well as stratification for CYP2D6 genotype or activity score. The training dataset was used for estimation of model input parameters which could not be obtained from literature.
The metoprolol PBPK model was built in a stepwise approach. First, appropriate quantitative structure-activity relationship (QSAR) methods to estimate the cellular permeabilities and partition coefficients (e.g., Rodgers & Rowland, Berezhkovskiy) were selected, by fitting simulations of intravenous metoprolol administration to their observed data. Subsequently, studies of orally administered metoprolol in poor metabolizers were used to optimize parameters independent of CYP2D6 metabolism. A single study in which metoprolol was administered as an oral solution was used to optimize the intestinal permeability for both metoprolol enantiomers [31]. Finally, (R)- and (S)-enantiomer CYP2D6 catalytic rate constant (kcat) values were optimized for studies of the training dataset where the volunteers were either normal metabolizers or not phenotyped. Racemic metoprolol plasma concentration–time profiles were modeled by the administration of racemic doses of metoprolol (50% (R)- and 50% (S)-metoprolol and the use of a customized “observer” within PK-Sim®, which adds up the simulated (R)- and (S)-metoprolol plasma concentrations to directly display the racemic metoprolol plasma concentration–time profiles. Figure 1 provides an overview of metoprolol metabolic pathways.
Supplementary Table S2.2.1 contains information concerning all studies included in the training and test datasets. Supplementary Table S4.0.1 provides system-dependent parameters with technical details on the implementation of CYP2D6.

2.3. DGI Modeling

The metoprolol clearance processes via CYP2D6 were implemented using Michaelis–Menten kinetics according to Equation (1) [32]:
v   =   v max   ·   S K m   +   S   =   k cat   ·   E   ·   S K m   +   S
where v = reaction velocity, vmax = maximum reaction velocity, S = free substrate concentration, Km = Michaelis-Menten constant, kcat = catalytic rate constant, and E = enzyme concentration.
CYP2D6 Michaelis–Menten constant (Km) values were kept constant over the whole range of modeled activity scores. CYP2D6 kcat values were optimized for each activity score separately. CYP2D6 poor metabolizers (AS = 0) were assumed to show no CYP2D6 activity (0%), whereas populations with two wildtype alleles (AS = 2) were used as reference (100%) to calculate relative kcat values according to Equation (2).
k cat ,   rel ,   AS = i   =   k cat ,   AS   =   i k cat ,   AS   =   2 × 100 %
where kcat, rel, AS=i = kcat for the investigated activity score relative to AS = 2, kcat, AS=i = kcat for the investigated activity score, and kcat, AS = 2 = kcat for AS = 2.
The assignment of activity scores was carried out according to [33] as described in Table 1.

2.4. PBPK Model Evaluation

The performance of the metoprolol PBPK model regarding the prediction of racemic metoprolol, its enantiomers and α-hydroxymetoprolol was evaluated using graphical and statistical methods. First, predicted plasma concentration-time profiles were compared graphically with the profiles measured in the respective clinical studies by plotting model population predictions (arithmetic mean ± SD) together with observed data points. For this purpose, virtual populations of 100 individuals were created based on the population characteristics stated in the respective publication. System-dependent parameters, such as age, weight, height, organ weights, blood flow rates, tissue composition, etc., were varied by the implemented algorithm in PK-Sim. A comprehensive description of virtual populations is given in Supplementary Section S1.1.3. Second, the plasma concentration values of all studies predicted using the arithmetic mean of the population were plotted against their corresponding observed values in goodness-of-fit plots.
In addition, model performance was evaluated by a comparison of predicted to observed AUC values and Cmax values. All AUC values (predicted as well as observed) were calculated from the time of the first concentration measurement to the time of the last concentration measurement (AUClast).
As quantitative measures of the model performance, the MRD of all predicted plasma concentrations (Equation (3)) and the GMFE of all predicted AUClast and Cmax values (Equation (4)) were calculated.
MRD   =   10 x ;   x   =   i = 1 k   ( log 10 c i ^   -   log 10 c i ) 2 k
where c i ^ = predicted plasma concentration that corresponds to the i-th observed concentration, c i = i-the observed plasma concentration, and k = number of observed values.
GMFE   =   10 x ;   x   =   i = 1 m | log 10   ( ρ i ^ ρ i ) |   m
where ρ i ^ = predicted AUClast or Cmax value of study i, ρ i = corresponding observed AUClast or Cmax value of study i, and m = number of studies.
A detailed description of the local sensitivity analysis is provided in Supplementary Section S1.2.2.

2.5. DGI Modeling Evaluation

The DGI modeling performance was assessed by a comparison of predicted versus observed plasma concentration–time profiles of racemic metoprolol, its enantiomers, and α-hydroxymetoprolol. Furthermore, predicted DGI AUClast ratios (Equation (5)) and DGI Cmax ratios (Equation (6)) were evaluated to assess, if the impact of the observed DGIs was well described by the model.
DGI   AUC last     ratio   =   AUC last ,   DGI   AUC last ,   reference  
where AUClast, DGI = AUClast of variant activity score or phenotype, while AUClast, reference = AUClast of AS = 2 or normal metabolizer phenotype.
DGI   C max     ratio   =   C max ,   DGI   C max ,   reference  
where Cmax, DGI = Cmax of variant activity score or phenotype, Cmax, reference = Cmax of AS = 2 or normal metabolizer phenotype. As a quantitative measure of the prediction accuracy, GMFE values of the predicted DGI AUClast ratios and DGI Cmax ratios were calculated according to Equation (4).

3. Results

3.1. Metoprolol PBPK Model Development and Evaluation

A total of 48 clinical studies concerning the intravenous or oral administration of metoprolol were used in the model development process, with doses ranging from 5 to 200 mg metoprolol in single or multiple dose regimens. Of the 48 studies, nine included measurements of the metabolite α-hydroxymetoprolol and 16 studies included measurements of the metoprolol enantiomers.
Metoprolol enantiomers were modeled as stand-alone compounds, to allow for the implementation of enantioselective CYP2D6 metabolism. The four α-hydroxymetoprolol diastereomers were modeled as one single compound, due to a lack of enantiomeric differentiation in the published clinical data.
For both metoprolol enantiomers, enantioselective metabolism via CYP2D6, an unspecific hepatic clearance process, as well as passive glomerular filtration were implemented. Each of the metoprolol enantiomers can be metabolized via CYP2D6 to produce either α-hydroxymetoprolol or to generate other metabolites such as O-demethylmetoprolol which were not included as separately modeled compounds. The metabolite α-hydroxymetoprolol is eliminated via an unspecific hepatic clearance process. Figure 1 depicts a schematic overview of the implemented metabolic pathways. The drug-dependent model input parameters of the metoprolol enantiomers are presented in Table 2. The drug-dependent parameters of the α-hydroxymetoprolol model are provided in Supplementary Table S2.4.3.
Overall, the PBPK model accurately described and predicted the plasma concentration–time profiles of metoprolol and α-hydroxymetoprolol after intravenous and oral administration, as illustrated in Figure 2. This figure presents population predictions of selected clinical studies from the test and training datasets. Plots documenting the model performance for all 48 clinical studies included in this analysis are provided in Supplementary Sections S2.5 and S3.2. All simulated plasma profiles are in good agreement with the observed metoprolol racemate, (R)-, and (S)-metoprolol as well as α-hydroxymetoprolol plasma concentrations.
Goodness-of-fit plots showing plasma concentrations, AUClast and Cmax values, respectively, are presented in Figure 3. Predicted plasma concentrations were predominantly (88.3%) within two-fold of the corresponding observed concentrations. Furthermore, a total of 72 out of 75 of the predicted AUClast values (several studies included measurements of multiple analytes) and 64 out of 66 of the predicted Cmax values were within the two-fold acceptance criterion. The metoprolol model GMFE values were 1.27 (range 1.01–2.94) for the predicted AUClast values, and 1.23 (range 1.00–2.97) for the predicted Cmax values. The MRD values and predicted to observed AUClast and Cmax ratios for all 48 clinical studies and all measured analytes are provided in Supplementary Tables S2.6.4–S2.6.7.
The local sensitivity analysis of a simulation of 100 mg metoprolol tartrate administered orally (standard dose) revealed that the model predictions were most sensitive to the values of (R)- and (S)-metoprolol fraction unbound (fu), which were gathered from literature and used unmodified as model input parameters. Setting a sensitivity threshold of 0.5 (100% parameter value change = 50% change of predicted AUC), the only other parameter value that the model predictions were sensitive to is the CYP2D6 (R)-metoprolol → O-demethylmetoprolol catalytic rate constant (optimized). A comprehensive visual and quantitative presentation of the sensitivity analysis results can be found in Supplementary Section S2.6.7.

3.2. Metoprolol CYP2D6 DGI Model Development and Evaluation

The model training dataset included 11 plasma concentration-time profiles from studies that reported the CYP2D6 activity scores of their study subjects, ranging from 0 (poor metabolizer) to 3 (ultrarapid metabolizer). These studies were utilized to optimize kcat, rel values for the different CYP2D6 activity scores. The identified values for both CYP2D6 pathways and both metoprolol enantiomers are given in Table 3.
Of all 48 analyzed clinical profiles, 15 metoprolol plasma concentration–time profiles belong to studies that stratified their subjects by CYP2D6 activity score or phenotype. These studies either provided the activity score for the investigated population (three studies), the CYP2D6 phenotype (two studies), or comprehensive information on the CYP2D6 genotype of all individuals (10 studies). To simulate the latter studies, mean activity scores were calculated according to current recommendations [33]. The good performance of the final metoprolol DGI model is demonstrated in Figure 4, showing predicted metoprolol plasma concentration-time profiles of populations with different CYP2D6 activity scores, compared with their corresponding observed data. Plots documenting the model performance for all 15 metoprolol DGI profiles found in the literature are provided in Supplementary Section S3.2.
Predicted DGI AUClast and Cmax ratios were in very good agreement with the observed DGI ratios, demonstrating that the impact of the different CYP2D6 activity scores on the pharmacokinetics of racemic metoprolol, (R)-, and (S)-metoprolol and the metabolite α-hydroxymetoprolol was well described by the model. Specifically, 18 out of 18 AUClast and 17 out of 18 Cmax ratios were within the prediction success limits suggested by Guest et al. adopted for DGI evaluations [52], as visualized in Figure 5. Predicted DGI AUClast ratios show an overall GMFE of 1.21 (range 1.00–1.69), while predicted DGI Cmax ratios showed an overall GMFE of 1.21 (range 1.00–1.56). The predicted and observed ratios and corresponding predicted to observed DGI AUClast and Cmax ratios for all studies are provided in Supplementary Table S3.3.2.

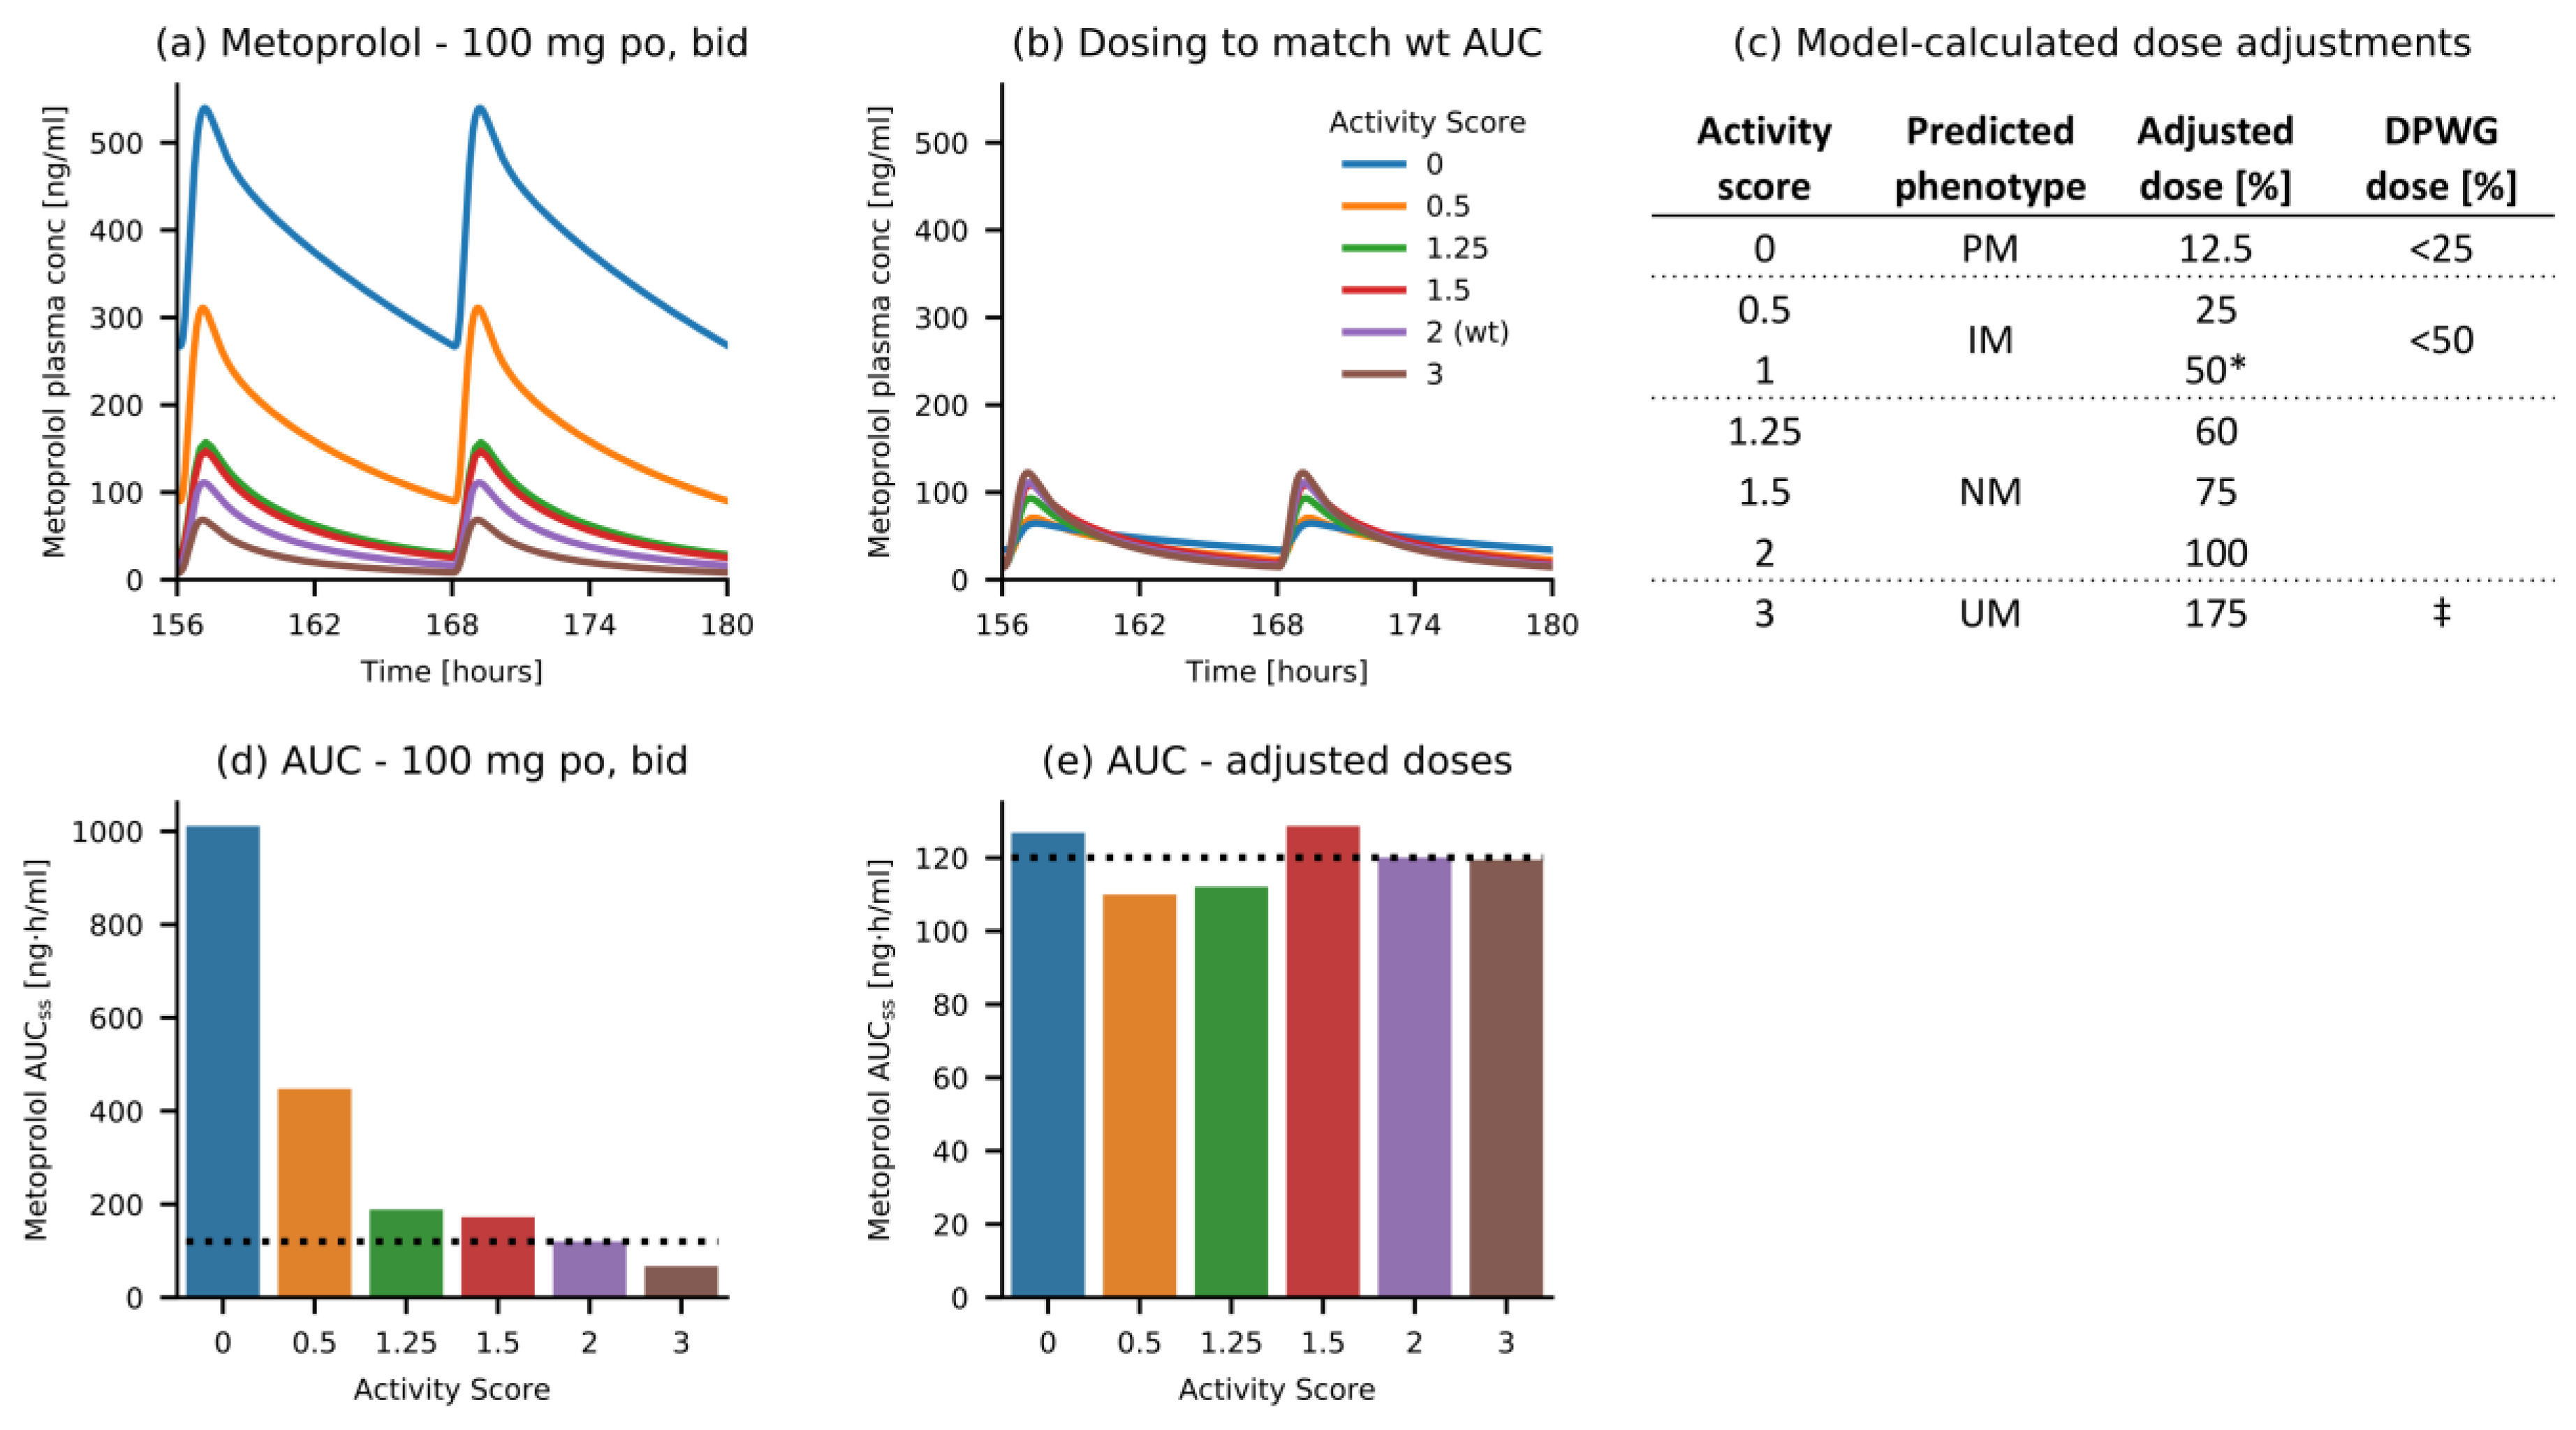
3.3. Metoprolol Dose Adaptation for CYP2D6 DGIs

The developed metoprolol CYP2D6 DGI model was applied to calculate dose adaptations for individuals with different CYP2D6 activity scores. Simulated doses for “variant” activity scores were adapted in a stepwise approach until the AUC during steady-state (AUCss) matched the AUCss (±10%) of a 100 mg twice daily metoprolol regimen in AS = 2 (wildtype) subjects. Predictions of plasma concentration-time profiles for individuals with different activity scores, all administered with 100 mg of metoprolol tartrate twice daily, are shown in Figure 6a. Simulations for different activity scores after dose adaptation are shown in Figure 6b. The resulting model-based dose adaptations compared to the Dutch Pharmacogenetics Working Group (DPWG) guideline recommendations for metoprolol [28] are shown in Figure 6c. The corresponding AUCss values before (Figure 6d) and after (Figure 6e) dose adaptation are visualized in the lower panel.

4. Discussion

In this study, a whole-body PBPK model of metoprolol, including separate representations of its (R)- and (S)-enantiomers and the metabolite α-hydroxymetoprolol, was built and carefully evaluated to dynamically predict drug plasma concentrations over a wide dosing range (5–200 mg). Moreover, the model was extended to describe the impact of different CYP2D6 activity scores on the pharmacokinetics of racemic metoprolol, (R)-metoprolol, (S)-metoprolol, and α-hydroxymetoprolol.
Previously published metoprolol PBPK models were mostly developed for different applications. Indeed, two models investigated the effects of pregnancy [24,27] and one model analyzed the effects of investigational formulations [26]. A fourth published minimal PBPK-PD model of metoprolol was built to describe the impact of CYP2D6 DGIs on metoprolol plasma concentration profiles and heart rate. The DGI was implemented for three “traditional” phenotypes (poor, normal and ultrarapid metabolizers). This model, however, did not further differentiate the CYP2D6 activity between AS = 0 and AS = 2 [25]. Our model is the first to integrate current knowledge on CYP2D6 activity to accurately predict the impact of CYP2D6 DGIs over a wide range of activity scores. Moreover, this model is the first PBPK model of metoprolol to include metoprolol enantiomers (and enantiospecific CYP2D6 metabolism), as well as the active metabolite α-hydroxymetoprolol.
The limitations of the presented model are related to the incompleteness of published knowledge and data. Our model focused on CYP2D6 activity scores as opposed to CYP2D6 genotypes. Grouping genotypes by activity scores was necessary, due to the limited amount of data available on the enzyme kinetics of the >100 different CYP2D6 isoforms [53]. Consequently, the model is not able to further differentiate between different genotypes within the same activity score group (e.g., between *1/*1, *1/*2, and *2/*2, which all belong to the AS = 2 group) [7]. The primary aim of this model, namely the characterization, description, and prediction of metoprolol exposure in individuals with CYP2D6 polymorphisms to enable model-informed precision dosing, was met [54]. As more data (in vitro and clinical) regarding the CYP2D6 activity of the different individual genotypes emerge, the model can be easily extended for an even finer graduation of the CYP2D6 activity, to differentiate between genotypes within the same activity score group.
In addition, although the different CYP2D6 metabolic reactions (O-demethylation and α-hydroxylation of both (R)-metoprolol and (S)-metoprolol) were successfully implemented using Km values from in vitro literature [39], these Km values were assumed to be the same across all CYP2D6 activity scores. Using metoprolol as the substrate, only three genotype-specific in vitro Km values (*1, *2 and *17 isoforms), could be obtained from literature (metoprolol α-hydroxylation and O-demethylation), showing a slightly higher Km for the *17 allele (AS = 0.5) [8]. Other studies reported no clear trend of Km values using a wide range of CYP2D6 substrates to investigate the enzyme kinetics of the reduced-function alleles *10 and *17 in comparison to the wildtype *1 allele [55]. Hence, due to an insufficient amount of data, the same Km values were used in the model across all activity scores. The final optimized kcat, rel values increased with increasing activity scores, reflecting an apparent correlation of metoprolol oral clearance with the CYP2D6 activity score [9]. Plasma concentration–time profiles and DGI AUClast and Cmax ratios of all analyzed clinical studies were well described by the final model.
The enzymes CYP2B6, CYP2C9 and CYP3A4 have also been found to metabolize metoprolol in vitro [14]. However, the fractions metabolized by these CYP enzymes in vivo, or which of those enzymes is the second most relevant enzyme for metoprolol metabolism besides CYP2D6, is not known (clinical DDI studies with fluconazole, ketoconazole or other strong CYP3A4 inhibitors could not be found in the literature). In two of the previously published metoprolol PBPK models, a CYP3A4-dependent clearance process was implemented [24,25]. Yet, the formation of O-demethylmetoprolol and α-hydroxymetoprolol in human liver microsomes were less impacted by inhibition of CYP3A4 than by inhibition of CYP2C9 or CYP2B6 [14]. However, as CYP2D6 is estimated to account for >70% of metoprolol oral clearance [43], the impact of variations in CYP2B6, CYP2C9 or CYP3A4 enzymatic activity on metoprolol PK was considered negligible. Moreover, model input parameters such as CYP2B6, CYP2C9, or CYP3A4 Km and kcat, that would be necessary for a mechanistic implementation of the respective metabolic pathways, are not available in the literature. Consequently, the authors decided to incorporate an unspecific hepatic clearance process in addition to the CYP2D6-dependent pathways.
The final metoprolol PBPK model was applied to generate dose adaptations for populations with different CYP2D6 activity scores. While it is generally acknowledged that metoprolol exposure is mainly determined by the CYP2D6 activity score [56,57], there is no consensus in the literature on whether increased metoprolol plasma concentrations in poor and intermediate metabolizers result in a higher incidence of adverse drug reactions [58,59,60,61].
The model-based dose recommendations calculated for CYP2D6 DGIs were well in line with the recommendations provided by the DPWG [28], except for the poor metabolizers, where this analysis suggests even lower doses than the Dutch guidance document. Adapting a patients’ metoprolol dose based on the CYP2D6 activity score will decrease the occurrence of adverse drug reactions or therapy failure [56,59] and consequently help to provide more safe and efficient personalized dosing regimens. Future possible applications of the newly developed PBPK model include the prediction of CYP2D6 DDI effects on metoprolol pharmacokinetics or scaling of the metoprolol model to special populations such as pediatric patients, geriatric patients, or patients with renal or hepatic impairment.

5. Conclusions

A whole-body parent-metabolite PBPK model of metoprolol and its enantiomers was developed to predict racemic metoprolol, (R)-metoprolol, (S)-metoprolol, and α-hydroxymetoprolol plasma concentration–time profiles. The model focused on CYP2D6 activity score-dependent metabolism and has been utilized to calculate dose adaptations in populations with various CYP2D6 activities and genotypes. The Supplementary Materials of this manuscript provide an in-depth documentation and evaluation of the final model and the PBPK model file will be made publicly available in the OSP repository. The model can be applied to generate dose adaption for patients with different CYP2D6 activity scores, to complement and refine the recommendations by existing guidelines and facilitate personalized medicine. Due to the mechanistic implementation of the human physiology and important pharmacokinetic pathways, the model allows for knowledge-based scaling to special populations and can serve as the basis for future investigations of CYP2D6 DDI scenarios.

Supplementary Materials

The following are available online at https://www.mdpi.com/1999-4923/12/12/1200/s1, Table S2.2.1: Metoprolol study table, Table S2.3.2: (R)-and(S)-metoprolol drug-dependent parameters, Table S2.4.3: α-hydroxymetoprolol drug-dependent parameters, Figure S2.5.1: Metoprolol plasma concentrations. Model predictions of metoprolol and its metabolite α-hydroxymetoprolol plasma concentration-time profiles of intravenous studies of the training and test datasets, compared to observed data (semilogarithmic representation), Figure S2.5.2: Metoprolol plasma concentrations. Model predictions of metoprolol and its metabolite α-hydroxymetoprolol plasma concentration-time profiles of oral studies of the training and test datasets, compared to observed data (semilogarithmic representation), Figure S2.5.3: Metoprolol plasma concentrations, Figure S2.5.4: Metoprolol enantiomers plasma concentrations. Model predictions of (R)-metoprolol and (S)-metoprolol plasma concentration-time profiles of oral studies of the trainingand test datasets, compared to observed data (semilogarithmic representation), Figure S2.5.5: Metoprolol plasma concentrations, Figure S2.5.6: Metoprolol plasma concentrations, Figure S2.5.7: Metoprolol plasma concentrations, Figure S2.5.8: Metoprolol enantiomers plasma concentrations, Figure S2.6.9: Plasma concentrations goodness-of-fit plots of the final metoprolol model, Figure S2.6.10: Plasmaconcentrationsgoodness-of-fitplotsofthefinalmetoprololmodel, Table S2.6.4: Mean relative deviation of plasma concentration predictions (metoprolol, αhydroxymetoprolol), Table S2.6.5: Mean relative deviation of plasma concentration predictions ((R)-metoprolol, (S)-metoprolol), Figure S2.6.11: AUClast values goodness-of-fit plots for the final metoprolol model, Figure S2.6.12: AUClast goodness-of-fit plots for the final metoprolol model, Figure S2.6.13: Cmax values goodness-of-fit plots for the final metoprolol model, Figure S2.6.14: AUClast goodness-of-fit plots for the final metoprolol model, Table S2.6.6: Predicted and observed AUClast and Cmax values (metoprolol, α-hydroxymetoprolol), Table S2.6.7: Predictedandobserved AUClast and Cmax values ((R)-metoprolol,(S)-metoprolol), Figure S2.6.15: Sensitivity analysis of the (R)-metoprolol (upper panel) and (S)-metoprolol (lower panel) model, Table S3.1.1: kcat, rel values for the different CYP2D6 activity scores, Figure S3.2.1: Metoprolol plasma concentrations of the modeled CYP2D6 drug-gene interaction, Figure S3.2.2: Metoprolol plasma concentrations of the modeled CYP2D6 drug-gene interaction, Figure S3.2.3: Metoprolol plasma concentrations of the modeled CYP2D6 drug-gene interaction, Figure S3.2.4: Metoprolol plasma concentrations of the modeled CYP2D6 drug-gene interaction, Figure S3.2.5: Metoprolol plasma concentrations of the modeled CYP2D6 drug-gene interaction, Figure S3.2.6: Metoprolol plasma concentrations of the modeled CYP2D6 drug-gene interaction., Figure S3.2.7: Metoprolol plasma concentrations of the modeled CYP2D6 drug-gene interaction, Figure S3.2.8: Metoprolol plasma concentrations of the modeled CYP2D6 drug-gene interaction, Figure S3.2.9: Metoprolol plasma concentrations of the modeled CYP2D6 drug-gene interaction, Figure S3.2.10: Metoprolol plasma concentrations of the modeled CYP2D6 drug-gene interaction, Figure S3.2.11: Metoprolol plasma concentrations of the modeled CYP2D6 drug-gene interaction, Figure S3.2.12: Metoprolol plasma concentrations of the modeled CYP2D6 drug-gene interaction, Figure S3.3.13: Predicted versus observed metoprolol DGI ratios. Comparison of predicted versus observed AUClast ratios (a) and Cmax ratios (b) for metoprolol CYP2D6 DGI-studies, Table S3.3.2: Geometric mean fold error of predicted metoprolol DGI AUClast andCmax ratios, Table S4.0.1: System-dependent parameters.

Author Contributions

Conceptualization, S.R., N.H., D.S., and T.L.; funding acquisition, M.S. and T.L.; investigation, S.R., J.-G.W., and T.L.; visualization, S.R.; writing—original draft, S.R., D.S., N.H., and T.L.; writing—review and editing, S.R., J.-G.W., D.S., N.H., F.M., M.S., and T.L. All authors have read and agreed to the published version of the manuscript.

Funding

F.M. is supported by Deutsche Gesellschaft für Kardiologie (DGK), and Deutsche Forschungsgemeinschaft (SFB TRR219). M.S. was supported by the Robert Bosch Stiftung (Stuttgart, Germany), the European Commission Horizon 2020 UPGx grant 668353, a grant from the German Federal Ministry of Education and Research (BMBF 031L0188D), and the Deutsche Forschungsgemeinschaft (DFG, German Research Foundation) under Germany’s Excellence Strategy—EXC 2180—390900677. T.L. was supported by the German Federal Ministry of Education and Research (BMBF, Horizon 2020 INSPIRATION grant 643271), under the frame of ERACoSysMed. The APC was funded by the German Research Foundation (DFG) and Saarland University within the funding program “Open Access Publishing”.

Conflicts of Interest

J.-G.W. is an employee of Boehringer Ingelheim Pharma GmbH & Co. KG. F.M. received scientific support and speaker honoraria from Bayer, Boehringer Ingelheim, Medtronic and ReCor Medical. S.R., D.S., N.H., M.S. and T.L. declare that they have no conflict of interest. The funders had no role in the design of the study; in the collection, analyses, or interpretation of data; in the writing of the manuscript, or in the decision to publish the results.

References

  1. ClinCalc LLC. ClinCalc DrugStats Database. Available online: https://clincalc.com/Drugstats/ (accessed on 10 September 2020).
  2. Novartis Pharmaceuticals Corporation Lopressor® Tablet and Injection—Prescribing Information. Available online: https://www.accessdata.fda.gov/drugsatfda_docs/label/2008/017963s062,018704s021lbl.pdf (accessed on 10 September 2020).
  3. U.S. Food and Drug Administration Drug Development and Drug Interactions: Table of Substrates, Inhibitors and Inducers. FDA. Available online: https://www.fda.gov/drugs/drug-interactions-labeling/drug-development-and-drug-interactions-table-substrates-inhibitors-and-inducers (accessed on 10 September 2020).
  4. Michaels, S.; Wang, M.Z. The Revised Human Liver Cytochrome P450 “Pie”: Absolute Protein Quantification of CYP4F and CYP3A Enzymes Using Targeted Quantitative Proteomics. Drug Metab. Dispos. 2014, 42, 1241–1251. [Google Scholar] [CrossRef] [PubMed] [Green Version]
  5. Zanger, U.M.; Schwab, M. Cytochrome P450 enzymes in drug metabolism: Regulation of gene expression, enzyme activities, and impact of genetic variation. Pharmacol. Ther. 2013, 138, 103–141. [Google Scholar] [CrossRef] [PubMed]
  6. Gaedigk, A.; Dinh, J.C.; Jeong, H.; Prasad, B.; Leeder, J.S. Ten years’ experience with the CYP2D6 activity score: A perspective on future investigations to improve clinical predictions for precision therapeutics. J. Pers. Med. 2018, 8, 15. [Google Scholar] [CrossRef] [PubMed] [Green Version]
  7. Gaedigk, A.; Simon, S.D.; Pearce, R.E.; Bradford, L.D.; Kennedy, M.J.; Leeder, J.S. The CYP2D6 activity score: Translating genotype information into a qualitative measure of phenotype. Clin. Pharmacol. Ther. 2008, 83, 234–242. [Google Scholar] [CrossRef]
  8. Bapiro, T.E.; Hasler, J.A.; Ridderström, M.; Masimirembwa, C.M. The molecular and enzyme kinetic basis for the diminished activity of the cytochrome P450 2D6.17 (CYP2D6.17) variant: Potential implications for CYP2D6 phenotyping studies and the clinical use of CYP2D6 substrate drugs in some African populations. Biochem. Pharmacol. 2002, 64, 1387–1398. [Google Scholar] [CrossRef]
  9. Thomas, C.D.; Mosley, S.A.; Kim, S.; Lingineni, K.; El Rouby, N.; Langaee, T.Y.; Gong, Y.; Wang, D.; Schmidt, S.O.; Binkley, P.F.; et al. Examination of Metoprolol Pharmacokinetics and Pharmacodynamics Across CYP2D6 Genotype-Derived Activity Scores. CPT Pharmacometrics Syst. Pharmacol. 2020. [Google Scholar] [CrossRef]
  10. Matthaei, J.; Brockmöller, J.; Tzvetkov, M.; Sehrt, D.; Sachse-Seeboth, C.; Hjelmborg, J.; Möller, S.; Halekoh, U.; Hofmann, U.; Schwab, M.; et al. Heritability of metoprolol and torsemide pharmacokinetics. Clin. Pharmacol. Ther. 2015, 98, 611–621. [Google Scholar] [CrossRef]
  11. Kirchheiner, J.; Heesch, C.; Bauer, S.; Meisel, C.; Seringer, A.; Goldammer, M.; Tzvetkov, M.; Meineke, I.; Roots, I.; Brockmöller, J. Impact of the ultrarapid metabolizer genotype of cytochrome P450 2D6 on metoprolol pharmacokinetics and pharmacodynamics. Clin. Pharmacol. Ther. 2004, 76, 302–312. [Google Scholar] [CrossRef]
  12. Plosker, G.L.; Clissold, S.P. Controlled Release Metoprolol Formulations. Drugs 1992, 43, 382–414. [Google Scholar] [CrossRef]
  13. Regårdh, C.G.; Johnsson, G. Clinical Pharmacokinetics of Metoprolol. Clin. Pharmacokinet. 1980, 5, 557–569. [Google Scholar] [CrossRef]
  14. Berger, B.; Bachmann, F.; Duthaler, U.; Krähenbühl, S.; Haschke, M. Cytochrome P450 enzymes involved in metoprolol metabolism and use of metoprolol as a CYP2D6 phenotyping probe drug. Front. Pharmacol. 2018, 9, 1–11. [Google Scholar] [CrossRef] [PubMed]
  15. Cerqueira, P.M.; Cesarino, E.J.; Mateus, F.H.; Mere, Y.; Santos, S.R.; Lanchote, V.L. Enantioselectivity in the steady-state pharmacokinetics of metoprolol in hypertensive patients. Chirality 1999, 11, 591–597. [Google Scholar] [CrossRef]
  16. Lennard, M.S.; Tucker, G.T.; Silas, J.H.; Woods, H.F. Debrisoquine polymorphism and the metabolism and action of metoprolol, timolol, propranolol and atenolol. Xenobiotica 1986, 16, 435–447. [Google Scholar] [CrossRef] [PubMed]
  17. Bozkurt, A.; Başçi, N.B.; Işimer, A.; Sayal, A.; Kayaalp, S.O. Metabolic ratios of four probes of CYP2D6 in Turkish subjects: A cross-over study. Eur. J. Drug Metab. Pharmacokinet. 1996, 21, 309–314. [Google Scholar] [CrossRef] [PubMed]
  18. Seeringer, A.; Brockmöller, J.; Bauer, S.; Kirchheiner, J. Enantiospecific pharmacokinetics of metoprolol in CYP2D6 ultra-rapid metabolizers and correlation with exercise-induced heart rate. Eur. J. Clin. Pharmacol. 2008, 64, 883–888. [Google Scholar] [CrossRef] [PubMed]
  19. Nathanson, J.A. Stereospecificity of beta adrenergic antagonists: R-enantiomers show increased selectivity for beta-2 receptors in ciliary process. J. Pharmacol. Exp. Ther. 1988, 245, 94–101. [Google Scholar]
  20. Blake, C.M.; Kharasch, E.D.; Schwab, M.; Nagele, P. A Meta-Analysis of CYP2D6 Metabolizer Phenotype and Metoprolol Pharmacokinetics. Clin. Pharmacol. Ther. 2013, 94, 394–399. [Google Scholar] [CrossRef] [Green Version]
  21. Gaedigk, A.; Sangkuhl, K.; Whirl-Carrillo, M.; Klein, T.; Leeder, J.S. Prediction of CYP2D6 phenotype from genotype across world populations. Genet. Med. 2017, 19, 69–76. [Google Scholar] [CrossRef] [Green Version]
  22. Del Tredici, A.L.; Malhotra, A.; Dedek, M.; Espin, F.; Roach, D.; Zhu, G.-d.; Voland, J.; Moreno, T.A. Frequency of CYP2D6 alleles including structural variants in the United States. Front. Pharmacol. 2018, 9. [Google Scholar] [CrossRef] [Green Version]
  23. Gaedigk, A. Complexities of CYP2D6 gene analysis and interpretation. Int. Rev. Psychiatry 2013, 25, 534–553. [Google Scholar] [CrossRef]
  24. Ke, A.B.; Nallani, S.C.; Zhao, P.; Rostami-Hodjegan, A.; Isoherranen, N.; Unadkat, J.D. A Physiologically Based Pharmacokinetic Model to Predict Disposition of CYP2D6 and CYP1A2 Metabolized Drugs in Pregnant Women. Drug Metab. Dispos. 2013, 41, 801–813. [Google Scholar] [CrossRef] [PubMed] [Green Version]
  25. Chetty, M.; Rose, R.H.; Abduljalil, K.; Patel, N.; Lu, G.; Cain, T.; Jamei, M.; Rostami-Hodjegan, A. Applications of linking PBPK and PD models to predict the impact of genotypic variability, formulation differences, differences in target binding capacity and target site drug concentrations on drug responses and variability. Front. Pharmacol. 2014, 5, 1–29. [Google Scholar] [CrossRef] [PubMed] [Green Version]
  26. Kim, S.; Sharma, V.D.; Lingineni, K.; Farhan, N.; Fang, L.; Zhao, L.; Brown, J.D.; Cristofoletti, R.; Vozmediano, V.; Ait-Oudhia, S.; et al. Evaluating the Clinical Impact of Formulation Variability: A Metoprolol Extended-Release Case Study. J. Clin. Pharmacol. 2019, 59, 1266–1274. [Google Scholar] [CrossRef] [PubMed]
  27. Dallmann, A.; Ince, I.; Coboeken, K.; Eissing, T.; Hempel, G. A Physiologically Based Pharmacokinetic Model for Pregnant Women to Predict the Pharmacokinetics of Drugs Metabolized Via Several Enzymatic Pathways. Clin. Pharmacokinet. 2018, 57, 749–768. [Google Scholar] [CrossRef] [PubMed]
  28. The Royal Dutch Pharmacists Association—Pharmacogenetics Working Group (DPWG) Annotation of DPWG Guideline for Metoprolol and CYP2D6. Available online: https://www.pharmgkb.org/guidelineAnnotation/PA166104995 (accessed on 22 September 2020).
  29. Lippert, J.; Burghaus, R.; Edginton, A.; Frechen, S.; Karlsson, M.; Kovar, A.; Lehr, T.; Milligan, P.; Nock, V.; Ramusovic, S.; et al. Open Systems Pharmacology Community—An Open Access, Open Source, Open Science Approach to Modeling and Simulation in Pharmaceutical Sciences. CPT Pharmacometrics Syst. Pharmacol. 2019, 8, 878–882. [Google Scholar] [CrossRef] [Green Version]
  30. Wojtyniak, J.G.; Britz, H.; Selzer, D.; Schwab, M.; Lehr, T. Data Digitizing: Accurate and Precise Data Extraction for Quantitative Systems Pharmacology and Physiologically-Based Pharmacokinetic Modeling. CPT Pharmacometrics Syst. Pharmacol. 2020, 9, 322–331. [Google Scholar] [CrossRef]
  31. Regårdh, C.G.; Borg, K.O.; Johansson, R.; Johnsson, G.; Palmer, L. Pharmacokinetic studies on the selective beta1-receptor antagonist metoprolol in man. J. Pharmacokinet. Biopharm. 1974, 2, 347–364. [Google Scholar] [CrossRef]
  32. Open Systems Pharmacology Suite Community Open Systems Pharmacology Suite Manual, Version 7.4. Available online: https://github.com/Open-Systems-Pharmacology/OSPSuite.Documentation/blob/master/OpenSystemsPharmacologySuite.pdf (accessed on 12 October 2020).
  33. Caudle, K.E.; Sangkuhl, K.; Whirl-Carrillo, M.; Swen, J.J.; Haidar, C.E.; Klein, T.E.; Gammal, R.S.; Relling, M.V.; Scott, S.A.; Hertz, D.L.; et al. Standardizing CYP 2D6 Genotype to Phenotype Translation: Consensus Recommendations from the Clinical Pharmacogenetics Implementation Consortium and Dutch Pharmacogenetics Working Group. Clin. Transl. Sci. 2020, 13, 116–124. [Google Scholar] [CrossRef] [Green Version]
  34. Kim, S.; Chen, J.; Cheng, T.; Gindulyte, A.; He, J.; He, S.; Li, Q.; Shoemaker, B.A.; Thiessen, P.A.; Yu, B.; et al. PubChem 2019 update: Improved access to chemical data. Nucleic Acids Res. 2019, 47, D1102–D1109. [Google Scholar] [CrossRef] [Green Version]
  35. Avdeef, A.; Berger, C.M. pH-metric solubility.: 3. Dissolution titration template method for solubility determination. Eur. J. Pharm. Sci. 2001, 14, 281–291. [Google Scholar] [CrossRef]
  36. Boldhane, S.; Kuchekar, B. Development and optimization of metoprolol succinate gastroretentive drug delivery system. Acta Pharm. 2010, 60, 415–425. [Google Scholar] [CrossRef] [PubMed] [Green Version]
  37. Zhao, Y.; Jona, J.; Chow, D.T.; Rong, H.; Semin, D.; Xia, X.; Zanon, R.; Spancake, C.; Maliski, E. High-throughput logP measurement using parallel liquid chromatography/ultraviolet/mass spectrometry and sample-pooling. Rapid Commun. Mass Spectrom. 2002, 16, 1548–1555. [Google Scholar] [CrossRef] [PubMed]
  38. Mateus, A.; Matsson, P.; Artursson, P. A High-Throughput Cell-Based Method to Predict the Unbound Drug Fraction in the Brain. J. Med. Chem. 2014, 57, 3005–3010. [Google Scholar] [CrossRef] [PubMed]
  39. Mautz, D.S.; Nelson, W.L.; Shen, D.D. Regioselective and stereoselective oxidation of metoprolol and bufuralol catalyzed by microsomes containing cDNA-expressed human P4502D6. Drug Metab. Dispos. 1995, 23, 513–517. [Google Scholar]
  40. Thelen, K.; Coboeken, K.; Willmann, S.; Burghaus, R.; Dressman, J.B.; Lippert, J. Evolution of a detailed physiological model to simulate the gastrointestinal transit and absorption process in humans, Part 1: Oral solutions. J. Pharm. Sci. 2011, 100, 5324–5345. [Google Scholar] [CrossRef]
  41. Rodgers, T.; Leahy, D.; Rowland, M. Physiologically based pharmacokinetic modeling 1: Predicting the tissue distribution of moderate-to-strong bases. J. Pharm. Sci. 2005, 94, 1259–1276. [Google Scholar] [CrossRef]
  42. Rodgers, T.; Rowland, M. Physiologically based pharmacokinetic modeling 2: Predicting the tissue distribution of acids, very weak bases, neutrals and zwitterions. J. Pharm. Sci. 2006, 95, 1238–1257. [Google Scholar] [CrossRef]
  43. Johnson, J.A.; Burlew, B.S. Metoprolol metabolism via cytochrome P4502D6 in ethnic populations. Drug Metab. Dispos. 1996, 24, 350–355. [Google Scholar]
  44. Kelly, J.G.; Salem, S.A.; Kinney, C.D.; Shanks, R.G.; McDevitt, D.G. Effects of ranitidine on the disposition of metoprolol. Br. J. Clin. Pharmacol. 1985, 19, 219–224. [Google Scholar] [CrossRef] [Green Version]
  45. Damy, T.; Pousset, F.; Caplain, H.; Hulot, J.-S.S.; Lechat, P. Pharmacokinetic and pharmacodynamic interactions between metoprolol and dronedarone in extensive and poor CYP2D6 metabolizers healthy subjects. Fundam. Clin. Pharmacol. 2004, 18, 113–123. [Google Scholar] [CrossRef]
  46. Austin, R.P.; Barton, P.; Cockroft, S.L.; Wenlock, M.C.; Riley, R.J. The influence of nonspecific microsomal binding on apparent intrinsic clearance, and its prediction from physicochemical properties. Drug Metab. Dispos. 2002, 30, 1497–1503. [Google Scholar] [CrossRef] [PubMed] [Green Version]
  47. Johnsson, G.; Regärdh, C.-G.; Sölvell, L. Combined pharmacokinetic and pharmacodynamic studies in man of the adrenergic β1-receptor antagonist metoprolol. Acta Pharmacol. Toxicol. (Copenh). 1975, 36, 31–44. [Google Scholar] [CrossRef] [PubMed]
  48. Krösser, S.; Neugebauer, R.; Dolgos, H.; Fluck, M.; Rost, K.-L.; Kovar, A. Investigation of sarizotan’s impact on the pharmacokinetics of probe drugs for major cytochrome P450 isoenzymes: A combined cocktail trial. Eur. J. Clin. Pharmacol. 2006, 62, 277–284. [Google Scholar] [CrossRef] [PubMed]
  49. Parker, R.B.; Soberman, J.E. Effects of paroxetine on the pharmacokinetics and pharmacodynamics of immediate-release and extended-release metoprolol. Pharmacotherapy 2011, 31, 630–641. [Google Scholar] [CrossRef]
  50. Luzier, A.B.; Killian, A.; Wilton, J.H.; Wilson, M.F.; Forrest, A.; Kazierad, D.J. Gender-related effects on metoprolol pharmacokinetics and pharmacodynamics in healthy volunteers. Clin. Pharmacol. Ther. 1999, 66, 594–601. [Google Scholar] [CrossRef]
  51. Jin, S.K.; Chung, H.J.; Chung, M.W.; Kim, J.-I.; Kang, J.-H.; Woo, S.W.; Bang, S.; Lee, S.H.; Lee, H.J.; Roh, J. Influence of CYP2D6*10 on the pharmacokinetics of metoprolol in healthy Korean volunteers. J. Clin. Pharm. Ther. 2008, 33, 567–573. [Google Scholar] [CrossRef]
  52. Guest, E.J.; Aarons, L.; Houston, J.B.; Rostami-Hodjegan, A.; Galetin, A. Critique of the Two-Fold Measure of Prediction Success for Ratios: Application for the Assessment of Drug-Drug Interactions. Drug Metab. Dispos. 2011, 39, 170–173. [Google Scholar] [CrossRef] [Green Version]
  53. Pharmacogene Variation Consortium (PharmVar) CYP2D6 gene. Available online: https://www.pharmvar.org/gene/CYP2D6 (accessed on 7 October 2020). (Gaedigk et al. 2018, CPT 103:399; Gaedigk et al. 2019, CPT 105:29).
  54. Gonzalez, D.; Rao, G.G.; Bailey, S.C.; Brouwer, K.L.R.; Cao, Y.; Crona, D.J.; Kashuba, A.D.M.; Lee, C.R.; Morbitzer, K.; Patterson, J.H.; et al. Precision Dosing: Public Health Need, Proposed Framework, and Anticipated Impact. Clin. Transl. Sci. 2017, 10, 443–454. [Google Scholar] [CrossRef] [Green Version]
  55. Shen, H.; He, M.M.; Liu, H.; Wrighton, S.A.; Wang, L.; Guo, B.; Li, C. Comparative metabolic capabilities and inhibitory profiles of CYP2D6.1, CYP2D6.10, and CYP2D6.17. Drug Metab. Dispos. 2007, 35, 1292–1300. [Google Scholar] [CrossRef]
  56. Goryachkina, K.; Burbello, A.; Boldueva, S.; Babak, S.; Bergman, U.; Bertilsson, L. CYP2D6 is a major determinant of metoprolol disposition and effects in hospitalized Russian patients treated for acute myocardial infarction. Eur. J. Clin. Pharmacol. 2008, 64, 1163–1173. [Google Scholar] [CrossRef]
  57. Rau, T.; Heide, R.; Bergmann, K.; Wuttke, H.; Werner, U.; Feifel, N.; Eschenhagen, T. Effect of the CYP2D6 genotype on metoprolol metabolism persists during long-term treatment. Pharmacogenetics 2002, 12, 465–472. [Google Scholar] [CrossRef] [PubMed]
  58. Hamadeh, I.S.; Langaee, T.Y.; Dwivedi, R.; Garcia, S.; Burkley, B.M.; Skaar, T.C.; Chapman, A.B.; Gums, J.G.; Turner, S.T.; Gong, Y.; et al. Impact of CYP2D6 polymorphisms on clinical efficacy and tolerability of metoprolol tartrate. Clin. Pharmacol. Ther. 2014, 96, 175–181. [Google Scholar] [CrossRef] [PubMed] [Green Version]
  59. Bijl, M.J.; Visser, L.E.; Van Schaik, R.H.N.; Kors, J.A.; Witteman, J.C.M.; Hofman, A.; Vulto, A.G.; Van Gelder, T.; Stricker, B.H.C. Genetic variation in the CYP2D6 gene is associated with a lower heart rate and blood pressure in β-blocker users. Clin. Pharmacol. Ther. 2009, 85, 45–50. [Google Scholar] [CrossRef] [PubMed]
  60. Yuan, H.; Huang, Z.; Yang, G.; Lv, H.; Sang, H.; Yao, Y. Effects of Polymorphism of the β 1 Adrenoreceptor and CYP2D6 on the Therapeutic Effects of Metoprolol. J. Int. Med. Res. 2008, 36, 1354–1362. [Google Scholar] [CrossRef]
  61. Fux, R.; Mörike, K.; Pröhmer, A.M.T.T.; Delabar, U.; Schwab, M.; Schaeffeler, E.; Lorenz, G.; Gleiter, C.H.; Eichelbaum, M.; Kivistö, K.T. Impact of CYP2D6 genotype on adverse effects during treatment with metoprolol: A prospective clinical study. Clin. Pharmacol. Ther. 2005, 78, 378–387. [Google Scholar] [CrossRef]
Figure 1. Implemented metoprolol metabolic pathways. (R)- and (S)-metoprolol are both metabolized via two different CYP2D6-dependent metabolic pathways: α-hydroxylation and O-demethylation, as well as by an unspecific hepatic clearance process. The four α-hydroxymetoprolol diastereomers (stereocenters are marked with asterisks) were modeled as one single compound due to lacking published clinical data. CLhep: hepatic clearance, CYP2D6: cytochrome P450 2D6.
Pharmaceutics 12 01200 g001
Figure 2. Metoprolol plasma concentrations. Model predictions of metoprolol and its metabolite α-hydroxymetoprolol plasma concentration-time profiles of selected (ac) intravenous and (dl) oral studies of the training and test datasets, compared to observed data [43,44,45,47,48,49,50]. Population predictions (n = 100) are shown as lines with ribbons (arithmetic mean ± standard deviation (SD)), symbols represent the corresponding observed data ± SD. Detailed information on all clinical studies is listed in Supplementary Table S2.2.1. iv: intravenous, po: oral.
Pharmaceutics 12 01200 g002
Figure 3. Goodness-of-fit plots of the final metoprolol model. Predicted versus observed (a,b) plasma concentrations, (c,d) AUClast values and (e,f) Cmax values for the training (left column) and test (right column) datasets. The solid black line indicates the line of identity, solid grey lines show two-fold deviation, dashed grey lines indicate 1.25-fold deviation. Detailed information on all clinical studies is listed in Supplementary Table S2.2.1. AUClast: area under the plasma concentration-time curve from the time of the first concentration measurement to the time of the last concentration measurement, Cmax: maximum plasma concentration, vs: versus.
Pharmaceutics 12 01200 g003
Figure 4. Metoprolol plasma concentrations of the modeled CYP2D6 drug-gene interaction. Model predictions of (ac) (R)-metoprolol and (S)-metoprolol as well as (df) metoprolol and α hydroxymetoprolol plasma concentration-time profiles of selected metoprolol CYP2D6 DGI studies, compared to observed data [18,51]. Population predictions (n = 100) are shown as lines with ribbons (arithmetic mean ± standard deviation (SD)), symbols represent the corresponding observed data ± SD. Detailed information on all clinical studies is listed in Supplementary Table S2.2.1. AS: activity score, po: oral.
Pharmaceutics 12 01200 g004
Figure 5. Predicted versus observed metoprolol DGI ratios. Comparison of predicted versus observed (a) DGI AUClast ratios and (b) DGI Cmax ratios for all analyzed metoprolol CYP2D6 DGI studies. The straight black line indicates the line of identity, curved black lines show prediction success limits proposed by Guest et al. including 1.25-fold variability [52]. Solid grey lines indicate two-fold deviation, dashed grey lines show 1.25-fold deviation. Detailed information on all clinical studies as well as the plotted values are listed in Tables S2.2.1 and S3.3.2 of the Supplementary Materials. AUClast: area under the plasma concentration-time curve from the time of the first concentration measurement to the time of the last concentration measurement, Cmax: maximum plasma concentration, DGI: drug-gene interaction, vs: versus.
Pharmaceutics 12 01200 g005
Figure 6. Model-based CYP2D6 DGI dose recommendations. (a) Simulations of metoprolol exposure in individuals with different CYP2D6 activity scores, all administered with 100 mg metoprolol twice daily. (b) Simulations of metoprolol exposure in individuals with different CYP2D6 activity scores, administered with the model-based dose recommendations. Doses were adjusted to match the AUC168–180 h of 100 mg metoprolol twice daily in AS = 2 (wt) individuals. (c) Model-based dose adjustments, compared to the DPWG guideline recommendations for metoprolol [28]. (d) Metoprolol AUC168–180 h values for administration of 100 mg twice daily to individuals with different CYP2D6 activity scores. (e) Metoprolol AUCss values for administration of the model-based dose recommendations to individuals with different CYP2D6 activity scores. The dotted horizontal line marks the wt AUCss. *: value interpolated due to a lack of clinical studies with AS = 1, ‡: dose titration or change of medication recommended, AS: activity score, AUCss: area under the plasma concentration-time curve during steady state (168–180 h), bid: twice daily, DPWG: Dutch Pharmacogenetics Working Group, IM: intermediate metabolizer, NM: normal metabolizer, PM: poor metabolizer, po: oral, UM: ultrarapid metabolizer, wt: wild type.
Pharmaceutics 12 01200 g006
Table 1. CYP2D6 activity score assignment according to [33].
Activity ScoreProjected PhenotypeExamples of Relevant CYP2D6 Genotypes
0PM*3/*3, *3/*4, *4/*4, *5/*6
0.25IM*4/*10, *5/*10
0.5*4/*41, *5/*17, *10/*10
0.75*17/*10, *41/*10
1*1/*4, *2/*5, *17/*17, *17/*41
1.25NM*1/*10, *2/*10, *35/*10
1.5*1/*41, *2/*17, *35/*41
2*1/*1, *1/*2, *2/*35
2.25*1x2/*17, *35x2/*41
>2.25UM*1/*1x3, *1/*35x2, *2x2/*9
CYP2D6: Cytochrome P450 2D6, IM: intermediate metabolizer, NM: normal metabolizer, PM: poor metabolizer, UM: ultrarapid metabolizer.
Table 2. (R)- and (S)-metoprolol drug-dependent model parameters.
ParameterUnit(R)-Metoprolol(S)-MetoprololDescription
ValueSourceLiteratureReferenceValueSourceLiteratureReference
MWg/mol267.36Lit.267.36[34]267.36Lit.267.36[34]Molecular weight
pKa (base)-9.7Lit.9.70[34]9.7Lit.9.70[34]Acid dissociation constant
Solubility tart. (pH 7.4)g/mL1.00Lit.1.00[35]1.00Lit.1.00[35]Solubility
Solubility succ. (pH 5.5)g/mL0.16Lit.0.16[36]0.16Lit.0.16[36]Solubility
logP-1.77Lit.1.77[37]1.77Lit.1.77[37]Lipophilicity
fu%88Lit.88[38]88Lit.88[38]Fraction unbound
CYP2D6 Km ⭢ αHMµmol/L10.08Lit.10.08 [39]10.75Lit.10.75 [39]Michaelis-Menten constant
CYP2D6 kcat ⭢ αHM1/min6.02Optim. 7.50[39]6.55Optim. 8.27[39]Catalytic rate constant
CYP2D6 Km ⭢ ODMµmol/L8.82Lit.8.82 [39]12.43Lit.12.43 [39]Michaelis-Menten constant
CYP2D6 kcat ⭢ ODM1/min9.87Optim. 12.30[39]8.21Optim. 10.37[39]Catalytic rate constant
CLhep., unsp.1/min0.08Optim.--0.09Optim.--Unspecific hepatic clearance
GFR fraction-1.00Asm.--1.00Asm.--Filtered drug in the urine
EHC continuous fraction-1.00Asm.--1.00Asm.--Bile fraction cont. released
Intestinal permeabilitycm/min4.14 × 10−5Optim.1.12 × 10−5Calc. [40]4.14 × 10⁻⁵Optim.1.12 × 10−5Calc. [40]Transcellular intestinal perm.
Cellular permeabilitycm/min4.64 × 10−3Calc.PK-Sim[32]4.64 × 10⁻³Calc.PK-Sim[32]Perm. into the cellular space
Partition coefficients-DiverseCalc.R&R[41,42]DiverseCalc.R&R[41,42]Cell to plasma partitioning
NR Weibull time parametermin12.31Optim.-[43,44]12.31Optim.-[43,44]Dissolution time (50%)
NR Weibull shape parameter-0.72Optim.-[43,44]0.72Optim.-[43,44]Dissolution profile shape
CR Weibull time parametermin331.92Optim.-[45]331.92Optim.-[45]Dissolution time (50%)
CR Weibull shape parameter-1.53Optim.-[45]1.53Optim.-[45]Dissolution profile shape
-: not available, : CYP2D6 kcat values were optimized in a fixed ratio (kcat αHM:kcat ODM) equivalent to the ratio of reported kcat values [39], : in vitro values corrected for binding in the assay, using estimated fraction unbound to microsomal protein (fu, mic, estimated = 84%) [46], αHM: α-hydroxymetoprolol, asm.: assumed, calc.: calculated, cont.: continuously, CR: controlled release, CYP2D6: cytochrome P450 2D6, EHC: enterohepatic circulation, GFR: glomerular filtration rate, hep.: hepatic, lit.: literature, NR: normal release, ODM: O-demethylmetoprolol, optim.: optimized, perm. permeability, PK-Sim: PK-Sim standard calculation method, R&R: Rodgers and Rowland calculation method, succ.: metoprolol succinate, tart.: metoprolol tartrate, unsp.: unspecific.
Table 3. Optimized kcat, rel values for the different modeled CYP2D6 activity scores.
Activity Score(R)-Metoprolol(S)-Metoprololkcat, rel
kcat ⭢ αHMkcat ⭢ ODMkcat ⭢ αHMkcat ⭢ ODM
00.00 1/min0.00 1/min0.00 1/min0.00 1/min0%
0.51.65 1/min2.70 1/min1.82 1/min2.27 1/min19%
1.255.73 1/min9.40 1/min6.30 1/min7.89 1/min64%
1.56.38 1/min10.48 1/min7.03 1/min8.81 1/min72%
210.17 1/min16.69 1/min11.19 1/min14.02 1/min100%
319.03 1/min31.22 1/min20.93 1/min26.23 1/min213%
αHM: α-hydroxymetoprolol, kcat: catalytic rate constant, kcat, rel: catalytic rate constant relative to activity score = 2, ODM: O-demethylmetoprolol.
Publisher’s Note: MDPI stays neutral with regard to jurisdictional claims in published maps and institutional affiliations.

