Article

Pharmacokinetic Drug Interaction Study of Sorafenib and Morphine in Rats

by
Agnieszka Karbownik
1,
Danuta Szkutnik-Fiedler
1,*,
Tomasz Grabowski
2,
Anna Wolc
3,4,
Joanna Stanisławiak-Rudowicz
1,5,
Radosław Jaźwiec
6,
Edmund Grześkowiak
1 and
Edyta Szałek
1
1
Department of Clinical Pharmacy and Biopharmacy, Poznań University of Medical Sciences, 14 Św. Marii Magdaleny Str., 61-861 Poznań, Poland
2
Preclinical Development, Polpharma Biologics SA, Trzy Lipy 3, 80-172 Gdańsk, Poland
3
Department of Animal Science, Iowa State University, 239E Kildee Hall, Ames, IA 50011, USA
4
Research and Development, Hy-Line International, 2583 240th Street, Dallas Center, IA 50063, USA
5
Department of Gynecological Oncology, University Hospital of Lord’s Transfiguration, Poznań University of Medical Sciences, 84/86 Szamarzewskiego Str., 60-101 Poznań, Poland
6
Laboratory of Mass Spectrometry, Institute of Biochemistry and Biophysics PAS, Polish Academy of Sciences, 5A Pawińskiego Str., 02-106 Warsaw, Poland
*
Author to whom correspondence should be addressed.
Pharmaceutics 2021, 13(12), 2172; https://doi.org/10.3390/pharmaceutics13122172
Submission received: 19 November 2021 / Revised: 9 December 2021 / Accepted: 15 December 2021 / Published: 16 December 2021
(This article belongs to the Section Pharmacokinetics and Pharmacodynamics)

Abstract

:
A combination of the tyrosine kinase inhibitor—sorafenib—and the opioid analgesic—morphine—can be found in the treatment of cancer patients. Since both are substrates of P-glycoprotein (P-gp), and sorafenib is also an inhibitor of P-gp, their co-administration may affect their pharmacokinetics, and thus the safety and efficacy of cancer therapy. Therefore, the aim of this study was to evaluate the potential pharmacokinetic drug–drug interactions between sorafenib and morphine using an animal model. The rats were divided into three groups that Received: sorafenib and morphine (ISOR+MF), sorafenib (IISOR), and morphine (IIIMF). Morphine caused a significant increase in maximum plasma concentrations (Cmax) and the area under the plasma concentration–time curves (AUC0–t, and AUC0–∞) of sorafenib by 108.3 (p = 0.003), 55.9 (p = 0.0115), and 62.7% (p = 0.0115), respectively. Also, the Cmax and AUC0–t of its active metabolite—sorafenib N-oxide—was significantly increased in the presence of morphine (p = 0.0022 and p = 0.0268, respectively). Sorafenib, in turn, caused a significant increase in the Cmax of morphine (by 0.5-fold, p = 0.0018). Moreover, in the presence of sorafenib the Cmax, AUC0–t, and AUC0–∞ of the morphine metabolite M3G increased by 112.62 (p < 0.0001), 46.82 (p = 0.0124), and 46.78% (p = 0.0121), respectively. Observed changes in sorafenib and morphine may be of clinical significance. The increased exposure to both drugs may improve the response to therapy in cancer patients, but on the other hand, increase the risk of adverse effects.

1. Introduction

About 50% of cancer patients undergoing active anti-cancer therapy and 90% of patients in the advanced stages experience severe pain [1]. In the clinical practice of cancer therapies, it can be expected that a combination of tyrosine kinase inhibitors (TKIs), such as sorafenib, and opioid analgesics, including morphine, are used, which, according to the WHO guidelines, is the first-choice opioid in the relief of cancer pain [2].
Sorafenib belongs to the group of multi-kinase inhibitors, showing antiproliferative activity of cancer cells and anti-angiogenic properties [3]. Molecularly targeted therapy, an example of which is sorafenib, is the most promising form of pharmacotherapy among cancer patients. The use of this drug is indicated in the treatment of hepatocellular carcinoma (HCC), which is one of the most common cancers worldwide and is the third most common cause of cancer death [4]. Sorafenib is also used in patients with advanced renal cell carcinoma (RCC) [5], of which 30% of patients are in metastatic state at diagnosis, as well as in the treatment of differentiated thyroid cancer, including metastatic cancer, in which the use of radioactive iodine is ineffective [6].
Sorafenib is mainly metabolized in the liver, where it undergoes N-oxidation with CYP3A4 to become the pharmacologically active sorafenib N-oxide (SR_NO), and then is transformed to inactive glucuronides as a result of UDP-glucuronosyltransferase (UGT1A9 and UGT1A1) enzyme activity [7]. The pharmacokinetics of sorafenib and its metabolites depend on many efflux transporters, such as organic cation transporter−1 (OCT1), organic anion transporting polypeptide 1B1/3 (OATP1B1/3), multidrug resistance-associated protein 2 (MRP2) and protein 3 (MRP3), breast cancer resistance protein (BCRP), and P-glycoprotein (P-pg), which is also an inhibitor [8,9]. Sorafenib has been shown to inhibit P-gp in vitro [3,10] and in vivo [11,12]. After simultaneous administration of sorafenib and P-gp substrates, such as digoxin thereof, the growth of their plasma concentrations cannot be excluded [3,10].
Morphine is metabolized primarily by the UGT enzyme, which is expressed in the liver, small intestine, brain, and other organs [13]. In humans, the glucuronidation of morphine is mediated via a UGT2B7 isoform in the liver, and the major metabolite of morphine is morphine-3-glucuronide (M3G), which doesn’t have analgesic properties and may antagonize the pharmacological effects of morphine [13,14,15]. Only 10% of morphine is metabolized to morphine-6-glucuronide (M6G), which has a greater analgesic activity than morphine [16]. Both M3G and M6G are highly hydrophilic, but only M6G can penetrate the blood-brain barrier (BBB) because M3G does not bind to μ-, δ- and κ-opioid receptors [15]. UGT1A1, 1A3, and 1A9 are also involved in the metabolism of morphine but to a lesser extent [16].
Some in vitro [17,18,19], in vivo [17,20,21,22,23,24,25], and clinical [26,27,28] studies have shown that morphine is probably a substrate of P-gp. Likewise, its glucuronidated metabolites M3G [29] and M6G [30] are considered to be substrates of this drug transporter [31]. Animal studies have shown that P-gp inhibitors increase central nervous system (CNS) concentrations and antinociceptive effects of morphine [21,22,23,24,31]. A significantly increased morphine analgesia [32] and brain distribution [20,31,33] were observed in P-gp-deficient mice, suggesting that its analgesic effect is considerably dependent on P-gp expression. A study by Hamabe et al. [34] showed a statistically significant negative correlation between the analgesic effect of morphine and the expression of P-gp in the cerebral cortex. Lötsch et al. showed that inhibition of P-gp in rats caused an increased central nervous system uptake and enhanced antinociception of M6G [30]. Clinical studies also support the hypothesis that morphine and its glucuronide metabolites are P-gp substrates [26,27,29,31]. Fudin et al. [26] showed that the P-gp inducer rifampin decreased morphine blood concentrations, and that the P-gp inhibitor telaprevir [35] may increase intestinal morphine absorption. It has been proven that patients with P-gp positive tumors require a higher dose of morphine to achieve an analgesic effect [27].
However, there are also numerous reports that neither morphine [29,36] nor M3G [37] and M6G [29,31,37] are P-gp substrates. Both in vitro [38] and clinical [39] studies suggest that morphine appears to be a likely OCT1 substrate/inhibitor [31,38] and that MRP2 and MRP3 are involved in the hepatic excretion of M3G and M6G [31,40]. Bourasset et al. [41] indicated in turn that M6G is not a P-gp or MRP1 substrate, but rather a GLUT1 and/or a weak OATP2-like substrate at the BBB in mice. So, the effect of P-gp on the pharmacokinetics of morphine is not yet elucidated.
Bearing in mind that sorafenib and probably morphine belong to the P-gp substrates, and sorafenib is also a P-gp inhibitor [10,11,12], the combined use of these drugs may alter their pharmacokinetics, and finally, the safety and efficacy of the cancer therapy. This drug combination in cancer patients may be associated then with drug–drug interactions (DDI) with a higher risk of treatment disruption [42].
Therefore, the aim of this study was to evaluate the potential pharmacokinetic DDIs between sorafenib and morphine using an animal model. The results may be helpful in clinical practice, as they can contribute to determining the appropriate pharmacotherapy in cancer patients.

2. Materials and Methods

Adult, healthy, fed male Wistar rats (n = 23) at the age of 14 weeks were used in the study. Animals were given a standard diet, and free access to fresh water was provided. All required guidelines (international, national, and/or institutional) for the care and use of animals were followed. The study was performed according to a protocol approved by the Local Ethics Committee (consent No. 36/2018 from 20 July 2018), Poznań University of Life Sciences, Department of Animal Physiology and Biochemistry, Wołyńska 35 Str., 60-637 Poznań, Poland.

2.1. Animals

All animals were divided into three groups: one study group (ISOR+MF)—rats received sorafenib with morphine (n = 8, weight 491.88 ± 7.99 g), and two control groups (IISOR and IIIMF)—rats received sorafenib (n = 8, weight 502.75 ± 16.42 g) or morphine (n = 7, weight 491.43 ± 8.52 g), respectively, along with 1 mL of the 10% dimethyl sulfoxide (DMSO) for sorafenib and 0.9% sodium chloride for morphine.
The body weight of the animals did not differ significantly between the groups.
Sorafenib (100 mg/kg body weight (b.w.) [43]; Nexavar®, batch number BXHT61, Bayer AG, Leverkusen, Germany) was administrated directly into the stomach of animals (ISOR+MF and IISOR) using a gastric probe (1 mL of each solution). The 10% DMSO was used to prepare the sorafenib tosylate solution. An aqueous solution of morphine (5 mg/kg b.w. [13]; Morphine Sulfas WZF, 20 mg/mL, batch number O1DR1118, Warszawskie Zakłady Farmaceutyczne Polfa S.A., Warsaw, Poland) was administered into the peritoneal cavity of animals (ISOR+MF and IIIMF).
100 µL of blood was collected from each rat by cutting off a piece of his tail. Blood samples were collected before drug administration and at the following time points after administration: 0.5, 1, 2, 3, 4, 5, 6, 7, 8, 10, 12, 24, 30, 48, 72, and 96 h. The plasma was separated by centrifugation at 2880× g for 10 min at 4 °C and stored at −80 °C until drug analysis.

2.2. Reagents

The following reagents were used during the HPLC-UV (high-performance liquid chromatography with ultraviolet detection) and UPLC-MS/MS (ultra-high performance liquid chromatography tandem mass spectrometry) assays: acetonitrile (CAS number 75-05-8), ammonium acetate (CAS 631-61-8), ethyl acetate (CAS 141-78-6), lapatinib (CAS 231277-92-9), methanol (CAS 67-56-1) purchased from Sigma-Aldrich (Saint Louis, MO, USA); glacial acetic acid (CAS 64-19-7), formic acid (CAS 64-18-6), morphine D6 solution (CAS 67-56-1), ultrapure water (deionized, distilled and filtered through Direct Q3 system) (CAS 7732-18-5) purchased from Merck Millipore (Burlington, MA, USA); sorafenib (CAS 284461-73-0), sorafenib N-oxide (CAS 583840-03), morphine (CAS 57-27-2), morphine-3-glucuronide (CAS 20290-09-9) purchased from LGC (Teddington TW11 0LY, UK).

2.3. HPLC-UV Assay of Sorafenib and SR_NO

The HPLC-UV method was used to determine the blood plasma concentrations of sorafenib and its metabolite SR_NO. Analyzes were carried out using the HPLC Waters 2695 Separations Module with an autosampler and the Waters 2487 Dual Absorbance Detector [43,44]. The supernatant volume for each time point used to prepare the HPLC sample was 20 μL.
An ammonium acetate 0.1 M, pH = 3.4 (eluent A) and acetonitrile (eluent B) (1:1, v/v) solution were used as a mobile phase. The flow rate was set at 1.0 mL/min. The linear gradient ran from 60% eluent A and 40% eluent B to 29% eluent A and 71% eluent B. Other HPLC parameters were as follows: the temperature of the column (a reversed-phase Symmetry® C8, 250 × 4.6 mm, 5.0 μm particle size, Waters Corporation®, Milford, MA, USA) was 25 °C, the UV detection wavelength was 265 nm, the injection volume was 20 μL. Lapatinib was used as the internal standard (IS). The calibration curves were linear within the range of 0.025−3.0 µg/mL (R2 = 0.999), and 0.025−0.40 µg/mL (R2 = 0.999), for sorafenib and SR_NO respectively. The high intra- and inter-day precision (coefficients of variation, CV < 13%) and accuracy (%bias < 14%) for sorafenib, and SR_NO were obtained. The lower limit of quantification (LLOQ) was 0.025 µg/mL for both sorafenib and SR_NO.

2.4. UPLC-MS/MS Assay of Morphine and M3G

Plasma morphine and M3G concentrations were assayed using ultra-performance liquid chromatography-tandem mass spectrometry (UPLC-MS/MS). The instrumentation used was a Waters Xevo TQ-MS mass spectrometer with a standard electrospray ion source coupled to a Waters Acquity UPLC. The calibration curve for morphine consisted of 6 samples in the range from 1 to 500 ng/mL (R2 = 0.999), and for M3G it consisted of 6 samples in the range from 2 to 1000 ng/mL (R2 = 0.995).
As the internal standard (IS), a solution of morphine D6 in methanol in the concentration of 20 ng/mL was used. Every sample was injected into the instrument in the amount of 20 μL. Chromatographic separation was done on a Waters Acquity HSS C18, with a 1.8 μm, 2.1 × 50 mm analytical column at a temperature of 70 °C. The 1.5 min gradient method was used. The mobile phases were: A—0.1% formic acid in MQ and B—0.1% formic acid in methanol. The gradient changed from 7% B to 80% B in 0.8 min by a slightly convex curve. At 1.0 min, it returned to the starting condition for column equilibration. Using the flow rate of 1 mL/min, the obtained retention time of morphine and morphine D6 was 0.47 min, and M3G was 0.23 min. The parameters of the mass spectrometer were as follows: positive polarity mode; the capillary voltage—2.5 kV, desolvation temperature—650 °C, desolvation gas flow—1000 L/h.
Morphine was analyzed using two transmissions 286.14→155.09 (Collision energy 35) and 286.14→165.07 (CE 40); MorD6 292.18→165.02 (CE 35), and M3G 462.18→286.14 (CE 30).

2.5. Pharmacokinetic Evaluation

The following pharmacokinetic parameters of sorafenib, SR_NO, morphine, and M3G were calculated using the Phoenix® WinNonlin version 8.0 software (Certara, Princeton, NJ, USA): the elimination rate constant (ke), the absorption rate constant (ka), the half-life in the elimination phase (t1/2), the area under the concentration–time curve from zero to the last measurable concentration (AUC0–t), the area under the plasma concentration–time curve from zero to infinity (AUC0–∞), the apparent plasma drug clearance (Cl/F), and the apparent volume of distribution (Vd/F).
The maximum plasma concentration (Cmax) and the time to reach the Cmax (tmax) were obtained directly from the measured values.
All of the abovementioned parameters underwent statistical analysis.
Dose/kg-adjusted drug concentrations were calculated according to the following equations: drug concentration (µg/mL for sorafenib and ng/mL for morphine)/drug dose (mg) and drug concentration (µg/mL for sorafenib and ng/mL for morphine)/drug dose per body mass kilogram (mg/kg).

2.6. Statistical Analysis

The statistical analysis was performed using SAS software, version 9.4 (SAS Institute Inc., Cary, NC 27513, USA). The Shapiro-Wilk test was used to determine the normality. Two pairs of groups were analyzed: ISOR+MF vs. IISOR and ISOR+MF vs. IIIMF independently. The differences between the normally distributed variables were determined with the Student’s t-test. Not-normally distributed variables were analyzed using the Kruskal-Wallis test, and a p-value of <0.05 was considered significant.

3. Results

All the data were expressed as the arithmetic mean value ± standard deviation (SD).

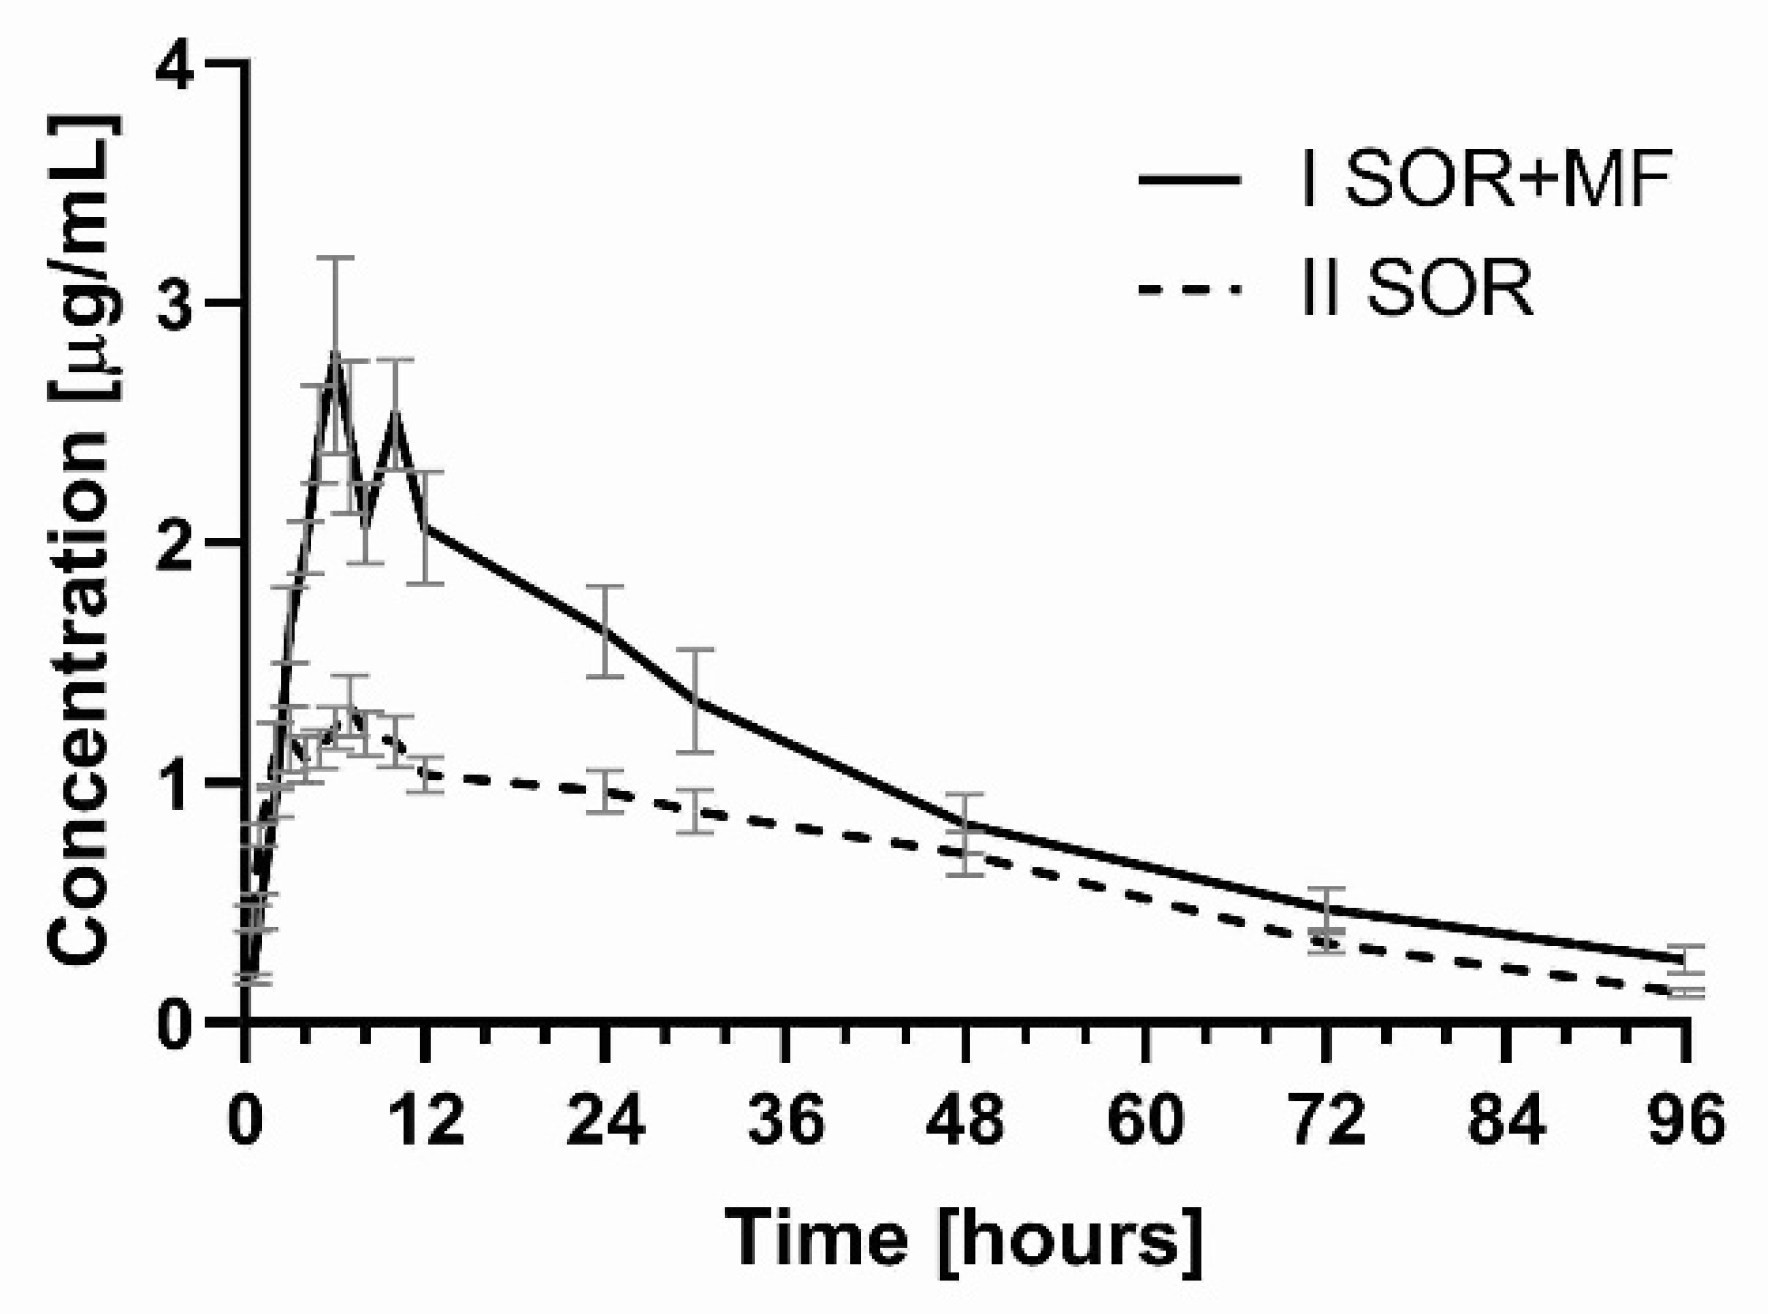
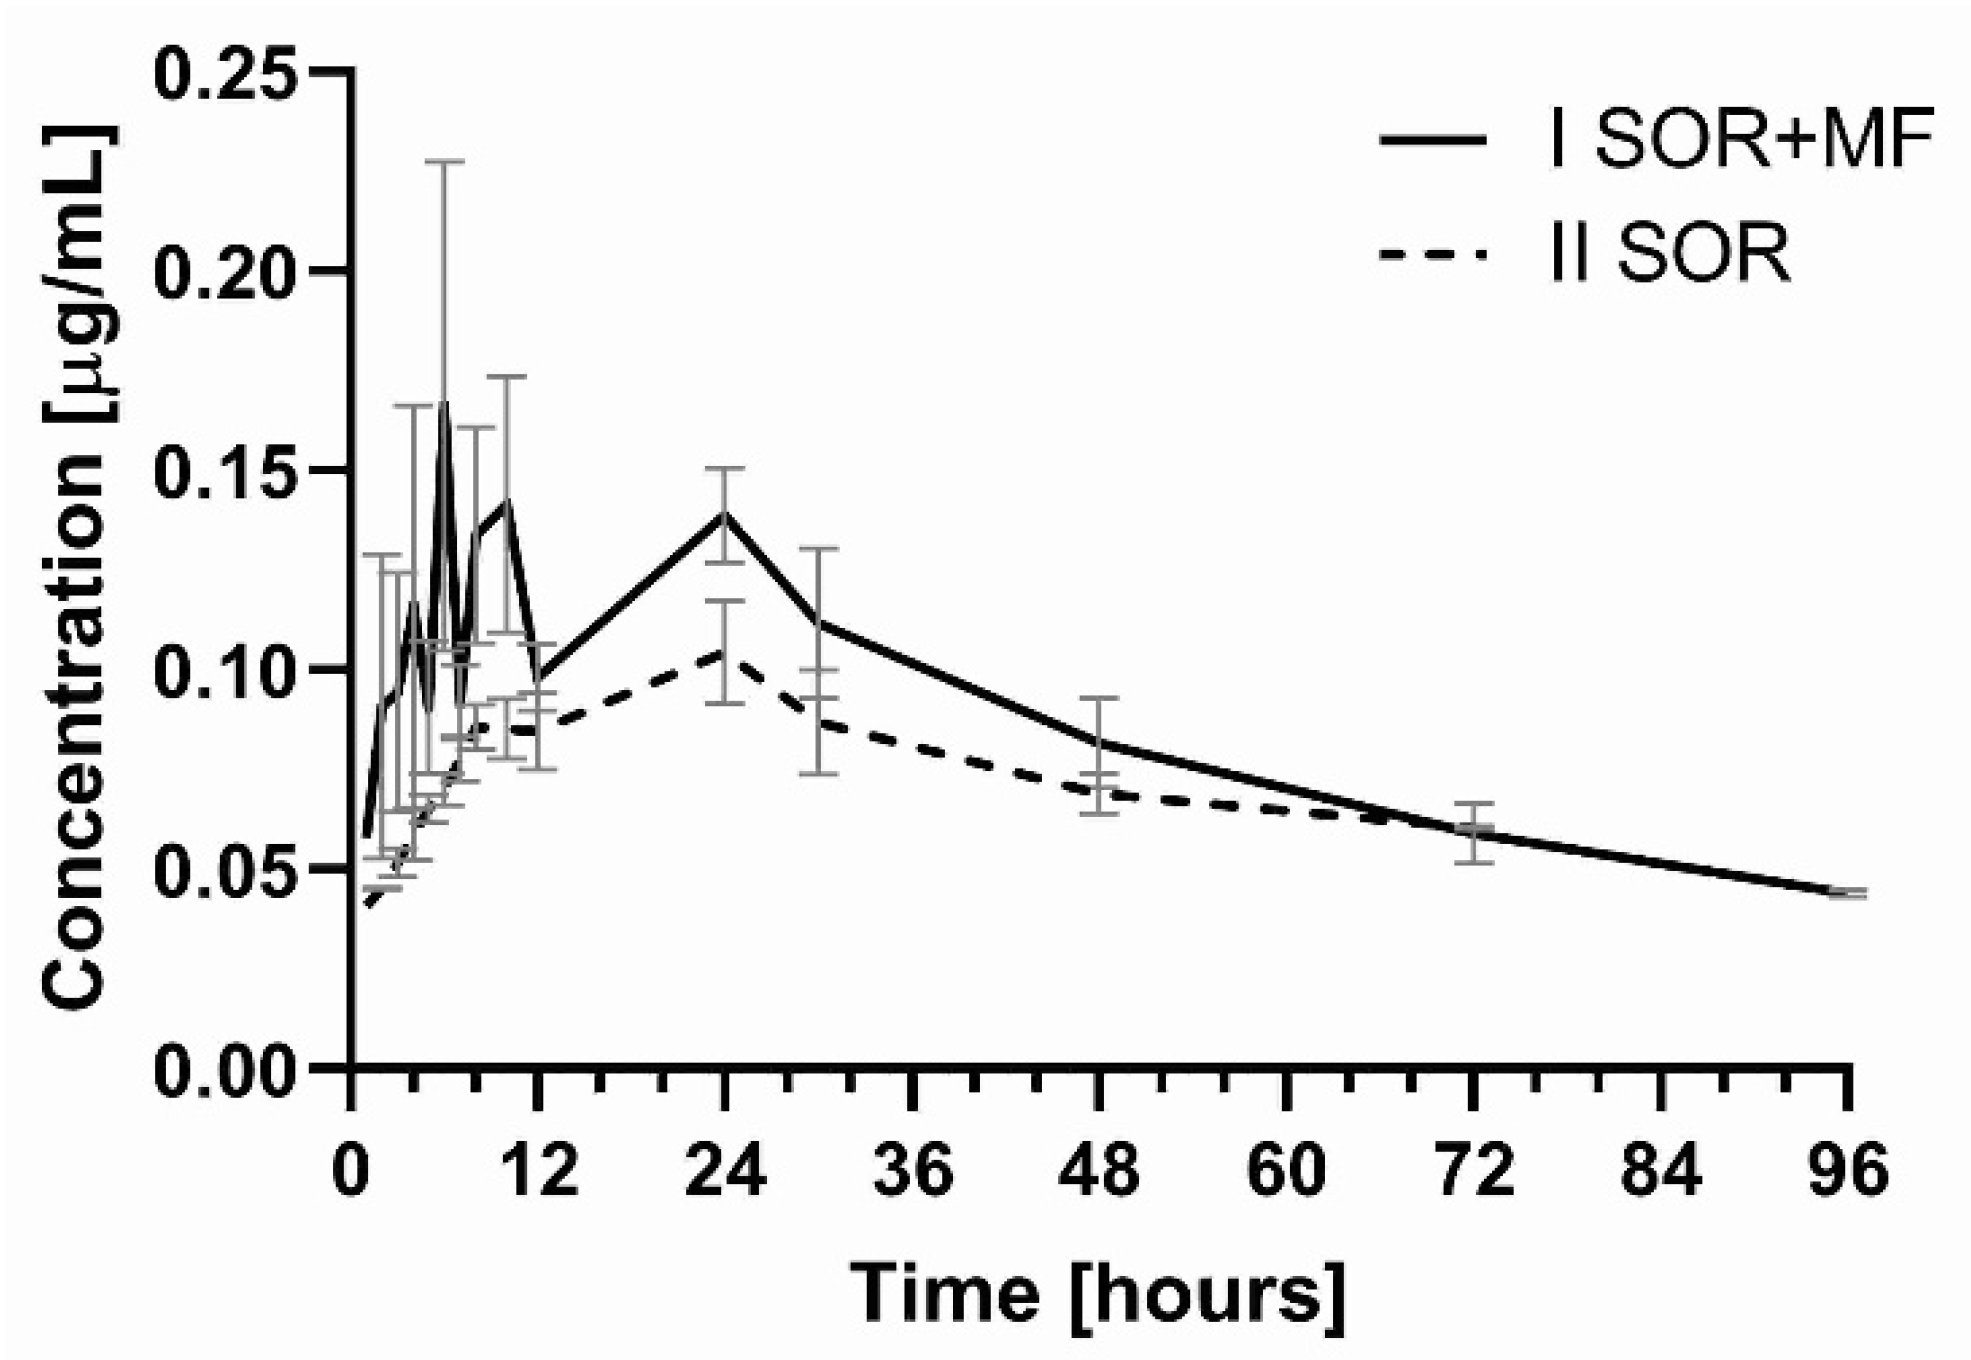
3.1. The Influence of Morphine on the Pharmacokinetics of Sorafenib and SR_NO

When sorafenib was co-administered with morphine (ISOR+MF group), the Cmax, AUC0–t, and AUC0–∞ of sorafenib significantly increased by 108.3 (p = 0.003), 55.9 (p = 0.0115), and 62.7% (p = 0.0115), respectively (Table 1, Figure 1). Significantly lower ka (by 95.9%, p = 0.0008) and CL/F (by 36.3%, 0.0224) values were observed for sorafenib in the group of rats receiving both drugs when compared to the sorafenib treatment group alone (IISOR group). However, the kel of sorafenib in the ISOR+MF group was significantly higher (by 7.3-fold, p = 0.0008). No statistically significant differences were revealed for tmax, t1/2, and Vd/F when compared to the IISOR group (Table 1).
In the presence of morphine, statistically higher values of Cmax (by 1.5-fold, p = 0.0022) and AUC0–t (by 0.6-fold, p = 0.0268) for SR_NO were observed (Table 1, Figure 2). There were no significant differences among the groups for the following pharmacokinetic parameters of SR_NO: AUC0−∞, tmax, kel, and t1/2 (Table 1).
The sum of the Cmax for sorafenib and SR_NO values was also significantly higher (p < 0.001; Gmean ratio = 2.11, and 90% CI = 1.75; 2.54) in the group treated with morphine (3.52 ± 0.75 µg/mL; CV = 21.3) than the IISOR group (1.68 ± 0.37 µg/mL; CV = 21.8).
The Cmax, AUC0–t, and AUC0– SR_NO/sorafenib ratios were similar in both groups (Table 1).

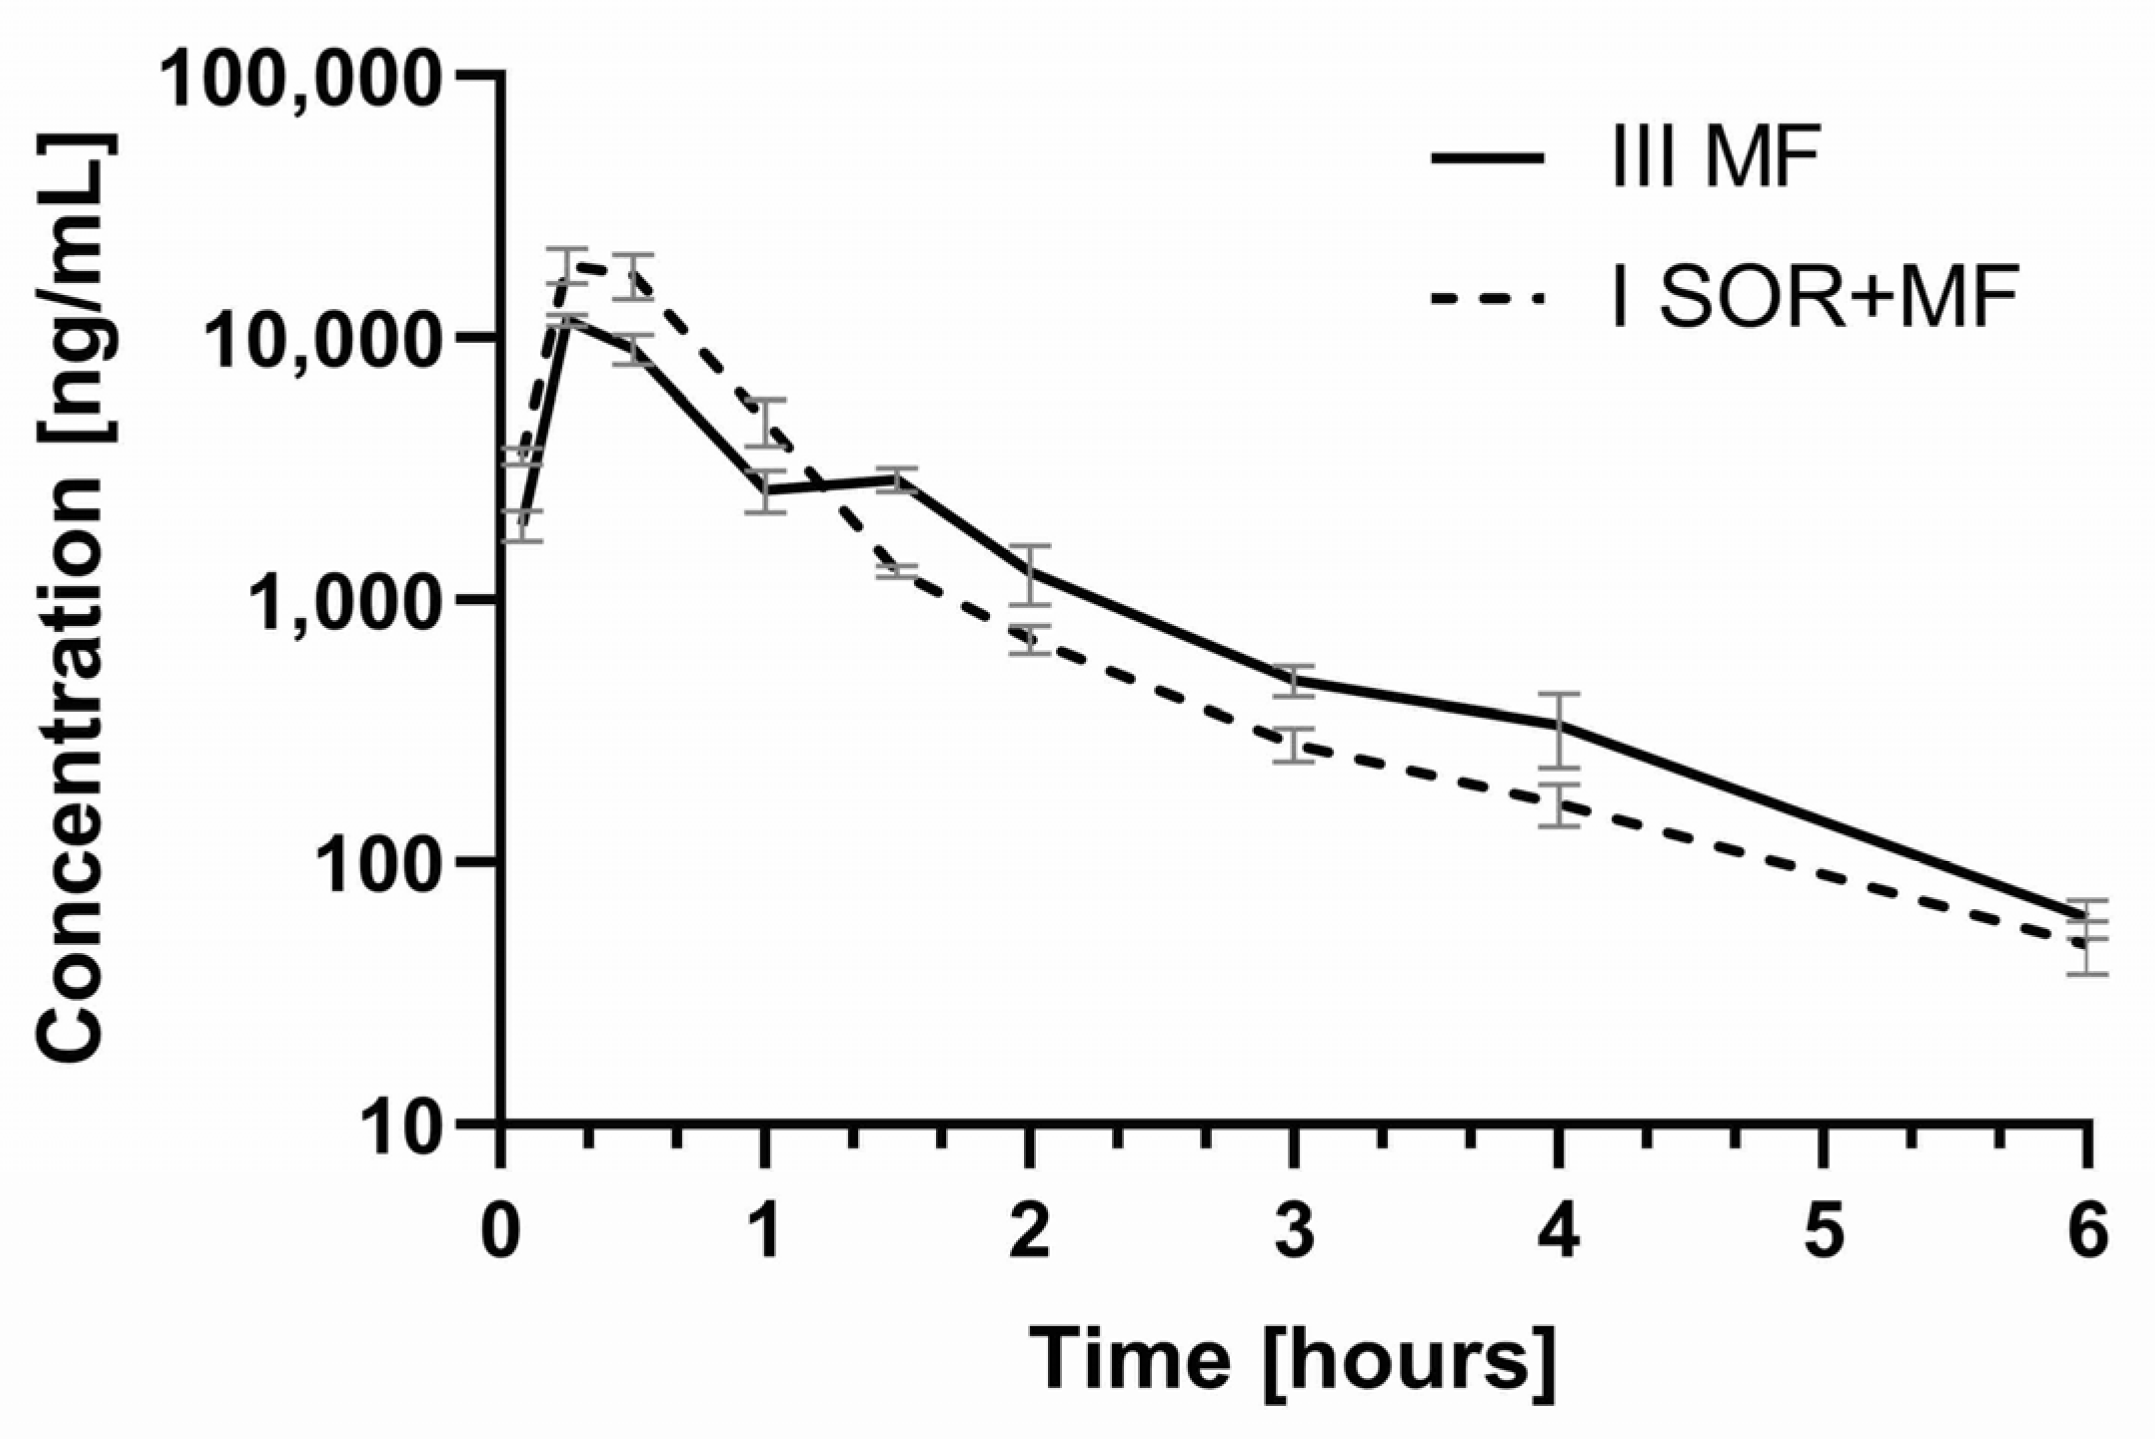
3.2. The Influence of Sorafenib on the Pharmacokinetics of Morphine and M3G

After the administration of morphine with sorafenib, the Cmax of morphine increased by 0.5-fold (p = 0.0018) when compared with the morphine treatment group (Table 2, Figure 3). However, no statistically significant differences were revealed for the AUC0–t and AUC0–∞ of morphine. There were no significant differences among the groups for the following pharmacokinetic parameters of morphine: tmax, kel, t1/2, Cl, and Vd/F (Table 2).
When morphine and sorafenib were co-administered, the exposure to M3G was significantly higher when compared with the morphine treatment group (Table 2, Figure 4). In the presence of sorafenib, the Cmax, AUC0–t, and AUC0–∞ of M3G increased by 112.62 (p < 0.0001), 46.82 (p = 0.0124), and 46.78% (p = 0.0121), respectively. No statistically significant differences were revealed for the tmax, kel, and t1/2 of M3G (Table 2).
The ratios of the Cmax, AUC0–t, and AUC0–∞ of M3G/morphine in comparison to the IIIMF group were increased by 28.67 (p = 0.2004), 51.05 (p = 0.0488), and 47.58% (p = 0.0435), respectively.

4. Discussion

We evaluated the pharmacokinetics of two P-gp substrates—sorafenib (which is also a potent P-gp inhibitor) and morphine (for which the role of the P-gp in the pharmacokinetics is unclear), which were co-administered in healthy rats.
The doses of sorafenib (100 mg/kg b.w., orally) and morphine (5 mg/kg b.w., intraperitoneally) used in our study were selected based on the available literature [12,13] and did not cause any adverse effects in healthy rats. The study is not free of limitations. The pharmacokinetic profile of sorafenib and morphine may be different between Wistar rats and humans, and we did not measure the concentrations of sorafenib glucuronide. No animals that modelled HCC or induced pain were used. However, using healthy animals allowed for eliminating the impact of comorbidities on the inter-individual variability.

4.1. The Influence of Morphine on the Pharmacokinetics of Sorafenib and SR_NO

Pharmacokinetic interactions of practical importance are mainly based on changes in drug absorption and metabolism [42,45,46]. Our study showed that the co-administration of morphine and sorafenib resulted in a higher exposure of sorafenib when compared to sorafenib alone. It was documented by an approx. 1.1-fold higher Cmax (the ratio Cmax ISOR+MF/Cmax IISOR was 2.08) and higher values of AUC0–t and AUC0–∞ (by 0.6-fold) in the ISOR+MF group when compared to the control animals (IISOR group). Apart from that, a significant decrease in the ka (0.03 vs. 0.74 h−1) was noted in the ISOR+MF group. This fact may be the reason for the observed increase in the Cmax of sorafenib in the presence of morphine (Table 1, Figure 1).
A similar tendency was observed for the main active metabolite of sorafenib—SR_NO, where Cmax and AUC0–t also increased in the ISOR+MF group (by 145.5 and 61.9%, respectively) (Table 1, Figure 2). Also, the sum of the Cmax for sorafenib and SR_NO values was significantly higher (p < 0.001) in the group treated with morphine than the IISOR group.
Since SR_NO shows an in vitro potency similar to that of sorafenib, the risk of toxicity is further enhanced. A higher sorafenib N-oxide exposure probably follows an increased exposure to sorafenib. However, the ratios of sorafenib N-oxide/sorafenib for the Cmax, AUC0–t, and AUC0–∞ in the IISOR and ISOR+MF group did not differ significantly, demonstrating no effect of morphine on sorafenib oxidation.
According to the FDA guidelines [47], the significantly highest Cmax value is generally related to the toxicity of a drug and is used therefore to evaluate or predict the risk of toxicity changes in DDI studies. In the evaluation of DDIs by regulatory agencies, systemic exposure is based on the plasma AUC0–t. Following FDA [47] and EMA [48] classification, the AUC0–t change is considered to influence the drug’s efficacy but also its toxicity. Those guidelines indicate that an AUC0–t ratio (AUC0–t in the presence of a perpetrator/AUC0–t in the absence of a perpetrator) ≥5, 2–5, and 1.25–2 determined a strong, moderate, and weak pharmacokinetic-based DDI occurrence, respectively. In our study, the AUC0–t of sorafenib in the presence of morphine was significantly higher, but the ratio of AUC0–t ISOR+MF/AUC0–t IISOR was 1.56.
Considering the above, in clinical practice, the increased systemic exposure of sorafenib and its active N-oxide metabolite in the presence of morphine may improve the response to therapy, but on the other hand, the higher Cmax could be associated with the severity of such adverse events as gastrointestinal disorders or hand-foot syndrome [3,10].
A significant role of P-gp on the absorption of tyrosine kinase inhibitors has been studied [42,49]. Sorafenib, which is similar to, for example, critozinib and lapatinib, is a P-gp substrate, the absorption of which may depend on this efflux transporter [42]. Co-administration of another substrate or inhibitor of P-gp might lead then to a clinically relevant DDI in the absorption phase, such as reducing the absorption rate constant observed in our study. Sorafenib tmax values may confirm more prolonged sorafenib absorption in the ISOR+MF group when compared to the IISOR group (7.63 vs. 5.13 h), although these differences were not statistically significant (p = 0.0616). In addition, there was a parallel increase of the AUC0–t of sorafenib and its metabolite SR_NO in the ISOR+MF group when compared to the IISOR group. Moreover, there were no statistically significant differences for the SR_NO/sorafenib ratios for the Cmax, AUC0–t and AUC0–∞. This may confirm an interaction of sorafenib and morphine at the absorption level.
We have observed indeed a significantly lower clearance of sorafenib in the ISOR+MF group (by 0.4-fold). Since sorafenib is largely eliminated by hepatic metabolism and excreted in feces as metabolites or unchanged, DDIs caused by changes in renal elimination may not be of significant importance. In addition, the kel of sorafenib was increased in the presence of morphine. However, it cannot be excluded that P-gp present in the kidneys may be of some importance in the renal elimination of all tyrosine kinase inhibitors, including sorafenib [42,50]. However, in the presence of morphine, the CL/F and Vd/F of sorafenib decreased to a similar extent (about 70%) and the t1/2 did not increase significantly when compared to the sorafenib alone group, which speaks to the lack of interaction of these drugs at the level of metabolism.
In summary, observed changes in sorafenib pharmacokinetics in the ISOR+MF group may be due to the competition between sorafenib and morphine for their incorporation in the P-gp transport pathway. It could be related to the concentration-dependent inhibitory effects of morphine and M3G on P-gp. This fact may be checked in the continuation of this study, considering multiple administrations of morphine to achieve a steady-state and fluctuation of the opioid concentrations.

4.2. The Influence of Sorafenib on the Pharmacokinetics of Morphine and M3G

Since the role of P-gp in the pharmacokinetics of morphine and its glucuronidated metabolites is unclear, we investigated the effect of one of the more potent P-gp inhibitors—sorafenib—on the pharmacokinetics of morphine and its M3G metabolite in rats. Animal studies have shown, for example, a relationship between the use of the other potent P-gp inhibitors—such as elacridar—and the increase in the penetration of drugs across the BBB, e.g., digoxin, talinolol, quinidine, docetaxel, and sunitinib [42,51].
The results of our study showed that the co-administration of morphine with sorafenib caused the increase of the Cmax of morphine by 56.94% (the ratio Cmax ISOR+MF/Cmax IIIMF was 1.57) (Table 2, Figure 3). Thismorphine plasma Cmax increase in the ISOR+MF group may involve the risk of its adverse effects. The AUC values did not differ significantly between the groups. The ratio AUC0–t ISOR+MF/AUC0–t IIIMF was 0.91, and the confidence intervals (90% CI) were: 0.75; 1.16, and 0.78; 1.17, respectively. This is also confirmed by the calculation of dose-adjusted values (Table 2). It is noteworthy that, in the presence of sorafenib, the plasma Cmax, AUC0–t, and AUC0–∞ of M3G and the ratios (M3G/morphine) for AUC0–t and AUC0–∞ were also significantly higher (Table 2). It is known that inactive M3G may be responsible for neurotoxic symptoms, such as myoclonus or hyperalgesia, as well as allodynia [12,15]. The higher M3G/morphine AUC ratios in the ISOR+MF group in our study may indicate the impact of sorafenib on morphine’s analgesic efficacy and safety. Unfortunately, we did not evaluate the pharmacological effects of morphine, which is a limitation of this study. However, we can suppose that a higher Cmax of morphine may not cause stronger analgesic activity because it is compensated by a higher concentration of M3G, which reduces the pharmacological effects of morphine. However, we cannot exclude the increased risk of side effects, which M3G causes.
The analgesic efficacy of morphine is mainly associated with its ability to penetrate the BBB barrier, which is firmly dependent on membrane transporters, including brain P-gp. Brain P-gp can mediate the efflux of morphine from the brain, reducing its analgesic effect. Therefore, the level of P-gp expression in the brain is related to the analgesic effects of this opioid, and drugs that are brain P-gp inhibitors may decrease morphine efficacy [27]. There is also documented that chronic morphine exposure induces P-glycoprotein in the rat brain what may enhance morphine efflux from the brain, reducing its analgesic activity [22].
It should also be taken into account that morphine-related adverse reactions and its analgesic efficacy are generally associated with genetics polymorphism [13]. Although, there are divergent research results on this issue as well. Some studies showed that ABCB1 polymorphisms impact morphine PK/PD [23,52], but Coulbault et al. [53] claims it does not affect. Moreover, changes in the pharmacokinetics of this opioid do not necessarily affect the analgesic effect or the severity of side effects [14].
Meissner et al. [28] documented that when a P-gp inhibitor cyclosporine was co-administered with morphine in healthy volunteers, an increase in the AUC value of morphine was noted. Although, the authors suggested that this may not have any significant clinical effects.
We did not achieve statistically significant differences in the AUC0–t and AUC0–∞ of morphine between the ISOR+MF and IIIMF groups. Also, the clearance, t1/2, and other pharmacokinetic parameters of morphine were not changed between the groups (Table 2). Therefore, the elevated plasma levels of morphine in the presence of sorafenib are probably not strongly caused by the inhibition of the P-gp efflux transporter in the proximal renal tubule, but rather by P-gp inhibition during the absorption phase. However, decreased renal excretion of M3G cannot be ruled out, because M3G has a higher affinity to renal P-gp than morphine itself, because it is more hydrophilic. Drewe et al. [29] also suggested that P-gp inhibition may have a greater effect on the tubular secretion of M3G than on M6G; therefore P-gp inhibition will more likely increase M3G plasma concentrations.
The increase in plasma M3G after the intravenous administration of morphine in streptozocin-induced rats was observed, among others, by Hasegawa et al. [54]. The fact that inhibition of Pgp in rats does not affect the volume of distribution and clearance of morphine was confirmed by Letrent et al. [21] and Drewe et al. [29]. Drewe et al. [29] found that P-gp inhibition caused an increase in the AUC and t1/2 of M3G, while the pharmacokinetics of morphine and its active metabolite M6G were not changed. Gadeyne et al. [14] showed that P-gp inhibitors, ketoconazole, and elacridar did not have significant effects on morphine pharmacokinetics in dogs, although dogs in the ketoconazole group had higher sedation scores.

5. Conclusions

Observed changes in the pharmacokinetics of sorafenib and morphine co-administered may be due to competition between the two drugs for their inclusion in the P-gp transport pathway. This fact may be of clinical relevance. Increased exposure to both drugs may improve the response to therapy in cancer patients, but on the other hand, it may increase the risk of their side effects, which should be noted.

Author Contributions

Conceptualization, A.K. and E.S.; methodology, A.K., J.S.-R.; software, R.J.; validation, A.K., R.J.; formal analysis, A.K. and E.S.; investigation, A.K.; resources, A.K. and D.S.-F.; data curation, A.K., T.G., A.W.; writing—original draft preparation, D.S.-F., A.K., E.S.; writing—review and editing, D.S.-F., A.K.; visualization, A.K., T.G. and D.S.-F.; supervision, E.G., E.S.; project administration, E.S.; funding acquisition, E.G. All authors have read and agreed to the published version of the manuscript.

Funding

This research was funded by POZNAN UNIVERSITY OF MEDICAL SCIENCES.

Institutional Review Board Statement

The study was conducted according to the guidelines of the Declaration of Helsinki, and approved by the Ethics Committee of Poznań University of Life Sciences, Department of Animal Physiology and Biochemistry, Wołyńska 35 Str., 60-637 Poznań, Po-land (consent No. 36/2018 from 20 July 2018).

Informed Consent Statement

Not applicable.

Data Availability Statement

The data presented in this study are available on request from the corresponding author.

Conflicts of Interest

The authors declare no conflict of interest. T.G. is from Polpharma Biologics SA and A.W. is from Hy-Line International. The companies had no role in the design of the study; in the collection, analyses, or interpretation of data; in the writing of the manuscript, or in the decision to publish the results.

References

  1. Gress, K.L.; Charipova, K.; Kaye, A.D.; Viswanath, O.; Urits, I. An Overview of Current Recommendations and Options for the Management of Cancer Pain: A Comprehensive Review. Oncol. Ther. 2020, 8, 251–259. [Google Scholar] [CrossRef]
  2. Karbownik, A.; Miedziaszczyk, M.; Grabowski, T.; Stanisławiak-Rudowicz, J.; Jaźwiec, R.; Wolc, A.; Grześkowiak, E.; Szałek, E. In vivo assessment of potential for UGT-inhibition-based drug-drug interaction between sorafenib and tapentadol. Biomed. Pharmacother. 2020, 130, 110530. [Google Scholar] [CrossRef]
  3. Gong, L.; Giacomini, M.M.; Giacomini, C.; Maitland, M.L.; Altman, R.B.; Klein, T.E. PharmGKB summary: Sorafenib pathways. Pharm. Genom. 2017, 27, 240–246. [Google Scholar] [CrossRef] [PubMed]
  4. Bertot, L.C.; Adams, L.A. Trends in hepatocellular carcinoma due to non-alcoholic fatty liver disease. Expert Rev. Gastroenterol. Hepatol. 2019, 13, 179–187. [Google Scholar] [CrossRef] [PubMed]
  5. Hsieh, J.J.; Purdue, M.P.; Signoretti, S.; Swanton, C.; Albiges, L.; Schmidinger, M.; Heng, D.Y.; Larkin, J.; Ficarra, V. Renal cell carcinoma. Nat. Rev. Dis. Primers 2017, 3, 17009. [Google Scholar] [CrossRef] [PubMed]
  6. Cabanillas, M.E.; McFadden, D.G.; Durante, C. Thyroid cancer. Lancet 2016, 388, 2783–2795. [Google Scholar] [CrossRef]
  7. Miners, J.O.; Chau, N.; Rowland, A.; Burns, K.; MnKinnon, R.A.; Mackenzie, P.I.; Tucker, G.T.; Knights, K.M.; Kichenadasse, G. Inhibition of human UDP-glucuronosyltransferase enzymes by lapatinib, pazopanib, regorafenib and sorafenib: Implications for hyperbilirubinemia. Biochem. Pharmacol. 2017, 129, 85–95. [Google Scholar] [CrossRef]
  8. Chen, M.; Neul, C.; Schaeffeler, E.; Frisch, F.; Winter, S.; Schwab, M.; Koepsell, H.; Hu, S.; Laufer, S.; Baker, S.D.; et al. Sorafenib activity and disposition in liver cancer does not depend on organic cation transporter 1. Clin. Pharmacol. Ther. 2020, 107, 227–237. [Google Scholar] [CrossRef]
  9. Vasilyeva, A.; Durmus, S.; Li, L.; Wagenaar, E.; Hu, S.; Gibson, A.A.; Panetta, J.C.; Mani, S.; Sparreboom, A.; Baker, S.D.; et al. Hepatocellular shuttling and recirculation of sorafenib-glucuronide is dependent on Abcc2, Abcc3, and Oatp1a/1b. Cancer Res. 2015, 75, 2729–2736. [Google Scholar] [CrossRef] [Green Version]
  10. Summary of Product Characteristic for Nexavar 200 mg, European Medicines Agency. Available online: https://www.ema.europa.eu/en/documents/product-information/nexavar-epar-product-information_en.pdf (accessed on 6 April 2021).
  11. Karbownik, A.; Stachowiak, A.; Urjasz, H.; Sobańska, K.; Szczecińska, A.; Grabowski, T.; Stanisławiak-Rudowicz, J.; Wolc, A.; Grześkowiak, E.; Szałek, E. The oxidation and hypoglycaemic effect of sorafenib in streptozotocin-induced diabetic rats. Pharmacol. Rep. 2020, 72, 254–259. [Google Scholar] [CrossRef]
  12. Wang, X.; Zhang, X.; Huang, X.; Li, Y.; Wu, M.; Liu, J. The drug-drug interaction of sorafenib mediated by P-glicoprotein and CYP3A4. Xenobiotica 2015, 46, 651–658. [Google Scholar] [CrossRef]
  13. Kimura, Y.; Shibata, M.; Tamada, M.; Ozaki, N.; Arai, K. Pharmacokinetics of Morphine in Rats with Adjuvant-induced Arthritis. In Vivo 2017, 31, 811–817. [Google Scholar] [CrossRef] [PubMed] [Green Version]
  14. Gadeyne, C.; Van der Heyden, S.; Gasthuys, F.; Croubels, S.; Schauvliege, S.; Polis, I. The influence of modulation of P-glycoprotein and/or cytochrome P450 3A on the pharmacokinetics and pharmacodynamics of orally administered morphine in dogs. J. Vet. Pharmacol. Ther. 2011, 34, 417–423. [Google Scholar] [CrossRef]
  15. De Gregori, S.; De Gregori, M.; Ranzani, G.N.; Allegri, M.; Minella, C.; Regazzi, M. Morphine metabolism, transport and brain disposition. Metab. Brain Dis. 2012, 27, 1–5. [Google Scholar] [CrossRef] [Green Version]
  16. Ing Lorenzini, K.; Girardin, F. Direct-acting antiviral interactions with opioids, alcohol or illicit drugs of abuse in HCV-infected patients. Liver Int. 2020, 40, 32–44. [Google Scholar] [CrossRef] [PubMed] [Green Version]
  17. Schinkel, A.H.; Wagenaar, E.; van Deemter, L.; Mol, C.A.; Borst, P. Absence of the mdr1a P-Glycoprotein in mice affects tissue distribution and pharmacokinetics of dexamethasone, digoxin, and cyclosporin A. J. Clin. Investig. 1995, 96, 1698–1705. [Google Scholar] [CrossRef] [PubMed] [Green Version]
  18. Letrent, S.P.; Polli, J.W.; Humphreys, J.E.; Pollack, G.M.; Brouwer, K.R.; Brouwer, K.L. P-glycoprotein-mediated transport of morphine in brain capillary endothelial cells. Biochem. Pharmacol. 1999, 58, 951–957. [Google Scholar] [CrossRef]
  19. Crowe, A. The influence of P-glycoprotein on morphine transport in Caco-2 cells. Comparison with paclitaxel. Eur. J. Pharmacol. 2002, 440, 7–16. [Google Scholar] [CrossRef]
  20. Xie, R.; Hammarlund-Udenaes, M.; de Boer, A.G.; de Lange, E.C. The role of P-glycoprotein in blood-brain barrier transport of morphine: Transcortical microdialysis studies in mdr1a (-/-) and mdr1a (+/+) mice. Br. J. Pharmacol. 1999, 128, 563–568. [Google Scholar] [CrossRef] [Green Version]
  21. Letrent, S.P.; Pollack, G.M.; Brouwer, K.R.; Brouwer, K.L. Effect of GF120918, a potent P-glycoprotein inhibitor, on morphine pharmacokinetics and pharmacodynamics in the rat. Pharm Res. 1998, 15, 599–605. [Google Scholar] [CrossRef] [PubMed]
  22. Aquilante, C.L.; Letrent, S.P.; Pollack, G.M.; Brouwer, K.L. Increased brain P-glycoprotein in morphine tolerant rats. Life Sci. 2000, 66, PL47–PL51. [Google Scholar] [CrossRef]
  23. Fujita-Hamabe, W.; Nishida, M.; Nawa, A.; Kobori, T.; Nakamoto, K.; Kishioka, S.; Tokuyama, S. Etoposide modulates the effects of oral morphine analgesia by targeting the intestinal P-glycoprotein. J. Pharm. Pharmacol. 2012, 64, 496–504. [Google Scholar] [CrossRef] [PubMed]
  24. Seleman, M.; Chapy, H.; Cisternino, S.; Courtin, C.; Smirnova, M.; Schlatter, J.; Chiadmi, F.; Scherrmann, J.M.; Noble, F.; Marie-Claire, C. Impact of P-glycoprotein at the blood-brain barrier on the uptake of heroin and its main metabolites: Behavioral effects and consequences on the transcriptional responses and reinforcing properties. Psychopharmacology 2014, 231, 3139–3149. [Google Scholar] [CrossRef] [PubMed]
  25. Zong, J.; Pollack, G.M. Morphine antinociception is enhanced in mdr1a gene-deficient mice. Pharm. Res. 2000, 17, 749–753. [Google Scholar] [CrossRef] [PubMed]
  26. Fudin, J.; Fontenelle, D.V.; Payne, A. Rifampin reduces oral morphine absorption: A case of transdermal buprenorphine selection based on morphine pharmacokinetics. J. Pain Palliat. Care Pharmacother. 2012, 26, 362–367. [Google Scholar] [CrossRef] [PubMed]
  27. Wang, J.; Cai, B.; Huang, D.X.; Yang, S.D.; Guo, L. Decreased analgesic effect of morphine, but not buprenorphine, in patients with advanced P-glycoprotein(+) cancers. Pharmacol. Rep. 2012, 64, 870–877. [Google Scholar] [CrossRef]
  28. Meissner, K.; Avram, M.J.; Yermolenka, V.; Francis, A.M.; Blood, J.; Kharasch, E.D. Cyclosporine-inhibitable blood-brain barrier drug transport influences clinical morphine pharmacodynamics. Anesthesiology 2013, 119, 941–953. [Google Scholar] [CrossRef] [Green Version]
  29. Drewe, J.; Ball, H.A.; Beglinger, C.; Peng, B.; Kemmler, A.; Schächinger, H.; Haefeli, W.E. Effect of P-glycoprotein modulation on the clinical pharmacokinetics and adverse effects of morphine. Br. J. Clin. Pharmacol. 2000, 50, 237–246. [Google Scholar] [CrossRef] [Green Version]
  30. Lötsch, J.; Schmidt, R.; Vetter, G.; Schmidt, H.; Niederberger, E.; Geisslinger, G.; Tegeder, I. Increased CNS uptake and enhanced antinociception of morphine-6-glucuronide in rats after inhibition of P-glycoprotein. J. Neurochem. 2002, 83, 241–248. [Google Scholar] [CrossRef] [Green Version]
  31. Gharavi, R.; Hedrich, W.; Wang, H.; Hassan, H.E. Transporter-Mediated Disposition of Opioids: Implications for Clinical Drug Interactions. Pharm. Res. 2015, 32, 2477–2502. [Google Scholar] [CrossRef] [PubMed]
  32. Thompson, S.J.; Koszdin, K.; Bernards, C.M. Opiate-induced analgesia is increased and prolonged in mice lacking P-glycoprotein. Anesthesiology 2000, 92, 1392–1399. [Google Scholar] [CrossRef] [PubMed]
  33. Dagenais, C.; Zong, J.; Ducharme, J.; Pollack, G.M. Effect of mdr1a P-glycoprotein gene disruption, gender, and substrate concentration on brain uptake of selected compounds. Pharm. Res. 2001, 18, 957–963. [Google Scholar] [CrossRef]
  34. Hamabe, W.; Maeda, T.; Kiguchi, N.; Yamamoto, C.; Tokuyama, S.; Kishioka, S. Negative relationship between morphine analgesia and P-glycoprotein expression levels in the brain. J. Pharmacol. Sci. 2007, 105, 353–360. [Google Scholar] [CrossRef] [Green Version]
  35. Fudin, J.; Fontenelle, D.V.; Fudin, H.R.; Carlyn, C.; Hinden, D.A.; Ashley, C.C. Potential P-glycoprotein pharmacokinetic interaction of telaprevir with morphine or methadone. J. Pain Palliat. Care Pharmacother. 2013, 27, 261–267. [Google Scholar] [CrossRef] [PubMed]
  36. Tournier, N.; Declèves, X.; Saubaméa, B.; Scherrmann, J.M.; Cisternino, S. Opioid transport by ATP-binding cassette transporters at the blood-brain barrier: Implications for neuropsychopharmacology. Curr. Pharm. Des. 2011, 17, 2829–2842. [Google Scholar] [CrossRef]
  37. Wandel, C.; Kim, R.; Wood, M.; Wood, A. Interaction of morphine, fentanyl, sufentanil, alfentanil, and loperamide with the efflux drug transporter P-glycoprotein. Anesthesiology 2002, 96, 913–920. [Google Scholar] [CrossRef]
  38. Tzvetkov, M.V.; dos Santos Pereira, J.N.; Meineke, I.; Saadatmand, A.R.; Stingl, J.C.; Brockmöller, J. Morphine is a substrate of the organic cation transporter OCT1 and polymorphisms in OCT1 gene affect morphine pharmacokinetics after codeine administration. Biochem. Pharmacol. 2013, 86, 666–678. [Google Scholar] [CrossRef] [PubMed] [Green Version]
  39. Venkatasubramanian, R.; Fukuda, T.; Niu, J.; Mizuno, T.; Chidambaran, V.; Vinks, A.A.; Sadhasivam, S. ABCC3 and OCT1 genotypes influence pharmacokinetics of morphine in children. Pharmacogenomic 2014, 15, 1297–1309. [Google Scholar] [CrossRef] [Green Version]
  40. Van de Wetering, K.; Zelcer, N.; Kuil, A.; Feddema, W.; Hillebrand, M.; Vlaming, M.L.; Schinkel, A.H.; Beijnen, J.H.; Borst, P. Multidrug resistance proteins 2 and 3 provide alternative routes for hepatic excretion of morphine-glucuronides. Mol. Pharmacol. 2007, 72, 387–394. [Google Scholar] [CrossRef]
  41. Bourasset, F.; Cisternino, S.; Temsamani, J.; Scherrmann, J.M. Evidence for an active transport of morphine-6-beta-d-glucuronide but not P-glycoprotein-mediated at the blood-brain barrier. J. Neurochem. 2003, 86, 1564–1567. [Google Scholar] [CrossRef] [PubMed]
  42. Van Leeuwen, R.W.F.; Van Gelder, T.; Mathijssen, R.H.J.; Jansman, F.G.A. Drug-drug interactions with tyrosine-kinase inhibitors: A clinical perspective. Lancet Oncol. 2014, 15, 315–326. [Google Scholar] [CrossRef]
  43. Wang, X.; Zhang, X.; Liu, F.; Wang, M.; Qin, S. The effects of triptolide on the pharmacokinetics of sorafenib in rats and its potential mechanism. Pharm. Biol. 2017, 55, 1863–1867. [Google Scholar] [CrossRef] [Green Version]
  44. Afify, S.; Rapp, U.R.; Högger, P. Validation of a liquid chromatography assay for the quantification of the Raf kinase inhibitor BAY 43-9006 in small volumes of mouse serum. J. Chromatogr. B Analyt. Technol. Biomed. Life Sci. 2004, 809, 99–103. [Google Scholar] [CrossRef]
  45. Yu, J.; Petrie, I.D.; Levy, R.H.; Ragueneau-Majlessi, I. Mechanisms and Clinical Significance of Pharmacokinetic-Based Drug-Drug Interactions with Drugs Approved by the U.S. Food and Drug Administration in 2017. Drug Metab. Dispos. 2019, 47, 135–144. [Google Scholar] [CrossRef] [PubMed] [Green Version]
  46. Peng, Y.; Cheng, Z.; Xie, F. Evaluation of Pharmacokinetic Drug-Drug Interactions: A Review of the Mechanisms, In Vitro and In Silico Approaches. Metabolites 2021, 11, 75. [Google Scholar] [CrossRef] [PubMed]
  47. In Vitro Drug Interaction Studies—Cytochrome P450 Enzyme- and Transporter-Mediated Drug Interactions. Guidance for Industry. U.S. Department of Health and Human Services Food and Drug Administration Center for Drug Evaluation and Research (CDER). January 2020, Clinical Pharmacology. Available online: https://www.fda.gov/regulatory-information/search-fda-guidance-documents/vitro-drug-interaction-studies-cytochrome-p450-enzyme-and-transporter-mediated-drug-interactions (accessed on 8 November 2021).
  48. Cole, S.; Kerwash, E.; Andersson, A. A summary of the current drug interaction guidance from the European Medicines Agency and considerations of future updates. Drug Metab. Pharmacokinet. 2020, 35, 2–11. [Google Scholar] [CrossRef]
  49. Azam, C.; Claraz, P.; Chevreau, C.; Vinson, C.; Cottura, E.; Mourey, L.; Pouessel, D.; Guibaud, S.; Pollet, O.; Le Goff, M.; et al. Association between clinically relevant toxicities of pazopanib and sunitinib and the use of weak CYP3A4 and P-gp inhibitors. Eur. J. Clin. Pharmacol. 2020, 76, 579–587. [Google Scholar] [CrossRef] [PubMed]
  50. Oostendorp, R.L.; Buckl, T.; Beijnen, J.H.; van Tellingen, O.; Schellens, J.H. The effect of P-gp (Mdr1a/1b), BCRP (Bcrp1) and P-gp/BCRP inhibitors on the in vivo absorption, distribution, metabolism and excretion of imatinib. Investig. New Drugs 2009, 27, 31–40. [Google Scholar] [CrossRef]
  51. Teo, Y.L.; Ho, H.K.; Chan, A. Metabolism-related pharmacokinetic drug-drug interactions with tyrosine kinase inhibitors: Current understanding, challenges and recommendations. Br. J. Clin. Pharmacol. 2015, 79, 241–253. [Google Scholar] [CrossRef] [Green Version]
  52. Campa, D.; Gioia, A.; Tomei, A.; Poli, P.; Barale, R. Association of ABCB1/MDR1 and OPRM1 gene polymorphisms with morphine pain relief. Clin. Pharmacol. Ther. 2008, 83, 559–566. [Google Scholar] [CrossRef]
  53. Coulbault, L.; Beaussier, M.; Verstuyft, C.; Weickmans, H.; Dubert, L.; Trégouet, D.; Descot, C.; Parc, Y.; Lienhart, A.; Jaillon, P.; et al. Environmental and genetic factors associated with morphine response in the postoperative period. Clin. Pharmacol. Ther. 2006, 79, 316–324. [Google Scholar] [CrossRef] [PubMed]
  54. Hasegawa, Y.; Kishimoto, S.; Shibatani, N.; Nomura, H.; Ishii, Y.; Onishi, M.; Inotsume, N.; Takeuchi, Y.; Fukushima, S. The pharmacokinetics of morphine and its glucuronide conjugate in a rat model of streptozotocin-induced diabetes and the expression of MRP2, MRP3 and UGT2B1 in the liver. J. Pharm. Pharmacol. 2010, 62, 310–314. [Google Scholar] [CrossRef] [PubMed]
Figure 1. The sorafenib plasma concentration–time profiles in rats receiving sorafenib (IISOR) and sorafenib + morphine (ISOR+MF).
Pharmaceutics 13 02172 g001
Figure 2. The sorafenib N-oxide plasma concentration–time profiles in rats receiving sorafenib (IISOR) and sorafenib + morphine (ISOR+MF).
Pharmaceutics 13 02172 g002
Figure 3. The morphine plasma concentration–time profiles in rats receiving morphine (IIIMF) and sorafenib + morphine (ISOR+MF).
Pharmaceutics 13 02172 g003
Figure 4. The morphine-3-glucuronide plasma concentration–time profiles in rats receiving morphine (IIIMF) and sorafenib + morphine (ISOR+MF).
Pharmaceutics 13 02172 g004
Table 1. Pharmacokinetic parameters of sorafenib and its metabolite sorafenib N-oxide after a single oral dose of100 mg/kg b.w. of sorafenib (IISOR group) and a single oral dose of 100 mg/kg b.w. of sorafenib + single intraperitoneal dose 5 mg/kg b.w. of morphine (ISOR+MF group).
Pharmacokinetic ParametersIISOR
(n = 8)
ISOR+MF
(n = 8)
p-Value
ISOR+MF vs. IISOR
Gmean Ratio *
(90% CI)
ISOR+MF
vs. IISOR
sorafenib
Cmax (µg/mL)1.56 ± 0.353.25 ± 0.800.00302.08 (1.70; 2.55)
(22.6)(24.6)
Cmax/(D/kg)0.03 ± 0.010.07 ± 0.02<0.00012.13 (1.73; 2.62)
(kg × µg/mL/mg)(23.9)(23.6)
AUC0–t62.83 ± 16.1497.98 ± 30.170.01151.53 (1.16; 2.02)
(µg × h/mL)(25.7)(30.8)
AUC0–t/(D/kg)1.25 ± 0.321.99 ± 0.590.00751.57 (1.20; 2.05)
(µg × h × kg/mL/mg)(25.4)(29.7)
AUC0–∞ (µg × h/mL)67.05 ± 16.70109.08 ± 37.180.01151.58 (1.17; 2.13)
(24.9)(34.1)
AUC0–∞/(D/kg)1.33 ± 0.332.21 ± 0.730.00761.62 (1.21; 2.16)
(µg × h × kg/mL/mg)(24.9)(32.9)
tmax (h)5.13 ± 2.17 (42.3)7.63 ± 2.72 (35.7)0.06161.54 (1.06; 2.25)
ka (h−1)0.74 ± 0.31 (42.5)0.03 ± 0.01 (20.5)0.00080.03 (0.03; 0.05)
kel (h−1)0.035 ± 0.01 (30.3)0.29 ± 0.16 (53.5)0.00088.16 (5.98; 11.12)
t1/2 (h)21.89 ± 7.79 (35.6)27.31 ± 5.32 (19.5)0.08291.25 (1.02; 1.53)
Cl/F (L/h × kg)0.80 ± 0.22 (27.1)0.51 ± 0.23 (43.8)0.02240.62 (0.46; 0.83)
Vd/F (L)25.30 ± 11.59 (45.8)19.14 ± 5.26 (27.5)0.08290.77 (0.59; 1.01)
sorafenib N-oxide
Cmax (µg/mL)0.11 ± 0.02 (21.8)0.27 ± 0.16 (57.5)0.00222.15 (1.50; 3.08)
AUC0–t (µg × h/mL)4.10 ± 1.56 (38.1)6.64 ± 2.44 (36.8)0.02681.64 (1.14; 2.36)
AUC0–∞ (µg × h/mL)8.61 ± 2.19 (25.4)9.39 ± 2.97 (31.6)0.12421.41 (0.95; 2.08)
tmax (h)16.38 ± 8.21 (50.1)14.50 ± 11.40 (78.6)0.45310.76 (0.41; 1.39)
kel (h−1)0.016 ± 0.010 (60.9)0.023 ± 0.012 (51.6)0.40010.80 (0.47; 1.36)
t1/2 (h)53.31 ± 25.23 (47.3)39.30 ± 22.54 (57.4)0.46221.25 (0.73; 2.13)
ratio sorafenib N-oxide/sorafenib
Cmax (µg/mL)0.07 ± 0.02 (26.8)0.09 ± 0.07 (76.2)0.52801.03 (0.67; 1.61)
AUC0–t (µg × h/mL)0.07 ± 0.02 (37.1)0.07 ± 0.03 (43.7)0.60121.07 (0.70; 1.65)
AUC0–∞ (µg × h/mL)0.14 ± 0.05 (38.1)0.10 ± 0.07 (64.1)0.91760.89 (0.53; 1.51)
Cmax, maximum observed plasma concentration; AUC0–t, area under the plasma concentration-time curve from zero to the last measurable concentration; AUC0–∞, area under the plasma concentration-time curve from zero to infinity; tmax, time to reach the Cmax; ka, absorption rate constant; kel, elimination rate constant; t1/2, half-life in the elimination phase; Cl/F, apparent plasma drug clearance; Vd/F, apparent volume of distribution; b.w., body weight; the pharmacokinetic parameter values are shown as the arithmetic means ± standard deviations (SD) with coefficients of variation (CV) (%) in the brackets; * geometric means (Gmean) ratio between ISOR+MF and IISOR groups (%) with a 90% confidence interval (CI) in the brackets; individual drug ratios were calculated according the following equations: the metabolite Cmax (ng/mL)/parent Cmax (ng/mL), metabolite AUC0–t (ng × h/mL)/parent drug AUC0–t (ng × h/mL), and metabolite AUC0–∞ (ng × h/mL)/parent drug AUC0–∞ (ng × h/mL).
Table 2. Pharmacokinetic parameters of morphine and its metabolite M3G after a single intraperitoneal dose of 5 mg/kg b.w. of morphine (IIIMF group) and a single oral dose of 100 mg/kg b.w. of sorafenib + single intraperitoneal dose of 5 mg/kg b.w. of morphine (ISOR+MF group).
Pharmacokinetic ParametersIIIMF
(n = 7)
ISOR+MF
(n = 8)
p-Value
ISOR+MF
vs. IIIMF
Gmean Ratio *
(90% CI)
ISOR+MF
vs. IIIMF
morphine
Cmax (ng/mL)166.83 ± 46.12261.83 ± 47.850.00181.59 (1.30; 1.94)
(27.6)(18.3)
Cmax/(D/kg)67.88 ± 18.74106.14 ± 18.960.00181.58 (1.30; 1.93)
(kg × ng/mL/mg)(27.6)(17.9)
AUC0–t (ng × h/mL)169.88 ± 47.37155.40 ± 28.410.47860.93 (0.75; 1.16)
(27.9)(18.3)
AUC0–t/(D/kg)69.28 ± 19.9963.06 ± 11.520.46550.93 (0.75; 1.16)
(ng × h × kg/mL/mg)(28.9)(18.3)
AUC0–∞ (ng × h/mL)174.44 ± 46.73162.57 ± 25.890.54580.95 (0.78; 1.17)
(26.8)(15.9)
AUC0–∞/(D/kg)71.14 ± 19.7565.96 ± 10.490.52870.95 (0.77; 1.17)
(ng × h × kg/mL/mg)(27.8)(15.9)
tmax (h)0.14 ± 0.16 (110.2)0.08 ± 0.00 (0.0)0.35590.77 (0.47; 1.27)
kel (h−1)0.60 ± 0.18 (29.3)0.54 ± 0.41 (76.1)0.29760.75 (0.46; 1.23)
t1/2 (h)1.22 ± 0.28 (22.7)1.91 ± 1.13 (59.3)0.29761.33 (0.82; 2.15)
Cl/F (L/h × kg)15.05 ± 4.39 (29.2)15.51 ± 2.36 (15.2)0.80101.06 (0.86; 1.30)
Vd/F (L/kg)27.49 ± 13.38 (48.7)44.65 ± 29.20 (65.4)0.17781.40 (0.76; 2.60)
M3G
Cmax (ng/mL)9781.28 ± 3184.17 (32.6)20,796.81 ± 3657.84,(17.6)<0.00012.20 (1.73; 2.80)
AUC0–t (ng × h/mL)10,035.88 ± 1408.48 (14.0)14,734.53 ± 3979.45 (27.0)0.01241.43 (1.14; 1.79)
AUC0–∞ (ng × h/mL)10,131.53 ± 1393.15 (13.8)14,871.32 ± 4001.35 (26.9)0.01211.42 (1.14; 1.79)
tmax (h)0.46 ± 0.09 (20.4)0.34 ± 0.13 (37.6)0.06620.71 (0.53; 0.96)
kel (h−1)0.73 ± 0.20 (27.6)0.68 ± 0.19 (28.0)0.63550.93 (0.69; 1.24)
t1/2 (h)1.03 ± 0.33 (32.5)1.13 ± 0.47 (41.1)0.72851.08 (0.81; 1.45)
M3G/morphine
Cmax (ng/mL)63.87 ± 30.71 (48.1)82.18 ± 21.67 (26.4)0.20041.14 (0.78; 1.66)
AUC0–t (ng × h/mL)64.45 ± 24.06 (37.3)97.35 ± 33.05 (34.0)0.04881.38 (0.96; 2.00)
AUC0–∞ (ng × h/mL)62.88 ± 22.44 (35.7)92.80 ± 28.44 (30.7)0.04351.53 (1.10; 2.12)
Cmax, maximum observed plasma concentration; AUC0–t, area under the plasma concentration-time curve from zero to the last measurable concentration; AUC0–∞, area under the plasma concentration-time curve from zero to infinity; tmax, time to reach the Cmax; ka, absorption rate constant; kel, elimination rate constant; t1/2, half-life in the elimination phase; Cl/F, apparent plasma drug clearance; Vd/F, apparent volume of distribution; b.w., body weight; the pharmacokinetic parameter values are shown as the arithmetic means ± standard deviations (SD) with coefficients of variation (CV) (%) in the brackets; * geometric means (Gmean) ratio between ISOR+MF and IISOR groups (%) with a 90% confidence interval (CI) in the brackets; individual drug ratios were calculated according the following equations: the metabolite Cmax (ng/mL)/parent Cmax (ng/mL), metabolite AUC0–t (ng × h/mL)/parent drug AUC0–t (ng × h/mL), and metabolite AUC0–∞ (ng × h/mL)/parent drug AUC0–∞ (ng × h/mL).
Publisher’s Note: MDPI stays neutral with regard to jurisdictional claims in published maps and institutional affiliations.

