Hybrid Fluorescence and Frequency-Domain Photoacoustic Microscopy for Imaging Development of Parhyale hawaiensis Embryos

 , , , and
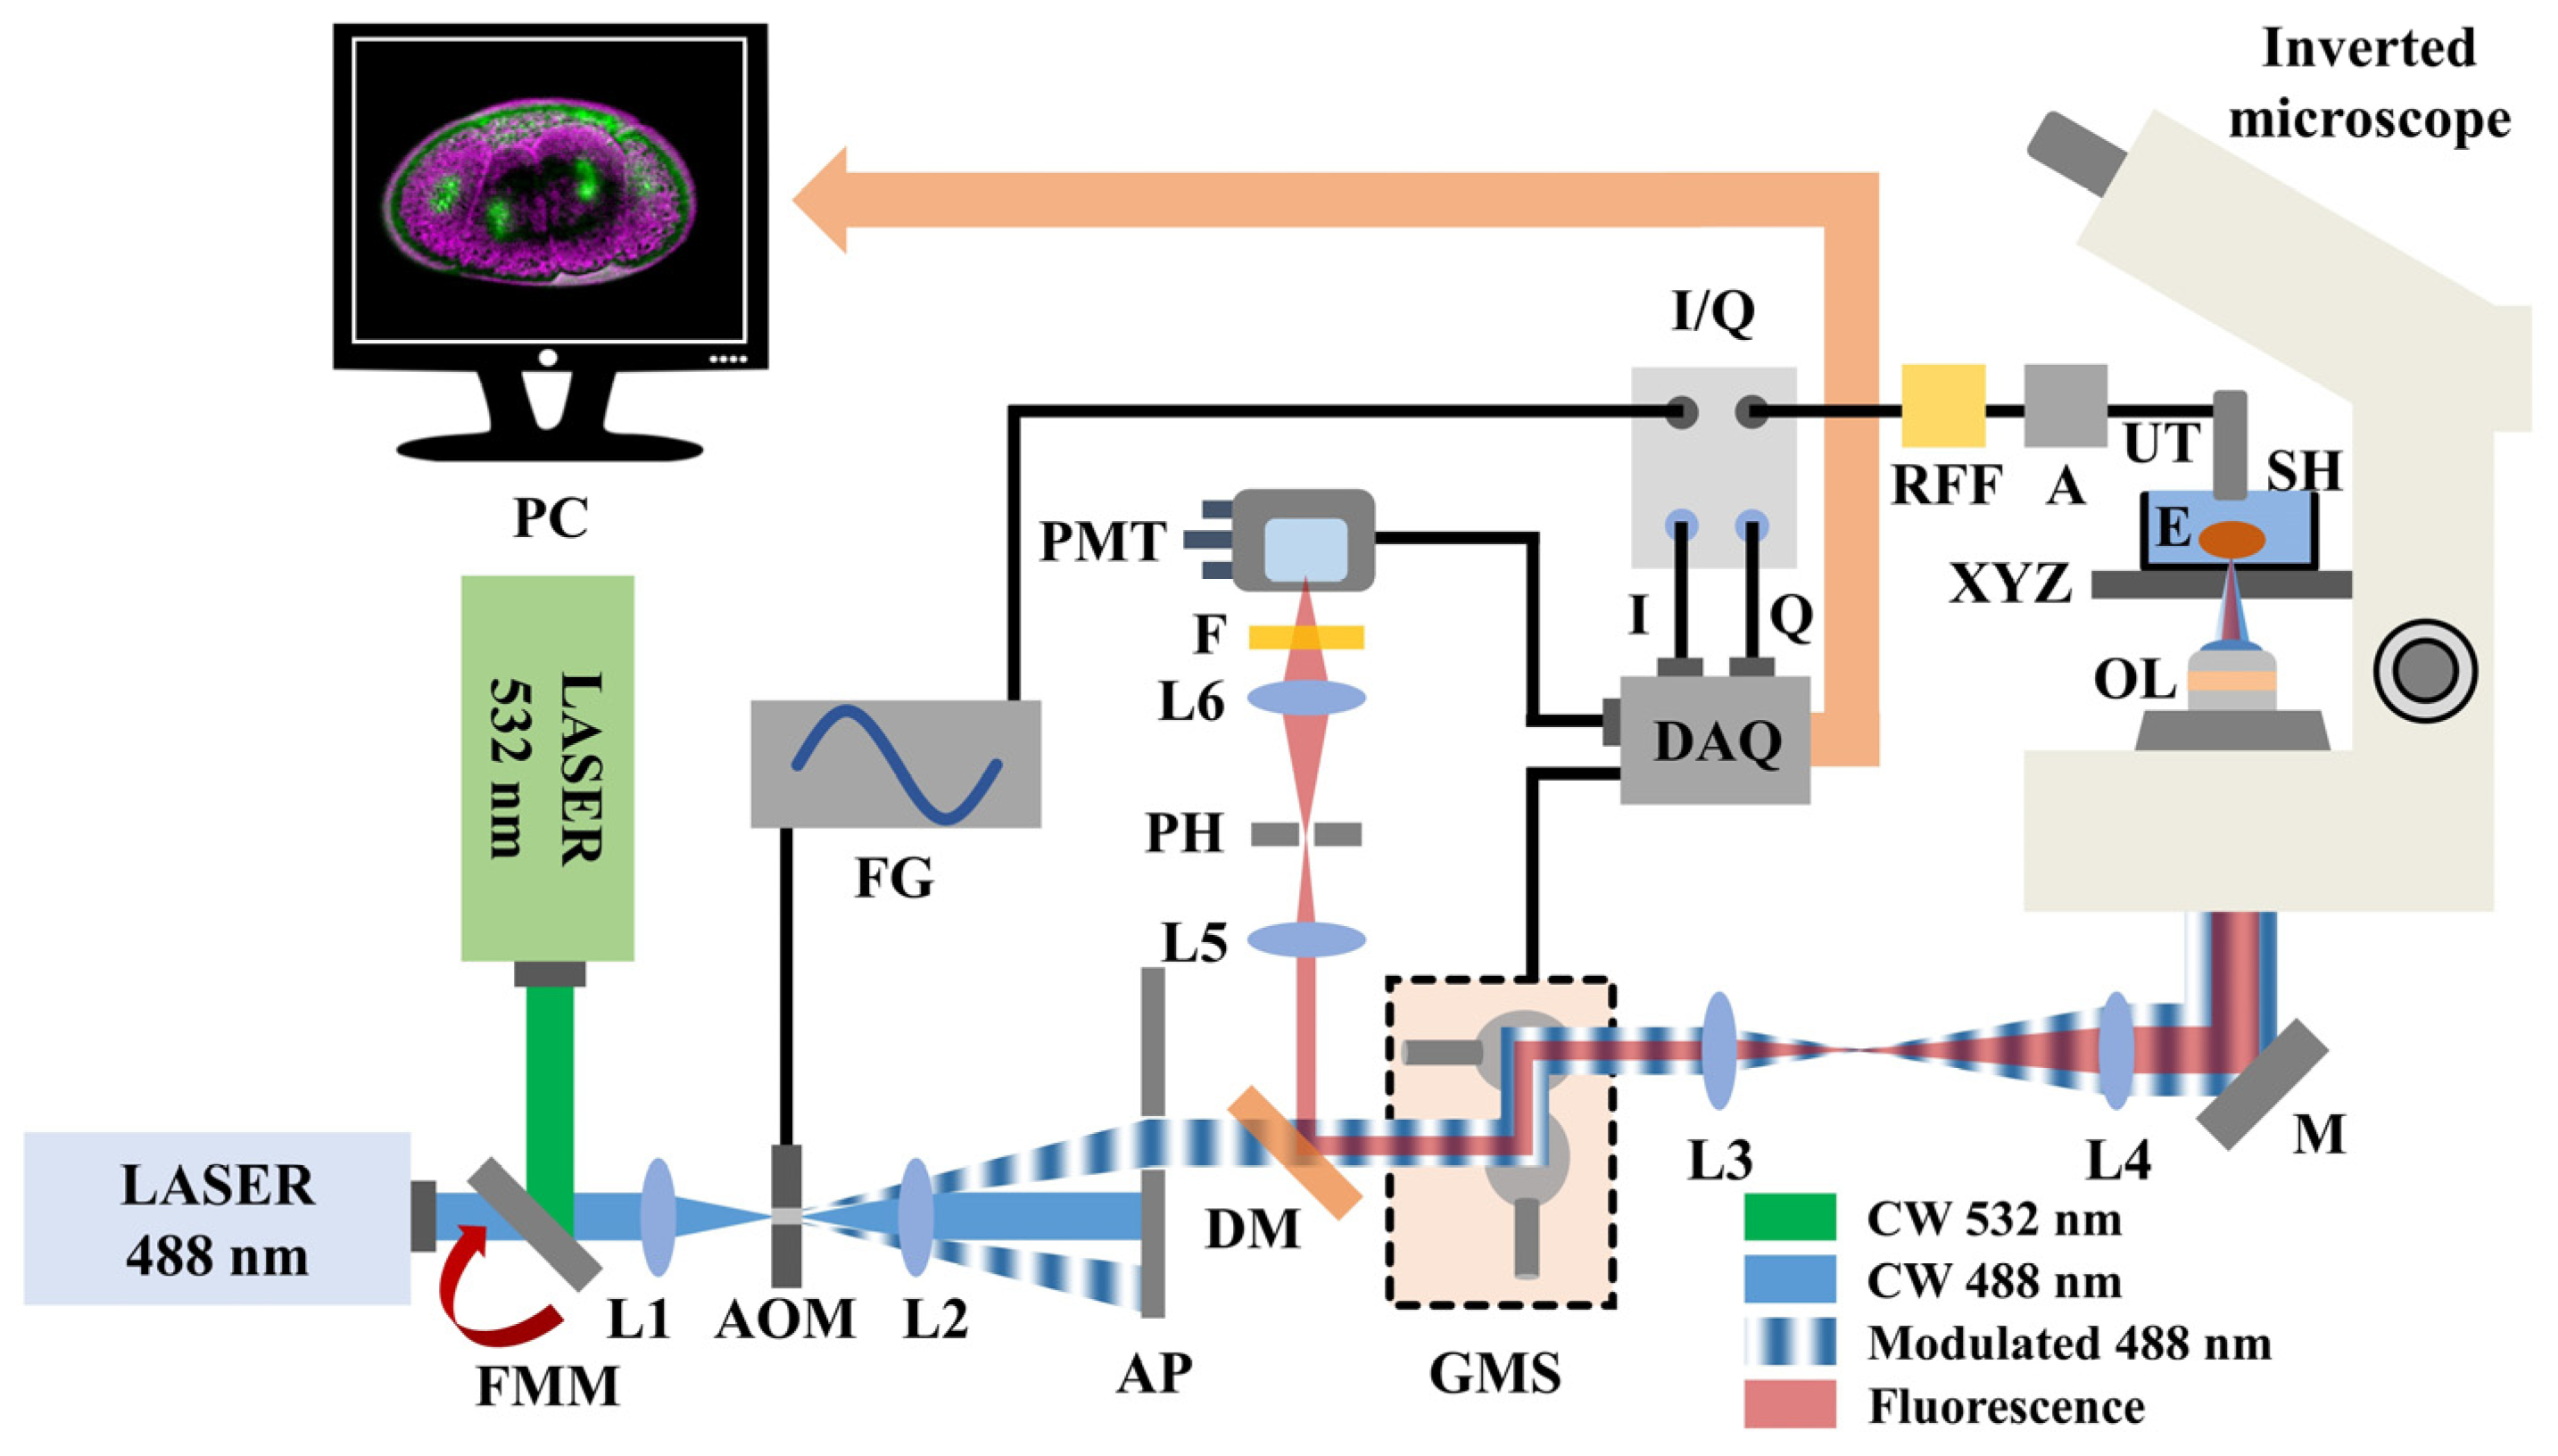
Abstract
:1. Introduction
2. Materials and Methods
2.1. Technical Description of the Hybrid Microscope
2.2. Preparation of the Parhyale hawaiensis Embryos
3. Results
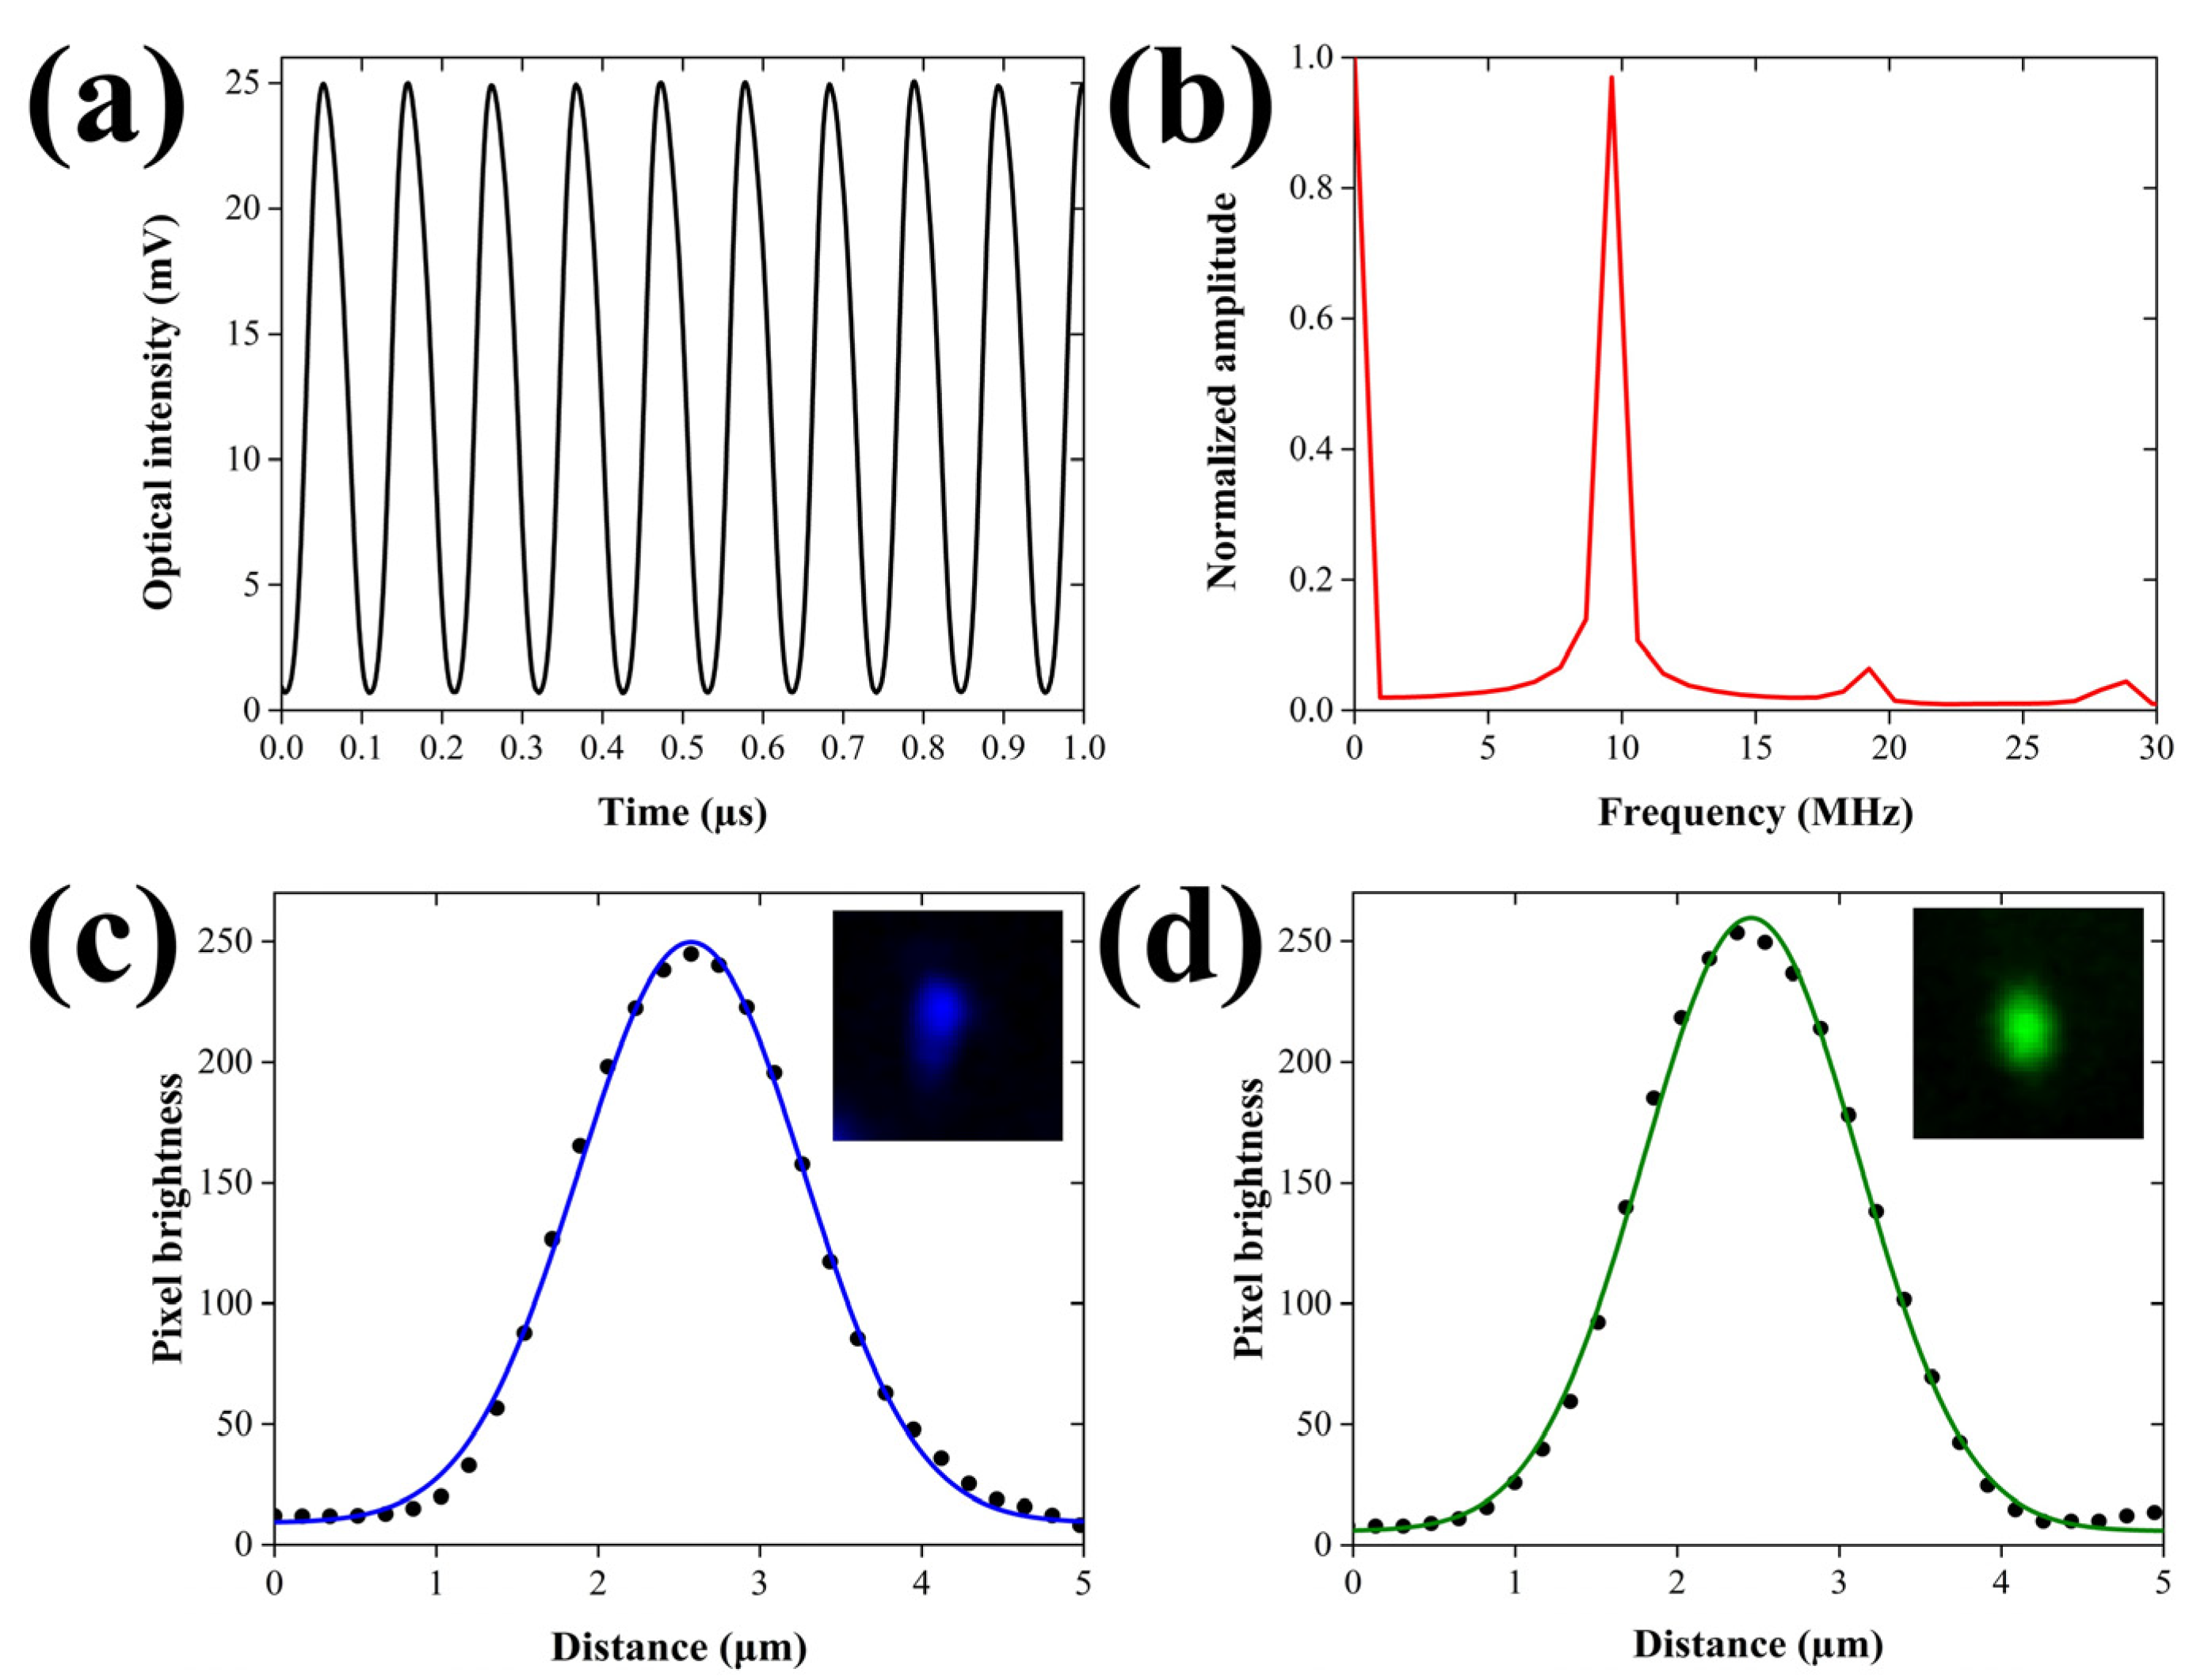
3.1. Characterization of Intensity Modulation and Spatial Resolution
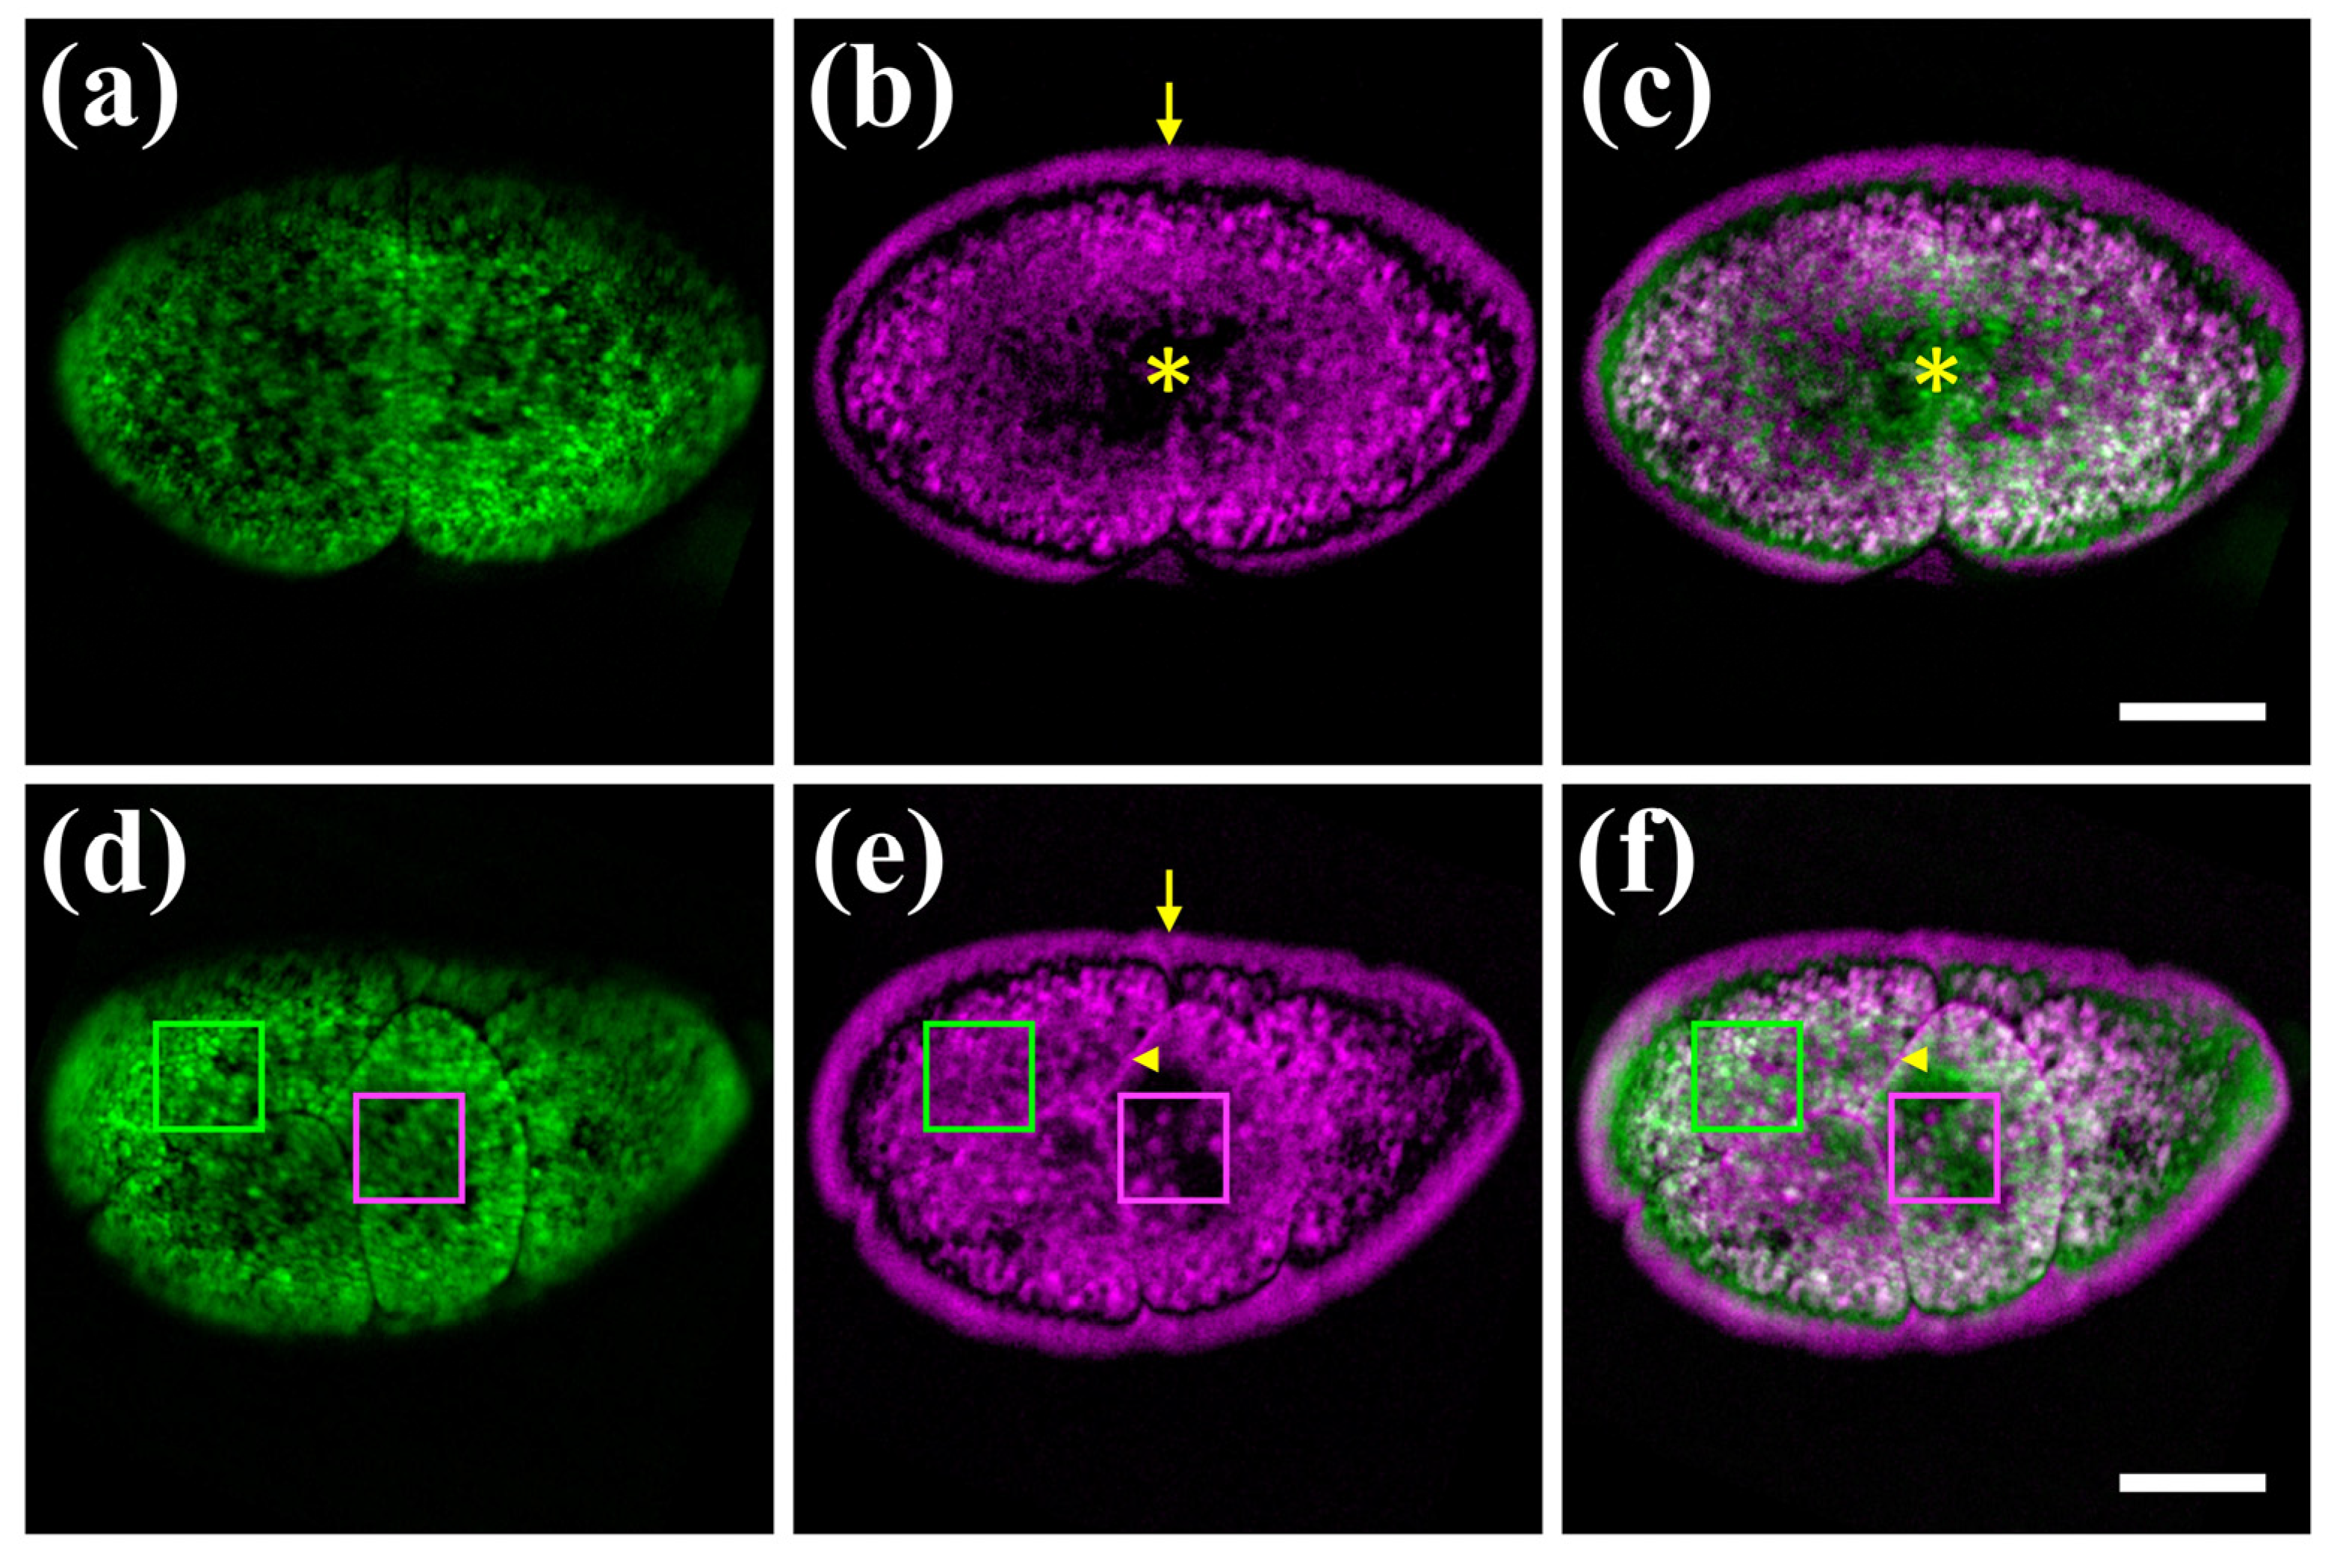
3.2. Hybrid Imaging of Unlabelled Parhyale hawaiensis Embryos
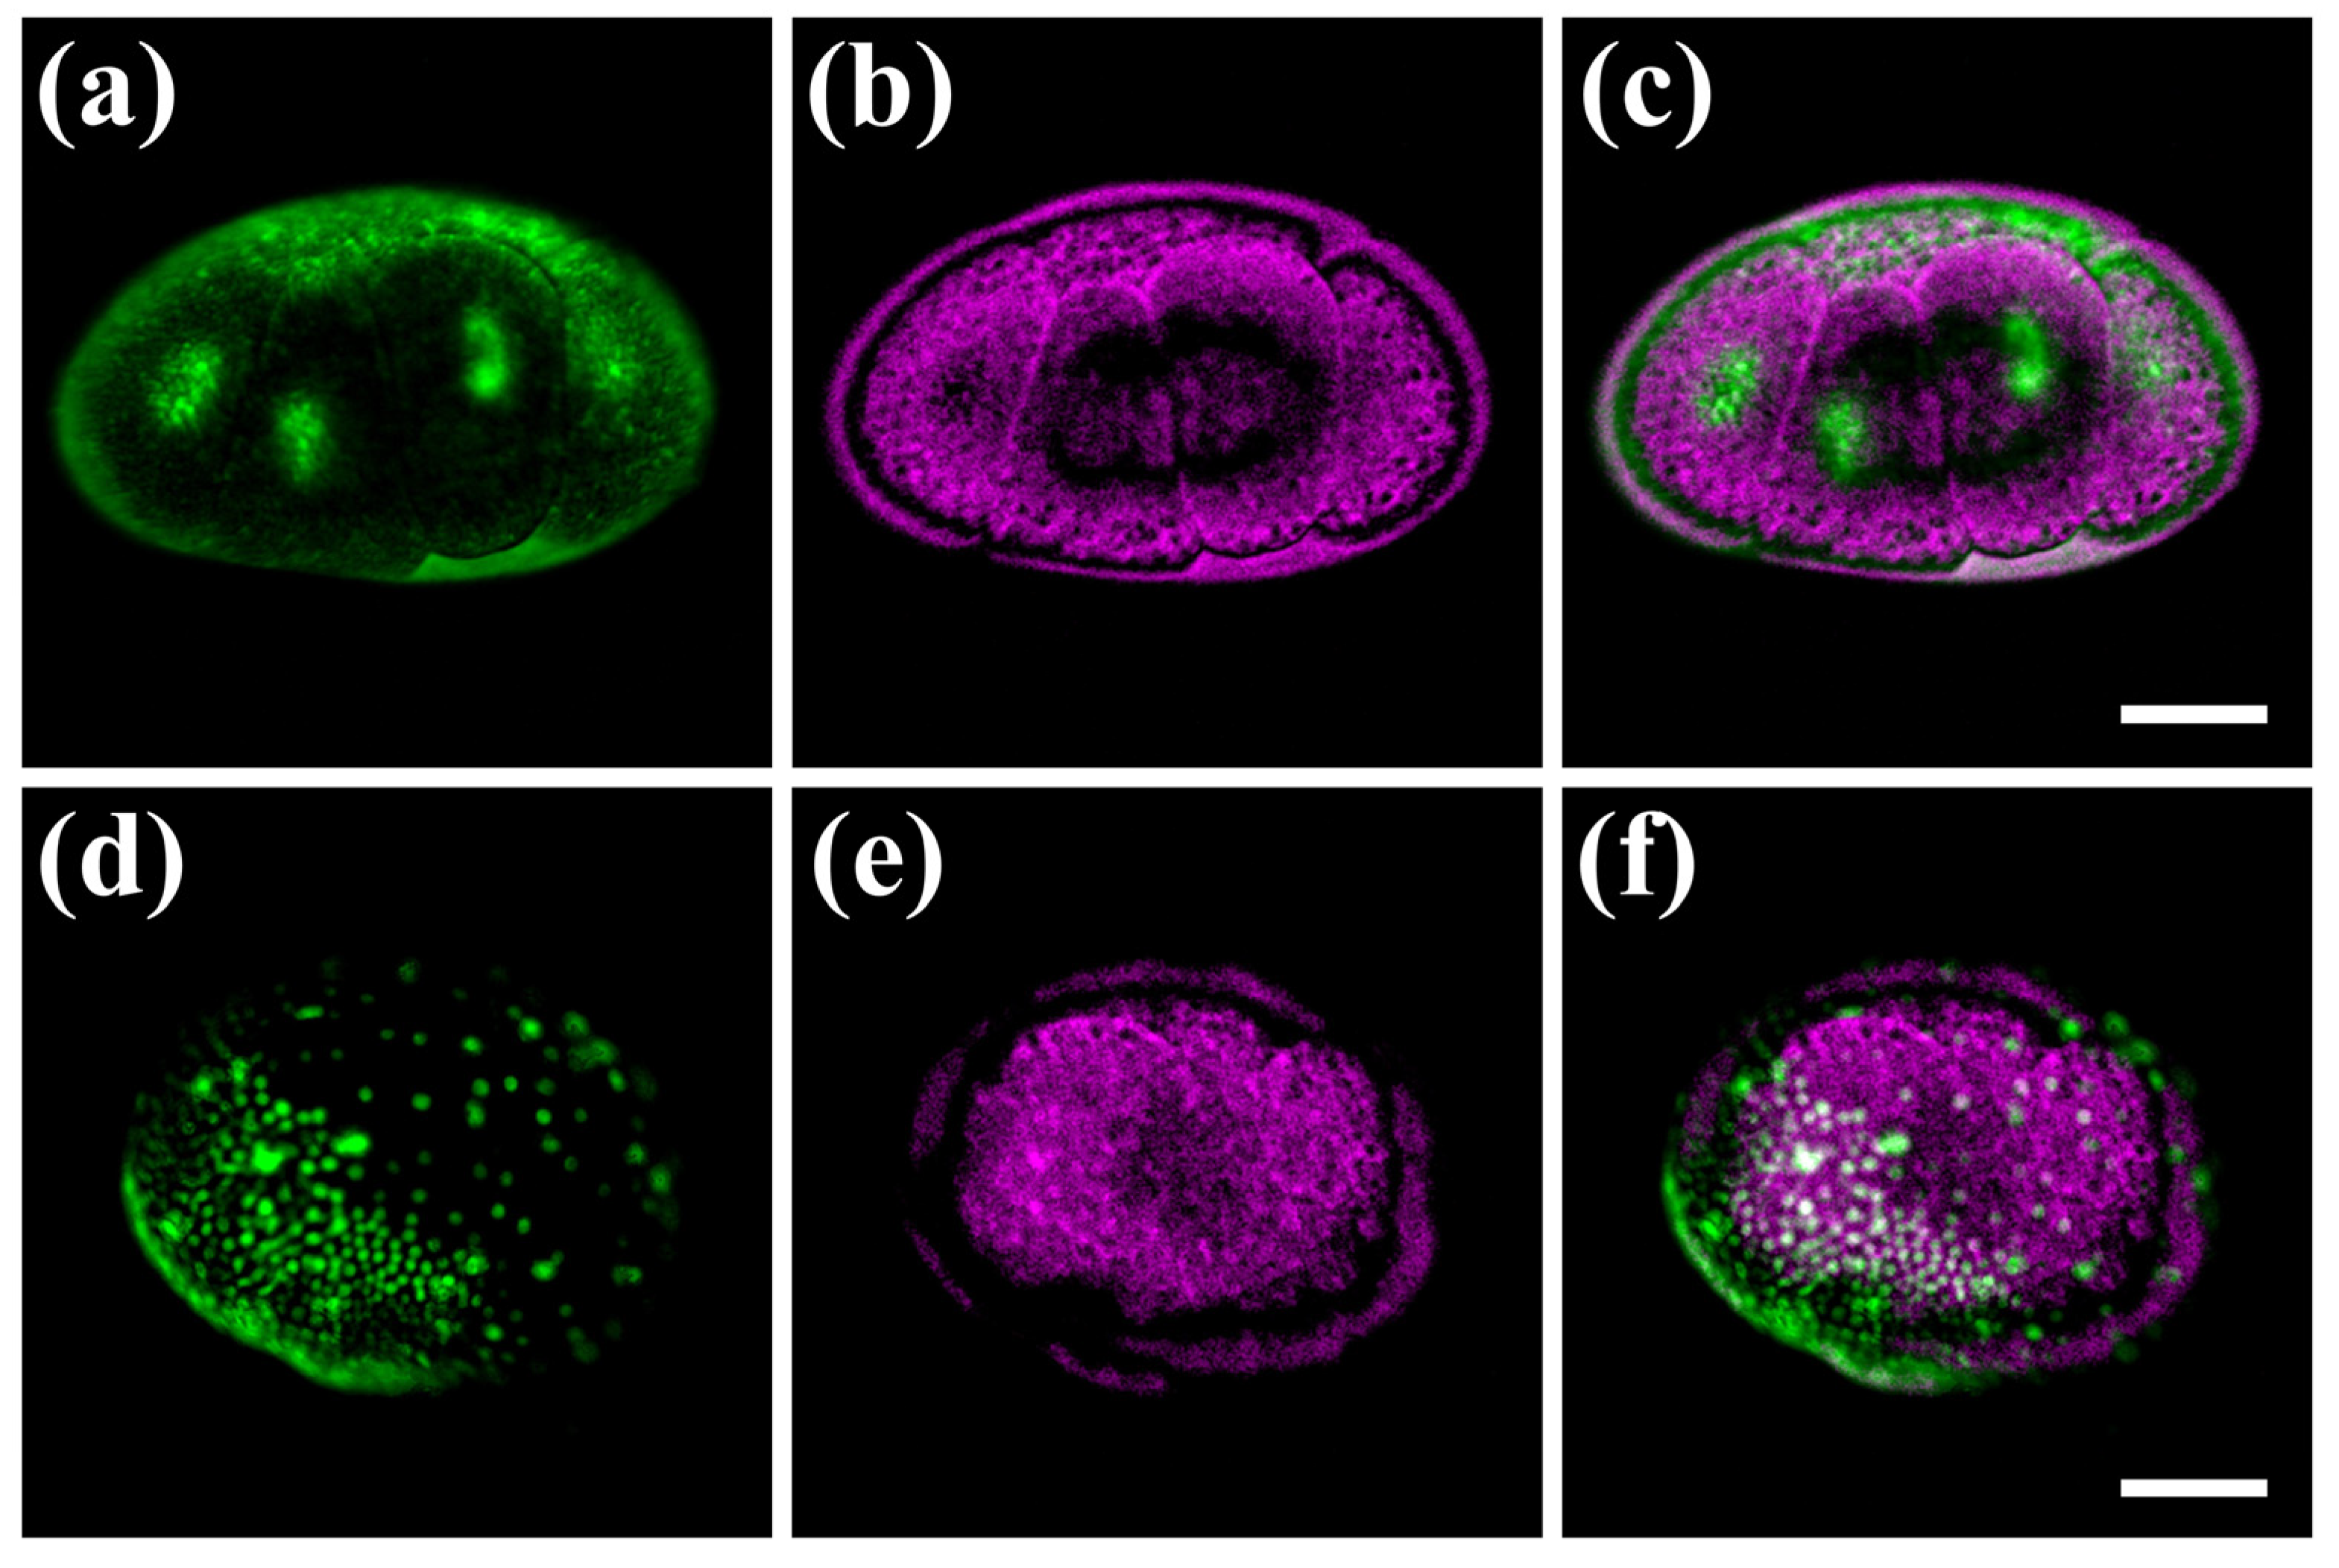
3.3. Hybrid Imaging of Fluorescently Labelled Parhyale hawaiensis Embryos
4. Discussion and Conclusions
Author Contributions
Funding
Data Availability Statement
Acknowledgments
Conflicts of Interest
References
- Irion, U.; Nüsslein-Volhard, C. Developmental genetics with model organisms. Proc. Natl. Acad. Sci. USA 2022, 119, e2122148119. [Google Scholar] [CrossRef] [PubMed]
- Rallis, J.; Kapai, G.; Pavlopoulos, A. Chapter 16—Parhyale hawaiensis, Crustacea. In Handbook of Marine Model Organisms in Experimental Biology: Established and Emerging; Boutet, A., Schierwater, B., Eds.; CRC Press: Boca Raton, FL, USA, 2021. [Google Scholar]
- Paris, M.; Wolff, C.; Patel, N.H.; Averof, M. The crustacean model parhyale hawaiensis. Curr. Top. Dev. Biol. 2022, 147, 199–230. [Google Scholar] [PubMed]
- Pavlopoulos, A.; Kontarakis, Z.; Liubicich, D.M.; Serano, J.M.; Akam, M.; Patel, N.H.; Averof, M. Probing the evolution of appendage specialization by hox gene misexpression in an emerging model crustacean. Proc. Natl. Acad. Sci. USA 2009, 106, 13897–13902. [Google Scholar] [CrossRef] [Green Version]
- Martin, A.; Serano, J.M.; Jarvis, E.; Bruce, H.S.; Wang, J.; Ray, S.; Barker, C.A.; O’Connell, L.C.; Patel, N.H. CRISPR/Cas9 mutagenesis reveals versatile roles of hox genes in crustacean limb specification and evolution. Curr. Biol. 2016, 26, 14–26. [Google Scholar] [CrossRef] [PubMed] [Green Version]
- Bruce, H.S.; Patel, N.H. Knockout of crustacean leg patterning genes suggests that insect wings and body walls evolved from ancient leg segments. Nat. Ecol. Evol. 2020, 4, 1703–1712. [Google Scholar] [PubMed]
- Clark-Hachtel, C.M.; Tomoyasu, Y. Two sets of candidate crustacean wing homologues and their implication for the origin of insect wings. Nat. Ecol. Evol. 2020, 4, 1694–1702. [Google Scholar] [CrossRef]
- Bruce, H.S.; Patel, N.H. The daphnia carapace and other novel structures evolved via the cryptic persistence of serial homologs. Cur. Biol. 2022, 32, 3792–3799.e3. [Google Scholar] [CrossRef] [PubMed]
- Price, A.L.; Modrell, M.S.; Hannibal, R.L.; Patel, N.H. Mesoderm and ectoderm lineages in the crustacean parhyale hawaiensis display intra-germ layer compensation. Dev. Biol. 2010, 341, 256–266. [Google Scholar] [CrossRef] [Green Version]
- Alwes, F.; Hinchen, B.; Extavour, C.G. Patterns of cell lineage, movement, and migration from germ layer specification to gastrulation in the amphipod crustacean parhyale hawaiensis. Dev. Biol. 2011, 359, 110–123. [Google Scholar] [CrossRef] [Green Version]
- Chaw, R.C.; Patel, N.H. Independent migration of cell populations in the early gastrulation of the amphipod crustacean Parhyale hawaiensis. Dev. Biol. 2012, 371, 94–109. [Google Scholar] [CrossRef] [Green Version]
- Wolff, C.; Tinevez, J.-Y.; Pietzsch, T.; Stamataki, E.; Harich, B.; Guignard, L.; Preibisch, S.; Shorte, S.; Keller, P.J.; Tomancak, P.; et al. Multi-view light-sheet imaging and tracking with the MaMuT software reveals the cell lineage of a direct developing arthropod limb. eLife 2018, 7, e34410. [Google Scholar] [CrossRef] [PubMed]
- Ramos, A.P.; Gustafsson, O.; Labert, N.; Salecker, I.; Nilsson, D.-E.; Averof, M. Analysis of the genetically tractable crustacean Parhyale hawaiensis reveals the organisation of a sensory system for low-resolution vision. BMC Biol. 2019, 17, 67. [Google Scholar] [CrossRef] [PubMed] [Green Version]
- Konstantinides, N.; Averof, M. A common cellular basis for muscle regeneration in arthropods and vertebrates. Science 2014, 343, 788–791. [Google Scholar] [CrossRef] [PubMed]
- Alwes, F.; Enjolras, C.; Averof, M. Live imaging reveals the progenitors and cell dynamics of limb regeneration. eLife 2016, 5, e19766. [Google Scholar] [CrossRef]
- Pavlopoulos, A.; Wolff, C. Crustacean limb morphogenesis during normal development and regeneration. In The Natural History of the Crustacea: Developmental Biology and Larval Ecology; Anger, K., Harzsch, S., Thiel, M., Eds.; Oxford University Press: Oxford, UK, 2020. [Google Scholar]
- Almazán, A.; Çevrim, Ç.; Musser, J.M.; Averof, M.; Paris, M. Crustacean leg regeneration restores complex microanatomy and cell diversity. Sci. Adv. 2022, 8, eabn9823. [Google Scholar] [CrossRef]
- Gerberding, M.; Browne, W.E.; Patel, N.H. Cell lineage analysis of the amphipod crustacean parhyale hawaiensis reveals an early restriction of cell fates. Development 2002, 129, 5789–5801. [Google Scholar] [CrossRef] [Green Version]
- Serano, J.M.; Martin, A.; Liubicich, D.M.; Jarvis, E.; Bruce, H.S.; La, K.; Browne, W.E.; Grimwood, J.; Patel, N.H. Comprehen-sive analysis of hox gene expression in the amphipod crustacean parhyale hawaiensis. Dev. Biol. 2016, 409, 297–309. [Google Scholar] [CrossRef]
- Kao, D.; Lai, A.G.; Stamataki, E.; Rosic, S.; Konstantinides, N.; Jarvis, E.; Di Donfrancesco, A.; Pouchkina-Stancheva, N.; Sémon, M.; Grillo, M.; et al. The genome of the crustacean parhyale hawaiensis, a model for animal development, regeneration, immunity and lignocellulose digestion. eLife 2016, 5, e20062. [Google Scholar] [CrossRef] [Green Version]
- Sugawara, K.; Çevrim, Ç.; Averof, M. Tracking cell lineages in 3D by incremental deep learning. eLife 2022, 11, e69380. [Google Scholar] [CrossRef]
- Tserevelakis, G.J.; Velentza, S.; Liaskas, I.; Archontidis, T.; Pavlopoulos, A.; Zacharakis, G. Imaging parhyale hawaiensis embryogenesis with frequency domain photoacoustic microscopy: A novel tool in developmental biology. J. Biophotonics 2022, 15, e202200202. [Google Scholar] [CrossRef]
- Tserevelakis, G.J.; Mavrakis, K.G.; Kakakios, N.; Zacharakis, G. Full image reconstruction in frequency-domain photoacoustic microscopy by means of a low-cost I/Q demodulator. Opt. Lett. 2021, 46, 4718–4721. [Google Scholar] [CrossRef]
- Kontarakis, Z.; Pavlopoulos, A. Transgenesis in non-model organisms: The case of Parhyale. Methods Mol. Biol. 2014, 1196, 145–181. [Google Scholar]
- Browne, W.E.; Price, A.L.; Gerberding, M.; Patel, N.H. Stages of embryonic development in the amphipod crustacean, parhyale hawaiensis. Genesis 2005, 42, 124–149. [Google Scholar] [CrossRef]
- Tserevelakis, G.J.; Soliman, D.; Omar, M.; Ntziachristos, V. Hybrid multiphoton and optoacoustic microscope. Opt. Lett. 2014, 39, 1819–1822. [Google Scholar] [CrossRef]
- Yao, J.; Wang, L.V. Sensitivity of photoacoustic microscopy. Photoacoustics 2014, 2, 87–101. [Google Scholar] [CrossRef] [Green Version]
- Yao, J.; Wang, L.V. Photoacoustic microscopy. Laser Photonics Rev. 2013, 7, 758–778. [Google Scholar] [CrossRef] [Green Version]
- Jeon, S.; Kim, J.; Lee, D.; Baik, J.W.; Kim, C. Review on practical photoacoustic microscopy. Photoacoustics 2019, 15, 100141. [Google Scholar]
- Suzuki, M.; Kikushima, H.; Kashihara, W.; Suzuki, T. Photoacoustic imaging to examine documents altered by black pens on paper in forensic science. Opt. Eng. 2020, 59, 034106. [Google Scholar] [CrossRef]
- Tserevelakis, G.J.; Siozos, P.; Papanikolaou, A.; Melessanaki, K.; Zacharakis, G. Non-invasive photoacoustic detection of hidden underdrawings in paintings using air-coupled transducers. Ultrasonics 2019, 98, 94–98. [Google Scholar] [CrossRef]
- Tserevelakis, G.J.; Tsagkaraki, M.; Siozos, P.; Zacharakis, G. Uncovering the hidden content of layered documents by means of photoacoustic imaging. Strain 2019, 55, e12289. [Google Scholar] [CrossRef]
- Tserevelakis, G.J.; Pouli, P.; Zacharakis, G. Listening to laser light interactions with objects of art: A novel photoacoustic approach for diagnosis and monitoring of laser cleaning interventions. Herit. Sci. 2020, 8, 98. [Google Scholar] [CrossRef]
- Dadkhah, A.; Jiao, S. Integrating photoacoustic microscopy with other imaging technologies for multimodal imaging. Exp. Biol. Med. 2021, 246, 771–777. [Google Scholar]
- Rao, B.; Soto, F.; Kerschensteiner, D.; Wang, L.V. Integrated photoacoustic, confocal, and two-photon microscope. J. Biomed. Opt. 2014, 19, 036002. [Google Scholar] [CrossRef] [PubMed] [Green Version]
- Wang, Y.; Maslov, K.; Kim, C.; Hu, S.; Wang, L.V. Integrated photoacoustic and fluorescence confocal microscopy. IEEE Trans. Biomed. Eng. 2010, 57, 2576–2578. [Google Scholar] [CrossRef] [PubMed] [Green Version]
- Park, J.; Park, B.; Kim, T.Y.; Jung, S.; Choi, W.J.; Ahn, J.; Yoon, D.H.; Kim, J.; Jeon, S.; Lee, D.; et al. Quadruple ultrasound, photoacoustic, optical coherence, and fluorescence fusion imaging with a transparent ultrasound transducer. Proc. Natl. Acad. Sci. USA 2021, 118, e1920879118. [Google Scholar] [CrossRef]
- Dadkhah, A.; Zhou, J.; Yeasmin, N.; Jiao, S. Integrated multimodal photoacoustic microscopy with OCT-guided dynamic focusing. Biomed Opt. Express 2019, 10, 137–150. [Google Scholar] [PubMed]
- Zhang, W.; Li, Y.; Yu, Y.; Derouin, K.; Qinm, Y.; Nguyenm, V.P.; Xia, X.; Wang, X.; Paulus, Y.M. Simultaneous photoacoustic microscopy, spectral-domain optical coherence tomography, and fluorescein microscopy multi-modality retinal imaging. Photoacoustics 2020, 20, 100194. [Google Scholar]
- Tserevelakis, G.J.; Avtzi, S.; Tsilimbaris, M.K.; Zacharakis, G. Delineating the anatomy of the ciliary body using hybrid optical and photoacoustic imaging. J. Biomed. Opt. 2017, 22, 060501. [Google Scholar] [CrossRef] [Green Version]
- Tserevelakis, G.J.; Mavrakis, K.G.; Pantazopoulou, D.; Lagoudaki, E.; Detorakis, E.; Zacharakis, G. Hybrid autofluorescence and photoacoustic label-free microscopy for the investigation and identification of malignancies in ocular biopsies. Opt. Lett. 2020, 45, 5748–5751. [Google Scholar]
- Hosseinaee, Z.; Tummon Simmons, J.A.; Reza, P.H. Dual-modal photoacoustic imaging and optical coherence tomography. Front. Phys. 2020, 8, 616618. [Google Scholar]
- Soliman, D.; Tserevelakis, G.J.; Omar, M.; Ntziachristos, V. Combining microscopy with mesoscopy using optical and optoacoustic label-free modes. Sci. Rep. 2015, 5, 12902. [Google Scholar] [CrossRef] [PubMed] [Green Version]
- Tserevelakis, G.J.; Pavlidis, M.; Samaras, A.; Barmparis, G.D.; Mavrakis, K.G.; Draganidis, I.; Oikonomou, A.; Fanouraki, E.; Tsironis, G.P.; Zacharakis, G. Hybrid confocal fluorescence and photoacoustic microscopy for the label-free investigation of melanin accumulation in fish scales. Sci. Rep. 2022, 12, 7173. [Google Scholar] [CrossRef] [PubMed]
- Tserevelakis, G.J.; Tsagkaraki, M.; Zacharakis, G. Hybrid photoacoustic and optical imaging of pigments in vegetative tissues. J. Microsc. 2016, 263, 300–306. [Google Scholar] [CrossRef]
- Langer, G.; Buchegger, B.; Jacak, J.; Klar, T.A.; Berer, T. Frequency domain photoacoustic and fluorescence microscopy. Biomed. Opt. Expr. 2016, 7, 2692–2702. [Google Scholar] [CrossRef]
- Tserevelakis, G.J.; Zacharakis, G. High precision photoacoustic interferometer for the determination of the speed of sound in liquid media. Opt. Expr. 2022, 30, 28559–28568. [Google Scholar] [CrossRef]
- Kellnberger, S.; Soliman, D.; Tserevelakis, G.J.; Seeger, M.; Yang, H.; Karlas, A.; Prade, L.; Omar, M.; Ntziachristos, V. Optoacoustic microscopy at multiple discrete frequencies. Light Sci. Appl. 2018, 7, 109. [Google Scholar] [CrossRef] [Green Version]
- Hui, J.; Li, R.; Phillips, E.H.; Goergen, C.J.; Sturek, M.; Cheng, J.-X. Bond-selective photoacoustic imaging by converting molecular vibration into acoustic waves. Photoacoustics 2016, 4, 11–21. [Google Scholar] [CrossRef] [Green Version]
- Shankar, H.; Pagel, P.S.; Warner, D.S. Potential adverse ultrasound-related biological effects: A critical review. Anesthesiology 2011, 115, 1109–1124. [Google Scholar] [CrossRef] [Green Version]
- Yao, D.-K.; Maslov, K.; Shung, K.K.; Zhou, Q.; Wang, L.V. In vivo label-free photoacoustic microscopy of cell nuclei by excitation of DNA and RNA. Opt. Lett. 2010, 35, 4139–4141. [Google Scholar] [CrossRef] [Green Version]
- Dasa, M.K.; Nteroli, G.; Bowen, P.; Messa, G.; Feng, Y.; Petersen, C.R.; Koutsikou, S.; Bondu, M.; Moselund, P.M.; Podoleanu, A.; et al. All-fibre supercontinuum laser for in vivo multispectral photoacoustic microscopy of lipids in the extended near-infrared region. Photoacoustics 2020, 18, 100163. [Google Scholar] [CrossRef]
- Buma, T.; Conley, N.C.; Choi, S.W. Multispectral photoacoustic microscopy of lipids using a pulsed supercontinuum laser. Biomed. Opt. Expr. 2018, 9, 276–288. [Google Scholar] [CrossRef] [PubMed] [Green Version]


Disclaimer/Publisher’s Note: The statements, opinions and data contained in all publications are solely those of the individual author(s) and contributor(s) and not of MDPI and/or the editor(s). MDPI and/or the editor(s) disclaim responsibility for any injury to people or property resulting from any ideas, methods, instructions or products referred to in the content. |
© 2023 by the authors. Licensee MDPI, Basel, Switzerland. This article is an open access article distributed under the terms and conditions of the Creative Commons Attribution (CC BY) license (https://creativecommons.org/licenses/by/4.0/).
Share and Cite
Tserevelakis, G.J.; Tekonaki, E.; Kalogeridi, M.; Liaskas, I.; Pavlopoulos, A.; Zacharakis, G. Hybrid Fluorescence and Frequency-Domain Photoacoustic Microscopy for Imaging Development of Parhyale hawaiensis Embryos. Photonics 2023, 10, 264. https://doi.org/10.3390/photonics10030264
Tserevelakis GJ, Tekonaki E, Kalogeridi M, Liaskas I, Pavlopoulos A, Zacharakis G. Hybrid Fluorescence and Frequency-Domain Photoacoustic Microscopy for Imaging Development of Parhyale hawaiensis Embryos. Photonics. 2023; 10(3):264. https://doi.org/10.3390/photonics10030264
Chicago/Turabian StyleTserevelakis, George J., Emmanouela Tekonaki, Maria Kalogeridi, Ioannis Liaskas, Anastasios Pavlopoulos, and Giannis Zacharakis. 2023. "Hybrid Fluorescence and Frequency-Domain Photoacoustic Microscopy for Imaging Development of Parhyale hawaiensis Embryos" Photonics 10, no. 3: 264. https://doi.org/10.3390/photonics10030264