Optical Biomedical Diagnostics Using Lab-on-Fiber Technology: A Review


1
Physics Department, Indian Institute of Technology Delhi, New Delhi 110016, India
2
Institute of Physical Chemistry, University of Potsdam, 14476 Potsdam, Germany
3
Department of Electro-Optic Engineering, Ilse Katz Institute for Nanoscale Science and Technology, Ben Gurion University, Beer Sheva 84105, Israel
*
Author to whom correspondence should be addressed.
Photonics 2022, 9(2), 86; https://doi.org/10.3390/photonics9020086
Submission received: 8 January 2022
/
Revised: 28 January 2022
/
Accepted: 29 January 2022
/
Published: 2 February 2022
(This article belongs to the Special Issue Biomedical and Biological Optical Device)
Abstract
:Point-of-care and in-vivo bio-diagnostic tools are the current need for the present critical scenarios in the healthcare industry. The past few decades have seen a surge in research activities related to solving the challenges associated with precise on-site bio-sensing. Cutting-edge fiber optic technology enables the interaction of light with functionalized fiber surfaces at remote locations to develop a novel, miniaturized and cost-effective lab on fiber technology for bio-sensing applications. The recent remarkable developments in the field of nanotechnology provide innumerable functionalization methodologies to develop selective bio-recognition elements for label free biosensors. These exceptional methods may be easily integrated with fiber surfaces to provide highly selective light-matter interaction depending on various transduction mechanisms. In the present review, an overview of optical fiber-based biosensors has been provided with focus on physical principles used, along with the functionalization protocols for the detection of various biological analytes to diagnose the disease. The design and performance of these biosensors in terms of operating range, selectivity, response time and limit of detection have been discussed. In the concluding remarks, the challenges associated with these biosensors and the improvement required to develop handheld devices to enable direct target detection have been highlighted.
1. Introduction
Recently, there has been a surge in the demand for influential analytical tools in sectors such as environment, food security, defense, and healthcare. High capability plug-and-play biosensors are the need of the hour in the medical sector for dynamic disease diagnosis and development of innovative treatment drugs. Optical biosensing systems have proven to be the most effective methods combining the efficacious photonic components and selective functional nanomaterials [1,2]. The combination of microfluidics with such photonic sensors has resulted in dynamic lab-on-chip (LOC) platforms. Although these platforms provide well-established biosensing tools for point-of care diagnosis, they suffer from certain limitations such as their integration in optical systems, which require expensive couplers and are difficult to incorporate in small, easy-to-use devices [3,4,5]. These difficulties limit their use for in-vivo diagnosis systems and require a state-of-the-art platform which integrates the properties of LOC devices and performs measurements at precise hard to reach locations. This vision has judiciously attracted the attention of the scientific community toward the interesting features of optical fibers. Optical fibers are a special kind of miniaturized waveguide used to study light-matter interaction in many interesting ways at microscopic levels. They have numerous extra-ordinary features such as compact shape and size, high aspect ratio, robustness, inert behavior, immunity to electromagnetic atmosphere and ability to transfer light to any possible distance with negligible loss. Their biocompatibility makes them ideal candidates to couple with other medical instruments like catheters and needles. Thus, optical fibers are emerging as an effective microscopic platform for light coupled interactions with continuous advances in synthesis of nanostructured materials in the sensing world and have given rise to a new field termed Lab-on Fiber (LOF) technology [6,7,8,9]. LOF technology has proven to be a promising tool for addressing the limitations of conventional analytical systems like the time lapse between the detection and availability of final results due to long steps involved in sample preparation, labelling and measurement. These properties facilitate many opportunities to build LOF biosensor systems encompassing in-vivo point-of-care diagnostics abilities. The field of LOF sensor systems has seen a thriving research and industrial interest with continuous innovations in nano-functionalization methods and new detection mechanisms. For specific healthcare applications, LOF technology essentially envisages the integration of various functional nanomaterials on fiber surfaces, which expedite the specific light matter interaction to realize miniaturized devices in single optical fibers [10,11,12]. These multifunctional optical fibers, in a true sense, provide auto diagnostic attributes which exchange data, in addition to providing sensorial information.
The main challenge in the realization of these multifunctional fiber sensors is the adaptation of micro and nanostructures on fibers with the standard nanofabrication strategies due to their small shape and size. Therefore, even after the realization of immense potential of LOF technology, the paradigm of LOC devices is still hard to shift on optical fibers as most of the microelectronic industries have been designed for the fabrication on planar surfaces. In recent years, ubiquitous developments in nanotechnology have resulted in the publication of reports on numerous micro and nanofabrication methods on optical fibers [13,14,15], and some of these are reviewed here to give readers a complete overview of LOF technology. Further, depending on the mechanism of light matter interaction investigated for a specific medical application, LOF technology may result in various kinds of sensors like surface plasmon resonance (SPR), surface enhanced Raman scattering (SERS), fluorescence, lossy mode resonance (LMR), interferometric based optical fiber sensors and so on. The present review covers the three major aspects of LOF technology; the first one is the synthesis processes involved in the integration of functional nanomaterials on optical fibers; the second concerns the physical principles underlying the various light matter interaction processes involved in optical fiber sensors; and the third is the selective capture elements involved in the specific interactions in optical fiber sensors.
2. Nanopatterning Techniques for Optical Fibers
Optical fiber patterning has a history dating back to the 90s when abrasive or self-assembly technique was used to study SERS applications from an optical fiber [16]. Various micro-structures have been directly printed on the tip of optical fibers by 3D µ-printing. A CO2 gas and temperature sensor has been reported by directly printing Fabry–Perot interferometric cavity (FPI) on a multicore fiber end face using a selective poly(ionic liquid), poly(1-allyl-3-vinylimidazolium bromide) (PAVB) for CO2 adsorption and SU-8 epoxy for temperature sensing [17]. A single mode fiber has been used for the purpose of refractive index and pressure sensing using SU-8 epoxy suspended-microbeams for measuring the reflection spectra of the micro-interferometer [18]. Similarly, a compact acoustic wave sensor has been reported using in-situ 3D µ-printing technology forming a FPI cavity on an optical fiber tip. These sensors may find a wide range of applications from photo-acoustic imaging, endoscopy and sensing [19]. Further, these methods are very efficient for realizing the microstructures on optical fiber tips; however, the need of high resolution nanopatterning has aroused with the development of several optical techniques like plasmonics, surface enhanced spectroscopy and fluorescence spectroscopy to realize highly sensitive biosensors on optical fibers.
Thus, standard nanofabrication methodologies have been designed and investigated to fabricate improved functionalities on optical fiber probes due to the continuous advancement in nanotechnology. These synthesis techniques are broadly classified as bottom-up, top-down and nano-transfer methodologies. The bottom-up approach relies on the synthesis of a desired configuration by self-assembly of nanoscopic material i.e., atoms and molecules. The device production cost is low for mass production applications with the trade off in precise control of shape of nanostructure. Many bottom-up approaches like self-assembled monolayers and bio-assisted synthesis [20,21,22], chemical vapor deposition (CVD) [23], physical vapor deposition (PVD) [24,25], self-guided photo-polymerization [26] and direct 3D laser printing [27,28] have been reported for the fabrication of nanomaterials on optical fibers. In contrast, the top-down approach involves the scaling down of a bulk material into its component nanomaterials or nanostructures with a defined morphology. The technique generally involves high-cost instruments but provides a well-defined morphological characteristics of fabricated nanomaterials. The most common top-down technologies reported for fibers are e-beam lithography (EBL) [11,29], focused ion beam milling (FIB) [30,31], nano-imprint lithography [32,33], interference lithography [34] and photolithography [35]. In addition to the above two approaches which involve direct fabrication on fiber surface, there are many indirect transfer methods reported for optical fibers. In these techniques nanostructure is created on a planar substrate with standard nanofabrication method and is carefully transferred to the optical fiber surface [36,37,38,39]. We discuss some of the important methods below.
2.1. Focused Ion Beam (FIB) Milling
In this method, typically, a focused ion beam is used to draw out molecules from a bulk sample in a controlled manner and a direct patterning of a variety of substrates ranging from metal to glass optical fiber is allowed [14]. This creates defined nanostructure on fiber surface to realize various interaction mechanisms like plasmonic resonance. An array of nanoholes or nanopillars was created on a gold (Au) coated tapered and cleaved optical fiber by FIB to create a refractive index (RI) sensor [31]. This array was also tested for SERS study using the optical fiber tip as substrate [40]. In another study, fiber glass was directly patterned by FIB and a high RI overlayer was deposited to support the guided resonances by Micco et al. [41]. Several other studies reported for the microcantilever sensor [42], optical fiber-based tweezer [43], fiber microlens [44] etc. [45] have used FIB milling. Additionally, in terms of advanced LOF technology, Principe et al. reported a novel integration of phase-gradient plasmonic metasurfaces over the optical fiber tip, named as optical fiber meta-tip, using FIB technology [46]. Theoretical and experimental validations for different prototype structures using the generalized Snell’s reflection/transmission laws were performed and demonstrated meta-surface enabled light manipulation which was the first step toward the integration of metasurface-enabled light-manipulation in LOF framework with providing a new path for sensing applications. FIB has inherited the advantage of mask-less patterning but has certain limitations like time consuming for a very small defined area and creation of patterned structures having angled sidewalls which need to be carefully considered during design steps.
2.2. Lithography
Lithographic techniques have progressed with the developments in nanotechnology ranging from conventional photolithography to using radiation sources like ion beams, focused lasers and e-beams to create patterned surfaces with precise morphology. The most challenging task in such methods remains to coat the uniform resist layer on small fiber surfaces. The most common method to coat resist layer in lithographic methods is spin coating which is very difficult to realize for high aspect ratio optical fibers due to difficulty in their holding process [8,13]. Thus, certain groups have proposed specific holder designs for spin coating of resist layers on optical fibers [11]. A triangular groove holder in brass was reported where the fiber was glued, and a large flat surface was obtained by polishing for spin coating [29]. Several techniques like e-beam lithography (EBL), photolithography (PL), nanoimprint lithography (NIL) and interference lithography have been proposed to fabricate interesting nano features on resist coated optical fibers. NIL is the most cost effective and high yield technique and utilizes the modification in mechanical properties of the material. In a study, a nanoimprint or a predesigned pattern was directly transferred on the softened fiber tip by heating [8,13]. Due to thermal distortions suffered by the fiber surface during molding and the challenging fiber alignment with smaller patterned molds, this technique has limited applications. Hence, NIL is first applied to a pre-deposited polymer on the fiber and then periodic pattern with nm resolution is imprinted on it. Kostovsky et al. [47] demonstrated a NIL based method using cicada wings consisting of a two-dimensional array of pillars to fabricate bio-nanostructures on optical fiber through special parallel nanoimprint arrangement and later deposited silver (Ag) for SERS applications. The complete process is shown in Figure 1a,b. The fidelity of the nanostructures grown is shown in Figure 1d–g. Due to the accuracy included in NIL, patterns with subwavelength dimensions may be incurred easily on optical fibers and it is considered a powerful technique for functional optical fiber surfaces. In the same way, EBL is also a versatile technique to deposit nanostructures on optical fibers. Here, an electron beam is scanned on a pre-deposited e-beam resist in a predefined manner to produce nanostructures with sub-10 nm resolution, and the final step includes the separation or etching out of different materials.
The patterned e-beam resist may act as active part of fabricated structure or may be used as a sacrificial layer which is lifted off later [14]. A reflection based LSPR sensor was reported by Lin et al. utilizing the gold nanodots arrays on optical fiber by EBL [48]. Similarly versatile nanoprobes having two-dimensional hybrid metallo(Au)-dielectric nanostructures were investigated and shown for plasmonic sensing and polarization sensitive devices [10,11,49]. The key steps involved in EBL based patterning and Au deposition are spin coating the e-beam resistance (ZEP 520A (Zeon Chemicals, refractive index n ≈ 1.54)) with the specially designed chuck; this is shown in Figure 2, along with the SEM images of the fiber cross-section showing the extremely ordered nanostructure arrays [10]. Typically, 100 × 100 µm area can be patterned by EBL, which is suitable for typical optical fiber dimensions. However, like every technique, it has some inherited drawbacks like a time-consuming process and limit to mass production capabilities.
Another interesting lithography technique is photolithography where instead of electron beams, patterned light is used to create micro and nanostructures on a substrate using a photoresist [13,14]. Although many groups have attempted to make patterned surfaces on optical fibers using this technique, the proper alignment of vertical optical fiber with mask limits the use of this method on optical fibers [50,51]. Another lithographic technique is interference lithography (IL), where interference of coherent light beams is recorded on a photoresist to form 1D, 2D and 3D ordered arrays [14]. Yang et al. [52] used interference lithography technique to form nanopillars of photoresist on optical fiber and subsequently etching the fiber. A thin film of silver was then coated by e-beam deposition to realize effective SERS substrate shown in Figure 3 for the sensing of toluene. This technique is, however, limited by diffraction limit.
2.3. Self-Assembled Nanostructures
Self-assembly is a very easy, cost-effective, and mass production technology to create micro- and nanostructures. The method is governed by the self-assembly of nanostructure in solution phase on a substrate through non-covalent interaction. On optical fiber silica surface, the presence of abundant hydroxyl groups is used to attract silane coupling agents like (3-aminopropyl) triethoxysilane (APTES) or carboxyethyl silanetriol sodium (CEOS) [53]. These agents then attract positively or negatively charge nanostructure from the solution due to electrostatic forces to assemble on fiber surface. Numerous reports demonstrated the deposition of Au and Ag nanoparticles on optical fiber for SPR and LSPR based sensing through self-assembly technique [54,55,56]. These nanostructures, however, are randomly distributed and a precise control over morphological arrangement is difficult to realize by self-assembly process. Therefore, techniques like nanosphere lithography, which include template assisted self-assembly, are proposed for the ordered self-assembled nanostructures on optical fiber. A similar arrangement was reported by Pisco et al. [57] by utilizing the unique breath figure method. Here, a polymeric honeycomb was first deposited on fiber surface. With the evaporation of polymer solution, water droplets are auto-organized in a hexagonal close packed structure at polymer/air interface. After the evaporation of water and solvent, a hexagonal imprint was created on polymer which acted as a template for subsequent metal film deposition. The schematic of the steps involved in the fabrication process are shown in Figure 4 [57].
2.4. Nano-Transfer Methods
Another interesting fabrication methodology for patterning optical fiber is nano-transferring. The technique is based on transferring the nanostructure from planar substrate to optical fiber. The transferring phase of this technique decides the final performance and yield of fabricated device.
The transferring process may be realized in two ways: for the first case, the nanostructure on planar substrate is stripped and then transferred on optical fiber through dipping in a liquid or direct micro positioning, whereas for the second case, the fiber tip having an epoxy layer is kept in contact with the main patterned substrate and then released [58,59]. Many reports have exploited this technique to coat optical fibers with interesting nanomaterials for various applications. For example, a periodic Au hole array was transferred to optical fiber from a glass slide. Here, the lifting of nanohole array was done by NaOH reaction and the subsequent attachment on optical fiber was realized by dipping the functionalized fiber in water as shown in Figure 5 [36].
Several other bottom-up technologies like CVD, PVD and two photon polymerizations are also reported for multifunctional fiber probes. The description of these technologies can be found in extensive reviews focused on nanofabrication technologies for optical fibers [10,11,12,13,14,15].
The next important aspect of LOF technology is the interaction mechanism reported for LOF technology. There are many optical mechanisms which can be easily realized on optical fibers to design innovative biosensors for onsite sensing and continuous monitoring. In the next section, we discuss the physical principles underlying the several mechanisms associated with optical fiber sensors and direct the readers towards the extensive work carried out in each domain over the globe.
3. Light Matter Interaction Mechanisms for LOF Technology
3.1. Interference Based Optical Fiber Sensors
Interferometric biosensors work on the principle of detecting the change in refractive index of a sample due to the bio-specific interaction between the conjugate layers. Two equivalent light paths are compared: one of them acts as a reference and the other identifies the interaction causing the refractive index change and hence the change in optical path length. In a fiber optic interferometer (FOI) the interference of two light beams travelling different optical paths in a fiber or different fibers are investigated. One of these paths is kept such that it is easily perturbed by the external parameters like temperature, pressure, strain and refractive index so that these parameters can be quantified [60,61]. In FOI, the bulk optical components are replaced by the fiber to miniaturize the device to the fiber scales. The in-line FOIs are the best candidates for providing reasonable coupling efficiency, alignment and stability. In FOI, four different types of interferometers, Michelson interferometer (MI), Mach-Zehnder interferometer (MZI), Fabry-Perot interferometer (FPI) and Sagnac interferometer, are considered. FPI works on the principle of multiple beam interference inside a cavity known as etalon formed by two parallel reflecting mirrors. The cavity may be formed inside the optical fiber or at its end, and hence FPI is divided as extrinsic and intrinsic FPI as shown in Figure 6a,b, respectively [60]. This is the most common interferometric design for optical fiber due to its simplicity, cost effectiveness and high sensitivity. A FPI based fiber optic sensor has been reported to detect bovine serum antigen (BSA) [62] and liposome [63] with high accuracy and sensitivity. Similarly, many fiber optic biosensors have been reported based on FPI [64,65,66].
The other FOIs are two-beam interferometers, where a light beam is split into two beams by a fiber splitter and then recombined to study the interference of these two beams. MI and MZI have essentially the same designs. The only difference is that the light split by the fiber splitter is combined by a fiber coupler in MZI whereas the two beams are reflected by a mirror and combined by the same fiber splitter in MI. A fiber optic MZI is shown in Figure 7 [60]. Here, a beam is split into two arms, one called the reference and the other sensing arms. These are recombined by using two fiber couplers to observe interference. An MZI can also be designed by tapering the single mode fiber (SMF) [67]. The tapering of the fiber causes the modulation of fundamental mode of the light for excitation of higher order modes as the fiber core diameter decreases. The evanescent field associated with the cladding mode becomes highly influenced by the medium surrounding the taper and causes a phase shift. A biosensor has been developed based on MZI through the tapered fiber by the coatings of specific layer over the tapered region of SMF [68]. Additionally, the splicing of several specially designed optical fibers with SMF, also produces MZI like SMF-multimode fiber (MMF)-SMF [69], SMF-photonic crystal fiber (PCF)-SMF [70], and SMF-hollow core fiber (HCF)-SMF structure [71]. The biosensing using these structures can be achieved by immobilizing target-specific sensing medium over the special optical fiber region.
Another transmission type FOI has been reported by merging two SMFs and one MMF [72]. Here, the MMF was used as a cavity for interference process. The shift in interference wavelength was observed with changing the concentration of anti-IgG analyte to obtain a quite low limit of detection (LOD) of 200 ng/mL. In spite of MMF, a noncore fiber may also be used to create an interferometric structure, as reported for the sensing of specific proteins using nickel ions [73]. A record low LOD of 0.125 ng/mL was found for a probe designed with high affinity towards specific proteins. In Sagnac interferometer, a fiber loop is utilized for the propagation of two beams split by a 3 dB fiber coupler in opposite directions depending on their polarization states and recombine at the same coupler. The interference depends on the optical path difference of the beams propagating along slow and fast axis depending on the polarization states. Figure 8 shows a fiber loop based Sagnac interferometer [60,74].
The other type of FOI sensors is based on optical fiber gratings which use the periodic pattern in the fiber core to realize phase matching conditions by coupling the core and cladding modes. The most famous type of optical fiber gratings are long period fiber gratings (LPFGs) and fiber Bragg gratings (FBGs) [12,75,76]. The 2-D schematics of possible LPFG and FBG configurations and their transmission spectra in response to change in the outside refractive index are shown in Figure 9. A very sensitive biosensor has been reported by coating a layer of graphene oxide (GO) on an LPFG. The selective capture mechanism of streptavidin (SA) and biotin was utilized for the sensing of bovine serum albumin (BSA) with the LOD as low as 0.2 aM [77].
A label-free detection of vitamin D3 based on optical fiber supported LPG has been reported by Esposito et al. [78]. Dual cladding fiber (DCF) with W-shape RI profile was used for LPG inscription, which enhanced the sensitivity and visibility to improve the LPG dip (around 10 dB) along with higher mechanical stability in comparison to conventional fiber. Vitamin D3 specific antibodies were immobilized over graphene oxide (GO) coated LPG platform as recognition ligand. The sensor was able to detect the clinically relevant range of 1–1000 ng/mL with minimum detection limit of 1 ng/mL. Similar DCF based LPG was utilized for C-reactive protein (CRP) in serum [79]. This study has also used anti-CRP antibodies as sensing layer, immobilized over GO coated LPG based fiber substrate. The sensing demonstrated large range of CRP from 1 ng/mL to 100 µg/mL along with LOD value of 0.15 ng/mL.
In the same way, a microstructured optical fiber (MOF) was used to inscribe Bragg grating for the sensitive detection of DNA with a minimal sample requirement. These fibers integrate simultaneously the microfluidic platforms and optical readout capabilities in nanolitres sample volume. A peptide nucleic acid and gold nanoparticles (AuNPs) enhanced detection scheme based on MOFs based Bragg grating is shown in Figure 10 [80].
Recently, an FBG based biosensor for the early diagnosis of prostate cancer screening has been reported by Iele et al. [81]. The miniaturized sensor probe was fabricated by integrating a customized FBG within metallic cannula and moved to various places of the prostate using an automated arm. The setup used as a force sensor applied to find the mechanical strength of prostate up to sub millimeter resolution, leading to identification of cancer tissue. A similar needle type of structure with inside a customized FBG system was employed to place the needle within the epidural space for loco-regional anesthesia [82]. The FBG fixed within the needle worked to monitor stress during the needle insertion, which enhances the procedure effectiveness. The biocompatibility and versatility of the proposed configuration opened a new path of such type of FBG based sensors for force/stress/strain measurements employing into biomedical applications.
3.2. Fluorescence Based Optical Fiber Sensors
A fluorescence sensor is a device which measures the response of an analyte specific fluorophore molecule through an appropriate light detection scheme. The fluorophore may show two types of responses: it can undergo fluorescence quenching upon binding of analyte, or it can reversibly bind the analyte molecule through charge transfer, energy transfer or formation of excimer.
A molecularly imprinted fluorescent hydrogel on an optical fiber probe for the sensing of antibiotics in environmental water has been reported [83]. Molecularly imprinted nanoparticles and polyethyleneglycol diacrylate (PEGDA) composite were used to synthesize an optical fiber detector, which was connected to a Y-shape optical fiber arrangement to record fluorescence, as shown in Figure 11 [83].
Figure 12a shows the fluorescence intensity spectra recorded for different concentrations of ciprofloxacin (10–500 µM). A linear relationship between the fluorescence intensity and concentration was observed for the probe as shown in Figure 12b. The sensor possesses LOD of 6.86 µM.
Another fluorescent optical fiber probe has been reported as pH sensor for determining the acidity in lung tumor tissue [84]. The probe shows a very rapid response to pH changes (t < 30 s) with linear behavior in physiological pH range (5.5 to 8.0) by utilizing a hydrogel embedded with porphyrin and 5(6)-carboxyfluorescein (5(6)-FAM) as fluorescence reporters. The detection scheme and the observed fluorescence spectra are summarized in Figure 13. Thus, optical fiber-based fluorescence sensors have immense potential for quick and in-vivo bio-diagnosis for a wide range of analytes.
3.3. SERS Based Optical Fiber Sensors
Raman spectroscopy is most widely used for material characterization, especially for structural and vibrational analysis. As Raman scattering is an inelastic scattering phenomenon with a very weak signal, it is difficult to use in the case of very low analyte concentration or a very poor Raman scatter analyte molecule. Therefore, its application was limited in the early days. After the discovery of surface enhanced Raman scattering (SERS) in 1974 by Fleischmann et al. [85] and a proper explanation by Jeanmaire and Van Duyne [86], Raman spectroscopy found its wide-ranging applications in various fields. In SERS, plasmonic nanoparticles or metal roughened surfaces are exploited to greatly enhance the conventional Raman signal of a target molecule even in its trace amount. The enhancement has been reported up to 1010-fold and researchers have reached single molecule detection limit through this tool. In amplification of Raman signal, the major role is played by plasmonic nanomaterials as SERS active substrates. After an extensive experimental as well as theoretical modeling to understand the amplification phenomenon, it has been concluded that the overall enhancement factor is a combination of an electromagnetic enhancement associated with plasmon excitation in metal nanoparticles and a chemical enhancement due to the target molecules absorbed onto the surface, being able to transfer electrons to/from the metal particles in both ground and excited states, sometimes in the process of forming the metal-molecule bond. In the present article, we shall keep our focus on the fiber optic-based SERS biosensors. Initially, optical fibers were frequently used to carry the beam (excitation or collection) in Raman spectroscopy. In 1990, Bello et al. [87] demonstrated the use of optical fibers for SERS based in-situ detection of an analyte in solution. However, in view of LOF technology, we shall only discuss here the studies where the fiber itself has been deployed as a SERS substrate along with the light propagation. In other words, plasmonic nanostructures are fabricated or deposited on the fiber as a SERS substrate and the scattered light is collected. The design of optical fiber SERS sensors are classified in two categories discussed below.
3.3.1. Forward/Transmission Scattering Mode
In a study utilizing forward scattering mode, a fast femtosecond laser scanning process was used to etch uniform pattern on the tip of a fused silica fiber, which was then coated with a thin film of Ag by thermal evaporation technique [88]. Rhodamine 6G up to 10-7 M concentration in DI water was used as an analyte molecule for SERS. In another study, silver nanorods array was fabricated on the tip of one fiber carrying the laser beam using glancing angle deposition technique [89]. The AgNRs array was optimized to achieve the maximum light transmission in the forward scattering configuration. The SERS spectra of trans-bis(4-pyridyl)-ethane (BPE) in methanol and adenine-1/2H2SO4 in tris-hydrochloride were recorded by the spectrometer through another piece of optical fiber as shown in Figure 14.
3.3.2. Reflection/Back Scattering Mode
In the back scattered mode, the SERS active nanostructures are fabricated on the tip of a fiber which carries the laser excitation light and collects the back scattered light [90,91]. Basically, this mode of detection has more applicability in remote sensing or in-vivo diagnostics. Laser induced silver nanoparticles were deposited on the fiber tip to demonstrate the detection of intracellular and extracellular pH in living cells [92]. Quero et al. [93] used nanosphere lithography for SERS based optical fiber optrode. A monolayer of polystyrene nanospheres was deposited, followed by a thin film of gold on the silica core fiber tip to detect biphenyl-4-thiol (BPT). The schematic of the experimental sensing scheme is shown in Figure 15 [93]. In another study, a template guided self-assembly of gold nanoparticles on optical fiber was investigated as efficient SERS substrate to provide a high enhancement factor of about 107 [94].
Recently, Gu et al. [95] proposed a seed mediated growth of AuNPs monolayer on a fiber facet for ultrasensitive in-situ SERS detection of methylene blue (MB), CV and R6G up to 10-9 M with the experimental set up shown in Figure 16 [95].
These optrodes geometry can render a reliable and promising in-situ SERS detection platform that can efficiently cater to the ever-increasing need for sensitive and remote monitoring of various biological and chemical analytes. However, repeatability, excitation/collection efficiency and fluorescence noise are some of the concerns to be taken care of in this type of sensing platform.
3.4. SPR Based Fiber Optic Biosensors
Among various sensing methodologies applied on optical fibers, plasmonics has gained remarkable attention in the past few decades due to its incredible advantages like real time kinetic measurement of surface interactions with high sensitivity and specificity with suitably engineered recognition layer [96,97,98,99,100]. The field of plasmonics underlies the famous phenomenon of charge density oscillations in a conductor which may be regarded as bulk plasmons, surface plasmons or localized surface plasmons depending on the conductor geometry as shown in Figure 17a–c. For sensing applications plasmonics sensors are divided into two categories: surface plasmon resonance (SPR) and localized surface plasmon resonance (LSPR) based sensors depending on the thin film or nanoparticles used for plasmons excitation. SPR deals with the excitation of coupled modes of incident light and coherent charge density oscillations at a metal-dielectric interface (surface plasmons) or on a metal nanoparticle surface (localized surface plasmons). This interaction modulates the properties of incident light depending on a particular resonance condition which is highly susceptible to the surface interaction near the metal and forms the basis of SPR and LSPR based sensors. The SPR based sensors were initially reported on a prism-based configuration famously known as Krestchmann configuration, shown in Figure 17d. Here, a metal film is deposited at the base of a prism to realize SP modes on metal-dielectric interface, which are very sensitive to modulation in the refractive index of the dielectric layer. Later, due to the interesting properties of optical fibers, the same configuration was proposed for optical fibers due to the inherited limitations of conventional prism-based configuration like mechanical movement of source to change the angle of incidence and difficulty for the applications requiring on-site detection. The basic geometry of fiber configuration for SPR based sensor is shown in Figure 17e.
Due to the versatility of fiber optic (FO) SPR sensors, numerous research articles, reviews and books have been focused to summarize the vast field in the last decade [96,97,98,99,100]. Recently, an FOSPR sensor has been reported for the detection of dengue virus by carefully designing the antibody and self-assembled monolayer based selective recognition layer [101]. NS1 protein is targeted as a biomarker for dengue virus and its quantification is reported in terms of shift in resonance wavelength of SPR curves. The main steps involved in the design of fiber optic probe, experimental set-up and the final SPR curves showing the shift in resonance wavelength with change in NS1 antigen concentration are shown in Figure 18a,b, respectively.
The calibration curves and dynamic sensitivities with different antibody concentrations are shown in Figure 19a–d [101]. The sensor reported possesses the LOD value of 0.066 μg/mL, which is suitable for early detection of dengue virus along with its feasibility for the detection of viruses in human serum samples, making it very useful for fast clinical diagnosis. Similarly, many sensors have been reported for the biological and environmental monitoring like ascorbic acid [102], dopamine [103,104], glutamate [105], erythromycin [106], creatinine [107], and ammonia [108,109] and H2S gas [110].
More applications related to each type of sensing mechanism are discussed in the applications section of this article. Since another very important parameter for any sensor is the selective recognition layer which imparts its feasibility for real sample analysis, the next section of this review is devoted to the types of sensing layers or recognition units used in fiber optic sensors. Many types of nanomaterials, bio-elements, biomimetic elements are discussed in the next section with the examples of optical fiber sensors reported in the literature.
4. Recognition Elements for Bio-Sensing
A biosensor is generally comprised of three main components: (i) target molecule, (ii) recognition element and (iii) transducing element. The basic mechanism of a traditional biosensor is that when the target molecule (the molecule to be detected) is identified and captured by the recognition unit via some unique molecular interaction, the binding between the target molecule and the recognition unit results in some changes in its physical/chemical properties such as pH, mass, refractive index (RI), conductivity etc. These changes are then transferred to some readable signal such as current, resistance, absorption, etc. with the help of a certain transducing mechanism based on sensing application. In view of recognition elements, these sensors can be divided into the following categories.
4.1. Immunosensors
Immunosensors are based on the antigen-antibody interactions where one is the target molecule, while the other works as the sensing element. Usually, the antibodies are synthesized naturally within a host human/animal’s immune system in response to inserting the corresponding target molecule in the body [111]. The prepared antibodies can interact against the target antigens with high specificity. Due to their high specificity, immuno-sensing is still one of the widely used methods to develop biosensors. Aptamer based biosensing is also categorized in the immuno-sensing-based method. Single-stranded oligo-nucleic acids (ssDNA or ssRNA), or peptide molecules corresponding to each biomolecule bind with the target guest analytes with high affinity and specificity. The binding kinetics with DNA aptamer and the target analyte depend upon their preferred orientation according to target analyte [112,113].
4.2. Enzymatic Biosensors
Enzymes are basically the analytical reagents or catalysts which play a crucial role in the chemical transformation during a specific interaction with target analyte. There exist several enzymes including glucose oxidase (GOx), urease and horseradish peroxide (HRP) which provide highly specific detection of the target molecule. The immunoassay using the enzymes are usually termed as enzyme-linked immunoassay (ELISA) [114]. The catalytic activity and specificity of enzyme-based sensor can also be enhanced by selecting an optimum method for immobilizing it over the sensor surface. The techniques include absorption, sol-gel, covalent binding and polymeric films [115]. Absorption is one of the easiest methods to immobilize enzymes over the sensing surface, just by dipping the optical fiber surface in the enzyme solution. Although this is a very simple method, in this case, enzymes are placed in very unordered fashion over the sensing surface. Sol–gel method is also an easy immobilization technique, where during the sol-gel formation, the enzyme is entrapped within the sol-gel during its synthesis and then prepared sol-gel is immobilized over the transducing surface [116]. In this method, the enzymatic activity is preserved, resulting in the enhanced sensitivity of the sensor. At present, sol-gel process, along with nanotechnology, has proven itself a promising candidate for biosensing applications [117]. Enzyme immobilization can also be performed over certain sensing surfaces using the covalent bonding by water-insoluble linkers. Amino acids, which do not participate actively in sensing, are used to form covalent linkage for enzymes. This approach has proven itself to increase the lifetime of a biosensor significantly [118].
4.3. Cell Based Biosensors
Cell based biosensors are fabricated using genetically modified living cells for highly specific and sensitive detection of biological analytes with cost-effective and non-invasive applications. In principle, living cells are able to react with respect to the change in the ambient environment through adaptation and survival. This reaction of the cells can be translated to a fluorescent, colorimetric or any other labelling to achieve sensing [119]. Using these sensors, one can easily obtain the collective information of cell attachment/detachment, their morphological changes and eventually cell death [120].
4.4. Molecular Imprinted Polymer (MIP) Based Biosensors
Molecular imprinted polymers (MIPs) basically consist of synthetically prepared active imprints of the target molecule in a polymeric medium. These polymers are basically prepared by mixing an optimum amount of template molecules with the special monomer complex. The solution is then left for polymerization in the presence of a certain cross-linker and initiator. After polymerization, the polymer has template molecules freeze within its vicinity. The polymer is then washed with a subsequent remover to detach the template from the polymeric medium, leading to a highly specific three-dimensional voids within the polymer. These voids are called the imprints and work as the receptors for the template molecule sensing. MIP based sensors are successfully demonstrated to have comparable affinity and selectivity with respect to previously mentioned biological elements for sensing. MIP has stability in harsh environments, reusability, cost-effectiveness etc. [121,122]. Figure 20 shows a schematic of the biosensors based on above-discussed recognition elements.
5. Fiber Optic Biosensors for Various Analytes
In this section we shall discuss some of the notable applications of optical fiber sensors relating to various analytes of high biological interest. The section deals with the LOF sensors for the popular analytes based on various optical transduction mechanisms reported in Section 3. The properties of the sensors are tabulated for better understanding in the case of each analyte.
5.1. Glucose Sensor
Maintaining the normal range of glucose in the human body is an inevitable requirement. The diagnosis of glucose in the human body is usually done through the analysis of blood serum, blood plasma and urine samples. The regular blood range of glucose in the human body is 3 mM to 8 mM. There are prevailing conditions which constitute a lower range of glucose called hypoglycaemia as well as a higher range of glucose, called hyperglycaemia. Both are due to the variation in the insulin produced by pancreatic β cells. Nowadays millions of people suffer from diabetes mellitus. The patients who are highly diabetic/have higher blood glucose levels use insulin to live normal lives while the change in diets also helps in controlling the glucose level in blood. The condition of hypoglycaemia is equally important, which can lead to insulinoma, in which the serum glucose level can even fall beyond 2.2 mM [123]. The maintenance of glucose level in recommended physiological range is very important to slow down the progress of long-term complications in the body which are associated with diabetes. Therefore, the determination/monitoring of glucose level is essential for clinical diagnostics [124]. Different kinds of techniques/methods have been proposed in the literature to develop glucose sensors based on fluorescence, potentiometry, Raman scattering, electrochemical transductions, etc. Moreno-Bondi et al. [125] reported a fiber optic glucose biosensor using oxygen optrode for urine samples. In the probe designed, glucose oxidase (GOx) was attached to the fiber optic probe. The oxidation of glucose in the presence of GOx reduces the oxygen partial pressure. An optical fiber glucose sensor based on fluorescence lifetime utilizing glucose/galactose binding protein (GBP) was reported by Saxl et al. [126] in which the sensing probe was prepared by the immobilization of glucose/GBP over the Ni–NTA functionalized Polystyrene or Agarose beads via an attachment layer of oligohistidine. These beads were kept over the core of the fiber using a glass chamber. The sensing part was dipped in glucose solutions of varying concentration. The sensor operates for the glucose concentration range of 0–100 mM. However, the realization of the sensor requires in-vivo demonstration, reversibility, biocompatibility, miniaturized probe and lack of interference.
Singh and Gupta [127] developed a fiber optic SPR based glucose biosensor utilizing GOx enzyme entrapped hydrogel. To prepare the probe, a thin film of Ag was coated over an unclad core of the fiber, followed by a few nm thick film of silicon and a thin film of enzyme entrapped hydrogel layer. The probe was fixed in a flow cell used for the glucose samples. Figure 21a shows the experimental setup of the sensor while the SPR spectra recorded for different concentrations of glucose samples prepared in phosphate buffer are shown in Figure 21b. The spectra/resonance wavelengths move towards the blue side with the increase in glucose concentration. The variation of resonance wavelength with the concentration of glucose is depicted quantitatively in Figure 21c. The shift in resonance wavelength occurs due to the following enzymatic reaction in gel layer:
The above reaction changes the refractive index of the gel layer. The variation of resonance wavelength with glucose concentration is nonlinear and saturates at higher concentrations of glucose. The reason behind the saturation is the limited amount of enzyme entrapped in the gel film. The variation of sensitivity and detection accuracy of the sensor probe for the selected glucose range shows a linear decrement in sensitivity and a slight increment in detection accuracy with increment in glucose concentration.
An LSPR based fiber optic glucose sensor based on enzymatic reaction with high sensitivity and point sensing probe was also reported using a U-shaped probe by Srivastava et al. [128]. The unclad bent region of the fiber was immobilized with spherical gold nanoparticles of 20 nm diameter. The gold nanoparticle-coated probe was functionalized by glucose oxidase enzyme via a thin SAM layer. A change in the LSPR absorbance intensity at 540 nm was observed as the glucose concentration increased from 0–250 mg/dL. The study showed the glucose biosensor having bending radius around 0.982 mm gives the best performance. Li et al. [129] reported a four-layer fiber optic SPR based glucose sensor with PAA-ran-PAAPBA, having ability to associate and dissociate glucose molecules dynamically, thus providing non-assimilation measurement of glucose mainly in the concentration range of 1–10 mg/dL. The sensor reported possesses a lower detection limit of 1 mg/dL but with intricate steps of probe fabrication utilizing self-assembled technique. Usha et al. [123] reported a glucose/dextrose sensor for insulinoma diagnosis using nanostructures of silver and zinc oxide implementing FO-SPR with a limit of detection of 0.012 mM. The work reported uses semiconductor metal oxide nanostructure along with metal film with various optimizations to provide better results. Yu et al. [130] reported a fiber optic tip sensor for glucose detection using fluorescent carbon quantum dots (CQDs)-glucose oxidase (GOx)/cellulose acetate (CA) complex sensitive film. The study showed a linear relation between the fluorescence intensity with glucose concentration solutions of broad ranges. Using the modified Stern-Volmer equation, the detection limit of the sensor was found as 6.43 μM for 10–200 μmol/L glucose concentrations and 25.79 nM for 10–100 nmol/L glucose concentrations. Heo et al. [131] reported a transdermal minimally invasive sensor for continuous glucose detection with a long-term stability of 140 days. The sensing mechanism of the proposed method was based on fluorescent optical fiber fabricated using polyethylene glycol (PEG)-bonded polyacrylamide (PAM) hydrogel. A comparison of various optical fiber-based glucose sensors is given in Table 1.
5.2. Urea Sensor
Similar to glucose, urea is also one of the very important analytes to be detected regularly in blood and urine. Its quantity in blood and urine is used to measure the working of kidneys. Urea is produced by a liver in the human body and goes to the kidney through blood for excretion. The normal urea level in humans covers the range from 2.5 to 6.7 mM, which increases up to 30–150 mM in the pathophysiological situations [139]. It has been reported that around 10% of the world population is affected by the kidney failures due to the excessive amount of urea in the blood. Hence, for better prevention from the diseases due to urea level, the regular monitoring of urea level in human body becomes essential. Apart from the human body, urea is also used in industries for manufacturing the cleaning products and detergents that cause harmful effects on environment and ground water. Bhatia and Gupta [140] reported a fiber optic SPR based urea sensor using Ag/silicon coatings over the unclad core of optical fiber followed by the immobilization of urease enzyme entrapped in hydrogel layer as shown in Figure 22a. The SPR response obtained for different concentrations of urea ranging from 1 mM to 160 mM in sodium phosphate buffer solution is shown in Figure 22b. A blue shift of SPR spectrum was observed as the concentration of urea increased. The decrement in resonance wavelength determined from SPR spectra with the concentration of urea, shown in Figure 22c, implies a decrease in the refractive index of the immobilized layer due to the formation of complex between urease and urea. The operating range of the sensor is in the physiological range and hence can be used for biomedical applications. An enzyme-based optical fiber urea sensor utilizing both SPR and LSPR phenomena was also reported [141]. The sensor probe was prepared by coating a thin film of Au to realize SPR phenomenon, while an additional layer of Au nanoparticles was immobilized to achieve LSPR. Immobilization of urease enzyme over the SPR-LSPR layer was performed to obtain specific urea detection. The sensor was tested for a broad urea concentration range of 50 to 800 mM.
Verma and Gupta [133] reported a multi-analyte sensor based on SPR technique which can sense both glucose and urea in an aqueous sample. Two different sensing segments on a single optical fiber platform were prepared using Ag/silicon/urease gel and Cu/tin oxide/glucose oxidase gel thin films for urea and glucose detection, respectively. Figure 23a shows the schematics of experimental setup and the proposed probe for multi-analyte sensing. The SPR curves obtained for samples of a mixture of urea and glucose of different concentrations are shown in Figure 23b. The SPR dips obtained are well separated and the shift in wavelength can be seen with the change in the concentrations of analytes.
An evanescent field-based intensity modulated fiber optic Polypyrrole-polyvinyl sulfonate (PPy-PVS) biosensor for urea detection was also reported [142]. The porosity of PPy-PVS matrix provides the easy immobilization of urease enzyme over the unclad core of optical fiber. The proposed sensing method claimed linear behaviour for varying urea concentration in the range 1–100 mM, along with high selectivity and high shelf life of 24 days. A fiber-optic biosensor for urea detection using urease immobilized to a fluorescence ammonia sensor was reported by Xie et al. [143]. In the study, target urea sample interacts with the urease enzyme producing ammonia which diffuses through the membrane into a solution of the fluorescent pH indicator resulting in the change in the fluorescence signal. An in-fiber opto-fluidic SERS based sensor for uremia (urea and creatinine) detection was proposed by Gao et al. [144].
The sensor was designed by incorporating a thin microfluidic channel inside micro-structured hollow-core fiber, while GO/Ag nanoparticles were immobilized inside the hollow core to achieve plasmonic SERS enhancement. The sensor was able to detect urea concentration of 10−4–10−2 M with the lower detection limit of 10−4 M. A comparison of various optical fiber-based urea sensors is given in Table 2.
5.3. Cholesterol Sensor
Cholesterol, a small lipid molecule, is also a constituent of human blood. In a person its content in blood lies in the range 20 mg/dL to 200 mg/dL while for a healthy person its concentration should be within a certain range. The following four kinds of lipoproteins constitute the total blood cholesterol: very low-density lipoprotein (VLDL), intermediate density lipoprotein (IDL), low density lipoprotein (LDL) and high-density lipoprotein (HDL). The molecules of LDL, a fatty acid and cholesterol rich lipoprotein, bind with LDL receptor apolipoprotein B-100 (AAB) during its flow through the artery and result in its accumulation on the artery walls which consequently become atherosclerotic plaques and the main cause of heart diseases. Due to this reason, LDL is called bad cholesterol. A person having LDL concentration greater than 130 mg/dL in blood is termed as unhealthy and is prone to the risk of heart attack. Hence, cholesterol level monitoring is a parameter used for the diagnosis of severe diseases such as cardiovascular disease, myxoedema, hypertension, coronary artery illness, anemia, and hyperthyroidism. A fiber optic SPR sensor was reported for the detection of LDL in physiological range [150]. The sensor was prepared by immobilization of self-assembled monolayers (SAMs) of 4-ATP and anti-apolipoprotein B (AAB) over the gold coated unclad core of the fiber where AAB antibody works as biomolecule recognition element for LDL. The SPR Spectra were recorded for various concentrations of LDL prepared in phosphate buffer saline (PBS) of pH 7.4. Resonance wavelengths were determined from the SPR spectra recorded in the range 0–190 mg/dL. Increase in resonance wavelength with the increase in LDL concentration was observed giving the sensitivity of the sensor as 0.184 nm per mg/dL. An LSPR based tapered fiber optic sensor for cholesterol detection was also reported [151]. In this study, AuNPs over the tapered region of fiber were used to realize LSPR, while the specific sensing was achieved using cholesterol oxidase (COx). The sensor was reported to cover cholesterol concentration range of 0–10 mM along with the LOD value of 53.1 nM.
Later, an integration of SPR and LSPR using Ag/graphene oxide (GO)/AgNPs/COx layers configuration over the optical fiber platform was used for the cholesterol sensing [152]. The sensor’s sensitivity and LOD were obtained as 5.14 nm/mM and 1.131 mM, respectively. The involvement of GO nanosheets causes the large surface area for enzymatic interaction leading to high sensitivity as compared without GO layer in the sensing regime. Figure 24a,b show the SPR and SPR coupled LSPR probes while their corresponding resonance spectra for varying cholesterol concentrations are shown in Figure 24c,d, respectively.
In another study, LSPR coupled with optical fiber MZI using Ag nanoparticles and single mode fiber (SMF)-hollow core fiber (HCF) structure was used for the cholesterol detection [153]. The sensor possessed the linear cholesterol concentration range from 50 nM to 1 μM cholesterol with the detection limit of 25.5 nM. The reflective SMF-HCF structure provides the advantage of miniaturization and possibility of in-vivo application in the human body. A comparison of various optical fiber-based cholesterol sensors is given in Table 3.
5.4. Detection of Stress-Biomarkers
Stress level monitoring is becoming an essential parameter for providing better health security in our daily life, especially for humans belonging to stressful careers, including police, armed forces, sports persons, emergency personnel etc. There are several biomarkers present in the human body which strongly correlate with the increased stress level. Few of them are cortisol, dopamine etc. Since continuous measurement of stress level during the regular activities requires sensing methodology with simple, miniature instrumentation and fast response, several types of fiber optic sensors have been reported for the measurements of stress-biomarkers. A few of them are discussed below.
5.4.1. Dopamine
Dopamine (DA) is one of the most important neurotransmitters and is responsible to our peripherical system, mammalian central nervous system (CNS), neuromodulator and limbic activities [158]. Normal range of DA in the brain refers to healthy brain functioning such as body movements, emotions, hormone release etc. The higher concentration of DA leads to pleasurable feelings while lower DA concentration implies body stress, muscles and postural disorders. Hence, DA concentration in human body is usually used to identify several neural diseases such as memory loss, drug addiction, psychiatric problems, Parkinson’s disease etc. [103,159]. In view of this, lot of work has been done on the detection of DA. Few of the fiber optic sensors for DA detection are discussed below.
A SPR based fiber optic sensor for DA detection using molecular imprinted polymeric film was reported by Sharma and Gupta [104]. Molecular imprinted polymer was prepared using coating of graphene nanoaplatelets/tin oxide (SnO2) nanocomposite, as the host matrix for the creation of DA molecule’s templates, over a 40 nm Ag film coated core of the fiber to achieve SPR. A step-by-step process of sensing mechanism of the probe and corresponding response curves are shown in Figure 25a,b, respectively. The sensor was able to detect DA as low as 0.031 µM.
The same group later reported an improved DA sensor using polypyrrole (PPy) as host matrix for molecular imprinted polymer along with permeable nafion film to ensure perm-selectivity [103]. The sensor worked for a broad range of DA concentration varying from 0-10-5 M. The detection limit of the sensor was reported to be 18.9 pM. Figure 26 represents the steps and chemical interactions involved in preparation of nafion assembly around imprinted PPy@CWNT nanocomposite for DA sensing.
A fiber optic SPR sensor using SPR and tilted fiber Bragg grating (TFBG) for DA sensing with aptamer conformational application was proposed by Hu et al. [160]. The sensor was fabricated by the monolayer graphene immobilization over the Au coated TFBG region of the fiber, followed by the functionalization of ssDNA aptamer for DA binding. The proposed sensor was able to detect DA with linear range of 10−13 to 10−8 M with the lowest detection limit of 10−13 M. A miniaturized and wireless optical neurotransmitter sensor (MWONS) for the real-time monitoring of brain dopamine concentration using an optical fiber tip coated by fluorescent quantum dots (QDs) for selective interaction with the target DA was demonstrated [161]. MWONS device was based on fluorescence principle and equipped with a micro-spectrophotometer for characterization, wireless network for real-time data collection and a microcontroller unit for data acquisition. SERS based DA sensing using sol-gel substrate and a specially designed tapered fiber optic probe was reported by Volkan et al. [162]. The fiber optic probe was tapered and coated with polyvinyl alcohol (PVA) embedded with Ag nanoparticles, while substrate was also prepared with sol-gel matrix encapsulated with Ag nanoparticles.
A list of several fiber optic DA sensors reported in the literature has been summarized in Table 4.
5.4.2. Cortisol
Like DA, cortisol also belongs to stress biomarker category chemicals. It is basically a steroid hormone, which is discharged during the circumstantial trigger to the human body. It plays a crucial role in maintaining human homeostasis, which is beneficial to human body up to a certain extent. The higher exposure of such triggering causes an abnormal increase in cortisol concentration affecting the human immune system, cardiovascular system, and renal system along with glucose, carbohydrate, and blood pressure levels. Efficient monitoring of the cortisol level is very important. Few optical fiber cortisol sensors reported in the literature are discussed here. An optical fiber lossy mode resonance (LMR) based sensor for cortisol detection using ZnO-PPY hosted molecular imprinted polymer was reported [169]. The method showed the real-world application by detecting cortisol in the artificial saliva samples with a concentration range of 0-10-6 gm/mL. The sensor worked in a quick response time of around 20 sec with detection limit of 29.6 fg/mL. A schematic of the fabricated LMR probe is shown in Figure 27 [169]. In another study, a fiber optic immunosensor for cortisol detection using plasmonic titled fiber Bragg grating (TFBG) was demonstrated [170]. Anti-cortisol antibodies were immobilized on gold coated TFBGs via cysteamine for probe fabrication and the probe was characterized for cortisol concentration range of 0–10 ng/mL. The sensor possessed the linear response for the same concentration range, with sensitivity of 0.275 ± 0.028 nm/ng·mL−1.
A list of several fiber optic cortisol sensors reported in the literature has been summarized in Table 5.
Along with stress biomarkers, many similar studies have been reported for several other types of biomarkers such as thrombin (a biomarker to identify blood homeostasis and coagulation cascade) using optical fiber sensing platform. Recently, Cennamo et al. have reported a D-shaped fiber substrate based SPR sensor for thrombin detection [173]. A DNA functionalized specific aptamer as a recognition ligand was attached over the gold-coated optical fiber surface to achieve selective sensing. The optimization of SAM composition allowed immobilization of the aptamer with 112 ng/cm2 surface density. The sensor possessed a working range from 1 to 60 nM with LOD value and response time of 1 nM and 5 to 10 min, respectively. In a similar study, Cennamo et al. reported the detection of cancer biomarker (Vascular endothelial growth factor (VEGF), a circulating protein potentially associated with cancer) for the early diagnosis [174]. The sensing was achieved by the selective binding of guest biomarker with corresponding DNA aptamer as recognition ligand, which changes its refractive index after binding giving shift in SPR resonance wavelength.
5.5. Virus Detection
Emerging/re-emerging of new viruses such as influenza, Ebola, swine flu, dengue, corona and their fast transportation have been a threat to the world health security of the last few decades. Viruses enter the human body via organs and through some pathogenic process. They start to degrade our immune system leading to basic symptoms such as fever, cold and cough, which result in lung inflammation, organ failure or even death [175,176]. Additionally, the degree of dangerousness due to the virus spreading can be observed by the heath, social and economic impacts in our life because of the current COVID-19 pandemic. Hence, to prevent all these damages, the viral diagnosis is essential to minimize the damage due to certain viruses. Several fiber optic sensors have been reported in the literature for virus detection. Few of them are discussed here.
An optical fiber SPR sensor for the detection of avian influenza virus H6 was reported by Zhao et al. [177]. The sensing was achieved using EB2-B3 monoclonal antibodies to capture A/chicken/Taiwan/2838V/00 (H6N1) virus antigens. The antibodies were immobilized by EDC-NHS functionalization over the Au coated side-polished fiber optic platform. On an average, the sensor possessed the response time of 10 min while the LOD value of 5.14 × 10⁵ EID50/0.1 mL. Camara et al. reported a LSPR based sensor for the diagnosis of dengue virus using Au nanoparticles coated over the tip of the standard multimode fiber [178]. Dengue anti-NS1 antibodies were immobilized over the Au nanoparticles to realize specific sensing for Dengue NS1 antigens with different concentrations. The quantification limit of sensor was found to be 0.074 μg/mL. A chemiluminescent optical fiber immunosensor (OFIS) was developed as a diagnostic tool for anti-DENV immunoglobulin M (IgM) in human serum samples [179]. The sensing performance of the OFIS for IgM prepared using colorimetric MAC-ELISA and chemiluminescent MAC-ELISA techniques were compared. The detection limit of the proposed method was 10 times lower than the chemiluminescent MAC-ELISA, while it was 100 times lower than the colorimetric MAC-ELISA method. Thus, the study claimed that chemiluminescent OFIS is very useful for low concentration of the analyte. A LSPR coupled optical fiber sensor for swine-origin influenza (H1N1) virus was reported [180]. The sensor was fabricated using a sandwich immunoassay and the antibodies for the detection of hemagglutinin (HA) proteins of S-OIVs. The LOD value of the sensor was found to be 13.9 pg/mL, a thousand times lower than the conventional ELISA method. For the clinical cases, the LOD value of the present method was found to be 8.25 × 10⁴ copies/mL, whereas ELISA method showed the detection limit of 2.06 × 10⁶ copies/mL.
Cennamo et al. has reported the detection of SARS-CoV-2 spike glycoprotein using a SPR based sensor over D-shaped plastic optical fiber platform [181]. The specific sensing of glycoprotein was achieved using receptor-binding domain (RBD) aptamer of the same SARS-CoV-2 spike glycoprotein target biomolecule. The sensor was found to operate over a wide range of spike protein from 25 to 1000 nM along with an LOD value of 37 nM. A proof-of-concept study for the SARS-CoV-2 spike glycoprotein detection was proposed by the same group again [182]. Although the study did not provide any experimental study but successfully proposed MIP as a useful platform for the diagnosis of COVID-19.
A summary of various optical fiber sensors for viral diagnostics has been tabulated in Table 6.
6. Summary
This review is aimed at providing a full overview of recent developments in the field of Lab-on-fiber technology for biomedical diagnosis applications. The most important challenge and issue in the field of LOF technology is the integration of multifunctional nanomaterials on the high aspect ratio fiber surfaces. Since most of the nanofabrication techniques have been designed for the planar surfaces, the technological advancements related to optical fiber geometry have been reviewed in this article. The next emphasis has been given on the possible light matter interaction mechanisms like interferometry, fluorescence, SERS and SPR for the fiber optic sensing platforms. The physical principles and applications pertaining to these mechanisms have been discussed in detail. The next important parameter in any sensing design is the integration of a selective recognition layer which can sensitively probe the modulation in the local environment in terms of concentration, temperature, refractive index etc. Thus, to provide the complete overview of LOF technology, the recognition layers applicable to fiber sensors have been discussed. In the end, the recent applications of optical fiber sensors related to biomedical diagnosis like glucose, urea, cortisol, dopamine and virus sensing have been discussed. In the future, we expect the fabrication of all fiber micro- and nano- biomedical sensors for commercial applications by evidencing the enormous potentiality of this platform.
Although the developments in optical fiber technology have significantly demostrated its potential towards devloping low-cost, miniature, sensitive sensors along with facilities of online monitoring and remote sensing, the technology still requires a good amount of progress in various domains to convert LOF sensors to industrial applications. The factors which require improvement are specificity, reusability, reproducibility and more specifically the intergation of optical fiber sensors with liquid flow system to achieve sensing with a small and continuous flow sample. However, at the rate at which the technology is devoloping, these issues will be resolved in the very near future and we will surely discover field usability of several optical fiber sensors in the chemical and biomedical industry for the betterment of human health security.
Author Contributions
Writing—original draft preparation, B.D.G., A.P. and A.M.S.; writing—review and editing, B.D.G., A.P. and A.M.S. All authors have read and agreed to the published version of the manuscript.
Funding
This research received no external funding.
Institutional Review Board Statement
Not applicable.
Informed Consent Statement
Not applicable.
Data Availability Statement
Not applicable.
Conflicts of Interest
The authors declare no conflict of interest.
References
- Chen, C.; Wang, J. Optical biosensors: An exhaustive and comprehensive review. Analyst 2020, 145, 1605–1628. [Google Scholar] [CrossRef]
- Chen, Y.T.; Lee, Y.C.; Lai, Y.H.; Lim, J.C.; Huang, N.T.; Lin, C.T.; Huang, J.J. Review of Integrated Optical Biosensors for Point-of-Care Applications. Biosensors 2020, 10, 209. [Google Scholar] [CrossRef]
- Zhuang, J.; Yin, J.; Lv, S.; Wang, B.; Mu, Y. Advanced “lab-on-a-chip” to detect viruses—Current challenges and future perspectives. Biosens. Bioelec. 2020, 163, 112291. [Google Scholar] [CrossRef]
- Abgrall, P.; Gue, A.M. Lab-on-chip technologies: Making a microfluidic network and coupling it into a complete microsystem—A review. J. Micromech. Microeng. 2007, 17, 15. [Google Scholar] [CrossRef]
- Arshavsky-Graham, S.; Segal, E. Lab-on-a-Chip Devices for Point-of-Care Medical Diagnostics. In Advances in Biochemical Engineering/Biotechnology; Springer: Berlin/Heidelberg, Germany, 2020. [Google Scholar]
- Ricciardi, A.; Crescitelli, A.; Vaiano, P.; Quero, G.; Consales, M.; Pisco, M.; Esposito, E.; Cusano, A. Lab-on-fiber technology: A new vision for chemical and biological sensing. Analyst 2015, 140, 8068–8079. [Google Scholar] [CrossRef]
- Pisco, M.; Cusano, A. Lab-On-Fiber Technology: A Roadmap toward Multifunctional Plug and Play Platforms. Sensors 2020, 20, 4705. [Google Scholar] [CrossRef]
- Vaiano, P.; Carotenuto, B.; Pisco, M.; Ricciardi, A.; Quero, G.; Consales, M.; Crescitelli, A.; Esposito, E.; Cusano, A. Lab on Fiber Technology for biological sensing applications. Laser Phot. Rev. 2016, 10, 922–961. [Google Scholar] [CrossRef]
- Correia, R.; James, S.; Lee, S.W.; Morgan, S.P.; Korposh, S. Biomedical application of optical fibre sensors. J. Opt. 2018, 20, 073003. [Google Scholar] [CrossRef]
- Ricciardi, A.; Consales, M.; Quero, G.; Crescitelli, A.; Esposito, E.; Cusano, A. Lab-on-Fiber devices as an all-around platform for sensing. Opt. Fiber Technol. 2013, 19, 772–784. [Google Scholar] [CrossRef]
- Consales, M.; Ricciardi, A.; Crescitelli, A.; Esposito, E.; Cutolo, A.; Cusano, A. Lab-on-Fiber Technology: Toward Multifunctional Optical Nanoprobes. ACS Nano 2012, 6, 3163–3170. [Google Scholar] [CrossRef]
- Yu, X.; Zhang, S.; Olivo, M.; Li, N. Micro- and nano-fiber probes for optical sensing, imaging, and stimulation in biomedical applications. Photon. Res. 2020, 8, 1703–1724. [Google Scholar] [CrossRef]
- Kostovski, G.; Stoddart, P.R.; Mitchell, A. The optical fiber tip: An inherently light-coupled microscopic platform for micro- and nanotechnologies. Adv. Mater. 2014, 26, 3798–3820. [Google Scholar] [CrossRef] [PubMed]
- Xiong, Y.; Xu, F. Multifunctional integration on optical fiber tips: Challenges and opportunities. Adv. Photonics 2020, 2, 064001. [Google Scholar] [CrossRef]
- Zamarreño, C.R.; Matías, I.R.; Arregui, F.J. Nanofabrication techniques applied to the development of novel optical fiber sensors based on nanostructured coatings. IEEE Sens. J. 2012, 12, 2699–2710. [Google Scholar] [CrossRef]
- Mullen, K.I.; Carron, K.T. Surface-enhanced Raman spectroscopy with abrasively modified fiber optic probes. Anal. Chem. 1991, 63, 2196–2199. [Google Scholar] [CrossRef]
- Yao, M.; Ouyang, X.; Wu, J.; Zhang, A.P.; Tam, H.-Y.; Wai, P.K.A. Optical Fiber-Tip Sensors Based on In-Situ µ-Printed Polymer Suspended-Microbeams. Sensors 2018, 18, 1825. [Google Scholar] [CrossRef] [Green Version]
- Wu, J.; Yin, M.; Seefeldt, K.; Dani, A.; Guterman, R.; Yuan, J.; Zhang, A.P.; Tam, H.-Y. In situ μ-printed optical fiber-tip CO2 sensor using a photocrosslinkable poly(ionic liquid). Sens. Actuators B Chem. 2018, 259, 833–839. [Google Scholar]
- Yao, M.; Zhang, Y.; Ouyang, X.; Zhang, A.P.; Tam, H.Y.; Wai, P.K.A. Ultracompact optical fiber acoustic sensors based on a fiber-top spirally-suspended optomechanical microresonator. Opt. Lett. 2020, 45, 3516–3519. [Google Scholar] [CrossRef]
- Galeotti, F.; Pisco, M.; Cusano, A. Self-assembly on optical fibers: A powerful nanofabrication tool for next generation ‘lab-on-fiber’ optrodes. Nanoscale 2018, 10, 22673–22700. [Google Scholar] [CrossRef]
- Sciacca, B.; Monro, T.M. Dip biosensor based on localized surface plasmon resonance at the tip of an optical fiber. Langmuir 2014, 30, 946–954. [Google Scholar] [CrossRef]
- Antohe, I.; Spasic, D.; Delport, F.; Li, J.; Lammertyn, J. Nanoscale patterning of gold-coated optical fibers for improved plasmonic sensing. Nanotechnology 2017, 28, 215301. [Google Scholar] [CrossRef]
- Smietana, M.; Bock, W.J.; Mikulic, P.; Chen, J. Pressure sensing in high-refractive-index liquids using long-period gratings nanocoated with silicon nitride. Sensors 2010, 10, 11301–11310. [Google Scholar] [CrossRef]
- Jayawardhana, S.; Kostovski, G.; Mazzolini, A.P.; Stoddart, P.R. Optical fiber sensor based on oblique angle deposition. Appl. Opt. 2011, 50, 155–162. [Google Scholar] [CrossRef] [PubMed]
- Monzón-Hernández, D.; Luna-Moreno, D.; Martínez-Escobar, D. Fast response fiber optic hydrogen sensor based on palladium and gold nano-layers. Sens. Actuators B Chem. 2009, 136, 562–566. [Google Scholar] [CrossRef]
- Bachelot, R.; Ecoffet, C.; Deloeil, D.; Royer, P.; Lougnot, D.J. Integration of micrometer-sized polymer elements at the end of optical fibers by free-radical photopolymerization. Appl. Opt. 2001, 40, 5860–5871. [Google Scholar] [CrossRef]
- Vanmol, K.; Baghdasaryan, T.; Vermeulen, N.; Saurav, K.; Watté, J.; Thienpont, H.; Erps, J.V. 3D direct laser writing of microstructured optical fiber tapers on single-mode fibers for mode-field conversion. Opt. Express 2020, 28, 36147–36158. [Google Scholar] [CrossRef] [PubMed]
- Xie, Z.; Feng, S.; Wang, P.; Zhang, L.; Ren, X.; Cui, L.; Zhai, T.; Chen, J.; Wang, Y.; Wang, X.; et al. Demonstration of a 3D radar-like SERS sensor micro- and nanofabricated on an optical fiber. Adv. Opt. Mater. 2015, 3, 1232–1239. [Google Scholar] [CrossRef]
- Feng, S.; Darmawi, S.; Henning, T.; Klar, P.J.; Zhang, X. A miniaturized sensor consisting of concentric metallic nanorings on the end facet of an optical fiber. Small 2012, 8, 1937–1944. [Google Scholar] [CrossRef]
- Andrade, G.F.S.; Hayashi, J.G.; Rahman, M.M.; Salcedo, W.J.; Cordeiro, C.M.; Brolo, A.G. Surface-enhanced resonance Raman scattering (SERRS) using Au nanohole arrays on optical fiber tips. Plasmonics 2013, 8, 1113–1121. [Google Scholar] [CrossRef]
- Dhawan, A.; Gerhold, M.D.; Muth, J.F. Plasmonic structures based on subwavelength apertures for chemical and biological sensing applications. IEEE Sens. J. 2008, 8, 942–950. [Google Scholar] [CrossRef]
- Kostovski, G.; Chinnasamy, U.; Jayawardhana, S.; Stoddart, P.R.; Mitchell, A. Sub-15nm Optical Fiber Nanoimprint Lithography: A Parallel, Self-aligned and Portable Approach. Adv. Mater. 2011, 23, 531–535. [Google Scholar] [CrossRef] [PubMed]
- Scheerlinck, S.; Taillaert, D.; Thourhout, D.V.; Baets, R. Flexible metal grating based optical fiber probe for photonic integrated circuits. Appl. Phys. Lett. 2008, 92, 031104. [Google Scholar] [CrossRef] [Green Version]
- Choi, S.; Kim, K.R.; Oha, K.; Chun, C.M.; Kim, M.J.; Yoo, S.J.; Kim, D.Y. Interferometric inscription of surface relief gratings on optical fiber using azo polymer film. App. Phy. Lett. 2003, 83, 1080–1082. [Google Scholar] [CrossRef]
- Kim, J.B.; Jeong, K.H. Batch fabrication of functional optical elements on a fiber facet using DMD based maskless lithography. Opt. Express 2017, 25, 16854–16859. [Google Scholar] [CrossRef]
- Polley, N.; Basak, S.; Hass, R.; Pacholski, C. Fiber optic plasmonic sensors: Providing sensitive biosensor platforms with minimal lab equipment. Biosens. Bioelectron. 2019, 132, 368–374. [Google Scholar] [CrossRef]
- Smythe, E.J.; Dickey, M.D.; Bao, J.; Whitesides, G.M.; Capasso, F. Optical Antenna Arrays on a Fiber Facet for in Situ Surface-Enhanced Raman Scattering Detection. Nano Lett. 2009, 9, 1132–1138. [Google Scholar] [CrossRef] [Green Version]
- Jia, P.; Yang, J. A plasmonic optical fiber patterned by template transfer as a high-performance flexible nanoprobe for real-time biosensing. Nanoscale 2014, 6, 8836–8843. [Google Scholar] [CrossRef]
- Jung, W.; Park, B.; Provine, J.; Howe, R.T.; Solgaard, O. Highly Sensitive Monolithic Silicon Photonic Crystal Fiber Tip Sensor for Simultaneous Measurement of Refractive Index and Temperature. J. Lightwave Technol. 2011, 29, 1367–1374. [Google Scholar] [CrossRef]
- Dhawan, A.; Muth, J.F. Engineering surface plasmon based fiber-optic sensors. Mater. Sci. Eng. B-Solid 2008, 149, 237–241. [Google Scholar] [CrossRef]
- Micco, A.; Ricciardi, A.; Pisco, M.; Ferrara, V.L.; Cusano, A. Optical fiber tip templating using direct focused ion beam milling. Sci. Rep. 2015, 5, 15935. [Google Scholar] [CrossRef] [Green Version]
- Iannuzzi, D.; Deladi, S.; Gadgil, V.J.; Sanders, R.G.P.; Schreuders, H.; Elwenspoek, M.C. Monolithic fiber-top sensor for critical environments and standard applications. Appl. Phys. Lett. 2006, 88, 053501. [Google Scholar] [CrossRef] [Green Version]
- Liberale, C.; Minzioni, P.; Bragheri, F.; Angelis, F.D.; Fabrizio, E.D.; Cristiani, I. Miniaturized all-fibre probe for three dimensional optical trapping and manipulation. Nat. Photonics 2007, 1, 723–727. [Google Scholar] [CrossRef]
- Schiappelli, F.; Kumar, R.; Prasciolu, M.; Cojoc, D.; Cabrini, S.; Vittorio, M.D.; Visimberg, G.; Gerardino, A.; Degiorgio, V.; Fabrizio, E.D. Efficient fiber-to-waveguide coupling by a lens on the end of the optical fiber fabricated by focused ion beam milling. Microelectron. Eng. 2004, 73–74, 397–404. [Google Scholar] [CrossRef]
- Sloyan, K.; Melkonyan, H.; Apostoleris, H.; Dahlem, M.S.; Chiesa, M.; Ghaferi, A.A. A review of focused ion beam applications in optical fibers. Nanotechnology 2021, 32, 472004. [Google Scholar] [CrossRef]
- Principe, M.; Consales, M.; Micco, A.; Crescitelli, A.; Castaldi, G.; Esposito, E.; La Ferrara, V.; Cutolo, A.; Galdi, V.; Cusano, A. Optical fiber meta-tips. Light Sci. Appl. 2017, 6, e16226. [Google Scholar] [CrossRef] [Green Version]
- Kostovski, G.; White, D.J.; Mitchell, A.; Austina, M.W.; Stoddart, P.R. Nanoimprinted optical fibres: Biotemplated nanostructures for SERS sensing. Biosens. Bioelectron. 2009, 24, 1531–1535. [Google Scholar] [CrossRef]
- Lin, Y.; Zou, Y.; Lindquist, R.G. A reflection-based localized surface plasmon resonance fiber-optic probe for biochemical sensing. Biomed. Opt. Express 2011, 2, 478–484. [Google Scholar] [CrossRef] [Green Version]
- Ricciardi, A.; Consales, M.; Quero, G.; Crescitelli, A.; Esposito, E.; Cusano, A. Versatile Optical Fiber Nanoprobes: From Plasmonic Biosensors to Polarization-Sensitive Devices. ACS Photonics 2014, 1, 69–78. [Google Scholar] [CrossRef]
- Sasaki, M.; Ando, T.; Nogawa, S.; Hane, K. Direct photolithography on optical fiber end. Jpn. J. Appl. Phys. 2002, 41, 4350–4355. [Google Scholar] [CrossRef]
- Petrušis, A.; Rector, J.H.; Smith, K.; Man, S.; Iannuzzi, D. The align-and-shine technique for series production of photolithography patterns on optical fibres. J. Micromech. Microeng. 2009, 19, 047001. [Google Scholar] [CrossRef]
- Yang, X.; Ileri, N.; Larson, C.C.; Carlson, T.C.; Britten, J.A.; Chang, A.S.P.; Gu, C.; Bond, T.C. Nanopillar array on a fiber facet for highly sensitive surface-enhanced Raman scattering. Opt. Express 2012, 20, 24819–24826. [Google Scholar] [CrossRef] [PubMed]
- Huang, Z.; Lei, X.; Liu, Y.; Wang, Z.; Wang, X.; Wang, Z.; Mao, Q.; Meng, G. Tapered optical fiber probe assembled with plasmonic nanostructures for surface-enhanced Raman scattering application. ACS Appl. Mater. Interf. 2015, 7, 17247–17254. [Google Scholar] [CrossRef] [PubMed]
- Sharma, P.; Semwal, V.; Gupta, B.D. A highly selective LSPR biosensor for the detection of taurine realized on optical fiber substrate and gold nanoparticles. Opt. Fiber Technol. 2019, 52, 101962. [Google Scholar] [CrossRef]
- Martínez-Hernández, M.E.; Goicoechea, J.; Arregui, F.J. Hg2+ Optical Fiber Sensor Based on LSPR Generated by Gold Nanoparticles Embedded in LBL Nano-Assembled Coatings. Sensors 2019, 19, 4906. [Google Scholar] [CrossRef] [PubMed] [Green Version]
- Semwal, V.; Gupta, B.D. Experimental studies on the sensitivity of the propagating and localized surface plasmon resonance-based tapered fiber optic refractive index sensors. Appl. Opt. 2019, 58, 4149–4156. [Google Scholar] [CrossRef]
- Pisco, M.; Galeotti, F.; Quero, G.; Iadicicco, A.; Giordano, M.; Cusano, A. Miniaturized Sensing Probes Based on Metallic Dielectric Crystals Self-Assembled on Optical Fiber Tips. ACS Photonics 2014, 1, 917–927. [Google Scholar] [CrossRef]
- Smythe, E.J.; Dickey, M.D.; Whitesides, G.M.; Capasso, F. A technique to transfer metallic nanoscale patterns to small and non-planar surfaces. ACS Nano 2009, 3, 59–65. [Google Scholar] [CrossRef] [PubMed] [Green Version]
- Shambat, G.; Kothapalli, S.R.; Khurana, A.; Provine, J.; Sarmiento, T.; Cheng, K.; Cheng, Z.; Harris, J.; Link, H.D.; Gambhir, S.S.; et al. A photonic crystal cavity-optical fiber tip nanoparticle sensor for biomedical applications. Appl. Phys. Lett. 2012, 100, 213702. [Google Scholar] [CrossRef] [Green Version]
- Lee, B.H.; Kim, Y.H.; Park, K.S.; Eom, J.B.; Kim, M.J.; Rho, B.S.; Choi, H.Y. Interferometric fiber optic sensors. Sensors 2012, 12, 2467–2486. [Google Scholar] [CrossRef] [Green Version]
- Miliou, A. In-Fiber interferometric-based sensors: Overview and recent advances. Photonics 2021, 8, 265. [Google Scholar] [CrossRef]
- Chen, L.H.; Ang, X.M.; Chan, C.C.; Shaillender, M.; Neu, B.; Wong, W.C.; Zu, P.; Leong, K.C. Layer-by-layer (chitosan/polystyrene sulfonate) membrane-based Fabry-Perot interferometric fiber optic biosensor. IEEE J. Sel. Top. Quantum Electron. 2012, 18, 1457–1464. [Google Scholar] [CrossRef]
- Wallner, J.; Lhota, G.; Jeschek, D.; Mader, A.; Vorauer-Uhl, K. Application of bio-layer interferometry for the analysis of protein/liposome interactions. J. Pharm. Biomed. Anal. 2013, 72, 150–154. [Google Scholar] [CrossRef] [PubMed]
- Hirsch, M.; Majchrowicz, D.; Wierzba, P.; Weber, M.; Bechelany, M.; Jędrzejewska-Szczerska, M. Low-coherence interferometric fiber-optic sensors with potential applications as biosensors. Sensors 2017, 17, 261. [Google Scholar] [CrossRef] [PubMed] [Green Version]
- Zhou, X.; Ma, F.; Ling, H.; Yu, B.; Peng, W.; Yu, Q. A compact hydrogen sensor based on the fiber-optic Fabry-Perot interferometer. Opt. Laser Technol. 2020, 124, 105995. [Google Scholar] [CrossRef]
- Wu, S.; Yan, G.; Zhou, B.; Lee, E.H.; He, S. Open-Cavity Fabry-Perot Interferometer Based on Etched Side-Hole Fiber for Microfluidic Sensing. IEEE Photon. Technol. Lett. 2015, 27, 1813–1816. [Google Scholar]
- Sharma, G.; Shrivastav, A.M.; Jana, A.; Jha, R. Synthesized Fe3O4 nanoflowers coated microfiber as magnetometer. IEEE Photon. Technol. Lett. 2018, 30, 1925–1928. [Google Scholar] [CrossRef]
- Shrivastav, A.M.; Sharma, G.; Jha, R. Hypersensitive and selective biosensing based on microfiber interferometry and molecular imprinted nanoparticles. Biosens. Bioelectron. 2019, 141, 111347. [Google Scholar] [CrossRef]
- Osório, J.H.; Guimarães, W.M.; Peng, L.; Franco, M.A.; Warren-Smith, S.C.; Ebendorff-Heidepriem, H.; Cordeiro, C.M. Exposed-core fiber multimode interference sensor. Results Opt. 2021, 5, 100125. [Google Scholar] [CrossRef]
- Shrivastav, A.M.; Sharma, G.; Rathore, A.S.; Jha, R. Hypersensitive and selective interferometric nose for ultratrace ammonia detection with fast response utilizing PANI@ SnO2 nanocomposite. ACS Photon. 2018, 5, 4402–4412. [Google Scholar] [CrossRef]
- Yang, W.; Wang, W.; Chen, H.; Zhang, X.; Guo, Z.; Zhang, J. Fiber-optic multimode interferometric curvature sensor based on small-inner-diameter hollow core fiber. Opt. Fiber Technol. 2021, 67, 102749. [Google Scholar] [CrossRef]
- Cardona-Maya, Y.; Socorro, A.B.; Villar, I.D.; Cruz, J.L.; Corres, J.M.; Botero-Cadavid, J.F. Label-free wavelength and phase detection-based SMS fiber immunosensors optimized with cladding etching. Sens. Actuators B Chem. 2018, 265, 10–19. [Google Scholar] [CrossRef] [Green Version]
- Ravikumar, R.; Chen, L.H.; Jayaraman, P.; Poh, C.L.; Chan, C.C. Chitosan-nickel film based interferometric optical fiber sensor for label-free detection of histidine tagged proteins. Biosens. Bioelectron. 2018, 99, 578–585. [Google Scholar] [CrossRef] [PubMed]
- Dong, B.; Hao, J.; Liaw, C.Y.; Xu, Z. Cladding-mode resonance in polarization-maintaining photonic-crystal-fiber-based sagnac interferometer and its application for fiber sensor. J. Light. Techol. 2011, 29, 1759–1763. [Google Scholar] [CrossRef]
- Baldini, F.; Brenci, M.; Chiavaioli, F.; Giannetti, A.; Trono, C. Optical fibre gratings as tools for chemical and biochemical sensing. Anal. Bioanal. Chem. 2012, 402, 109–116. [Google Scholar] [CrossRef]
- Chiavaioli, F.; Baldini, F.; Tombelli, S.; Trono, C.; Giannetti, A. Biosensing with optical fiber gratings. Nanophotonics 2017, 6, 663–679. [Google Scholar] [CrossRef]
- Esposito, F.; Sansone, L.; Taddei, C.; Campopiano, S.; Giordano, M.; Iadicicco, A. Ultrasensitive biosensor based on long period grating coated with polycarbonate-graphene oxide multilayer. Sens. Actuators B Chem. 2018, 274, 517–526. [Google Scholar] [CrossRef]
- Esposito, F.; Sansone, L.; Srivastava, A.; Cusano, A.M.; Campopiano, S.; Giordano, M.; Iadicicco, A. Label-free detection of vitamin D by optical biosensing based on long period fiber grating. Sens. Actuators B Chem. 2021, 347, 130637. [Google Scholar] [CrossRef]
- Esposito, F.; Sansone, L.; Srivastava, A.; Baldini, F.; Campopiano, S.; Chiavaioli, F.; Giordano, M.; Giannetti, A.; Iadicicco, A. Long period grating in double cladding fiber coated with graphene oxide as high-performance optical platform for biosensing. Biosens. Bioelectron. 2021, 172, 112747. [Google Scholar] [CrossRef]
- Bertucci, A.; Manicardi, A.; Candiani, A.; Giannetti, S.; Cucinotta, A.; Spoto, G.; Konstantaki, M.; Pissadakis, S.; Selleri, S.; Corradini, R. Detection of unamplified genomic DNA by a PNA-based microstructured optical fiber (MOF) Bragg-grating optofluidic system. Biosens. Bioelectron. 2015, 63, 248–254. [Google Scholar] [CrossRef]
- Iele, A.; Ricciardi, A.; Pecorella, C.; Cirillo, A.; Ficuciello, F.; Siciliano, B.; La Rocca, R.; Mirone, V.; Consales, M.; Cusano, A. Miniaturized optical fiber probe for prostate cancer screening. Biomed. Opt. Exp. 2021, 12, 5691–5703. [Google Scholar] [CrossRef]
- Carotenuto, B.; Ricciardi, A.; Micco, A.; Amorizzo, E.; Mercieri, M.; Cutolo, A.; Cusano, A. Smart optical catheters for epidurals. Sensors 2018, 18, 2101. [Google Scholar] [CrossRef] [Green Version]
- Huang, Q.D.; Lv, C.H.; Yuan, X.L.; He, M.; Lai, J.P.; Sun, H. A novel fluorescent optical fiber sensor for highly selective detection of antibiotic ciprofloxacin based on replaceable molecularly imprinted nanoparticles composite hydrogel detector. Sens. Actuators B Chem. Chem. 2021, 328, 129000. [Google Scholar] [CrossRef]
- Gong, J.; Tanner, M.G.; Venkateswaran, S.; Stone, J.M.; Zhang, Y.; Bradley, M. A hydrogel-based optical fibre fluorescent pH sensor for observing lung tumor tissue acidity. Anal. Chim. Acta 2020, 1134, 136–143. [Google Scholar] [CrossRef] [PubMed]
- Fleischman, M.; Hendra, P.J.; McQuilla, A.J. Raman spectra of pyridine adsorbed at a silver electrode. Chem. Phys. Lett. 1974, 26, 163–166. [Google Scholar] [CrossRef]
- Jeanmaire, D.L.; Van Duyne, R.P. Surface Raman spectroelectrochemistry: Part I. Heterocyclic, aromatic, and aliphatic amines adsorbed on the anodized silver electrode. J. Electroanal. Chem. Interf. Electrochem. 1977, 84, 1–20. [Google Scholar] [CrossRef]
- Bello, J.M.; Narayanan, V.A.; Stokes, D.L.; Tuan, V.D. Fiber-optic remote sensor for in situ surface-enhanced Raman scattering analysis. Anal. Chem. 1990, 62, 2437–2441. [Google Scholar] [CrossRef]
- Ma, X.; Huo, H.; Wang, W.; Tian, Y.; Wu, N.; Guthy, C.; Shen, M.; Wang, X. Surface-enhanced Raman scattering sensor on an optical fiber probe fabricated with a femtosecond laser. Sensors 2010, 10, 11064–11071. [Google Scholar] [CrossRef]
- Zhu, Y.; Dluhy, R.A.; Zhao, Y. Development of silver nanorod array based fiber optic probes for SERS detection. Sens. Actuators B Chem. 2011, 157, 42–50. [Google Scholar] [CrossRef]
- Stokes, D.L.; Vo-Dinh, T. Development of an integrated single-fiber SERS sensor. Sens. Actuators B Chem. 2000, 69, 28–36. [Google Scholar] [CrossRef]
- Credi, C.; Bibikova, O.; Dallari, C.; Tiribilli, B.; Ratto, F.; Centi, S.; Pini, R.; Artyushenko, V.; Cicchi, R.; Pavone, F.S. Fiber-cap biosensors for SERS analysis of liquid samples. J. Mater. Chem. B 2020, 8, 1629–1639. [Google Scholar] [CrossRef]
- Wang, J.; Geng, Y.; Shen, Y.; Shi, W.; Xu, W.; Xu, S. SERS-active fiber tip for intracellular and extracellular pH sensing in living single cells. Sens. Actuators B Chem. 2019, 290, 527–534. [Google Scholar] [CrossRef]
- Quero, G.; Zito, G.; Managò, S.; Galeotti, F.; Pisco, M.; De Luca, A.C.; Cusano, A. Nanosphere Lithography on Fiber: Towards engineered lab-on-fiber SERS optrodes. Sensors 2018, 18, 680. [Google Scholar] [CrossRef] [PubMed] [Green Version]
- Yap, F.L.; Thoniyot, P.; Krishnan, S.; Krishnamoorthy, S. Nanoparticle Cluster Arrays for High-Performance SERS through Directed Self-Assembly on Flat Substrates and on Optical Fibers. ACS Nano 2012, 6, 2056–2070. [Google Scholar] [CrossRef] [PubMed]
- Gu, C.; Zhao, Z.; Shi, P. Development of monolayer AuNPs decorated on an optical fiber facet for SERS analysis. Appl. Opt. 2021, 60, 792–798. [Google Scholar] [CrossRef] [PubMed]
- Sharma, A.K.; Jha, R.; Gupta, B.D. Fiber-Optic Sensors Based on Surface Plasmon Resonance: A Comprehensive Review. IEEE Sens. J. 2007, 7, 1118–1129. [Google Scholar] [CrossRef]
- Gupta, B.D.; Srivastava, S.K.; Verma, R. Fiber Optic Sensors Based on Plasmonics; World Scientific Publishing Company: Singapore, 2015. [Google Scholar]
- Zhao, Y.; Tong, R.; Xia, F.; Peng, Y. Current status of optical fiber biosensor based on surface plasmon resonance. Biosens. Bioelec. 2019, 142, 111505. [Google Scholar] [CrossRef] [PubMed]
- Qi, M.; Zhang, N.M.Y.; Li, K.; Tjin, S.C.; Wei, L. Hybrid Plasmonic Fiber-Optic Sensors. Sensors 2020, 20, 3266. [Google Scholar] [CrossRef]
- Wang, Q.; Wang, L. Lab-on-fiber: Plasmonic nano-arrays for sensing. Nanoscale 2020, 12, 7485–7499. [Google Scholar] [CrossRef]
- Gahlaut, S.K.; Anisha Pathak, A.; Gupta, B.D.; Singh, J.P. Portable fiber-optic SPR platform for the detection of NS1-antigen for dengue diagnosis. Biosens. Bioelec. 2022, 196, 113720. [Google Scholar] [CrossRef]
- Shrivastav, A.M.; Usha, S.P.; Gupta, B.D. A localized and propagating SPR, and molecular imprinting based fiber-optic ascorbic acid sensor using an in situ polymerized polyaniline—Ag nanocomposite. Nanotechnology 2016, 27, 345501. [Google Scholar] [CrossRef]
- Pathak, A.; Gupta, B.D. Ultra-selective fiber optic SPR platform for the sensing of dopamine in synthetic cerebrospinal fluid incorporating permselective nafion membrane and surface imprinted MWCNTs-PPy matrix. Biosens. Bioelect. 2019, 133, 205–214. [Google Scholar] [CrossRef] [PubMed]
- Sharma, S.; Gupta, B.D. Surface Plasmon resonance based highly selective fiber optic dopamine sensor fabricated using molecular imprinted GNP/SnO2 nanocomposite. J. Lightwave Technol. 2018, 36, 5956–5962. [Google Scholar] [CrossRef]
- Sharma, P.; Semwal, V.; Gupta, B.D. A highly sensitive and selective LSPR biosensor for the detection of glutamate realized on optical fiber substrate using gold nanoparticles. Phot. Nanostruct. Fund. Appl. 2019, 37, 100730. [Google Scholar] [CrossRef]
- Shrivastav, A.M.; Usha, S.P.; Gupta, B.D. Highly sensitive and selective erythromycin nanosensor employing fiber optic SPR/ERY imprinted nanostructure: Application in milk and honey. Biosens. Bioelect. 2017, 90, 516–524. [Google Scholar] [CrossRef] [PubMed]
- Sharma, S.; Gupta, B.D. An efficient and selective sensing of creatinine based on fiber optic SPR technique exploiting the advantages of molecular imprinting technique. Int. Soc. Opt. Photonics 2018, 10680, 106801T. [Google Scholar]
- Pathak, A.; Mishra, S.K.; Gupta, B.D. Fiber optic ammonia sensor using Ag/SnO2 thin films: Optimization of thickness of SnO2 film using electric field distribution and reaction factor. Appl. Opt. 2015, 54, 8712–8721. [Google Scholar] [CrossRef]
- Mishra, S.K.; Tripathi, S.N.; Choudhary, V.; Gupta, B.D. SPR based fiber optic ammonia gas sensor utilizing nanocomposite film of PMMA/reduced grapheme oxide prepared by in situ polymerization. Sens. Actuators B Chem. 2014, 199, 190–200. [Google Scholar] [CrossRef]
- Mishra, S.K.; Rani, S.; Gupta, B.D. Surface plasmon resonance based fiber optic hydrogen sulphide gas sensor utilizing nickel oxide doped ITO thin film. Sens. Actuators B Chem. 2014, 195, 215–222. [Google Scholar] [CrossRef]
- Kirsch, J.; Siltanen, C.; Zhou, Q.; Revzin, A.; Simonian, A. Biosensor technology: Recent advances in threat agent detection and medicine. Chem. Soc. Rev. 2013, 42, 8733–8768. [Google Scholar] [CrossRef]
- Ellington, A.D.; Szostak, J.W. In vitro selection of RNA molecules that bind specific ligands. Nature 1990, 346, 818–822. [Google Scholar] [CrossRef]
- Liu, X.; Cheng, Z.; Fan, H.; Ai, S.; Han, R. Electrochemical detection of avian influenza virus H5N1 gene sequence using a DNA aptamer immobilized onto a hybrid nanomaterial-modified electrode. Electrochim. Acta 2011, 56, 6266–6270. [Google Scholar] [CrossRef]
- Gupta, B.D.; Shrivastav, A.M.; Usha, S.P. Optical Sensors for Biomedical Diagnostics and Environmental Monitoring; CRC Press: Boca Raton, FL, USA, 2017. [Google Scholar]
- Rocchitta, G.; Spanu, A.; Babudieri, S.; Latte, G.; Madeddu, G.; Galleri, G.; Nuvoli, S.; Bagella, P.; Demartis, M.I.; Fiore, V.; et al. Enzyme biosensors for biomedical applications: Strategies for safeguarding analytical performances in biological fluids. Sensors 2016, 16, 780. [Google Scholar] [CrossRef] [PubMed] [Green Version]
- Semwal, V.; Shrivastav, A.M.; Verma, R.; Gupta, B.D. Surface plasmon resonance-based fiber optic ethanol sensor using layers of silver/silicon/hydrogel entrapped with ADH/NAD. Sens. Actuators B Chem. 2016, 230, 485–492. [Google Scholar] [CrossRef]
- Briones, M.; Casero, E.; Vázquez, L.; Pariente, F.; Lorenzo, E.; Petit-Domínguez, M.D. Diamond nanoparticles as a way to improve electron transfer in sol-gel L-lactate biosensing platforms. Anal. Chim. Acta 2016, 908, 141–149. [Google Scholar] [CrossRef] [PubMed]
- Eggins, B.R. Chemical Sensors and Biosensors; John Wiley & Sons: West Sussex, UK, 2002. [Google Scholar]
- Inda, M.E.; Mimee, M.; Lu, T.K. Cell-based biosensors for immunology, inflammation, and allergy. J. Allergy Clin. Immunol. 2019, 144, 645–647. [Google Scholar] [CrossRef] [Green Version]
- Zheng, S.; Kim, D.K.; Park, T.J.; Lee, S.J.; Lee, S.Y. Label-free optical diagnosis of hepatitis B virus with genetically engineered fusion proteins. Talanta 2010, 82, 803–809. [Google Scholar] [CrossRef]
- Altintas, Z.; Gittens, M.; Guerreiro, A.; Thompson, K.A.; Walker, J.; Piletsky, S.; Tothill, I.E. Detection of waterborne viruses using high affinity molecularly imprinted polymers. Anal. Chem. 2015, 87, 6801–6807. [Google Scholar] [CrossRef]
- Gupta, B.D.; Shrivastav, A.M.; Usha, S.P. Surface plasmon resonance-based fiber optic sensors utilizing molecular imprinting. Sensors 2016, 16, 1381. [Google Scholar] [CrossRef] [Green Version]
- Usha, S.P.; Shrivastav, A.M.; Gupta, B.D. FO-SPR based dextrose sensor using Ag/ZnO nanorods/GOx for insulinoma detection. Biosens. Bioelectron. 2016, 85, 986–995. [Google Scholar] [CrossRef]
- Joshy, G.; Simmons, D. Diabetes information systems: A rapidly emerging support for diabetes surveillance and care. Diabetes Technol. Ther. 2006, 8, 587–597. [Google Scholar] [CrossRef]
- Moreno-Bondi, M.C.; Wolfbeis, O.S.; Leiner, M.J.P.; Schaffar, B.P.H. Oxygen optrode for use in a fiber-optic glucose biosensor. Anal. Chem. 1990, 62, 2377–2380. [Google Scholar] [CrossRef] [PubMed]
- Saxl, T.; Khan, F.; Ferla, M.; Birch, D.; Pickup, J. A fluorescence lifetime-based fibre-optic glucose sensor using glucose/galactose-binding protein. Analyst 2011, 136, 968–972. [Google Scholar] [CrossRef] [Green Version]
- Singh, S.; Gupta, B.D. Fabrication and characterization of a surface plasmon resonance based fiber optic sensor using gel entrapment technique for the detection of low glucose concentration. Sens. Actuators B Chem. 2013, 177, 589–595. [Google Scholar] [CrossRef]
- Srivastava, S.K.; Arora, V.; Sapra, S.; Gupta, B.D. Localized surface plasmon resonance based fiber optic U-shaped biosensor for the detection of blood glucose. Plasmonics 2012, 7, 261–268. [Google Scholar] [CrossRef]
- Li, D.; Wu, J.; Wu, P.; Lin, Y.; Sun, Y.; Zhu, R.; Yang, J.; Xu, K. Affinity based glucose measurement using fiber optic surface plasmon resonance sensor with surface modification by borate polymer. Sens. Actuators B Chem. 2015, 213, 295–304. [Google Scholar] [CrossRef]
- Yu, S.; Ding, L.; Lin, H.; Wu, W.; Huang, J. A novel optical fiber glucose biosensor based on carbon quantum dots-glucose oxidase/cellulose acetate complex sensitive film. Biosens. Bioelectron. 2019, 146, 111760. [Google Scholar] [CrossRef]
- Heo, Y.J.; Shibata, H.; Okitsu, T.; Kawanishi, T.; Takeuchi, S. Long-term in vivo glucose monitoring using fluorescent hydrogel fibers. Proc. Natl. Acad. Sci. USA 2011, 108, 13399–13403. [Google Scholar] [CrossRef] [Green Version]
- Binu, S.; Pillai, V.P.M.; Pradeepkumar, V.; Padhy, B.B.; Joseph, C.S.; Chandrasedekaran, N. Fibre optic glucose sensor. Mat. Sci. Eng. 2009, 29, 183–186. [Google Scholar] [CrossRef]
- Verma, R.; Gupta, B.D. A novel approach for simultaneous sensing of urea and glucose by SPR based optical fiber multianalyte sensor. Analyst 2014, 139, 1449–1455. [Google Scholar] [CrossRef]
- Müller, A.J.; Knuth, M.; Nikolaus, K.S.; Krivánek, R.; Küster, F.; Hasslacher, C. First clinical evaluation of a new percutaneous optical fiber glucose sensor for continuous glucose monitoring in diabetes. J. Diabetes Sci. Technol. 2013, 7, 13–23. [Google Scholar] [CrossRef] [Green Version]
- Yuan, Y.; Yang, X.; Gong, D.; Liu, F.; Hu, W.; Cai, W.; Huang, J.; Yang, M. Investigation for terminal reflection optical fiber SPR glucose sensor and glucose sensitive membrane with immobilized GODs. Opt. Exp. 2017, 25, 3884–3898. [Google Scholar] [CrossRef] [PubMed]
- Chen, K.C.; Li, Y.L.; Wu, C.W.; Chiang, C.C. Glucose sensor using U-shaped optical fiber probe with gold nanoparticles and glucose oxidase. Sensors 2018, 18, 1217. [Google Scholar] [CrossRef] [PubMed] [Green Version]
- Lin, Y.C.; Chen, L.Y.; Chiu, F.C. Lossy Mode Resonance-Based Glucose Sensor with High-κ Dielectric Film. Crystals 2019, 9, 450. [Google Scholar] [CrossRef] [Green Version]
- Aliberti, A.; Ricciardi, A.; Giaquinto, M.; Micco, A.; Bobeico, E.; La Ferrara, V.; Ruvo, M.; Cutolo, A.; Cusano, A. Microgel assisted lab-on-fiber optrode. Sci. Rep. 2017, 7, 1–11. [Google Scholar] [CrossRef]
- Premanode, B.; Toumazou, C. A novel, low power biosensor for real time monitoring of creatinine and urea in peritoneal dialysis. Sens. Actuators B Chem. 2007, 120, 732–735. [Google Scholar] [CrossRef]
- Bhatia, P.; Gupta, B.D. Fabrication and characterization of a surface plasmon resonance based fiber optic urea sensor for biomedical applications. Sens. Actuators B Chem. 2012, 161, 434–438. [Google Scholar] [CrossRef]
- Gupta, S.; Tejavath, K.; Verma, R.K. Urea detection using bio-synthesized gold nanoparticles: An SPR/LSPR based sensing approach realized on optical fiber. Opt. Quntm. Electron. 2020, 52, 1–14. [Google Scholar]
- Kharat, H.J.; Datta, K.; Ghosh, P.; Shirsat, M.D. Development of an optical urea biosensor using polypyrrole-polyvinyl sulphonate film. Sens. Trans. 2009, 101, 112. [Google Scholar]
- Xie, X.; Suleiman, A.A.; Guilbault, G.G. Determination of urea in serum by fiber optic fluorescence biosensor. Talanta 1991, 38, 1197–1200. [Google Scholar] [CrossRef]
- Gao, D.; Yang, X.; Teng, P.; Luo, M.; Zhang, H.; Liu, Z.; Yang, J.; Li, Z.; Wen, X.; Yuan, L.; et al. In-fiber optofluidic online SERS detection of trace uremia toxin. Opt. Lett. 2021, 46, 1101–1104. [Google Scholar] [CrossRef]
- Luo, S.; Walt, D.R. Avidin-biotin coupling as a general method for preparing enzyme-based fiber-optic sensors. Anal. Chem. 1989, 61, 1069–1072. [Google Scholar] [CrossRef]
- Rhines, T.D.; Arnol, M.A. Fiber-optic biosensor for urea based on sensing of ammonia gas. Anal. Chim. Acta. 1989, 227, 387–396. [Google Scholar] [CrossRef]
- Zhu, G.; Cheng, L.; Qi, R.; Zhang, M.; Zhao, J.; Zhu, L.; Dong, M. A metal-organic zeolitic framework with immobilized urease for use in a tapered optical fiber urea biosensor. Microchim. Acta 2020, 187, 72. [Google Scholar] [CrossRef] [PubMed]
- Botewad, S.N.; Pahurkar, V.G.; Muley, G.G.; Gaikwad, D.K.; Bodkhe, G.A.; Shirsat, M.D.; Pawar, P.P. PANI-ZnO cladding-modified optical fiber biosensor for urea sensing based on evanescent wave absorption. Front. Mat. 2020, 7, 184. [Google Scholar] [CrossRef]
- Vaghela, C.; Kulkarni, M.; Aiyer, R.; Karve, M. LED-based portable optical biosensor for measurement of serum urea levels using urease immobilized agarose-guar gum composite film. IEEE Sens. J. 2018, 18, 7273–7280. [Google Scholar] [CrossRef]
- Verma, R.; Srivastava, S.K.; Gupta, B.D. Surface plasmon resonance based fiber optic sensor for the detection of low density lipoprotein. IEEE Sens. J. 2012, 12, 3460–3466. [Google Scholar] [CrossRef]
- Kumar, S.; Kaushik, B.K.; Singh, R.; Chen, N.K.; Yang, Q.S.; Zhang, X.; Wang, W.; Zhang, B. LSPR-based cholesterol biosensor using a tapered optical fiber structure. Biomed. Opt. Exp. 2019, 10, 2150–2160. [Google Scholar] [CrossRef]
- Semwal, V.; Gupta, B.D. LSPR-and SPR-based fiber-optic cholesterol sensor using immobilization of cholesterol oxidase over silver nanoparticles coated graphene oxide nanosheets. IEEE Sens. J. 2018, 18, 1039–1046. [Google Scholar] [CrossRef]
- Kumar, S.; Singh, R.; Kaushik, B.K.; Chen, N.K.; Yang, Q.S.; Zhang, X. LSPR-based cholesterol biosensor using hollow core fiber structure. IEEE Sens. J. 2019, 19, 7399–7406. [Google Scholar] [CrossRef]
- Marazuela, M.D.; Cuesta, B.; Moreno-Bondi, M.C.; Quejido, A. Free cholesterol fiber optic biosensor for serum samples with simplex optimization. Biosens. Bioelectron. 1997, 12, 233–240. [Google Scholar] [CrossRef]
- Trettnak, W.; Wolfbeis, O.S. Fiber optic cholesterol biosensor with an oxygen optrode as the transducer. Anal. Biochem. 1990, 184, 124–127. [Google Scholar] [CrossRef]
- Lu, Y.; Li, H.; Qian, X.; Zheng, W.; Sun, Y.; Shi, B.; Zhang, Y.N. Beta-cyclodextrin based reflective fiber-optic SPR sensor for highly-sensitive detection of cholesterol concentration. Opt. Fib. Technol. 2020, 56, 102187. [Google Scholar] [CrossRef]
- Yunianto, M.; Permata, A.N.; Eka, D.; Ariningrum, D.; Wahyuningsih, S.; Marzuki, A. Design of a fiber optic biosensor for cholesterol detection in human blood. IOP Conf. Ser. Mater. Sci. Eng. 2017, 176, 012014. [Google Scholar] [CrossRef]
- Shin, J.W.; Yoon, J.; Shin, M.; Choi, J.W. Electrochemical dopamine biosensor composed of silver encapsulated MoS2 hybrid nanoparticle. Biotechnol. Biopro. Engg. 2019, 24, 135–144. [Google Scholar] [CrossRef]
- Li, Y.; Lai, S.N.; Zheng, B. A microfluidic streaming potential analyzer for label-free DNA detection. Sens. Actuators B Chem. 2018, 259, 871–877. [Google Scholar] [CrossRef]
- Hu, W.; Huang, Y.; Chen, C.; Liu, Y.; Guo, T.; Guan, B.O. Highly sensitive detection of dopamine using a graphene functionalized plasmonic fiber-optic sensor with aptamer conformational amplification. Sens. Actuators B Chem. 2018, 264, 440–447. [Google Scholar] [CrossRef]
- Kim, M.H.; Yoon, H.; Choi, S.H.; Zhao, F.; Kim, J.; Song, K.D.; Lee, U. Miniaturized and wireless optical neurotransmitter sensor for real-time monitoring of dopamine in the brain. Sensors 2016, 16, 1894. [Google Scholar] [CrossRef] [Green Version]
- Volkan, M.; Stokes, D.L.; Vo-Dinh, T. Surface-enhanced Raman of dopamine and neurotransmitters using sol-gel substrates and polymer-coated fiber-optic probes. App. Spect. 2000, 54, 1842–1848. [Google Scholar] [CrossRef]
- Agrawal, N.; Zhang, B.; Saha, C.; Kumar, C.; Kaushik, B.K.; Kumar, S. Development of dopamine sensor using silver nanoparticles and PEG-functionalized tapered optical fiber structure. IEEE Trans. Biomed. Engg. 2019, 67, 1542–1547. [Google Scholar] [CrossRef]
- Raj, D.R.; Prasanth, S.; Vineeshkumar, T.V.; Sudarsanakumar, C. Surface plasmon resonance based fiber optic dopamine sensor using green synthesized silver nanoparticles. Sens. Actuators B Chem. 2019, 224, 600–606. [Google Scholar]
- Raj, D.R.; Prasanth, S.; Sudarsanakumar, C. Development of LSPR-based optical fiber dopamine sensor using L-tyrosine-capped silver nanoparticles and its nonlinear optical properties. Plasmonics 2017, 12, 1227–1234. [Google Scholar]
- Zhou, B.; Guo, J.; Yang, C.; Kong, L. Upconversion-luminescent hydrogel optical probe for in situ dopamine monitoring. Photon. Res. 2020, 8, 1800–1807. [Google Scholar] [CrossRef]
- Sun, J.; Jiang, S.; Xu, J.; Li, Z.; Li, C.; Jing, Y.; Zhao, X.; Pan, J.; Zhang, C.; Man, B. Sensitive and selective surface plasmon resonance sensor employing a gold-supported graphene composite film/D-shaped fiber for dopamine detection. J. Phy. D 2019, 52, 195402. [Google Scholar] [CrossRef]
- Zibaii, M.I.; Latifi, H.; Asadollahi, A.; Bayat, A.H.; Dargahi, L.; Haghparast, A. Label free fiber optic apta-biosensor for in-vitro detection of dopamine. J. Light. Technol. 2016, 34, 4516–4524. [Google Scholar] [CrossRef]
- Usha, S.P.; Shrivastav, A.M.; Gupta, B.D. A contemporary approach for design and characterization of fiber-optic-cortisol sensor tailoring LMR and ZnO/PPY molecularly imprinted film. Biosens. Bioelectron. 2017, 87, 178–186. [Google Scholar] [CrossRef]
- Leitão, C.; Pereira, S.O.; Alberto, N.; Lobry, M.; Loyez, M.; Costa, F.M.; Pinto, J.L.; Caucheteur, C.; Marques, C. Cortisol in-fiber ultrasensitive plasmonic immunosensing. IEEE Sens. J. 2020, 21, 3028–3034. [Google Scholar] [CrossRef]
- Pandey, A.K.; Sharma, A.K.; Marques, C. On the application of SiO2/SiC grating on Ag for high-performance fiber optic plasmonic sensing of cortisol concentration. Materials 2020, 13, 1623. [Google Scholar] [CrossRef] [PubMed] [Green Version]
- Leitão, C.; Leal-Junior, A.; Almeida, A.R.; Pereira, S.O.; Costa, F.M.; Pinto, J.L.; Marques, C. Cortisol AuPd plasmonic unclad POF biosensor. Biotech. Rep. 2021, 29, e00587. [Google Scholar] [CrossRef]
- Cennamo, N.; Pasquardini, L.; Arcadio, F.; Vanzetti, L.E.; Bossi, A.M.; Zeni, L. D-shaped plastic optical fibre aptasensor for fast thrombin detection in nanomolar range. Sci. Rep. 2019, 9, 18740. [Google Scholar] [CrossRef]
- Cennamo, N.; Pesavento, M.; Lunelli, L.; Vanzetti, L.; Pederzolli, C.; Zeni, L.; Pasquardini, L. An easy way to realize SPR aptasensor: A multimode plastic optical fiber platform for cancer biomarkers detection. Talanta 2015, 140, 88–95. [Google Scholar] [CrossRef]
- Mokhtarzadeh, A.; Eivazzadeh-keihan, R.; Pashazadeh, P. Nanomaterial-based biosensors for detection of pathogenic virus. Trends Anal. Chem. 2017, 97, 445–457. [Google Scholar] [CrossRef]
- Shrivastav, A.M.; Cvelbar, U.; Abdulhalim, I. A comprehensive review on plasmonic-based biosensors used in viral diagnostics. Comm. Bio. 2021, 4, 1–12. [Google Scholar] [CrossRef]
- Zhao, X.; Tsao, Y.C.; Lee, F.J.; Tsai, W.H.; Wang, C.H.; Chuang, T.L.; Wu, M.S.; Lin, C.W. Optical fiber sensor based on surface plasmon resonance for rapid detection of avian influenza virus subtype H6: Initial studies. J. Vir. Meth. 2016, 233, 15–22. [Google Scholar] [CrossRef] [PubMed]
- Camara, A.R.; Gouvêa, P.M.; Dias, A.C.M.; Braga, A.M.; Dutra, R.F.; de Araujo, R.E.; Carvalho, I.C. Dengue immunoassay with an LSPR fiber optic sensor. Opt. Exp. 2013, 21, 27023–27031. [Google Scholar] [CrossRef]
- Atias, D.; Liebes, Y.; Chalifa-Caspi, V.; Bremand, L.; Lobel, L.; Marks, R.S.; Dussart, P. Chemiluminescent optical fiber immunosensor for the detection of IgM antibody to dengue virus in humans. Sens. Actuators B Chem. 2009, 140, 206–215. [Google Scholar] [CrossRef]
- Chang, Y.F.; Wang, S.F.; Huang, J.C.; Su, L.C.; Yao, L.; Li, Y.C.; Wu, S.C.; Chen, Y.M.A.; Hsieh, J.P.; Chou, C. Detection of swine-origin influenza A (H1N1) viruses using a localized surface plasmon coupled fluorescence fiber-optic biosensor. Biosens. Bioelectron. 2010, 26, 1068–1073. [Google Scholar] [CrossRef] [PubMed]
- Cennamo, N.; Pasquardini, L.; Arcadio, F.; Lunelli, L.; Vanzetti, L.; Carafa, V.; Altucci, L.; Zeni, L. SARS-CoV-2 spike protein detection through a plasmonic D-shaped plastic optical fiber aptasensor. Talanta 2021, 233, 122532. [Google Scholar] [CrossRef]
- Cennamo, N.; D’Agostino, G.; Perri, C.; Arcadio, F.; Chiaretti, G.; Parisio, E.M.; Camarlinghi, G.; Vettori, C.; Di Marzo, F.; Cennamo, R.; et al. Proof of concept for a quick and highly sensitive on-site detection of sars-cov-2 by plasmonic optical fibers and molecularly imprinted polymers. Sensors 2021, 21, 1681. [Google Scholar] [CrossRef]
- Lin, H.Y.; Huang, C.H.; Lu, S.H.; Kuo, I.T.; Chau, L.K. Direct detection of orchid viruses using nanorod-based fiber optic particle plasmon resonance immunosensor. Biosens. Bioelectron. 2014, 51, 371–378. [Google Scholar] [CrossRef]
- Murugan, D.; Bhatia, H.; Sai, V.V.R.; Satija, J. P-FAB: A fiber-optic biosensor device for rapid detection of COVID-19. Trans. Indian Natl. Acad. Eng. 2020, 5, 211–215. [Google Scholar] [CrossRef]
- Kamil, Y.M.; Bakar, M.H.A.; Yaacob, M.H.; Syahir, A.; Lim, H.N.; Mahdi, M.A. Dengue E protein detection using a graphene oxide integrated tapered optical fiber sensor. IEEE J. Sel. Top. Quantum Electron. 2018, 25, 1–8. [Google Scholar] [CrossRef]
- Rajil, N.; Sokolov, A.; Yi, Z.; Adams, G.; Agarwal, G.; Belousov, V.; Brick, R.; Chapin, K.; Cirillo, J.; Deckert, V.; et al. A fiber optic–nanophotonic approach to the detection of antibodies and viral particles of COVID-19. Nanophotonics 2021, 10, 235–246. [Google Scholar] [CrossRef]
- Herrmann, S.; Leshem, B.; Landes, S.; Rager-Zisman, B.; Marks, R.S. Chemiluminescent optical fiber immunosensor for the detection of anti-West Nile virus IgG. Talanta 2005, 66, 6–14. [Google Scholar] [CrossRef] [PubMed]
- Sobarzo, A.; Paweska, J.T.; Herrmann, S.; Amir, T.; Marks, R.S.; Lobel, L. Optical fiber immunosensor for the detection of IgG antibody to Rift Valley fever virus in humans. J. Virol. Methods 2007, 146, 327–334. [Google Scholar] [CrossRef] [PubMed]
Figure 1.
Illustration of (a) derivation of a mold from the cicada, and (b) application of mold to imprint the end face of an optical fiber. (c) Australian greengrocer cicada. SEM images of the (d) cicada wing nano-template, (e) inverse h-PDMS mold, (f) polymer replica on an optical fiber end face, (g) silver coated replica, and (h) macroscopic view of the imprinted optical fiber. The scale bar is 500 nm. Reprinted with permission from Ref. [47]. Copyright 2009 Elsevier.

Figure 2.
(a) Schematic of the (a) steps involved in the fabrication process, (b) customized chuck and holders for the spin coating, (c) overlay patterning, and (d) superstrate deposition. Metallo-dielectric crystals characterized by (e) different periods, and (f) holes diameters, directly realized on the fiber tip. Reprinted with permission from Ref. [10]. Copyright 2013 Elsevier.

Figure 3.
SEM images of the Ag-coated nanopillar arrays patterned on the fiber core (tilted view: 45°) using IL. Reprinted with permission from Ref. [52]. Copyright 2012 Optica Publishing Group.
Figure 3.
SEM images of the Ag-coated nanopillar arrays patterned on the fiber core (tilted view: 45°) using IL. Reprinted with permission from Ref. [52]. Copyright 2012 Optica Publishing Group.

Figure 4.
Schematic of fabrication process for ordered hybrid metallo-dielectric structures on fiber surface by a unique self-assembly technique known as breath figure method. Reprinted with permission from Ref. [57]. Copyright 2014 American Chemical Society.
Figure 4.
Schematic of fabrication process for ordered hybrid metallo-dielectric structures on fiber surface by a unique self-assembly technique known as breath figure method. Reprinted with permission from Ref. [57]. Copyright 2014 American Chemical Society.

Figure 5.
(a) Schematic of process used to fabricate fiber optic plasmonic sensor. A periodic holes array in an Au film is fabricated on a flat glass substrate using chemical methods. Subsequently, the holes array is lifted off from the substrate surface by immersing it in basic solution. The holes array film detaches from the substrate surface and starts floating on the water surface. The periodic holes array in an Au film can be picked up with an appropriately functionalized optical fiber tip. Photographs of the resulting fiber optic plasmonic sensors are shown on the right-hand side. (b) SEM images of a periodic hole array in a gold film on a fiber tip. Reprinted with permission from Ref. [36]. Copyright 2019 Elsevier.

Figure 6.
(a) Extrinsic FPI sensor formed by an external air cavity and (b) intrinsic FPI sensor formed by two reflecting components, R1 and R2, along a fiber. Reprinted from Ref. [60].
Figure 6.
(a) Extrinsic FPI sensor formed by an external air cavity and (b) intrinsic FPI sensor formed by two reflecting components, R1 and R2, along a fiber. Reprinted from Ref. [60].

Figure 7.
Schematic of an MZI. A beam is split into two arms, the reference and the sensing arms, and then recombined by using two fiber couplers. Reprinted from Ref. [60].
Figure 7.
Schematic of an MZI. A beam is split into two arms, the reference and the sensing arms, and then recombined by using two fiber couplers. Reprinted from Ref. [60].

Figure 8.
Schematic of the sensor based on Sagnac interferometer. Reprinted from Ref. [60].
Figure 8.
Schematic of the sensor based on Sagnac interferometer. Reprinted from Ref. [60].

Figure 9.
Basic configurations of fiber gratings. (a) Standard FBG which cannot be used as refractive index (RI) sensor. (b) Standard LPFG without any coating. (c) Tilted FBG. (d) Etched FBG. The arrows show the interaction of light coupled into the fiber with the outside medium. The plot on the right shows the transmission spectrum in the presence of a broadband source shown on the left. The red curves in these plots are the transmission spectra due to the increase in RI of outside medium.

Figure 10.
Biosensing with modified LMA-10 fiber. (A) Schematic of the optical setup: analytes are infiltrated from one end into the channels surrounding the fiber core. Light is coupled at the opposite end to the fiber core and the reflected light is collected from the same side. (B) Sequences of PNA, target DNA tract and oligonucleotide loaded on the AuNPs, and scheme of hybridization on the surface of the fiber channels: capture of streptavidin-coated AuNP bearing a biotinylated oligonucleotide tail on the captured genomic DNA. Reprinted with permission from Ref. [80]. Copyright 2015 Elsevier.

Figure 11.
(a) Schematic of set up of molecularly imprinted fluorescence based optical fiber sensor, and (b) fabrication of molecularly imprinted nanoparticles and PEGDA composite (MINs@PEGDA) probe. Reprinted with permission from Ref. [83]. Copyright 2021 Elsevier.
Figure 11.
(a) Schematic of set up of molecularly imprinted fluorescence based optical fiber sensor, and (b) fabrication of molecularly imprinted nanoparticles and PEGDA composite (MINs@PEGDA) probe. Reprinted with permission from Ref. [83]. Copyright 2021 Elsevier.

Figure 12.
(a) Fluorescence response of MINs@PEGDA sensor for different concentrations of ciprofloxacin solutions, and (b) linear relationship between fluorescence intensity at 468 nm and CIP concentration. Reprinted with permission from Ref. [83]. Copyright 2021 Elsevier.
Figure 12.
(a) Fluorescence response of MINs@PEGDA sensor for different concentrations of ciprofloxacin solutions, and (b) linear relationship between fluorescence intensity at 468 nm and CIP concentration. Reprinted with permission from Ref. [83]. Copyright 2021 Elsevier.

Figure 13.
Schematic of optical fiber-based fluorescence sensor for the detection of lung tumor and the emission spectra of the hydrogel-based pH sensor. Reprinted with permission from Ref. [84]. Copyright 2020 Elsevier.
Figure 13.
Schematic of optical fiber-based fluorescence sensor for the detection of lung tumor and the emission spectra of the hydrogel-based pH sensor. Reprinted with permission from Ref. [84]. Copyright 2020 Elsevier.

Figure 14.
Schematic of the fiber-based SERS probe in forward scattering mode. The fiber was coated by AgNRs array on the tip. BP: Bandpass and NF: Notch filter. Reprinted with permission from Ref. [89]. Copyright 2011 Elsevier.
Figure 14.
Schematic of the fiber-based SERS probe in forward scattering mode. The fiber was coated by AgNRs array on the tip. BP: Bandpass and NF: Notch filter. Reprinted with permission from Ref. [89]. Copyright 2011 Elsevier.

Figure 15.
Schematic of the experimental setup of the SERS optical fiber sensor based on back scattering mode. The optical fiber probe is immersed in the BFT solution. Reprinted from Ref. [93].
Figure 15.
Schematic of the experimental setup of the SERS optical fiber sensor based on back scattering mode. The optical fiber probe is immersed in the BFT solution. Reprinted from Ref. [93].

Figure 16.
Schematic of experimental set up of SERS sensor based on reflection mode. Reprinted with permission from Ref. [95]. Copyright 2021 Optica Publishing Group.
Figure 16.
Schematic of experimental set up of SERS sensor based on reflection mode. Reprinted with permission from Ref. [95]. Copyright 2021 Optica Publishing Group.

Figure 17.
Schematic of excitation of (a) bulk plasmons, (b) surface plasmons, and (c) localized surface plasmons. (d) Prism, and (e) optical fiber based Kretschmann configuration for surface plasmon resonance sensors.
Figure 17.
Schematic of excitation of (a) bulk plasmons, (b) surface plasmons, and (c) localized surface plasmons. (d) Prism, and (e) optical fiber based Kretschmann configuration for surface plasmon resonance sensors.

Figure 18.
(a) Fabrication steps of fiber optic SPR probe for NS1 antigen based dengue detection, and (b) schematic of experimental set-up. Reprinted with permission from Ref. [101]. Copyright 2022 Elsevier.
Figure 18.
(a) Fabrication steps of fiber optic SPR probe for NS1 antigen based dengue detection, and (b) schematic of experimental set-up. Reprinted with permission from Ref. [101]. Copyright 2022 Elsevier.

Figure 19.
(a) SPR spectra with increasing concentration of NS1 antigen for antibody concentration (a) 1:100 and (b) 1:10 used in the fabrication of sensing recognition layer. Corresponding (c) calibration, and (d) sensitivity curves. Reprinted with permission from Ref. [101]. Copyright 2022 Elsevier.

Figure 20.
Biosensors based on various recognition elements.

Figure 21.
(a) Experimental set-up, (b) characteristic response and (c) calibration curve for SPR based glucose sensor utilizing enzyme entrapment technique Reprinted with permission from Ref. [127]. Copyright 2013 Elsevier.
Figure 21.
(a) Experimental set-up, (b) characteristic response and (c) calibration curve for SPR based glucose sensor utilizing enzyme entrapment technique Reprinted with permission from Ref. [127]. Copyright 2013 Elsevier.

Figure 22.
(a) Experimental setup of the fiber optic urea sensor. (b) SPR spectra, and (c) variation of resonance wavelength for different concentrations of urea. Reprinted with permission from Ref. [140]. Copyright 2012 Elsevier.
Figure 22.
(a) Experimental setup of the fiber optic urea sensor. (b) SPR spectra, and (c) variation of resonance wavelength for different concentrations of urea. Reprinted with permission from Ref. [140]. Copyright 2012 Elsevier.

Figure 23.
(a) Schematic representation of experimental set-up along with designed probe, and (b) SPR response for different concentrations of urea and glucose in the samples. Reprinted with permission from Ref. [133]. Copyright 2014 Royal Society of Chemistry.
Figure 23.
(a) Schematic representation of experimental set-up along with designed probe, and (b) SPR response for different concentrations of urea and glucose in the samples. Reprinted with permission from Ref. [133]. Copyright 2014 Royal Society of Chemistry.

Figure 24.
Schematic of (a) SPR, and (b) SPR-LSPR coupled probe for cholesterol detection. Response curves for (c) SPR, and (d) SPR-LSPR probes. Reprinted with permission from Ref. [152]. Copyright 2018 IEEE.
Figure 24.
Schematic of (a) SPR, and (b) SPR-LSPR coupled probe for cholesterol detection. Response curves for (c) SPR, and (d) SPR-LSPR probes. Reprinted with permission from Ref. [152]. Copyright 2018 IEEE.

Figure 25.
(a) Sensing mechanism, and (b) SPR response of fiber optic DA sensor utilizing GNP@SnO2 nanocomposite as MIP host matrix. Reprinted with permission from Ref. [104]. Copyright 2018 IEEE.
Figure 25.
(a) Sensing mechanism, and (b) SPR response of fiber optic DA sensor utilizing GNP@SnO2 nanocomposite as MIP host matrix. Reprinted with permission from Ref. [104]. Copyright 2018 IEEE.

Figure 26.
Steps and chemical interactions involved in the preparation of nanocomposite for the fabrication of SPR based optical fiber DA sensor. Reprinted with permission from Ref. [103]. Copyright 2019 Elsevier.
Figure 26.
Steps and chemical interactions involved in the preparation of nanocomposite for the fabrication of SPR based optical fiber DA sensor. Reprinted with permission from Ref. [103]. Copyright 2019 Elsevier.

Figure 27.
Schematic of LMR based fiber optic cortisol sensor probe using ZnO-PPY matrix as MIP host polymer. Reprinted with permission from Ref. [169]. Copyright 2017 Elsevier.
Figure 27.
Schematic of LMR based fiber optic cortisol sensor probe using ZnO-PPY matrix as MIP host polymer. Reprinted with permission from Ref. [169]. Copyright 2017 Elsevier.


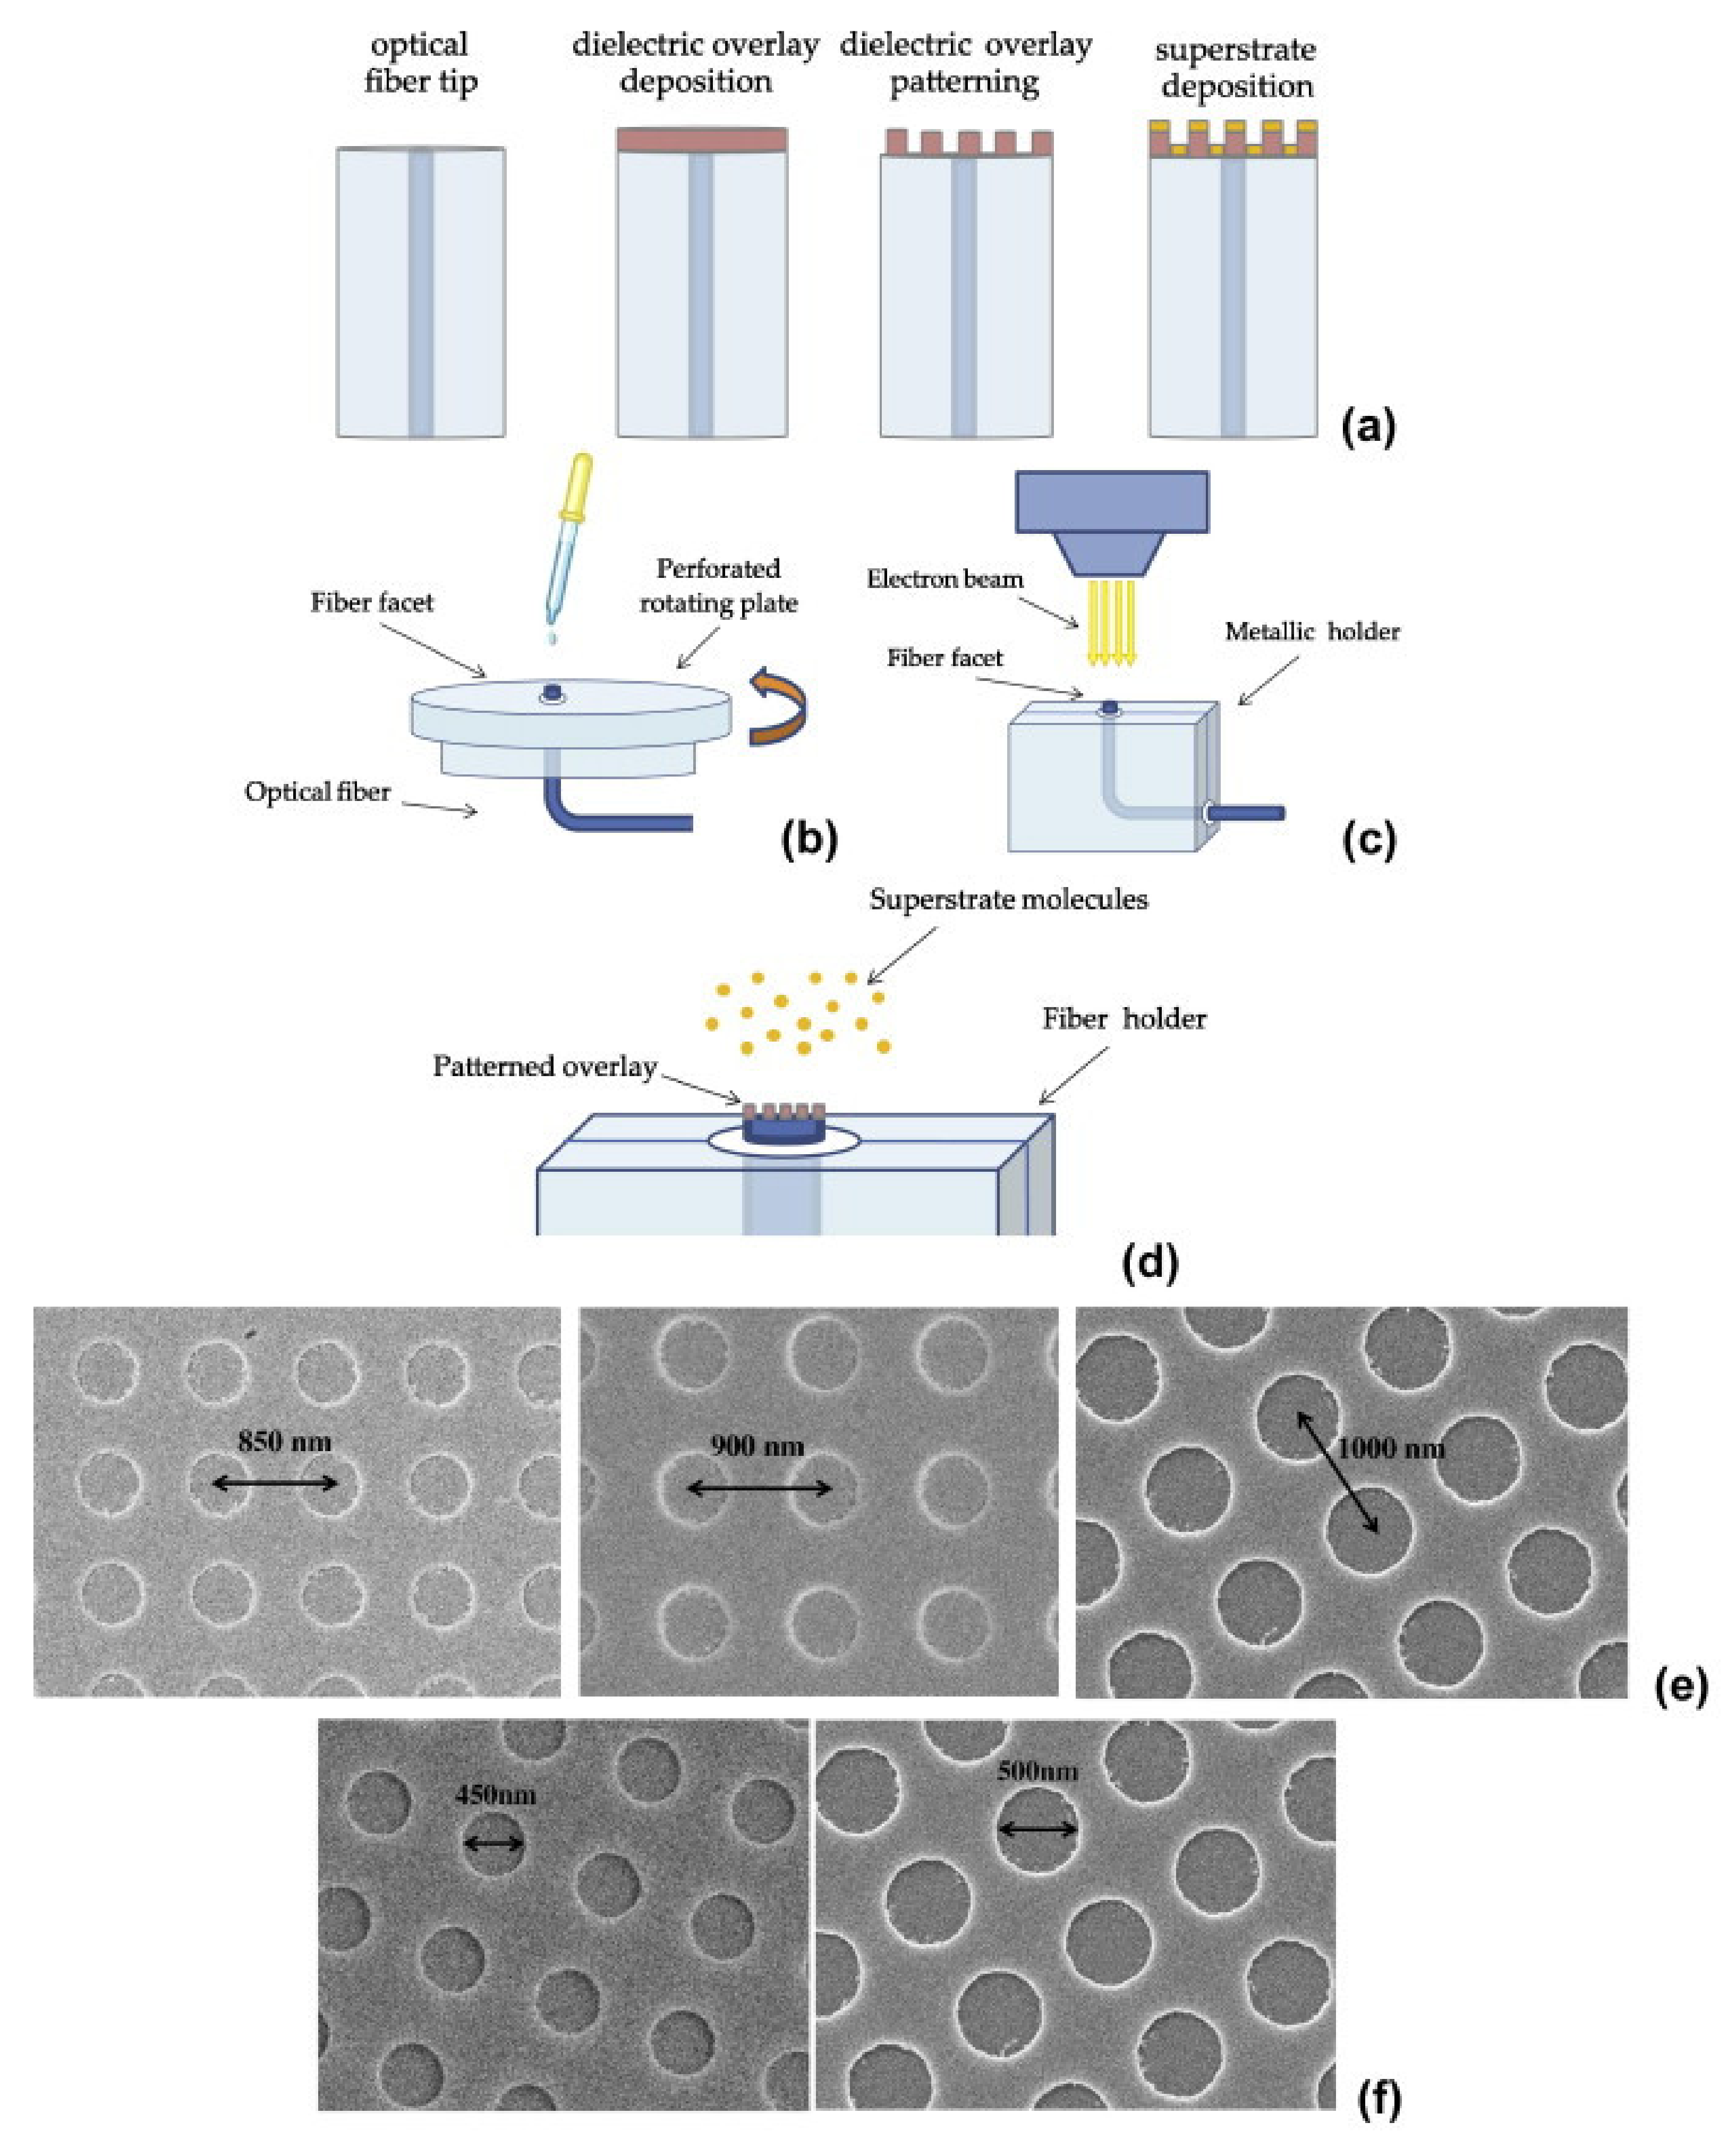
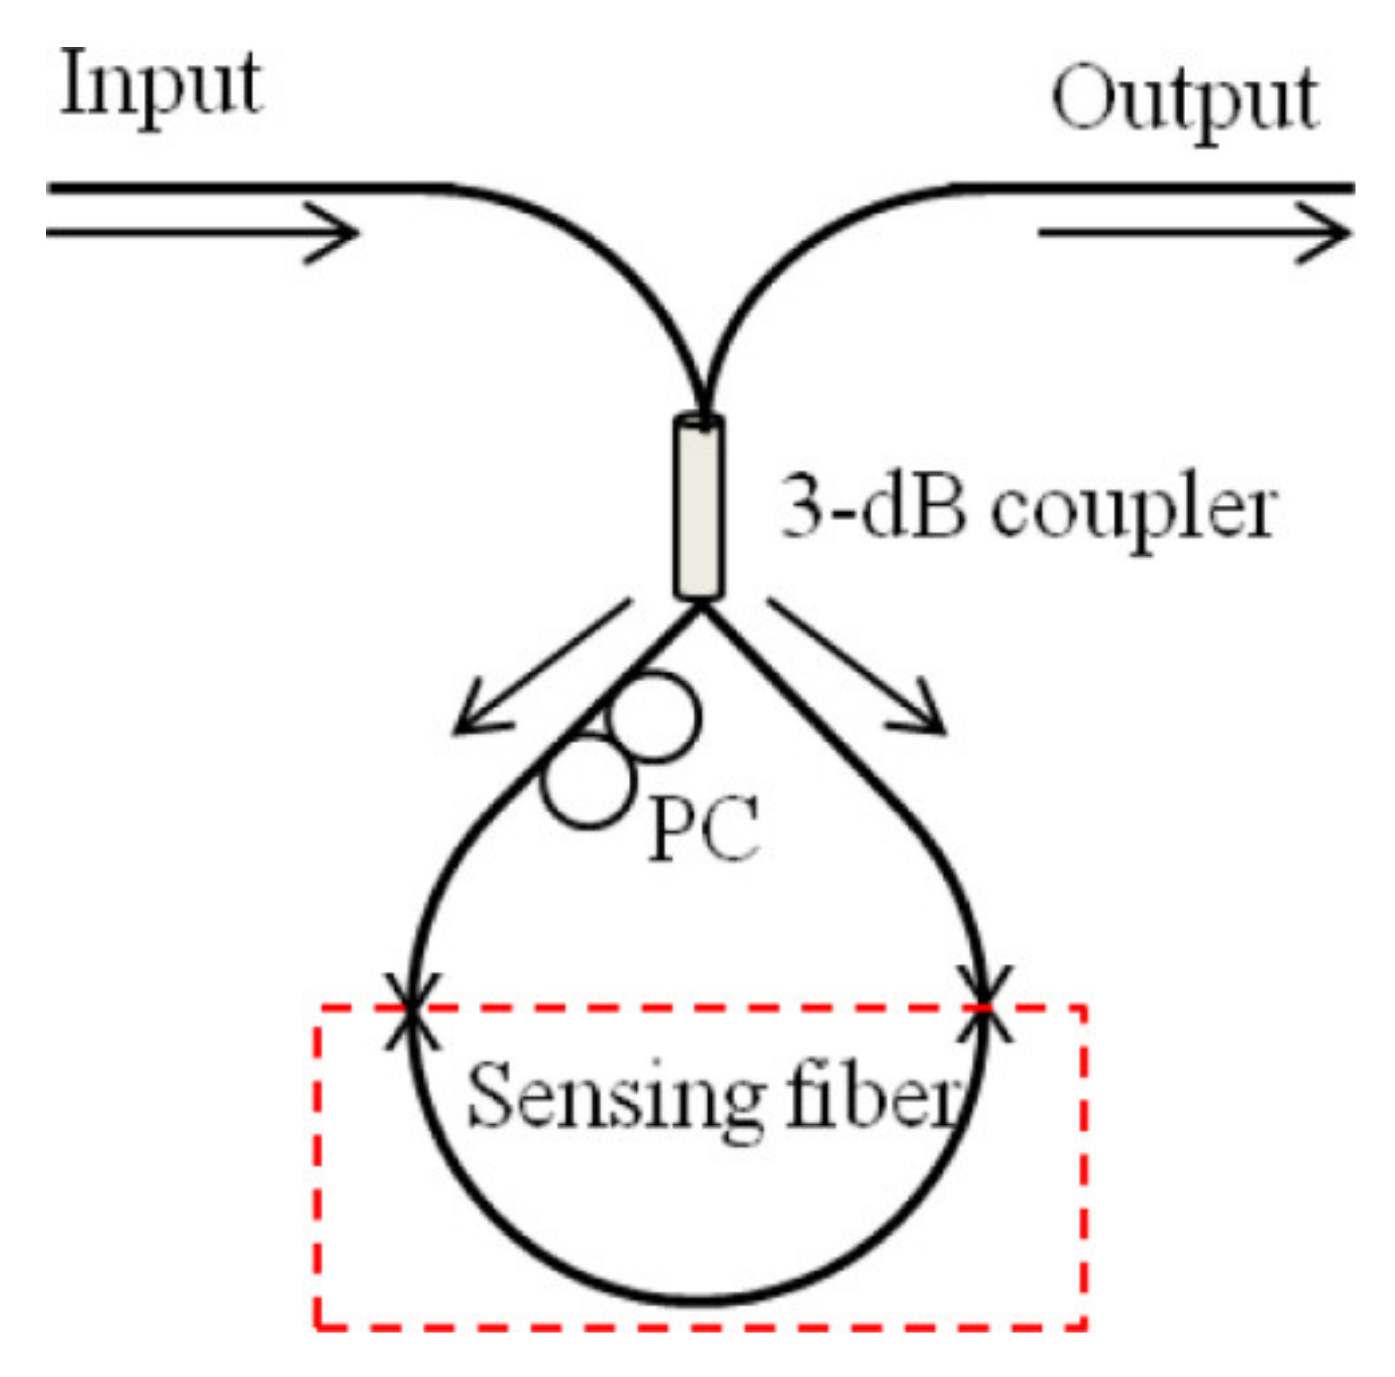
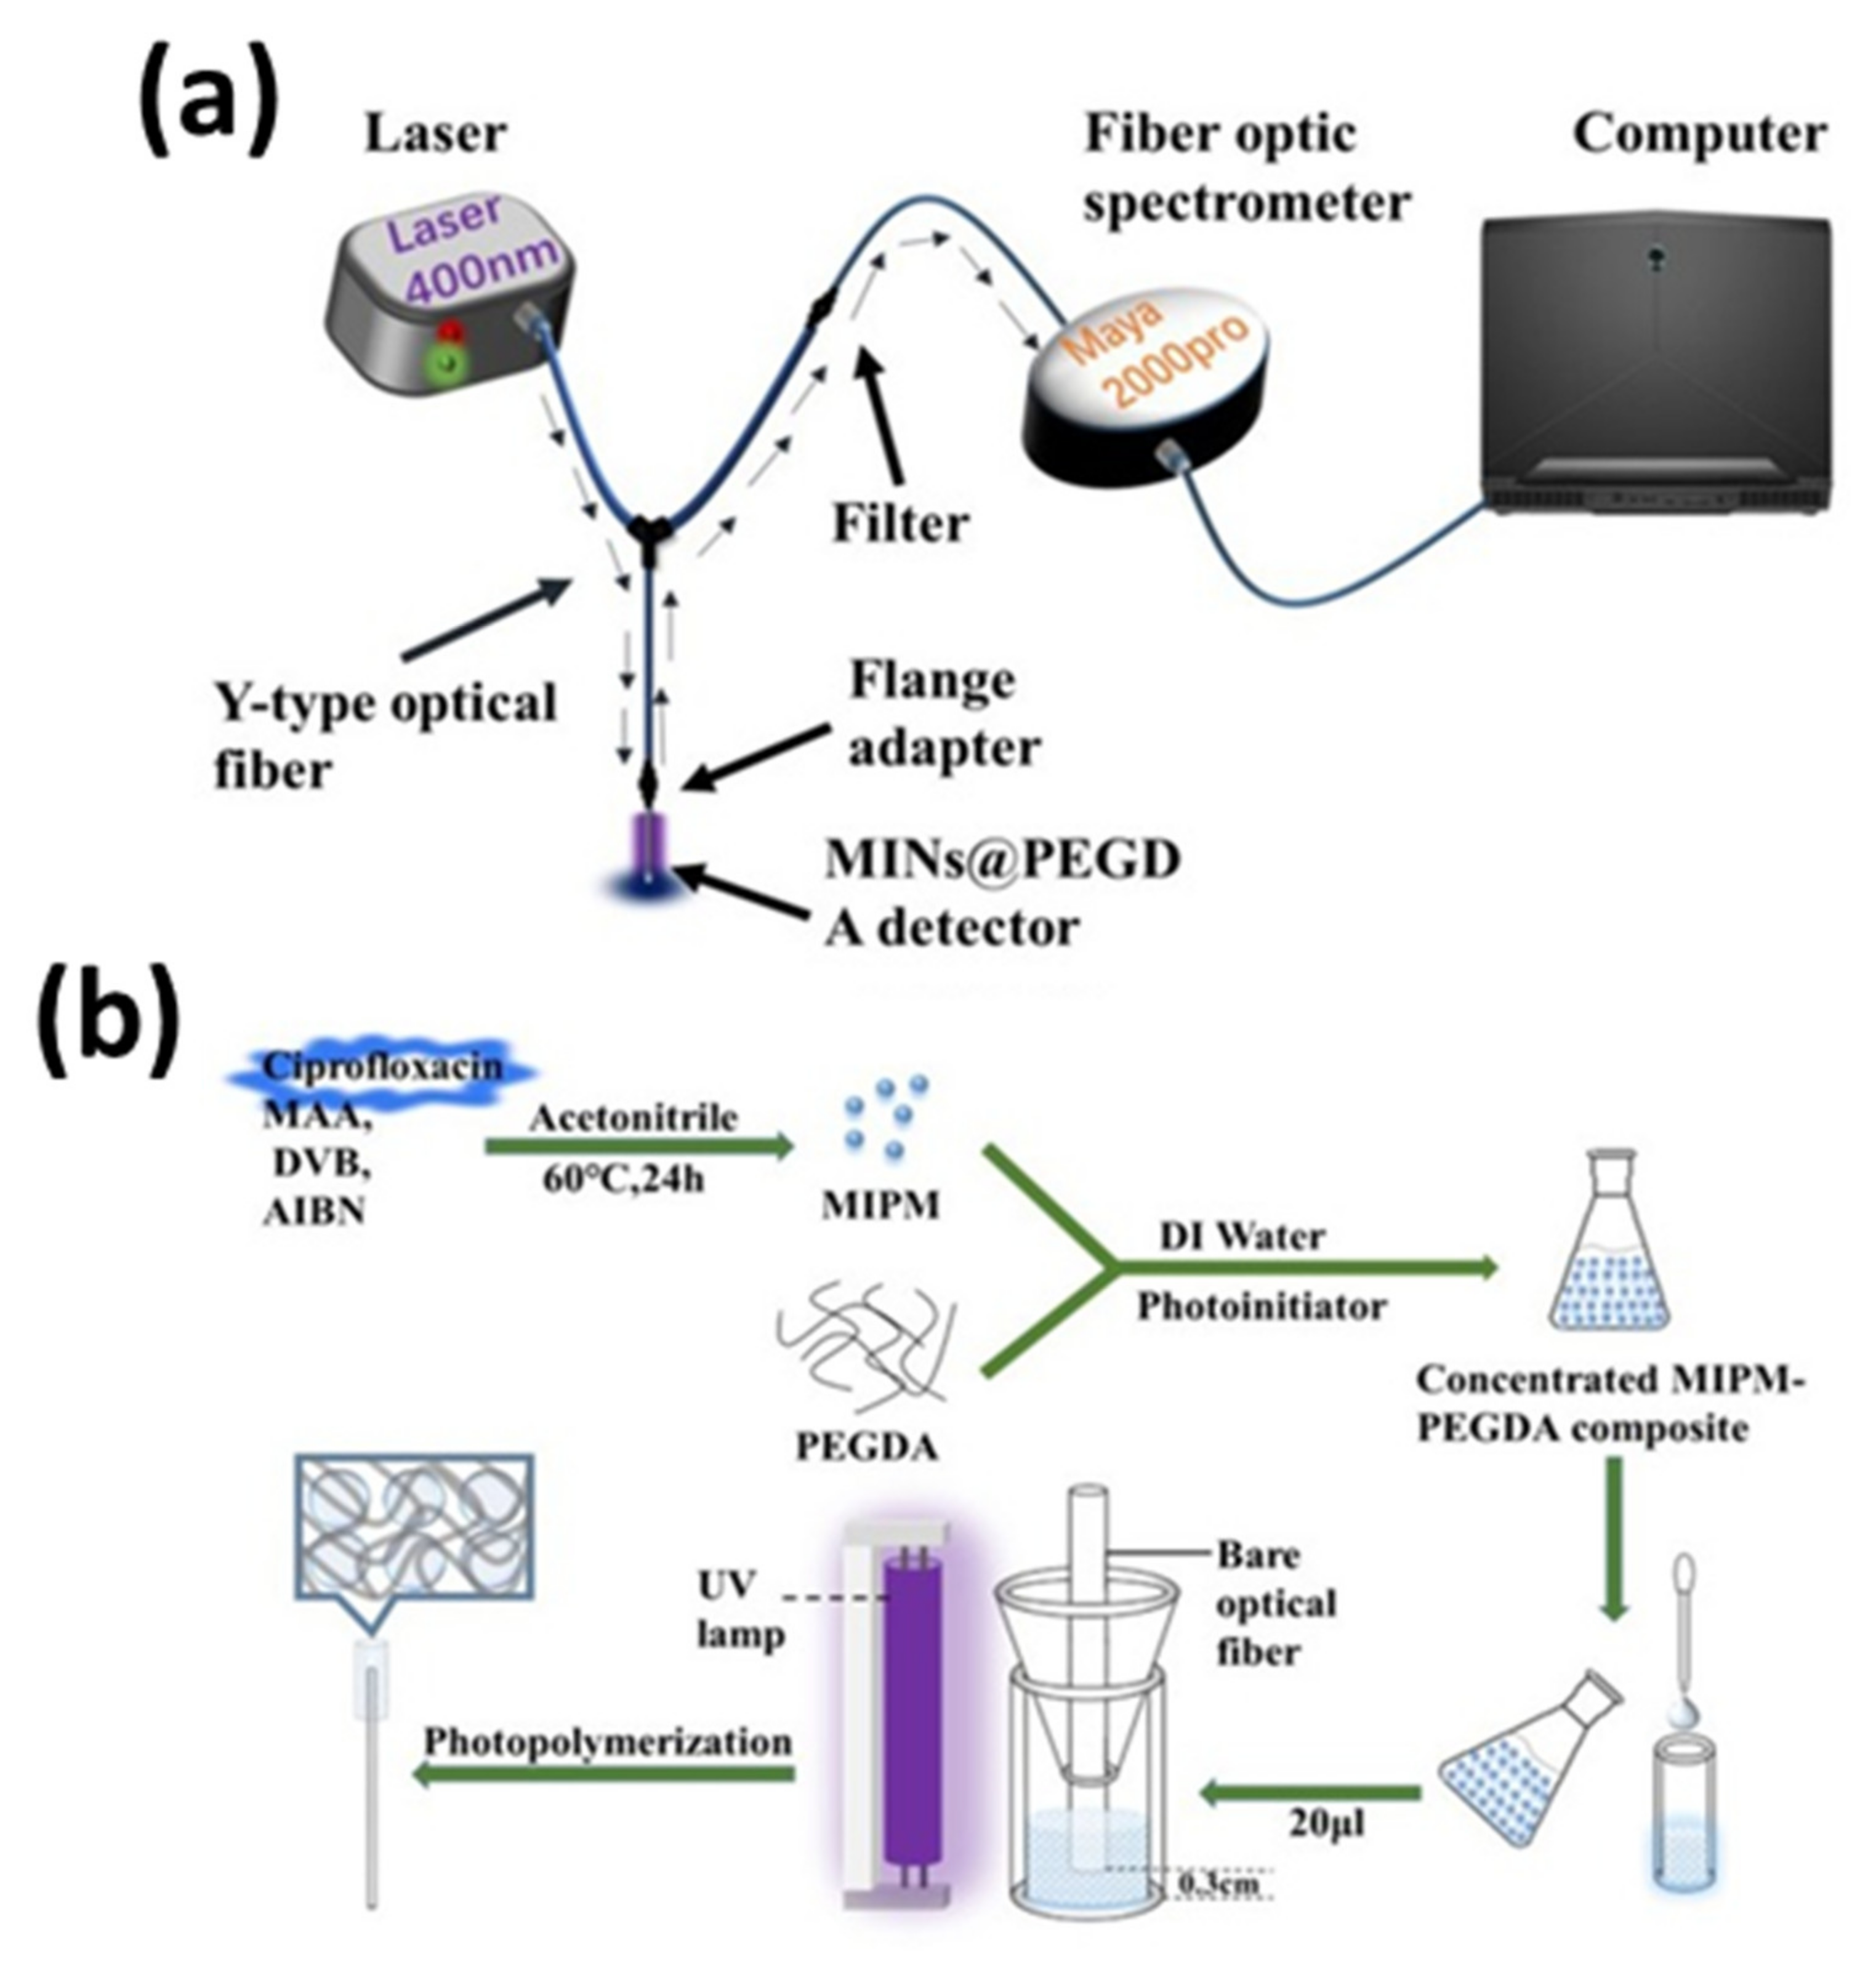
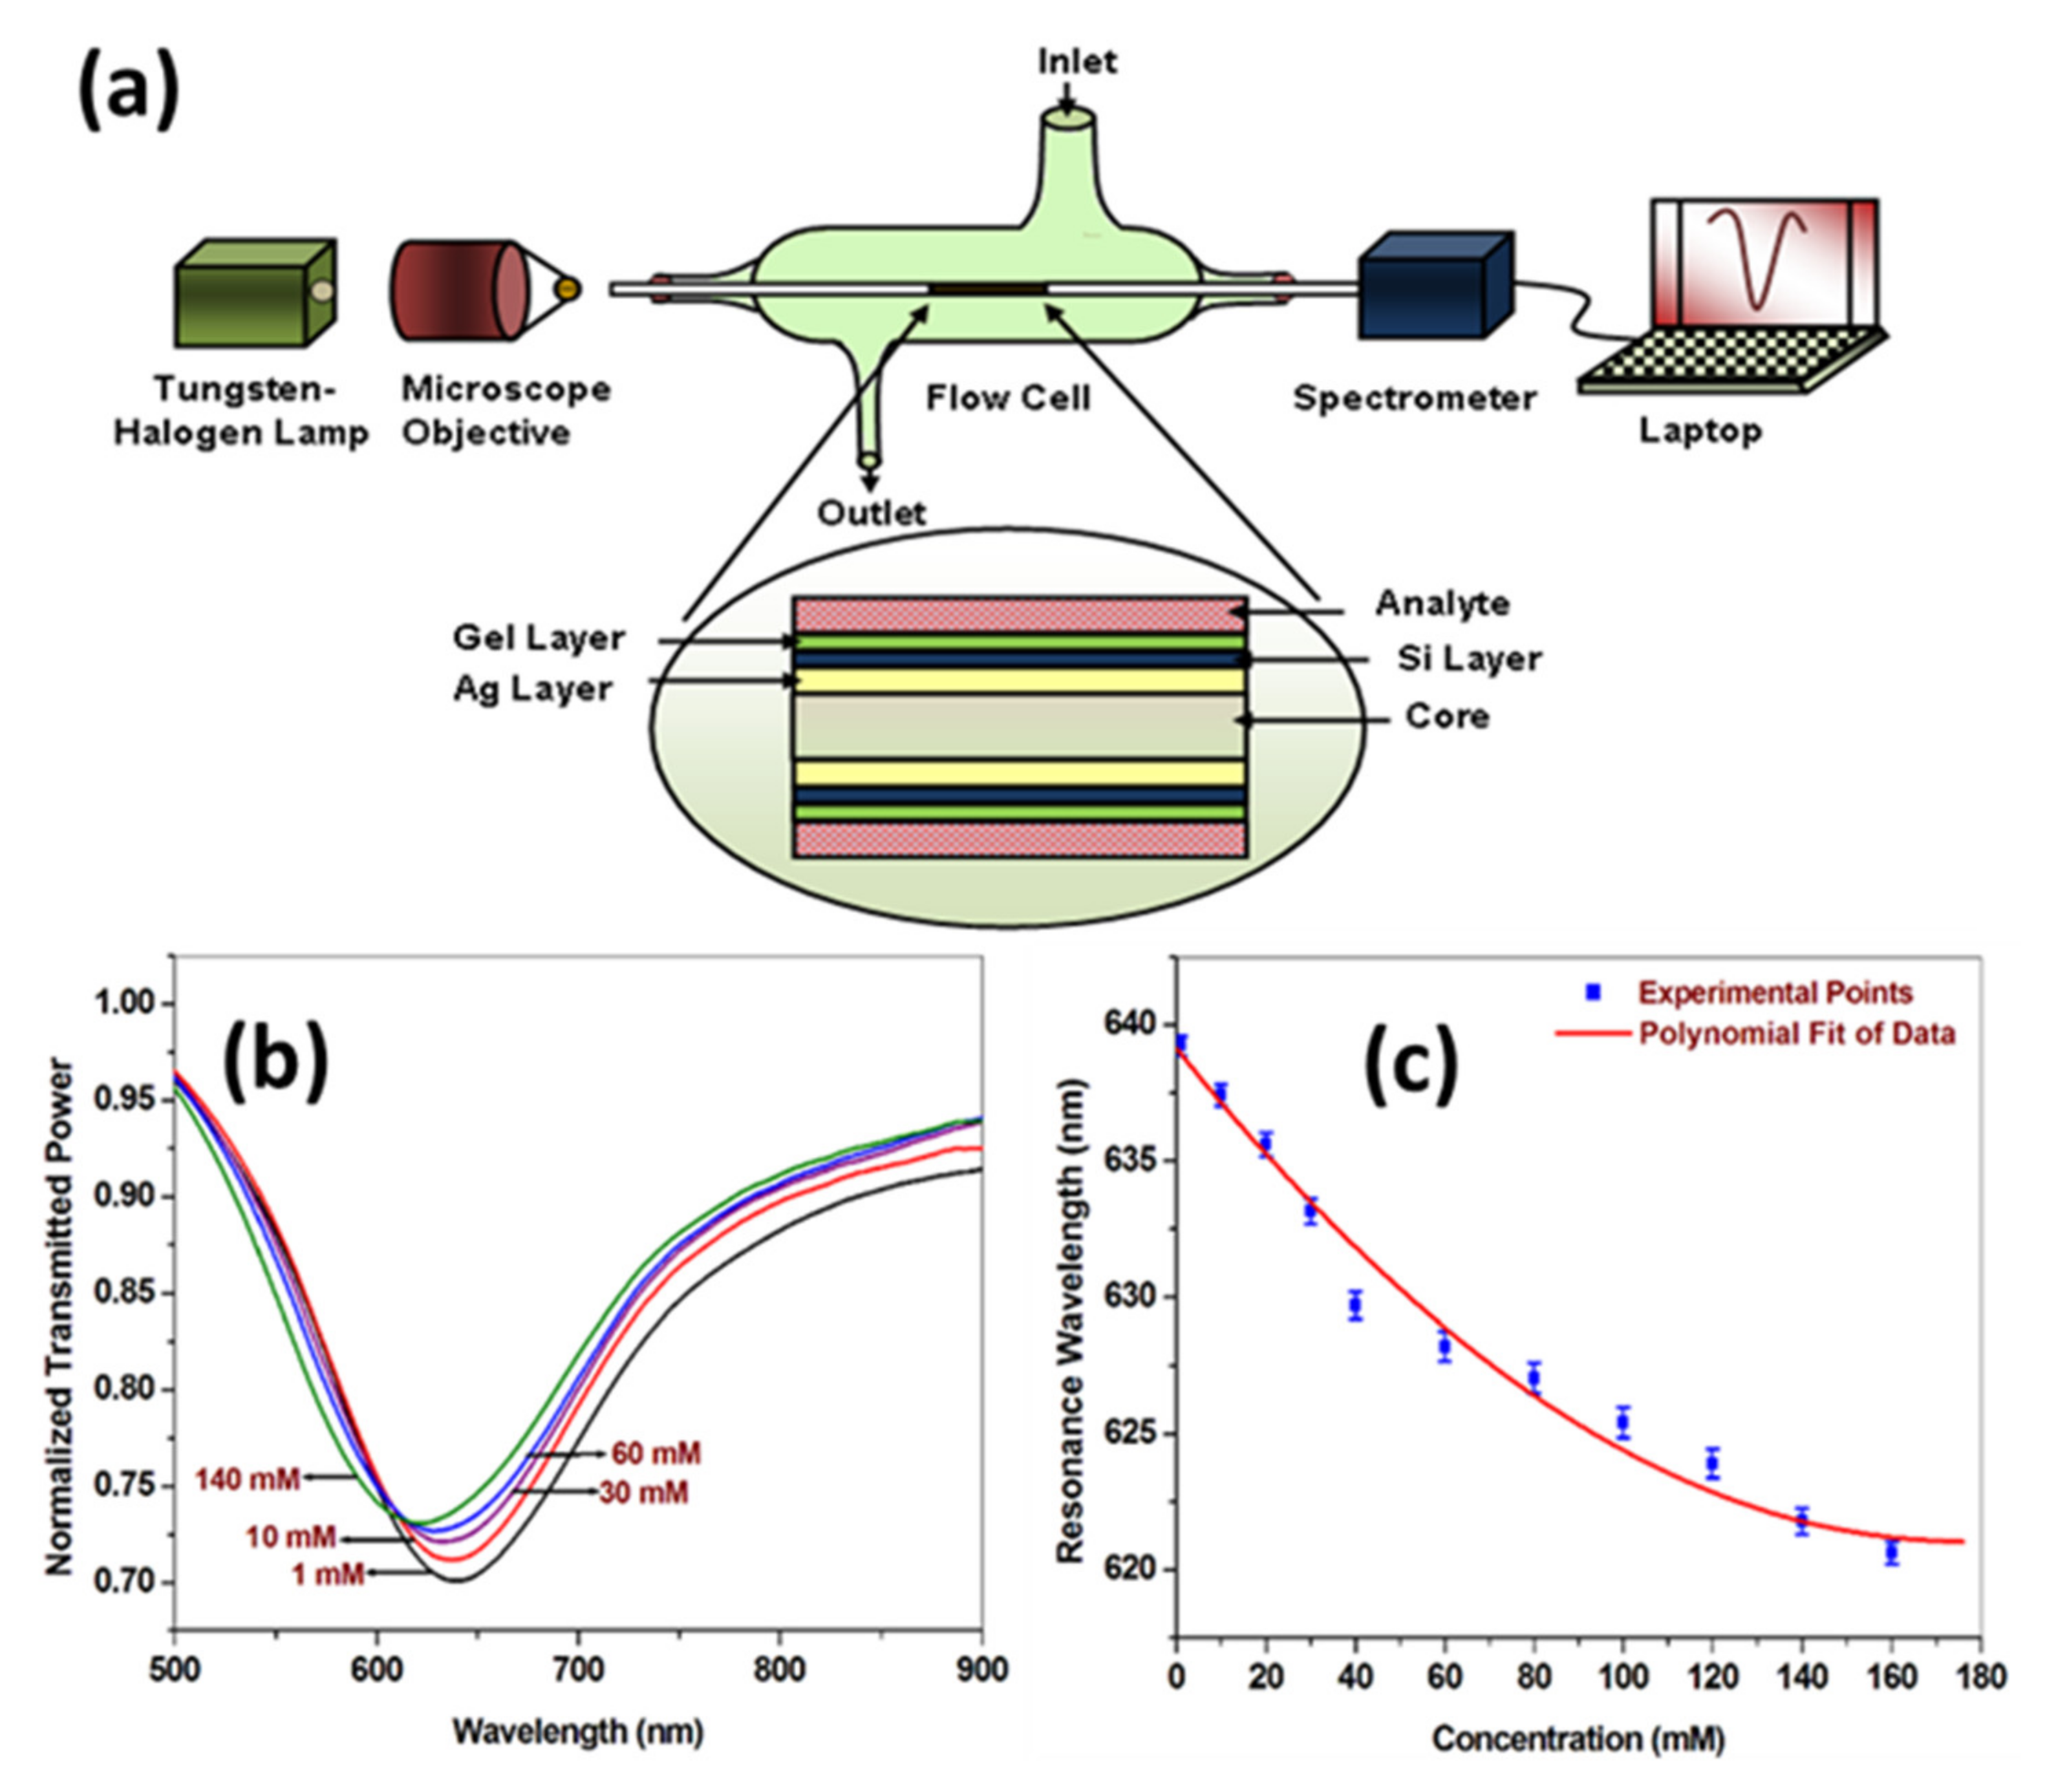
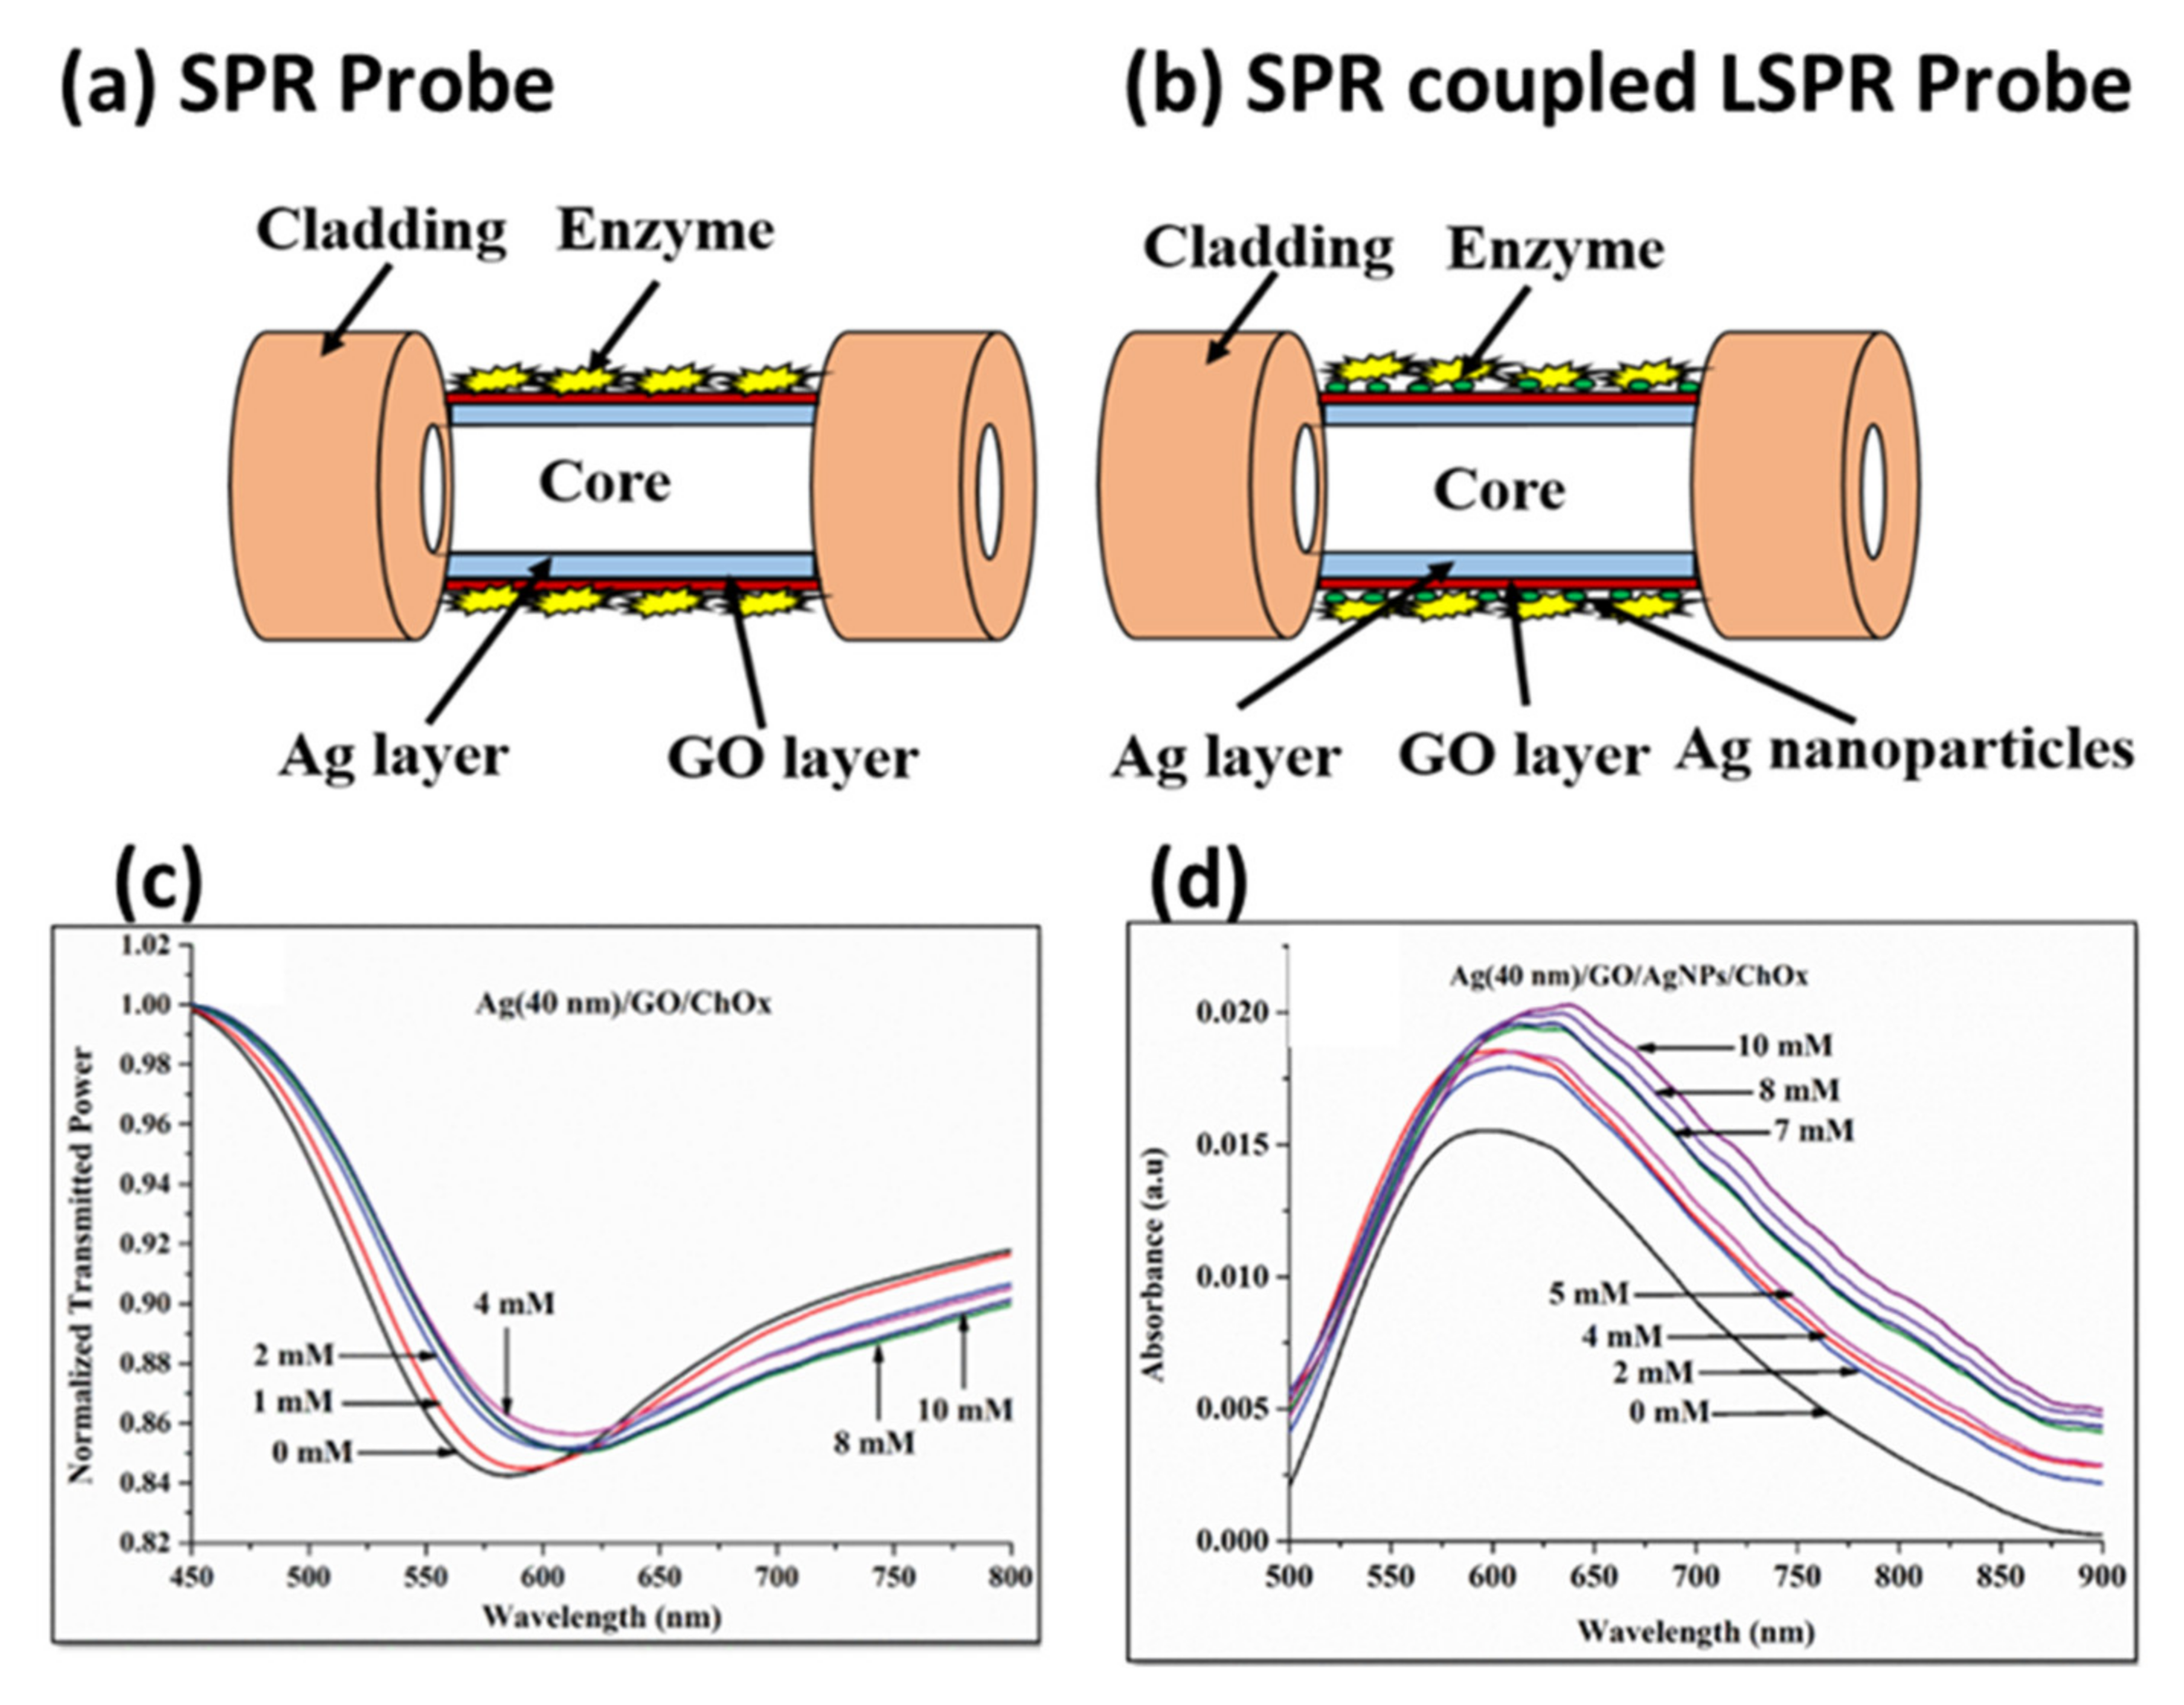
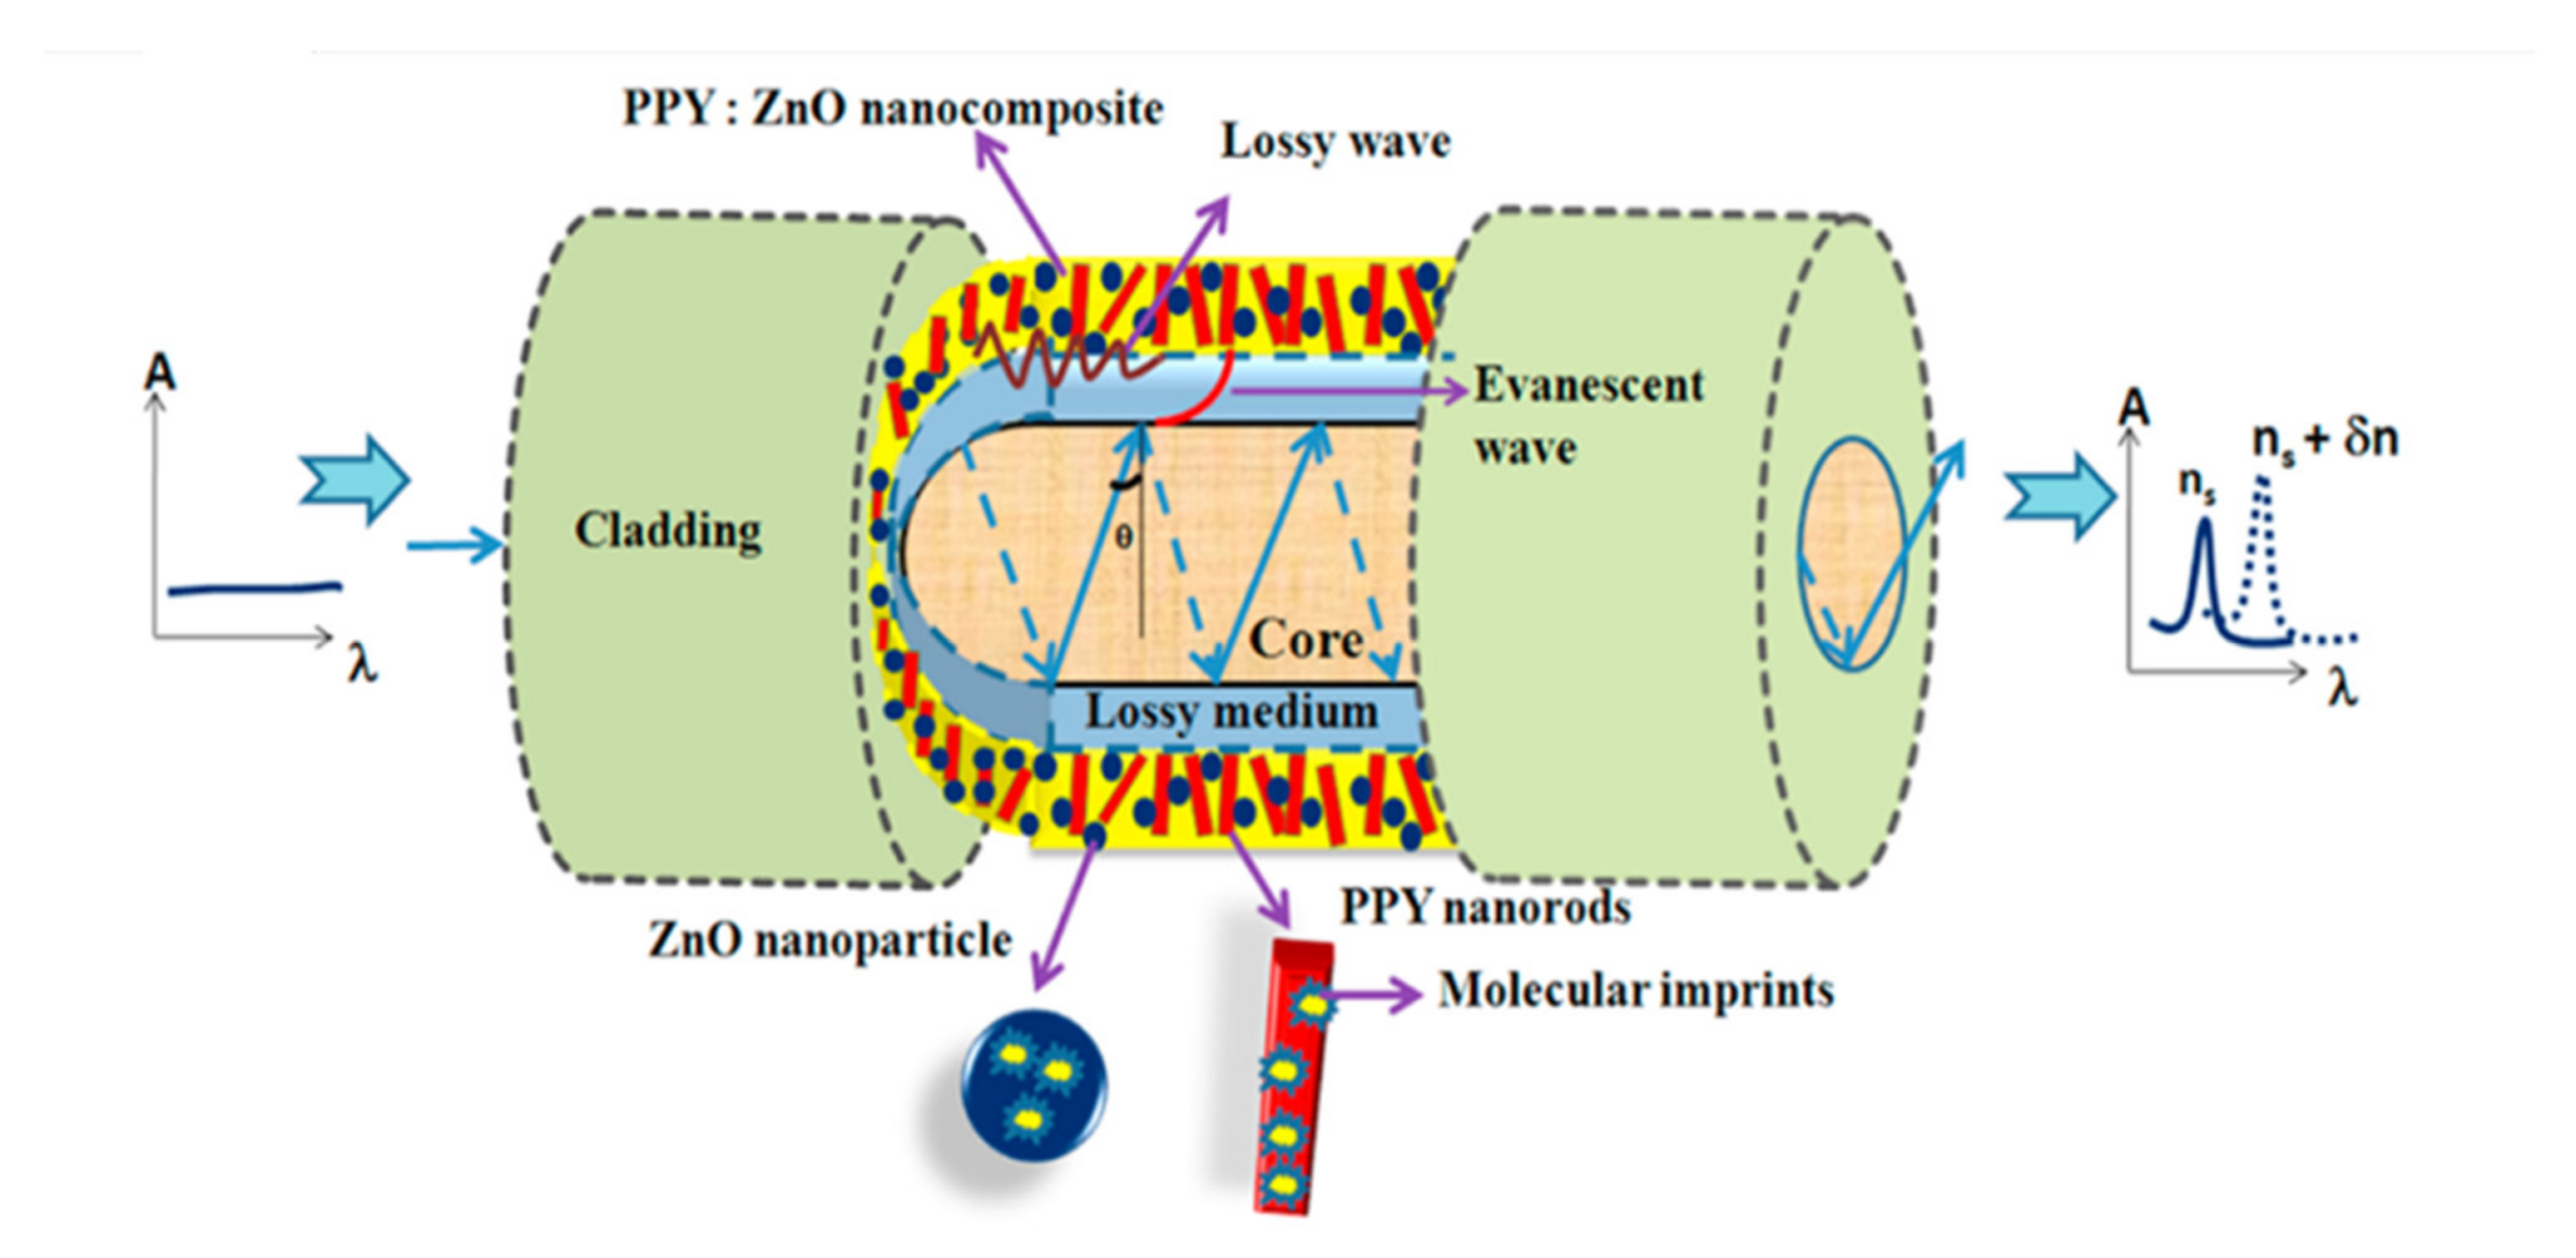
Table 1.
Optical fiber sensors reported for glucose detection.
| Substrate | Method | Technique | Conc. Range | LOD | Ref. | |
|---|---|---|---|---|---|---|
| Attachment Layer | Direct/Indirect Means | |||||
| Optical fibers | Polyster film/silicone matrix with suspended dyed kieselgel particles/Carb-on black surface | GOx: 320 units/mg 200 units/mg | Luminescence | 0–12 mM 0–24 mM | 0.06–1 mM | [125] |
| Polyster/silico-ne matrix with suspended dyed kieselgel particles/nylon membrane | Cross-linked with glutaraldehyde 320 units/mg & 200 units/mg | 0.1–1 mM | 0.3–5 mM | |||
| Optic fiber | Intensity of reflected light proportional to the displacement of probe was modulated | Intensity modulation | 0–25 wt % | _ | [132] | |
| Optical fiber | Ag/Si film | Gel entrapment for GOx | SPR | 0–260 mg/dL | _ | [127] |
| Optical fiber | Cr/Au/PDDA/PSS | PAA-ran-PAAPBA attachment on SAM layers | SPR | 1–10 mg/dL 10–300 mg/dL | 1 mg/dL | [129] |
| Optical fiber (U shaped) | Au nanospheres/SAM layer | GOx modified with sodium meta-periodate | LSPR | 0–250 mg/dL | [128] | |
| Core of optical fiber | Ni–NTA functionalized Polystyrene beads attached with Glucose/Galactose binding protein | Fluorescence life time based | 0–100 mM | - | [126] | |
| Optical fiber | Cu/SnO2/gel entrapment | GOx by gel entrapment | SPR | 0–260 mg/dL | - | [133] |
| Optical fiber | Ag/ZnO nanorods | GOx | SPR | 0–10 mM | 0.012 mM | [123] |
| Optical fiber | Dextran | glucose-binding lectin concanavalin A | fluorescence resonance energy transfer | 50–450 mg/dL | - | [134] |
| Optical fiber | Glucose sensitive membrane (GSM) prepared by GOx immobilized over SiO2 nanoparticles | SPR | 0–500 mg/dL | 0.142 mg/dL | [135] | |
| Optical fiber | Carbon quantum dots-glucose oxidase/cellulose acetate complex sensitive film | Fluorescence | 0–200 µM | 6.43 µM | [130] | |
| U-shaped optical fiber | Ag Nanoparticles | GOx | LSPR | 0.1–0.5 wt% aqueous sol. | 0.16 mg/dL | [136] |
| Polymer fiber | Fluorescence fiber using Glucose responsive monomer | Fluorescence | 0–500 mg/dL | [131] | ||
| Optical fiber | High index dielectric film (ITO) | LMR | 0–50 wt% aqueous sol. | [137] | ||
| Optical fiber | Tip coated with Au thin film | GOx encapsulated in hydrogel | SPR | 0–16 mM | Tunable LOD | [138] |
Table 2.
Comparison of fiber optic urea sensors reported in the literature.
| Substrate | Method | Technique | Conc. Range | LOD | Ref. | |
|---|---|---|---|---|---|---|
| Attachment Layer | Direct/Indirect Means | |||||
| Optical fiber | Ag/Si/gel layers entrapment | Urease by gel entrapment | SPR | 1–160 mM | [140] | |
| Optical fiber | Ag/Si/gel layers entrapment | Urease by gel entrapment | SPR | 0–180 mM | [133] | |
| Optical fiber | Biotin-avidin-biotin interaction | Urease | Fluorescence | 1 × 10⁻⁴–5 × 10⁻² M | 0.1 mM | [145] |
| Optical fiber | Ammonia gas permeable teflon membrane/BSA -glutaraldehyde cross linker | Urease | Fluorescence | 0–2.50 mM | [146] | |
| Optical fiber | Ammonia permeable membra./HPTS | Urease | Fluorescence | 1 × 10⁻⁴–5 × 10⁻³ M | [143] | |
| Tapered optical fiber | Embedding urease enzyme in zeolitic imidazolate framework | Interferometry | 1–10 mM | 0.1 mM | [147] | |
| Optical fiber | Urease enzyme embedded in PANI-ZnO composite | Evanescent absorption | 10 nM–1 M | 10 nM | [148] | |
| Optical fiber | Au film/Au NPs | Urease | SPR/LSPR | 50–800 mM | [141] | |
| PMMA multimode optical fiber | Polypyrrole doped polyvinyl sulfonate film over cladding | Urease | Evanescent absorption | 1–100 mM | 1–100 mM | [142] |
| Optical fiber | Urease Enzymatic thin film in Agarose-Gum media | Evanescent absorption | 0.025–1 mM | [149] | ||
| Hollow core fiber | Ag NPs embedded on the poly diallyl dimethyl ammonium chloride–modified graphene oxide sheet inside the fiber | SERS | 10−4 to 10−2 M | 10−4 M | [144] | |
Table 3.
Various fiber optic cholesterol sensors reported in literature.
| Substrate | Method | Technique | Conc. Range | LOD/LOQ | Ref. | |
|---|---|---|---|---|---|---|
| Transducing Layer | Recognition Unit | |||||
| Optical fiber | Silicone-entrapped tris(4,7-diphenyl-I,10-phenanthroline) ruthenium(II) complex | COx immobilized on graphite powder entrapped on a silicone film | Luminescence | 0–3 mM | [154] | |
| Optical fiber | PS/PF/I (Silicone-decacyclene)/T/N | COx covalently immobilized on nylon membrane | Fluorescence | 0–5 mM | 0.2 mM | [155] |
| Optical fiber | Au thin film | Immobilization of SAMs of 4-ATP and AAB | SPR | 0–190 mg/dL | [150] | |
| Tapered fiber | Au Nanoparticles | COx | LSPR | 0–10 mM | 53.1 nM | [151] |
| Optical fiber | Ag thin film/GO/Ag Nps | COx | LSPR coupled SPR | 0–10 mM | 1.131 mM | [152] |
| Hollow-Core fiber | Ag Nps functionalized over SMF-HCF tip | COx | LSPR coupled Fabry Perot interferometer | 0–10 mM | 25.5 nM | [153] |
| Optical fiber | Au thin film | Beta-cyclodextrin | SPR | 0–0.5 µM | [156] | |
| Plastic Optical fiber | Scratched prepared to obtain grating structure | Absorbance | 140–250 mg/dL | [157] | ||
Table 4.
A comparison of optical fiber Dopamine sensors reported in literature.
| Substrate | Method | Technique | Conc. Range | LOD | Ref. | |
|---|---|---|---|---|---|---|
| Transducing Layer | Sensing Layer | |||||
| Tapered Optical fiber | Ag NPs functionalized with polyethylene glycol (PEG) | Direct detection using Ascorbic acid | LSPR | 10–100 µM | 50 nM | [163] |
| Optical fiber | Synthesized Ag Nps from flower extract of Acmella oleracea/PVA | LSPR | 0–80 µM | 0.2 µM | [164] | |
| Optical fiber | L-Tyrosine capped Ag Nps | LSPR | 0–50 µM | [165] | ||
| Optical fiber | Ag thin film | permselective nafion membrane and surface imprinted MWCNTs-PPy matrix | SPR | 10−9–10−5 M | 18.9 pM | [103] |
| Tilted fiber Bragg grating | Au thin film with graphene monolayer | ssDNA aptamer providing confirmation transition | SPR | 10−14–10−8 M | 0.166 pM | [160] |
| Optical fiber | Ag thin film | Molecular imprinted GNP/SnO2 nanocomposite | SPR | 0–100 µM | 0.031 µM | [104] |
| Hydrogel Optical fiber | NaYF4:Yb (core) Tm@NaYF4 Up conversion Nanoparticles | Luminescence | 0–200 µM | 83.6 nM | [166] | |
| D-shaped Optical fiber | Au supported graphene oxide film | Dopamine binding aptamer | SPR | 100 pM–1 µM | [167] | |
| Optical fiber | CdSe/ZnS QD | Fluorescence | 0–228 µM | - | [161] | |
| Tapered Optical fiber | Dopamine specific DNA aptamer sequence | Mach-Zehnder Int. | 0–10 µM | 0.142 mg/dL | [168] | |
| Polymer coated optical fiber | Ag-ion capsulated sol-gel | SERS | 5 µM | [162] | ||
Table 5.
A comparison of optical fiber Cortisol sensors reported in literature.
| Substrate | Method | Technique | Conc. Range | LOD | Ref. | |
|---|---|---|---|---|---|---|
| Transducing Layer | Sensing Layer | |||||
| Optical fiber | ZnO thin film | Polypyrrole Molecular imprinted film | LMR | 0–10−6 g/mL | 25.9 fg/mL | [169] |
| Optical fiber | Ag/SiO2 Nano-gratings Ag/SiC Nano-gratings | SPR | 0.36–4.50 ng/mL | 22.6 fg/mL 68.17 fg/mL | [171] | |
| Tilted fiber Bragg Grating | Ag thin film | anti-cortisol antibody | SPR | 0–10 ng/mL | 0.018 ng/mL | [170] |
| Clad removed optical fiber | AuPd Alloy | anti-cortisol antibody passivated with BSA protein | SPR | 0.005–10 ng/mL | 1 pg/mL | [172] |
Table 6.
A comparison of various viral sensors using fiber optic platform.
| Virus Target | Method | Technique | Conc. Range | LOD | Ref. | |
|---|---|---|---|---|---|---|
| Transducing Layer | Sensing Layer | |||||
| Avian Influenza Virus H6 | 40 nm thick Au film | EB2-B3 monoclonal antibody | SPR | 0–105 CFU/mL | 5.14 × 10⁵ EID50/0.1 mL | [177] |
| Orchid Viruses: Cymbidium mosaic virus (CymMV) Odontoglossum ringspot virus | Au nanorods | anti-CymMV antibody anti-ORSV antibody | LSPR | 6.25 × 10⁻¹¹–6.4 × 10⁻⁸ g/mL 6.25 × 10⁻¹¹–6.4 × 10⁻⁸ g/mL | 48 pg/mL 42 pg/mL | [183] |
| Dengue NS1 antigen | Au Nanoparticles | anti-Dengue NS1 antibody | LSPR | 0–1 µg/mL | 0.074 µg/mL | [178] |
| SARS-CoV-2 particles | Capture antibody Au Nanoparticles/Capture antibody | Absorption LSPR | 106 particles/mL 106 particles/mL | [184] | ||
| DENV II E protein | Recombinant capture DENV II antibody | Absorption interferometry | 0.1–1 nM | 1 pM | [185] | |
| anti-Dengue IgM antibody | Goat anti-human IgM antibody (Human anti-DENV IgM/DENV antigen/Mouse anti-DENV/Goat anti-mouse IgG HRP conj as analyte) | Chemiluminescence | 10–107 dilution in saliva | [179] | ||
| SARS-CoV-2 Protein | Peptide probe hydrogel | Fluorescence | 1–10 nM | 1 pM | [186] | |
| anti-West Nile virus IgG | West Nile Virus antigen | Chemiluminescence | 10–106 dilution in saliva | [187] | ||
| Rift Valley fever virus IgG antibody | Rift Valley Virus antigen sandwich assay | Fluorescence | 10–105 dilution in saliva | [188] | ||
| Swine-origin Influenza A | Hemagglutinin (HA) protein | LSPR coupled fluorescence | 10–106 pg/mL | 8.25 × 10⁴ copies/mL | [180] | |
| SARS-CoV-2 spike protein | Specific Receptor binding domain aptamer over plasmonic gold film | SPR | 25–1000 nM | 37 nM | [181] | |
Publisher’s Note: MDPI stays neutral with regard to jurisdictional claims in published maps and institutional affiliations. |
© 2022 by the authors. Licensee MDPI, Basel, Switzerland. This article is an open access article distributed under the terms and conditions of the Creative Commons Attribution (CC BY) license (https://creativecommons.org/licenses/by/4.0/).
Share and Cite
MDPI and ACS Style
Gupta, B.D.; Pathak, A.; Shrivastav, A.M. Optical Biomedical Diagnostics Using Lab-on-Fiber Technology: A Review. Photonics 2022, 9, 86. https://doi.org/10.3390/photonics9020086
AMA Style
Gupta BD, Pathak A, Shrivastav AM. Optical Biomedical Diagnostics Using Lab-on-Fiber Technology: A Review. Photonics. 2022; 9(2):86. https://doi.org/10.3390/photonics9020086
Chicago/Turabian StyleGupta, Banshi D., Anisha Pathak, and Anand M. Shrivastav. 2022. "Optical Biomedical Diagnostics Using Lab-on-Fiber Technology: A Review" Photonics 9, no. 2: 86. https://doi.org/10.3390/photonics9020086
Note that from the first issue of 2016, this journal uses article numbers instead of page numbers. See further details here.