Interface Edge Mode Confinement in Dielectric-Based Quasi-Periodic Photonic Crystal Structure


Innovative Technologies Laboratories (ITL), King Abdullah University of Science and Technology (KAUST), Thuwal 23955, Saudi Arabia
*
Author to whom correspondence should be addressed.
Photonics 2022, 9(10), 676; https://doi.org/10.3390/photonics9100676
Submission received: 1 September 2022
/
Revised: 14 September 2022
/
Accepted: 19 September 2022
/
Published: 21 September 2022
(This article belongs to the Special Issue Recent Advances in Surface-Wave-Assisted Photonic-Crystal-Based Devices)
Abstract
:In this paper, the localization of optical interface edge-states is analyzed for a dielectric material-based quasi-periodic photonic crystal (QPhC) structure. The design comprises a bilayer PhC structure, where layers are arranged in a Fibonacci configuration to introduce quasi-periodicity. The impact of local symmetric sub-structures on Eigenstate coupling is considered over a wider wavelength range. This confirms the localization of interface edge modes for different wavelengths at the structural local resonators, where the number of local resonators depends on the length of the QPhC. The proposed seven-element QPhC structure shows a strong Tamm-like top interface edge mode localization for a 45.04° incident angle at 750 nm operating wavelength, whereas a bulk interface guided mode is also excited for a higher incident angle of around 79°. The investigation facilitates the development of reconfigurable devices to excite both bulk interface and surface interface edge modes with improved field intensities for spectroscopy and sensing applications.
1. Introduction
Aperiodic nanophotonic structures have attracted wide attention because of their inherent properties. The proper optimization of such structures leads to a photonic band gap associated with local symmetric sub-structured resonance, which can further be associated with the interface edge states [1,2]. These photonic band gaps (or quasi-bands) are equivalent to the Bloch band of periodic PhC, which arise by localization of the Eigenstates on such local symmetric sub-structures [3,4]. Surface interface mode-assisted photonic devices have been extensively explored for various applications such as intensity improvement in harmonic generation, sensors, lasers, filters, and wave-guiding [5,6,7,8,9]. Metal plays an important role in mode confinement. Dielectric material-based structures have also been explored to excite Tamm-like modes. These structures are generally designed considering one-dimensional periodic photonic crystals (1D-PhC) with a top defect layer [10,11]. The photonic bandgap (PBG) formation and mode excitation mechanism is well explored in periodic PhC structure [12,13]. Recently, the disordered two-dimensional photonic structures and quasi-periodic photonic crystal (QPhC) structures have also been explored extensively for waveguiding effects and PBG generation [14,15,16]. These QPhC structures have more complex bandgap structure than conventional 1D-PhC structures. The QPhC structures exhibits distinct collective properties that are not possible in their constituent parts.
These structures are generally composed of two or more incommensurable periodicities [17]. Several QPhC structures such as Rudin–Shapiro, double periodic PhC, Fibonacci, Thue–Morse, and Octonacci are explored for various applications [18]. Among the 1D QPhC structures, the transmission characteristics of the Fibonacci series-based (FS) PhC configuration have been widely explored both theoretically and experimentally [19,20,21]. It has been demonstrated that these QPhC structures have both traditional and fractal bandgaps, which arise because of local symmetric sub-structures [22,23]. The energy spectrum of the FS structure is considered to have a fractal structure that forms a Cantor set with zero Lebesgue measure [24]. The FS structure exhibits a forbidden spectrum range that called pseudo-PBG equivalent to the periodic PhC bandgap [25]. The modes are critically localized outside this pseudo-bandgap and exhibit weaker decaying behavior than conventional exponential decay mechanisms [26]. Thus, this can potentially be used for surface wave guiding applications. Various devices such as resonators and omnidirectional reflectors have been designed using these structures [27,28,29]. However, less work has been carried out to distinguish the localization feasibility of different types of surface and bulk interface edge-states at oblique incidence angles in these quasi-periodic photonic structures.
In this paper, the localization of optical interface edge-states is analyzed for a dielectric material-based Fibonacci QPhC structure. The structure comprises a simpler 1D-PhC structure with dielectric layers of titanium dioxide (TiO) and silicon dioxide (SiO) arranged in a Fibonacci series-based (FS) configuration (S = S × S, n ≥ 2). This results in the formation of several local symmetric sub-structures. The impact of these local symmetric sub-structures on Eigenstates coupling is considered over a wider wavelength range. Initially, the structural parameters are optimized to have a bandgap at the central wavelength of 750 nm. Detailed wavelength and angular interrogation are performed to study the interface edge mode confinement characteristics. Furthermore, the impact of variation in elements of the Fibonacci series is also studied at the wavelengths of 600 nm and 850 nm. This confirms the localization of interface edge modes for different wavelengths at the structural local resonators, where the number of local resonators depends on the length of the QPhC. The wavelength interrogation analysis depicts that the structure exhibits three photonic interface edge states at normal incidence with very high transmission for the central mode; however, the transmission amplitude is decreased for the lower-energy and higher-energy modes. Additionally, the angular interrogation analysis shows that at the higher incidence angle, the modes energies are also higher. Thus, it can be used for multimode photon excitation coupling applications. Further, the structure also supports a Tamm-like surface mode and a bulk interface guided mode at incidence angles of 45.4° and 79.0°, respectively. Therefore, the present structure exhibits its potential applications in both sensing and light-guiding applications. Finally, the structural capability to work as sensor is also demonstrated at 750 nm wavelengths. Moreover, because of the higher surface electric field intensity, this structure can also be used in fluorescence-based detection and surface-enhanced Raman spectroscopy as well [30].
2. Design Methods and Analysis
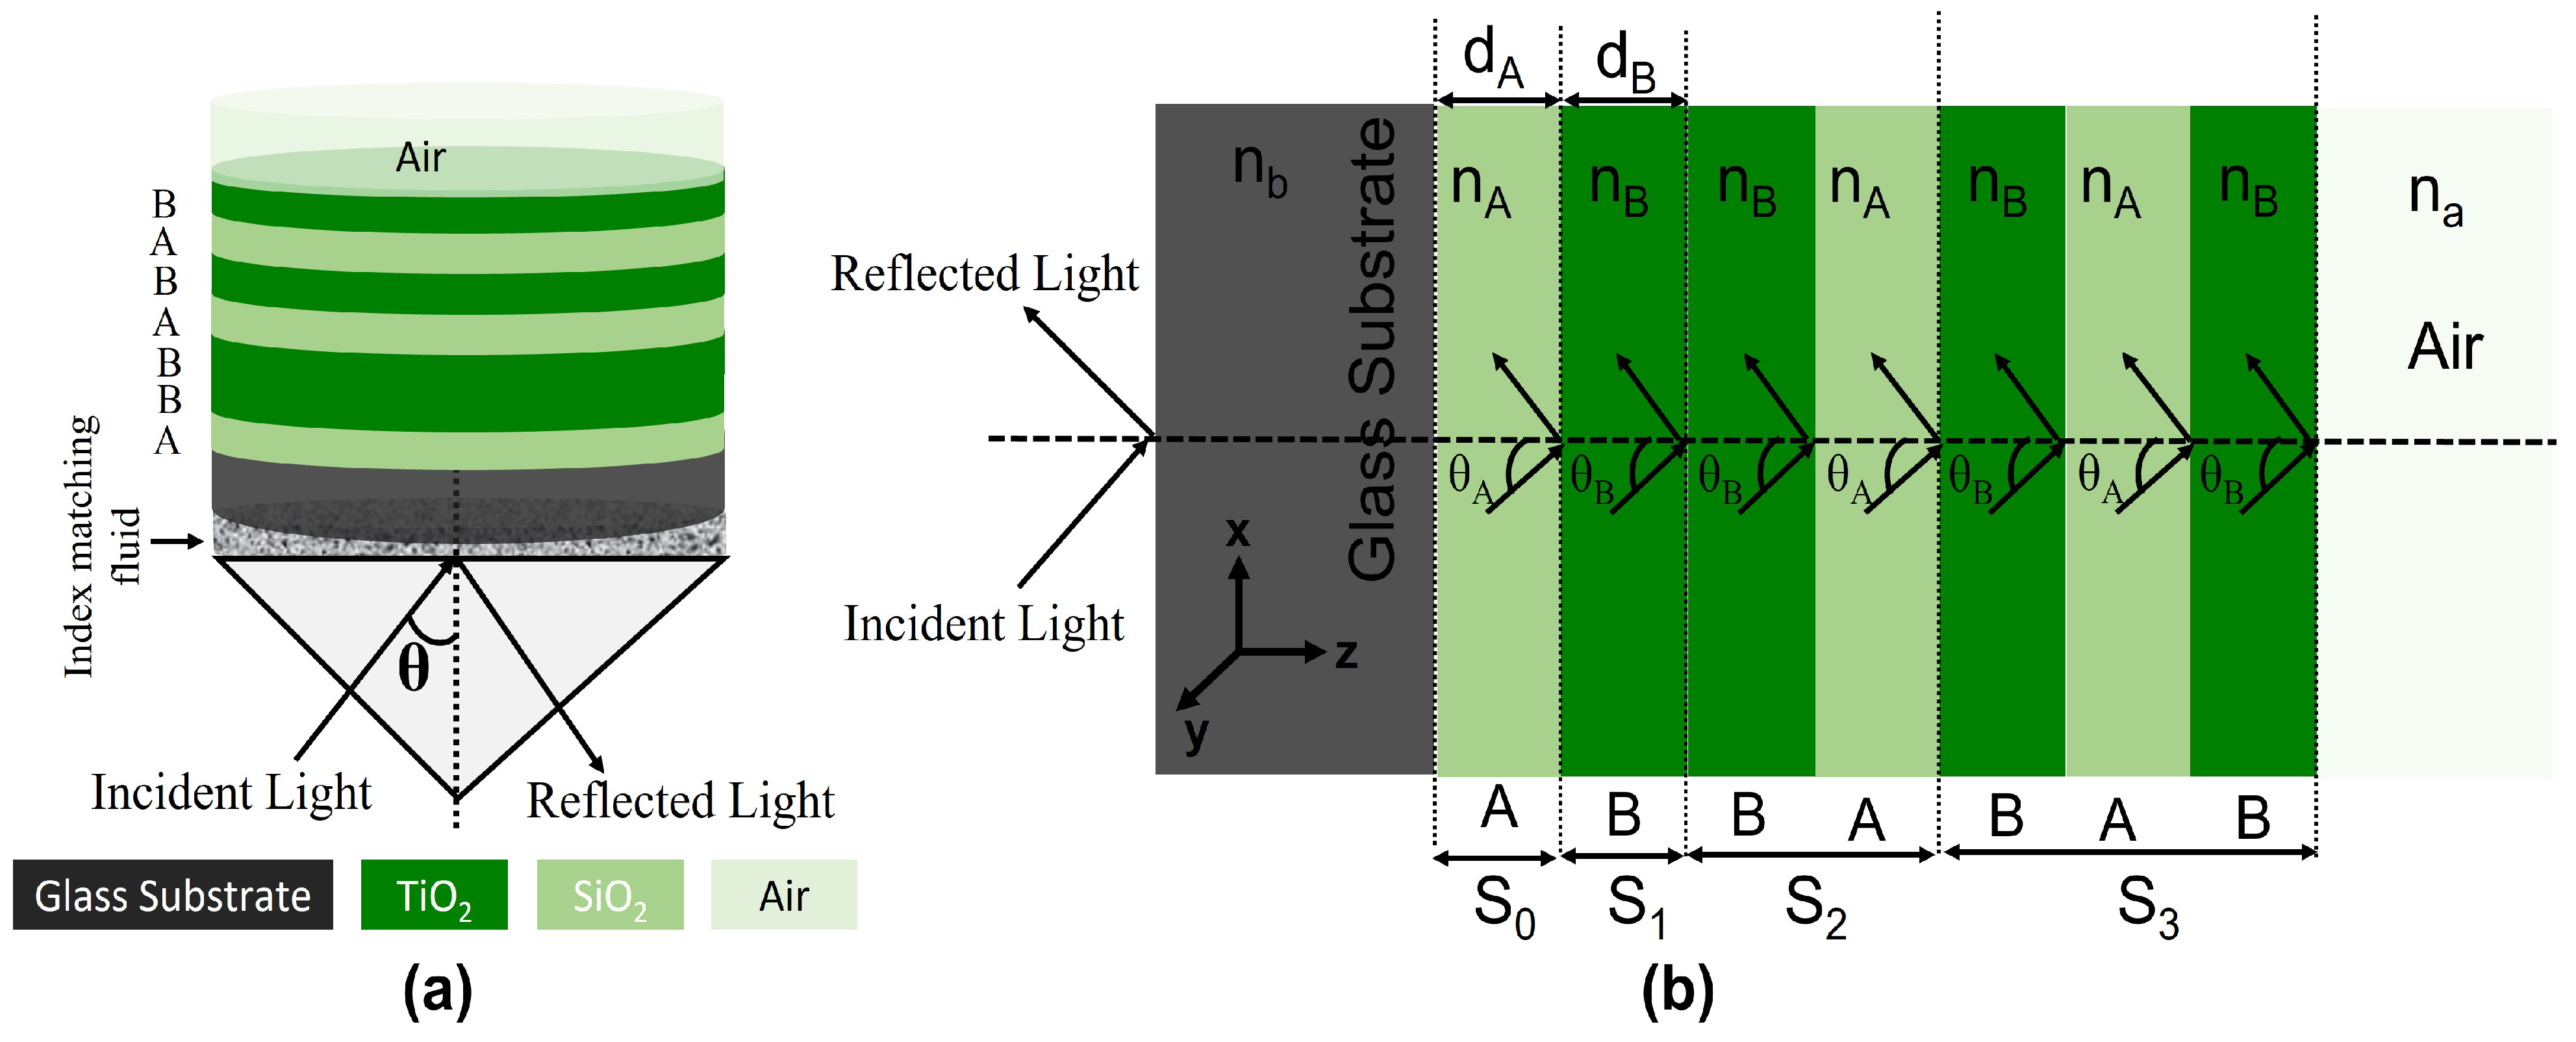
The schematic representation of the considered quasiperiodic photonic crystals (QPhC) structure based on Fibonacci series (FS) is shown in Figure 1a. Here, two dielectric layers of material ‘A’ (of low RI (nA)) having physical thickness dA and ‘B’ (of high RI (nB)) with physical thickness dB are considered to design the QPhC structure. This is accomplished by a very simple relation S = S × S, n ≥ 2, where Sn represents the nth member of the Fibonacci series [31]. Considering materials ‘A’ and ‘B’ as the starting two members of the series S = A, and S = B, the next member can easily be derived by substituting ‘A’ with ‘B’ and ‘B’ with ‘BA’. Figure 1b schematically represents the starting four members (S to S) of the proposed QPhC structure. The first six members of the structure are described in Table 1. The proposed structure design uses BK7 glass as a substrate with refractive index 1.515, whereas silicon dioxide (of low RI), with physical thickness of around 128 nm, and titanium dioxide (of high RI), with physical thickness of around 85 nm, are considered as materials ‘A’ and ‘B’, respectively.
The physical thicknesses are calculated by considering a quarter wave Bragg stack with a central working wavelength of about 750 nm (d ) [32,33]. The structural parameters can further be optimized to design the QPhC structure at other central wavelengths of interest as well. These materials are well explored in designing various surface wave-based devices [34,35]. The Sellmeier equation is used to calculate the wavelength dependent refractive indices of both the materials (‘A’, ‘B’) and is represented by Equations (1) and (2) [36,37].
The lossy properties of these materials are considered by using their imaginary refractive index. The imaginary dielectric constants of around 0.0001i and 0.0007i are used for materials ‘A’ and ‘B’, respectively [38].
where n and n are the refractive indices of the materials and is the central working wavelength (here, 750 nm). The optical length of various layers is optimized to obtain a high reflectivity for a given central wavelength. In literature, a number of periodic structures have been proposed to excite the optical surface states, where a defect layer is deliberately introduced for the mode confinement [38]. Although the proposed structure is aperiodic in nature, quasi-periodicity can still be introduced to ease the computation. Here, we analyze the impact of the number of Fibonacci series members for n = 6 (S to S) and n = 7 (S to S) on the optical surface state excitation mode for the QPhC structure. For n = 6, the structure can be represented by “Substrate|ABBABABBABBABABBABAB|Air” and for n = 7, it is given by “Substrate|ABBABABBABBABABBABABBABBABABBABBA|Air”. The structure can further be simplified to “Substrate|XYXZ|Air” (for n = 6) and “Substrate|XYXYXZ‘|Air” (for n = 7), thus considered as quasi-periodic in nature. Here, X = ABBAB, Y = ABBABBAB, Z = AB, and Z‘ = BA are considered as a subgroup of the QPhC structure with ‘X’ and ‘Y’ as the periodic element along with ‘Z’ and ‘Z‘’ as the surface defect layer to facilitate the excitation of the optical surface state. However, the structure can also be rearranged in other sub-groups to have different periodicity. Since the structure is periodic in the ‘z’ direction, the corresponding field amplitude for TE polarized light is calculated by Equations (3) and (4) [39,40].
where E and H are corresponding field components, n is the refractive index of incidence of the medium (here, air), is the incidence angle, and k is the wave vector. Thus, by calculating the field profile at every interface and considering quasi-periodicity, the Eigenvalue problem can be formulated. This field profile is calculated for all the considered layers, and field components of the reflected and transmitted wave are calculated using the transfer matrix method (TMM) [41,42].
In TMM, the matrix formulation for subgroup ‘X’ (M) can be considered as M = MMMMMMMM, where, M (M or M) is matrix notation for the ith layer and M (M, or M) represent the propagation matrix for the electromagnetic (EM) wave to propagate through layer ‘i’ to ‘j’. A similar matrix formulation can also be carried out for the remaining subgroups. In TMM, the field components of two layers are connected together in the form of the characteristic matrix and given by Equation (5) [43].
Thus, the relationship of the reflected and transmitted wave at the interface of layer ‘A’ to ‘B’ is characterized by M and is given by Equation (6) [44], whereas the corresponding phase shift is calculated by Equation (7).
where Ω is the reduced frequency ( or ). Similarly, M and other matrix components are computed. This gives the final field components considering all the interfaces (here, n) as represented in Equation (5). Since the QPhC structure is quasi-periodic in nature (with as an average period), the dispersion relation characterizes the propagating (real K) and evanescent wave vector (imaginary K) for the proposed structure, and is represented in Equation (8),
3. Results and Discussion
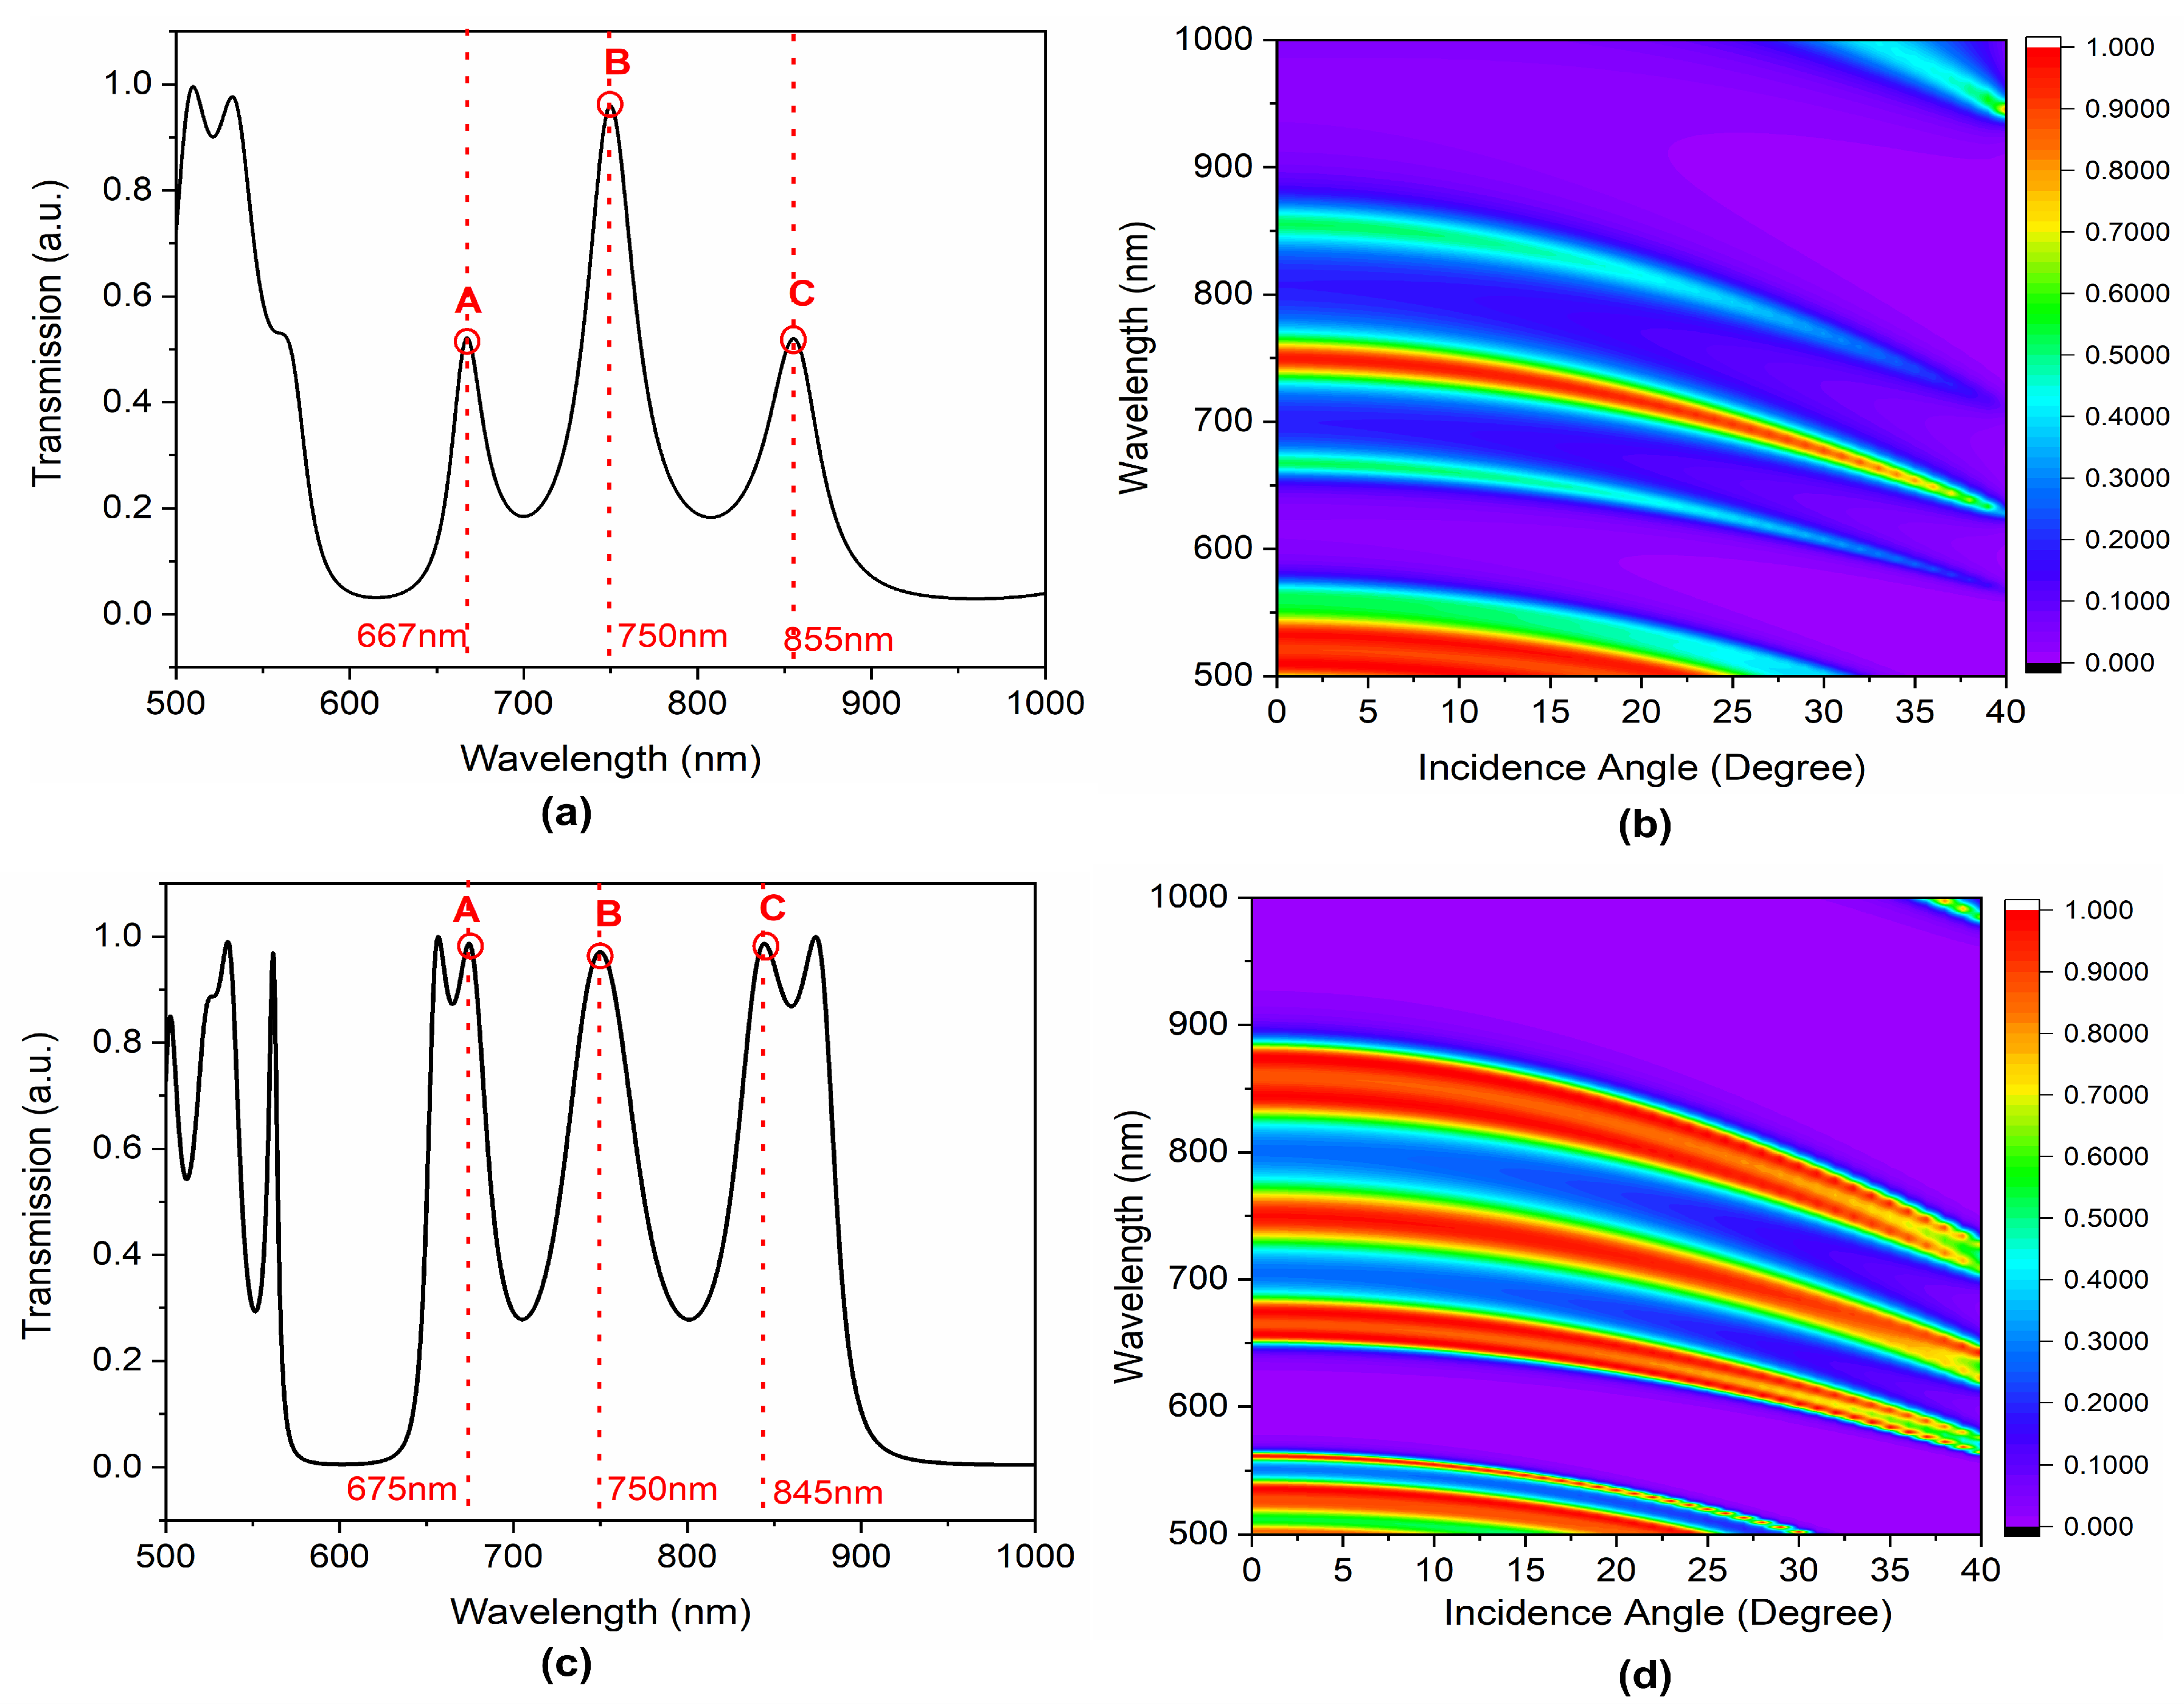
The structure optimizations and analysis are carried out initially for a QPhC structure with n = 6 FS elements. The transmission characteristics of QPhC at normal incidence for n = 6 FS element are shown in Figure 2a. The transmission spectrum is symmetric around the central working wavelength of 750 nm. This is because of the 90-degree phase shift (). The structure exhibits three photonic modes at normal incidence for corresponding central wavelengths of 667 nm, 750 nm, and 855 nm. These are marked as mode ‘A’, ‘B’, and ‘C’, respectively, as shown in Figure 2a. The structure has very high transmission for the central mode; however, the transmission amplitude is decreased for the lower-energy and higher-energy modes. The multimode transmission characteristics of proposed design can further be used in various applications [45]. The angular dispersion characteristic of these modes is also calculated and represented in Figure 2b. The analysis shows that the transmission characteristic is highly angle dependent and at the higher incidence angle, the modes energies are also higher. Thus, it can be used for multimode photon excitation coupling applications. The transmission characteristics of lower-energy and higher-energy modes can further be improved by increasing the elements in the QPhC structure.
The transmission characteristics of QPhC with n = 7 is shown in Figure 2c. The structure also exhibits three photonic modes at normal incidence for the corresponding central wavelengths of 675 nm, 750 nm, and 845 nm. These are also marked as modes ‘A’, ‘B’, and ‘C’ respectively, as shown in Figure 2c, thus showing characteristic scalability property of any cantor-like structure. The lower-energy and higher-energy modes have very high transmission, but the modes are split (here, doublets). The mode splitting is because of self-similarity of the QPhC structure for increased elements [46]. The angular dispersion characteristic of these modes also exhibits very high transmission for relatively higher incidence angles than n = 6 QPhC structures, as shown in Figure 2d. The optical surface state (OSS) can only be excited for the periodic PhC structure by introducing a top defect layer. In the proposed structure, ‘X’ and ‘Y’ are represent the periodic sub-groups, whereas ‘Z’ and ‘Z’ represent the surface defect sub-groups. This defective sub-group breaks the translation symmetry and facilitates the excitation of the optical surface state. Moreover, the guided modes characteristic can be analyzed for an incidence angle greater than the critical angle. Therefore, the transmission characteristics of the proposed n = 6 and n = 7 QPhC structures are analyzed beyond the critical angle (here, 41.2°) and are represented in Figure 3 and Figure 4.
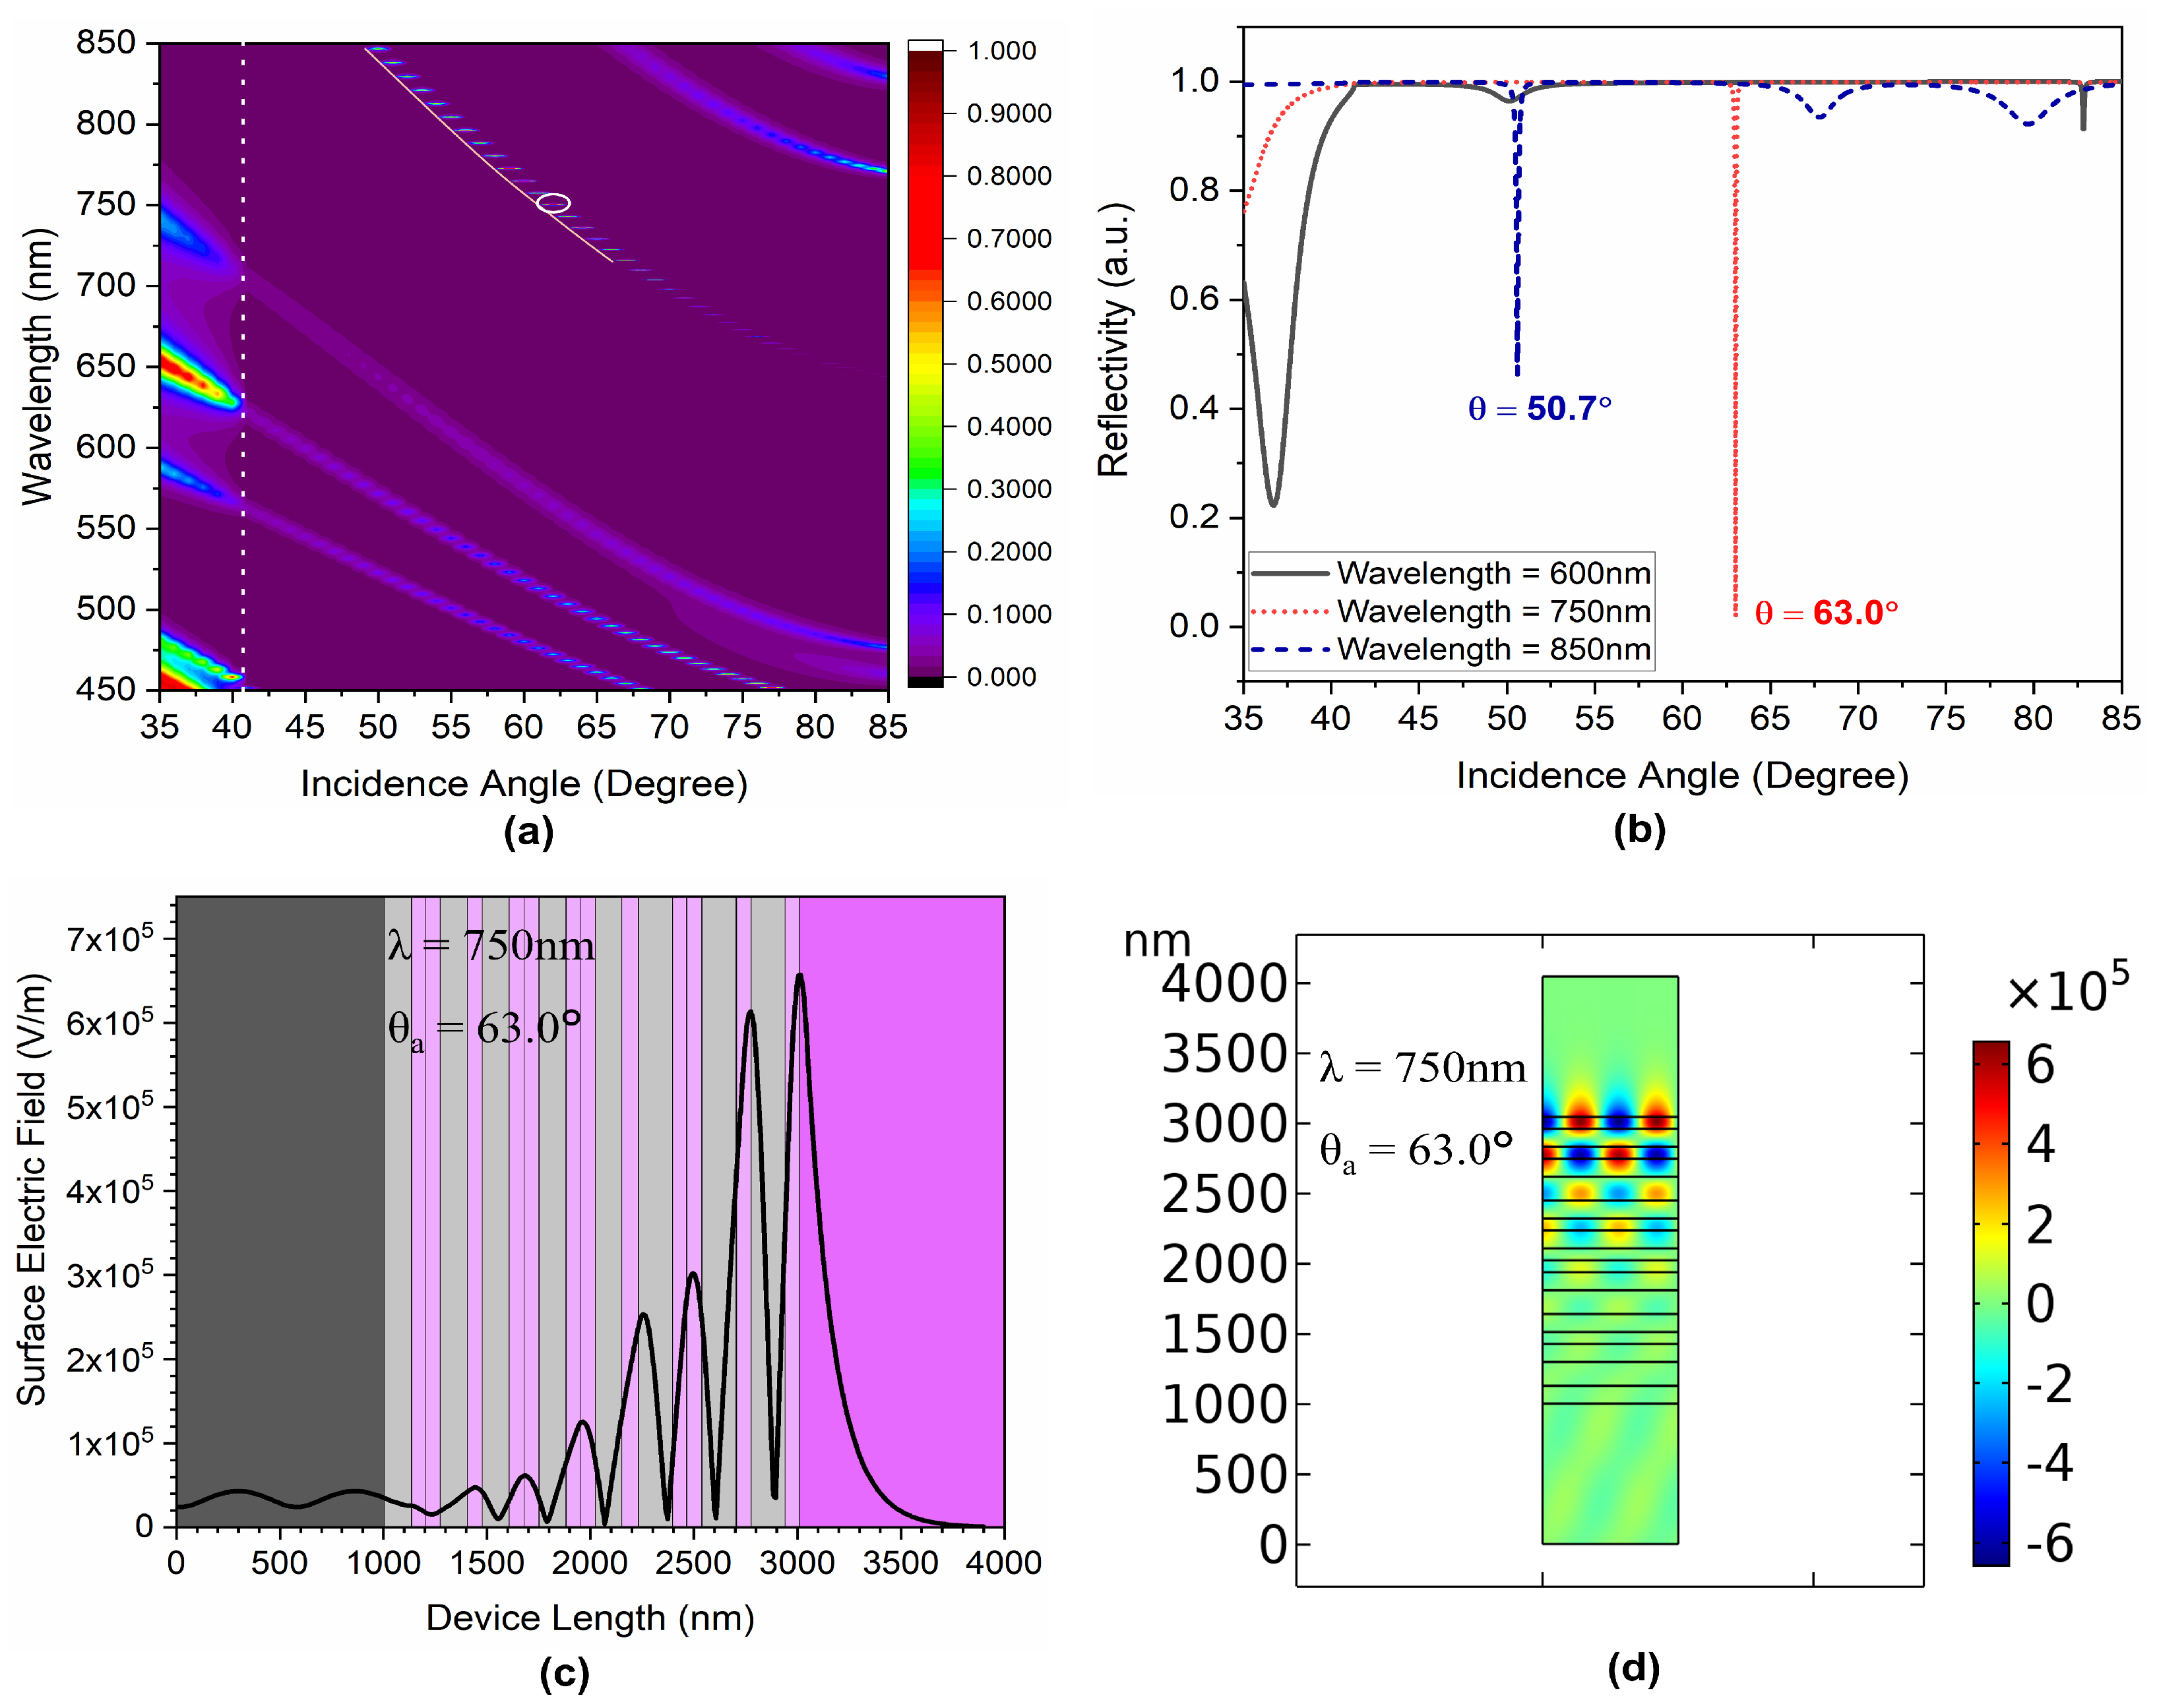
Figure 3 represents the angular transmission characteristics of the n = 6 QPhC structure. Beyond the light line (dotted line), we observe several optical modes over the wavelength range of 450–850 nm, where most of them are the bulk interface guided modes within the structure. The local subgroups of the QPhC structure act as local resonators for considered sequence values. For example, in the considered sequence for the n = 6 QPhC structure, “ABBA” can be considered as a local resonator with ‘BB’ as a resonating cavity with ‘A’ as the outer wall. Similarly, subgroup “BAB” can also be considered as another local resonator with ‘A’ as a resonating cavity with ‘B’ as the outer wall in ‘BAB’ configurations. This results in localization of various interface states. Moreover, because of the break in the translation symmetry (due to Z and Z‘), a few optical surface modes are also excited and are represented by the solid line in the Figure 3a.
Figure 3a represents the angular dispersion analysis of the considered n = 6 QPhC structure and the corresponding reflection characteristics for 600 nm, 750 nm, and 850 nm wavelengths are shown in Figure 3b. For an incident wavelength of 650 nm, no OSS is excited because the modes are guided within the structure; however, a good OSS is excited for an incident wavelength of 750 nm at a 63° incidence angle, as shown by the circle in Figure 3a and by the red curve in Figure 3b. This can further be confirmed by analyzing its spectral field distribution as shown in Figure 3c,d, which is calculated by the finite element method (FEM). Initially, the electric field is constant within the substrate (5 × 10 V/m); after, it attains its maximum value QPhC and eventually shows decaying in the air region. The decaying behavior is weaker than the conventional exponential decay mechanism in 1D-PhC-based surface wave devices. This leads to an around 1200% increase in the E-field intensity, which is much higher than recent reported values [47]. However, deviating far from this wavelength leads to the generation of bulk interface guided modes. For an operating wavelength of 850 nm, the structure exhibits both OSS (at 50.7° incidence angle) and bulk interface guided modes (67.5° and 80° incidence angle), where mode energy is distributed. Thus, the structure shows the capability to excite a good OSS over the wavelength range of 710 nm to 770 nm, as shown in Figure 3a. The analysis is further extended towards analyzing the OSS confinement for the n = 7 QPhC structure.
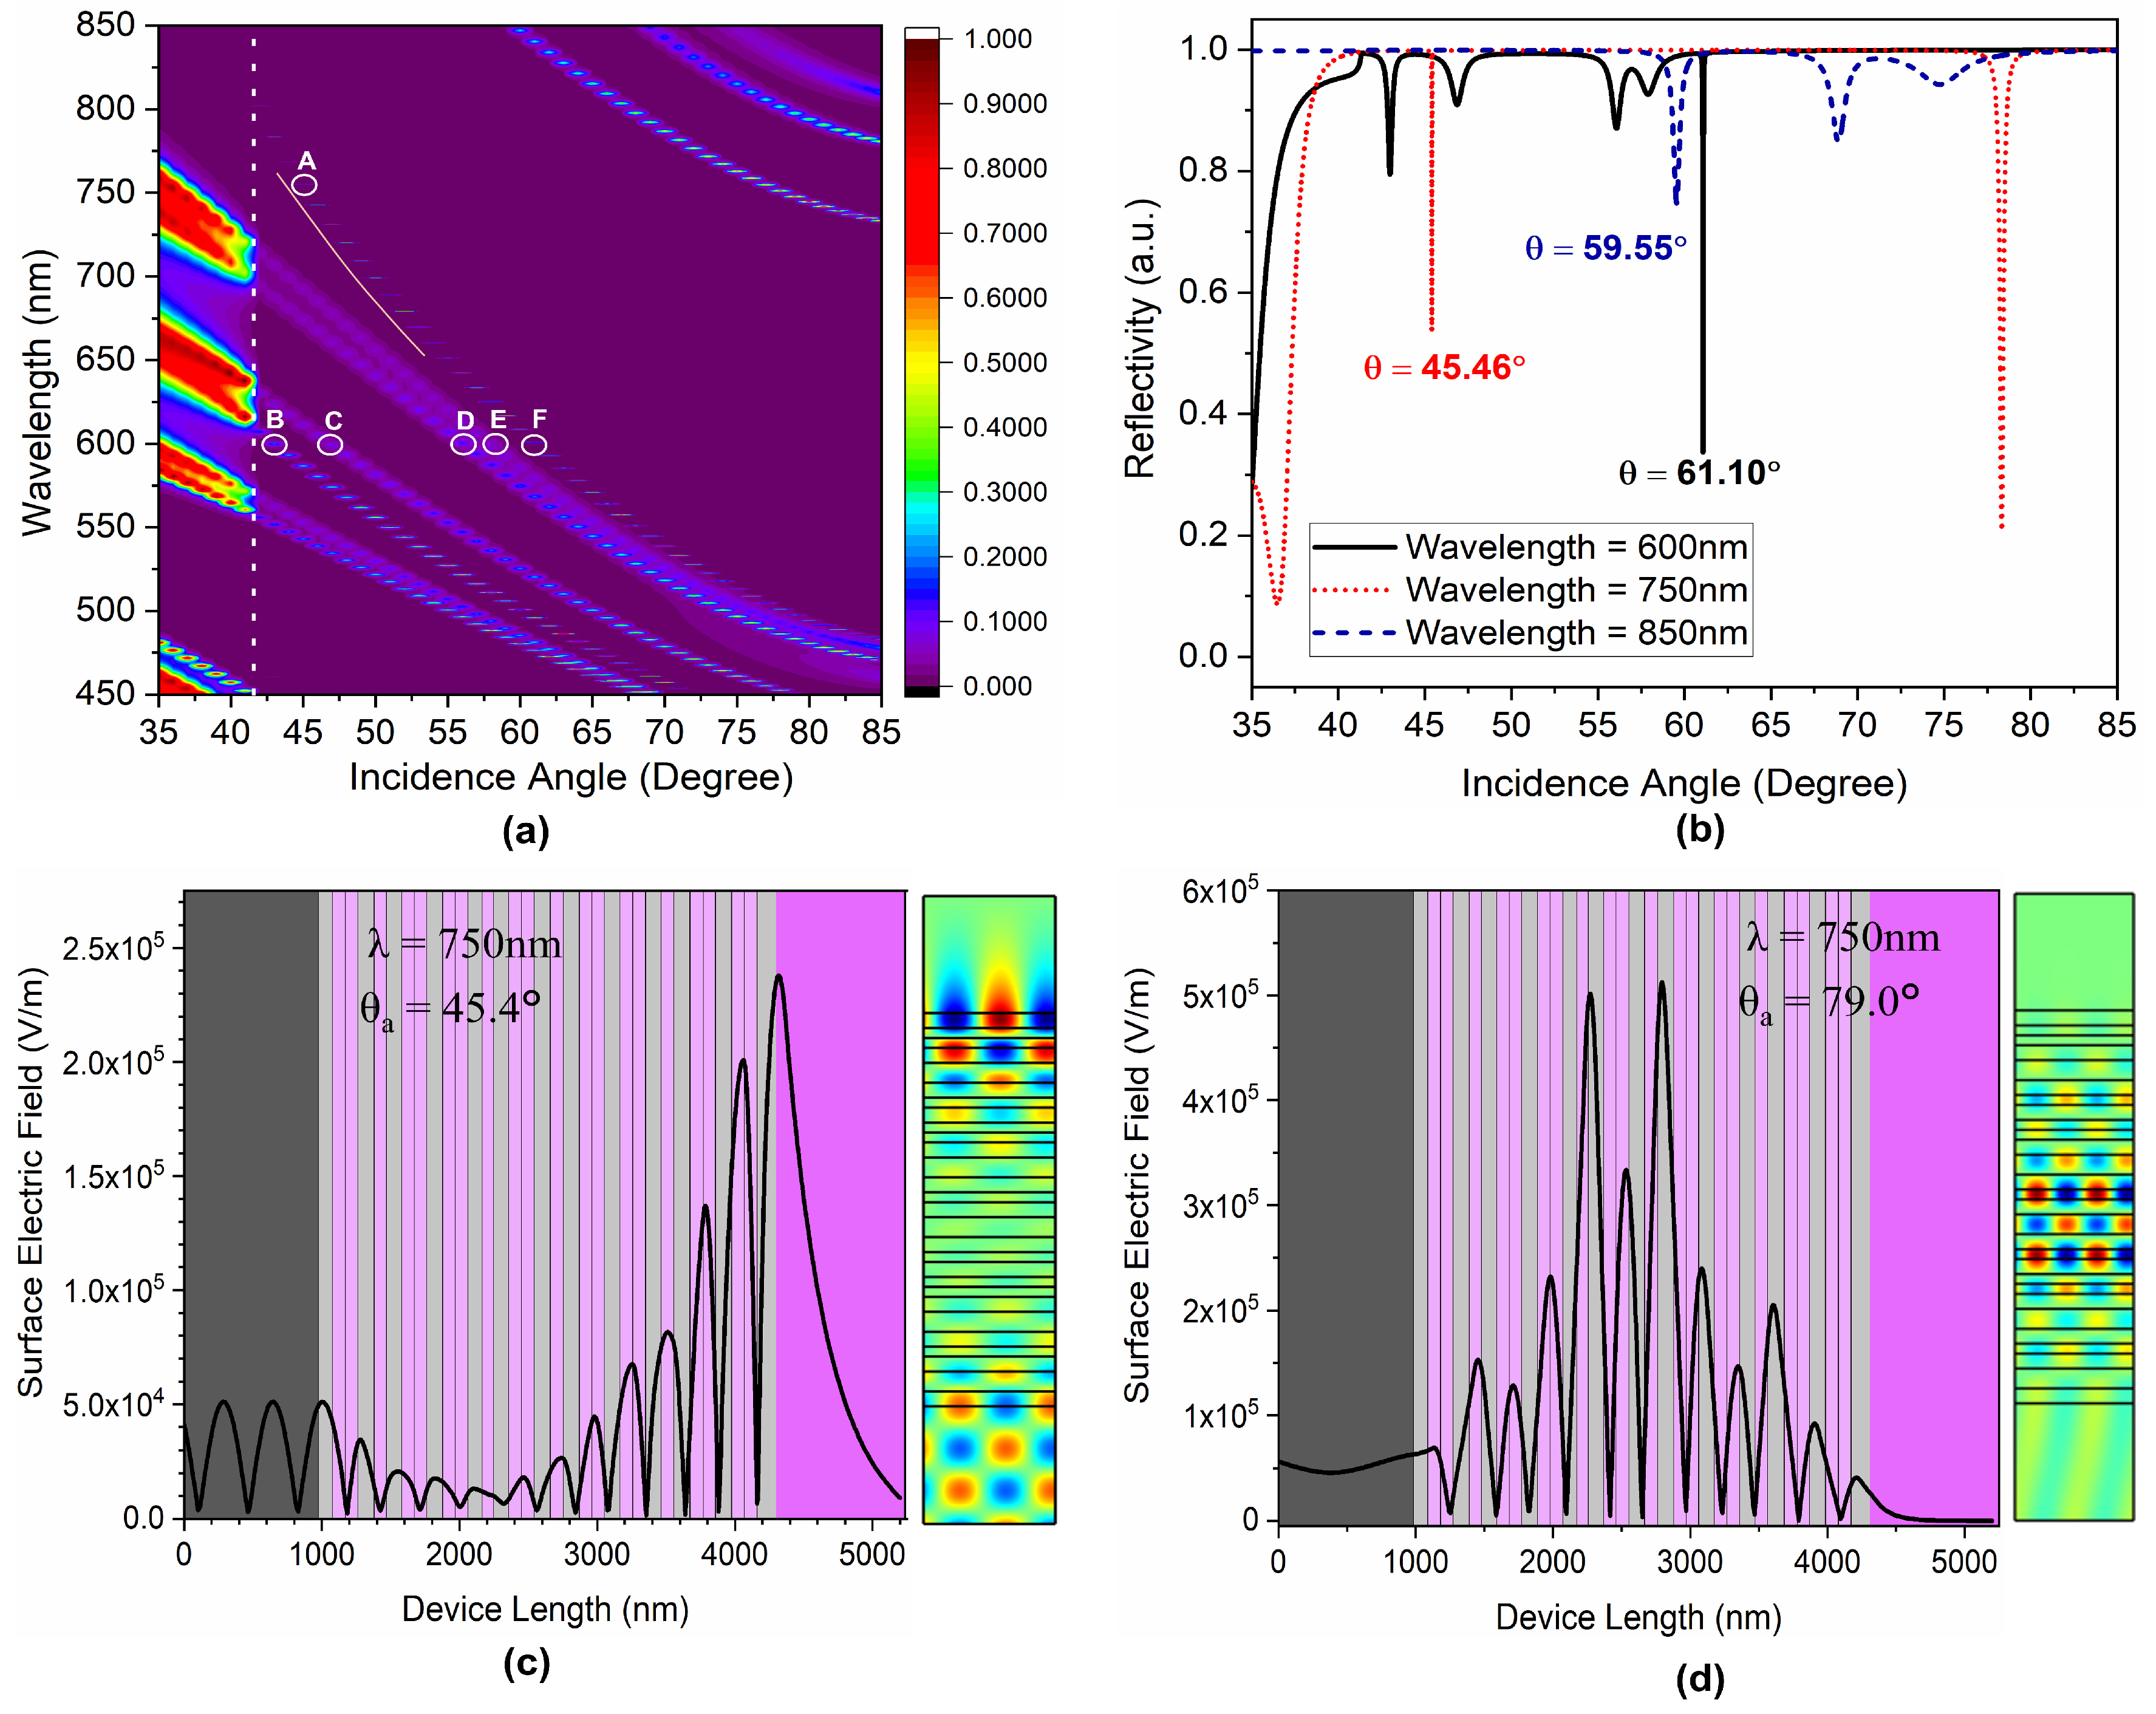
Figure 4 represents the transmission characteristics of the QPhC structure for the seven elements. Modifying the element number alters the dispersive properties of the QPhC structure. This is because of the generation of a number of sub-groups in the XYXYXZ‘ (for n = 7) structure with X = ABBAB, Y = ABBABBAB, and Z‘ = BA. The structure also exhibits several optical modes over the wavelength range of 450–850 nm. Figure 4b represents the angular dispersion analysis of the considered n = 7 QPhC structure for 600 nm, 750 nm, and 850 nm wavelengths. The structure exhibits generation of both surface guided modes and bulk guided mode for most of the wavelengths. For an incident wavelength of 600 nm, the structure exhibits five local minima (at 43°, 46°, 56°, 58°, and 61.10°), as shown by the circle ‘B–F’ in Figure 4a, out of which only mode ‘F’ is represented as top interface guided (OSS);the remaining four are bulk guided or leaky modes. Similarly, for an incident wavelength of 750 nm, the structure exhibits two local minima (at 45.46°, and 79°), out of which a 45.46° incidence angle leads to the excitation of an OSS mode (circle A in Figure 4a); the 79° angle represents the structural guided mode. This can further be confirmed by analyzing its spectral field distribution, as shown in Figure 4c,d.
For higher incidence angles (here, 79°), the electric field is constant within the substrate (5 × 10 V/m); after it starts increasing in the QPhC to attains its maxima and finally decreases back to saturation in the air region, thus, representing its strong structural guiding behavior, which is represented in Figure 4d. However, for lower incidence angles, it exhibits excitement of OSS, which is also represented by a solid line in Figure 4a. The structure leads to around a 325% increase in the E-field intensity. Therefore, the present structure has potential applications in both sensing and light-guiding applications. Moreover, because of the higher surface electric field intensity, this structure can also be used in fluorescence-based detection and surface-enhanced Raman spectroscopy as well [48,49,50]. Additionally, the lower the QPhC elements, the higher the field enhancement at the top surface will be.
4. Sensing Characteristics Discussion
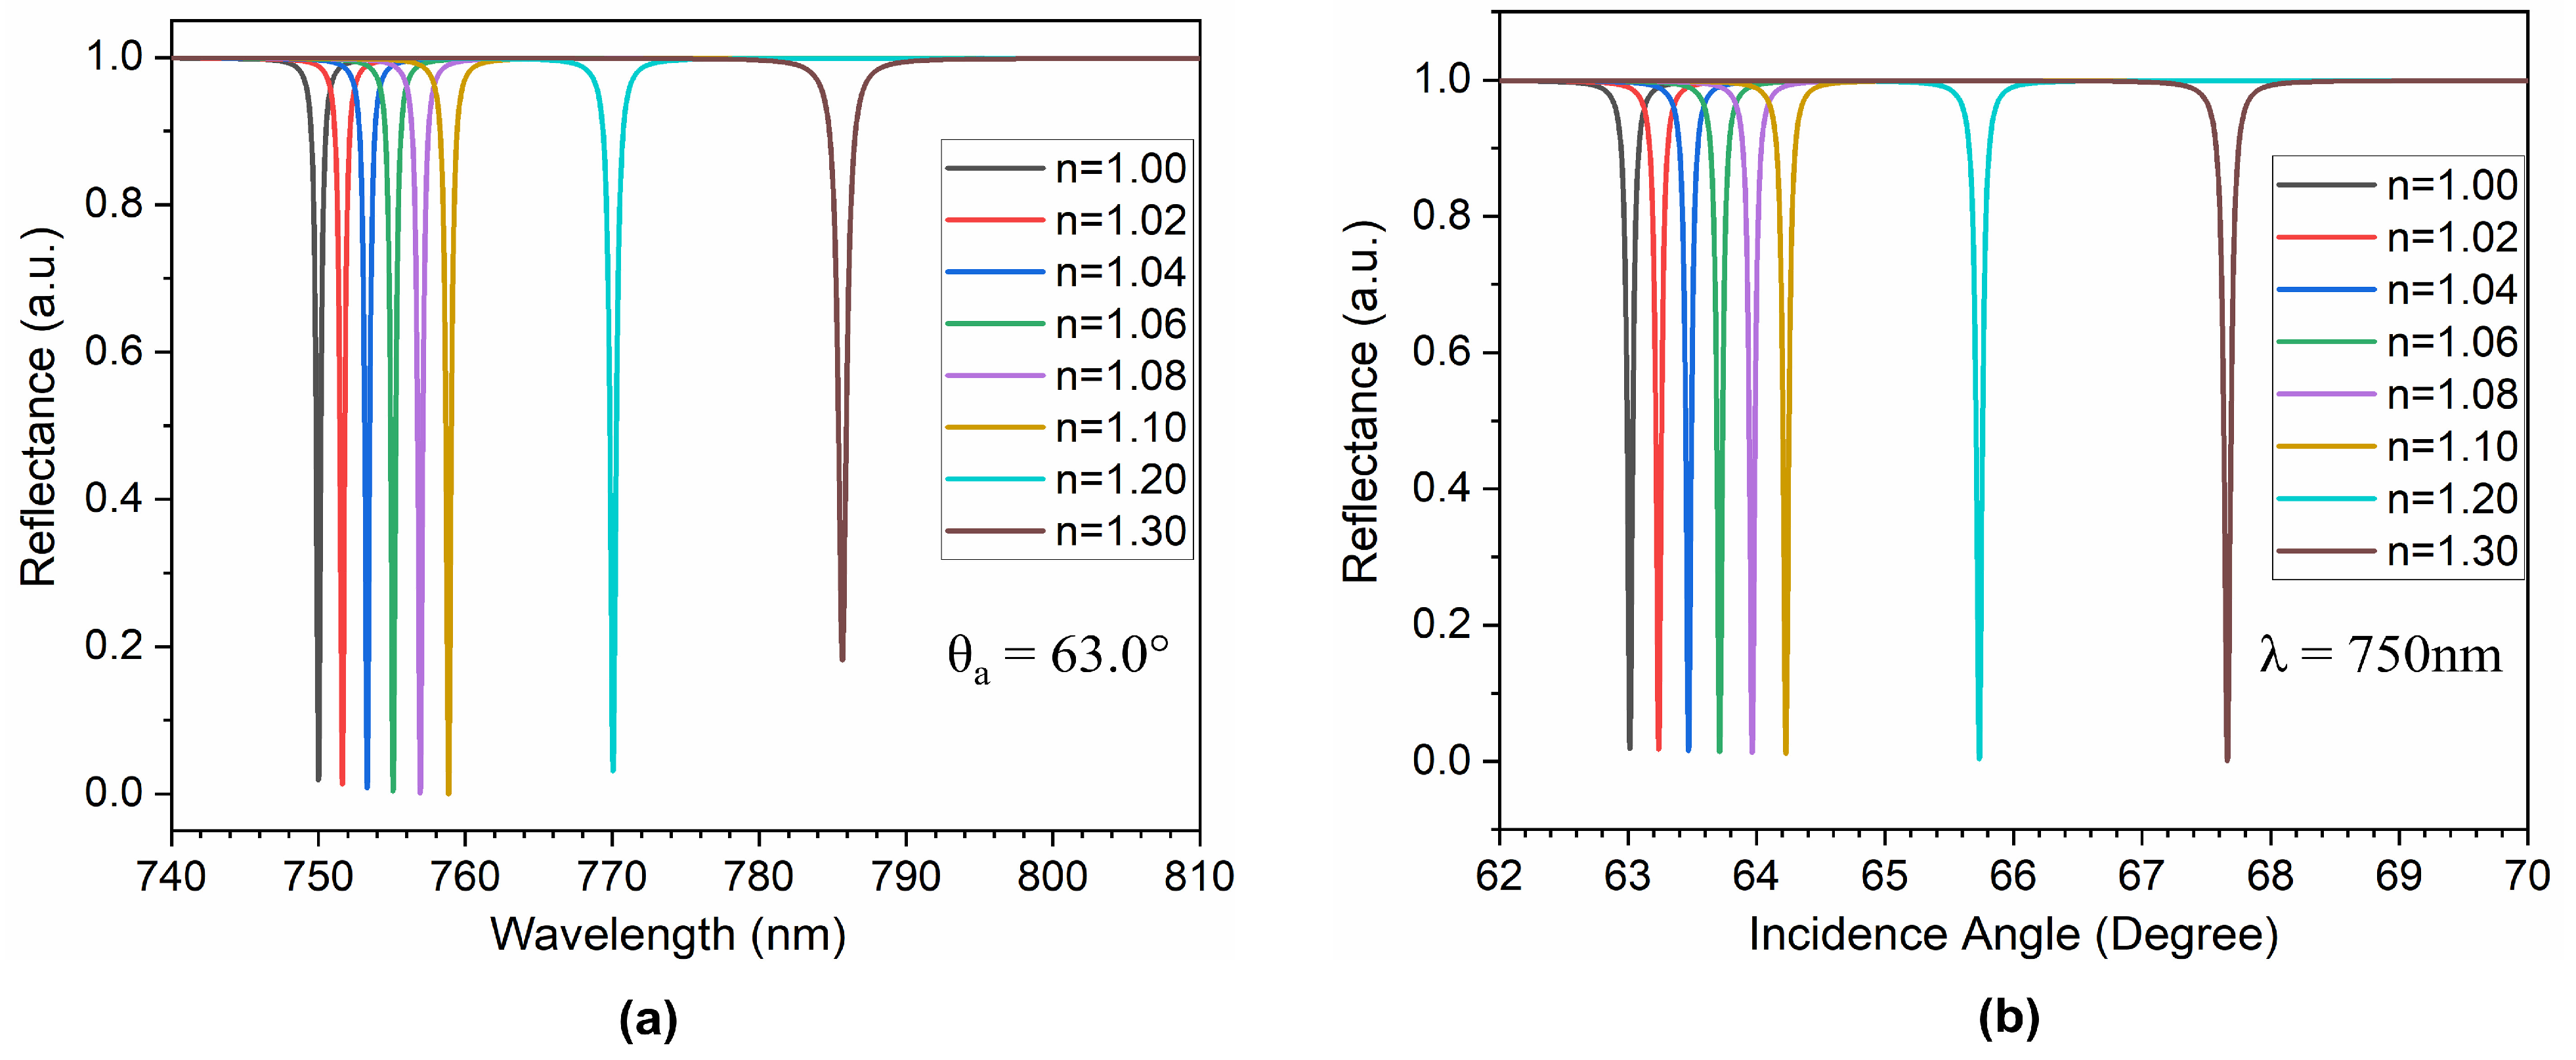
Since the structure shows a very good confinement of Tamm-like mode (OSS) at the top structure–air interface, the sensing capability of the proposed structure is also presented. Figure 5 represents the effect of analyte infiltration at the top interface. The sensitivity analysis is performed using both wavelength and angular interrogation methods. The structural sensitivity analysis is carried out for both gas sensing as well as liquid sensing. For gas sensing, the analyte refractive index is varied from 1.0 to 1.1 in steps of 0.02, whereas for liquid sensing, the structural response is cross checked for the analyte refractive index until 1.3. For wavelength interrogation, the incidence angle is kept constant at 63.0°, whereas for angular interrogation, the operating wavelength is fixed at 750 nm, as shown in Figure 5a,b.
The sensitivity (S) can be calculated by Equation 9 [51],
where S is the sensitivity, is the incident angle variation in angular interrogation, and is the operating wavelength variation in wavelength interrogation for the corresponding varying analyte refractive index n. It is evident from Figure 5 that infiltration of analyte at the top interface leads to excitation of the surface mode. However, the operating wavelength (or incident angles) is red shifted, with a very narrow full width half maximum (FWHM). This is because of the increase in the effective index at the top interface, which requires a higher operating wavelength (or incident angle) to confine the surface mode for the specified analyte concentration. This leads to the calculation of a more comprehensive performance parameter figure-of-merit (FOM), which can be calculated by FOM = S/FWHM [52]. The FWHM represents the width of the reflection spectrum ( or at half of the maximum reflection intensity points. The results are summarized in Table 2. It can be seen from Table 2 that the operating wavelength shifts from 750 nm (for air) to 785.66 (for n = 1.3) at a constant incidence angle of 63.0°, as shown in Figure 5a. The structure possesses a FWHM of less than 1 nm, thus showing its potential application in low concentration analyte detection. This gives an average FOM of about 231.6 RIU.
Additionally, the angular interrogation also reveals that the incident angle shifts from 63.0° (for air) to 67.66° (for n = 1.3) at a constant incident wavelength of 750 nm. The above values are well separated and show almost linear behavior (for gas sensing) and a very good second-order polynomial relation for the larger index variation (liquid sensing), as shown in Figure 5b. The angular interrogation exhibits a FWHM of less than 0.1 degree, which leads to an average FOM of about 260.7 RIU. The mentioned average FWHM values in both angular and wavelength interrogation are much less than recently reported values [53,54,55]. The infiltrated analyte concentration (refractive index) can be calculated from Equations (10) and (11), which are generated by polynomial fitting of Figure 6.
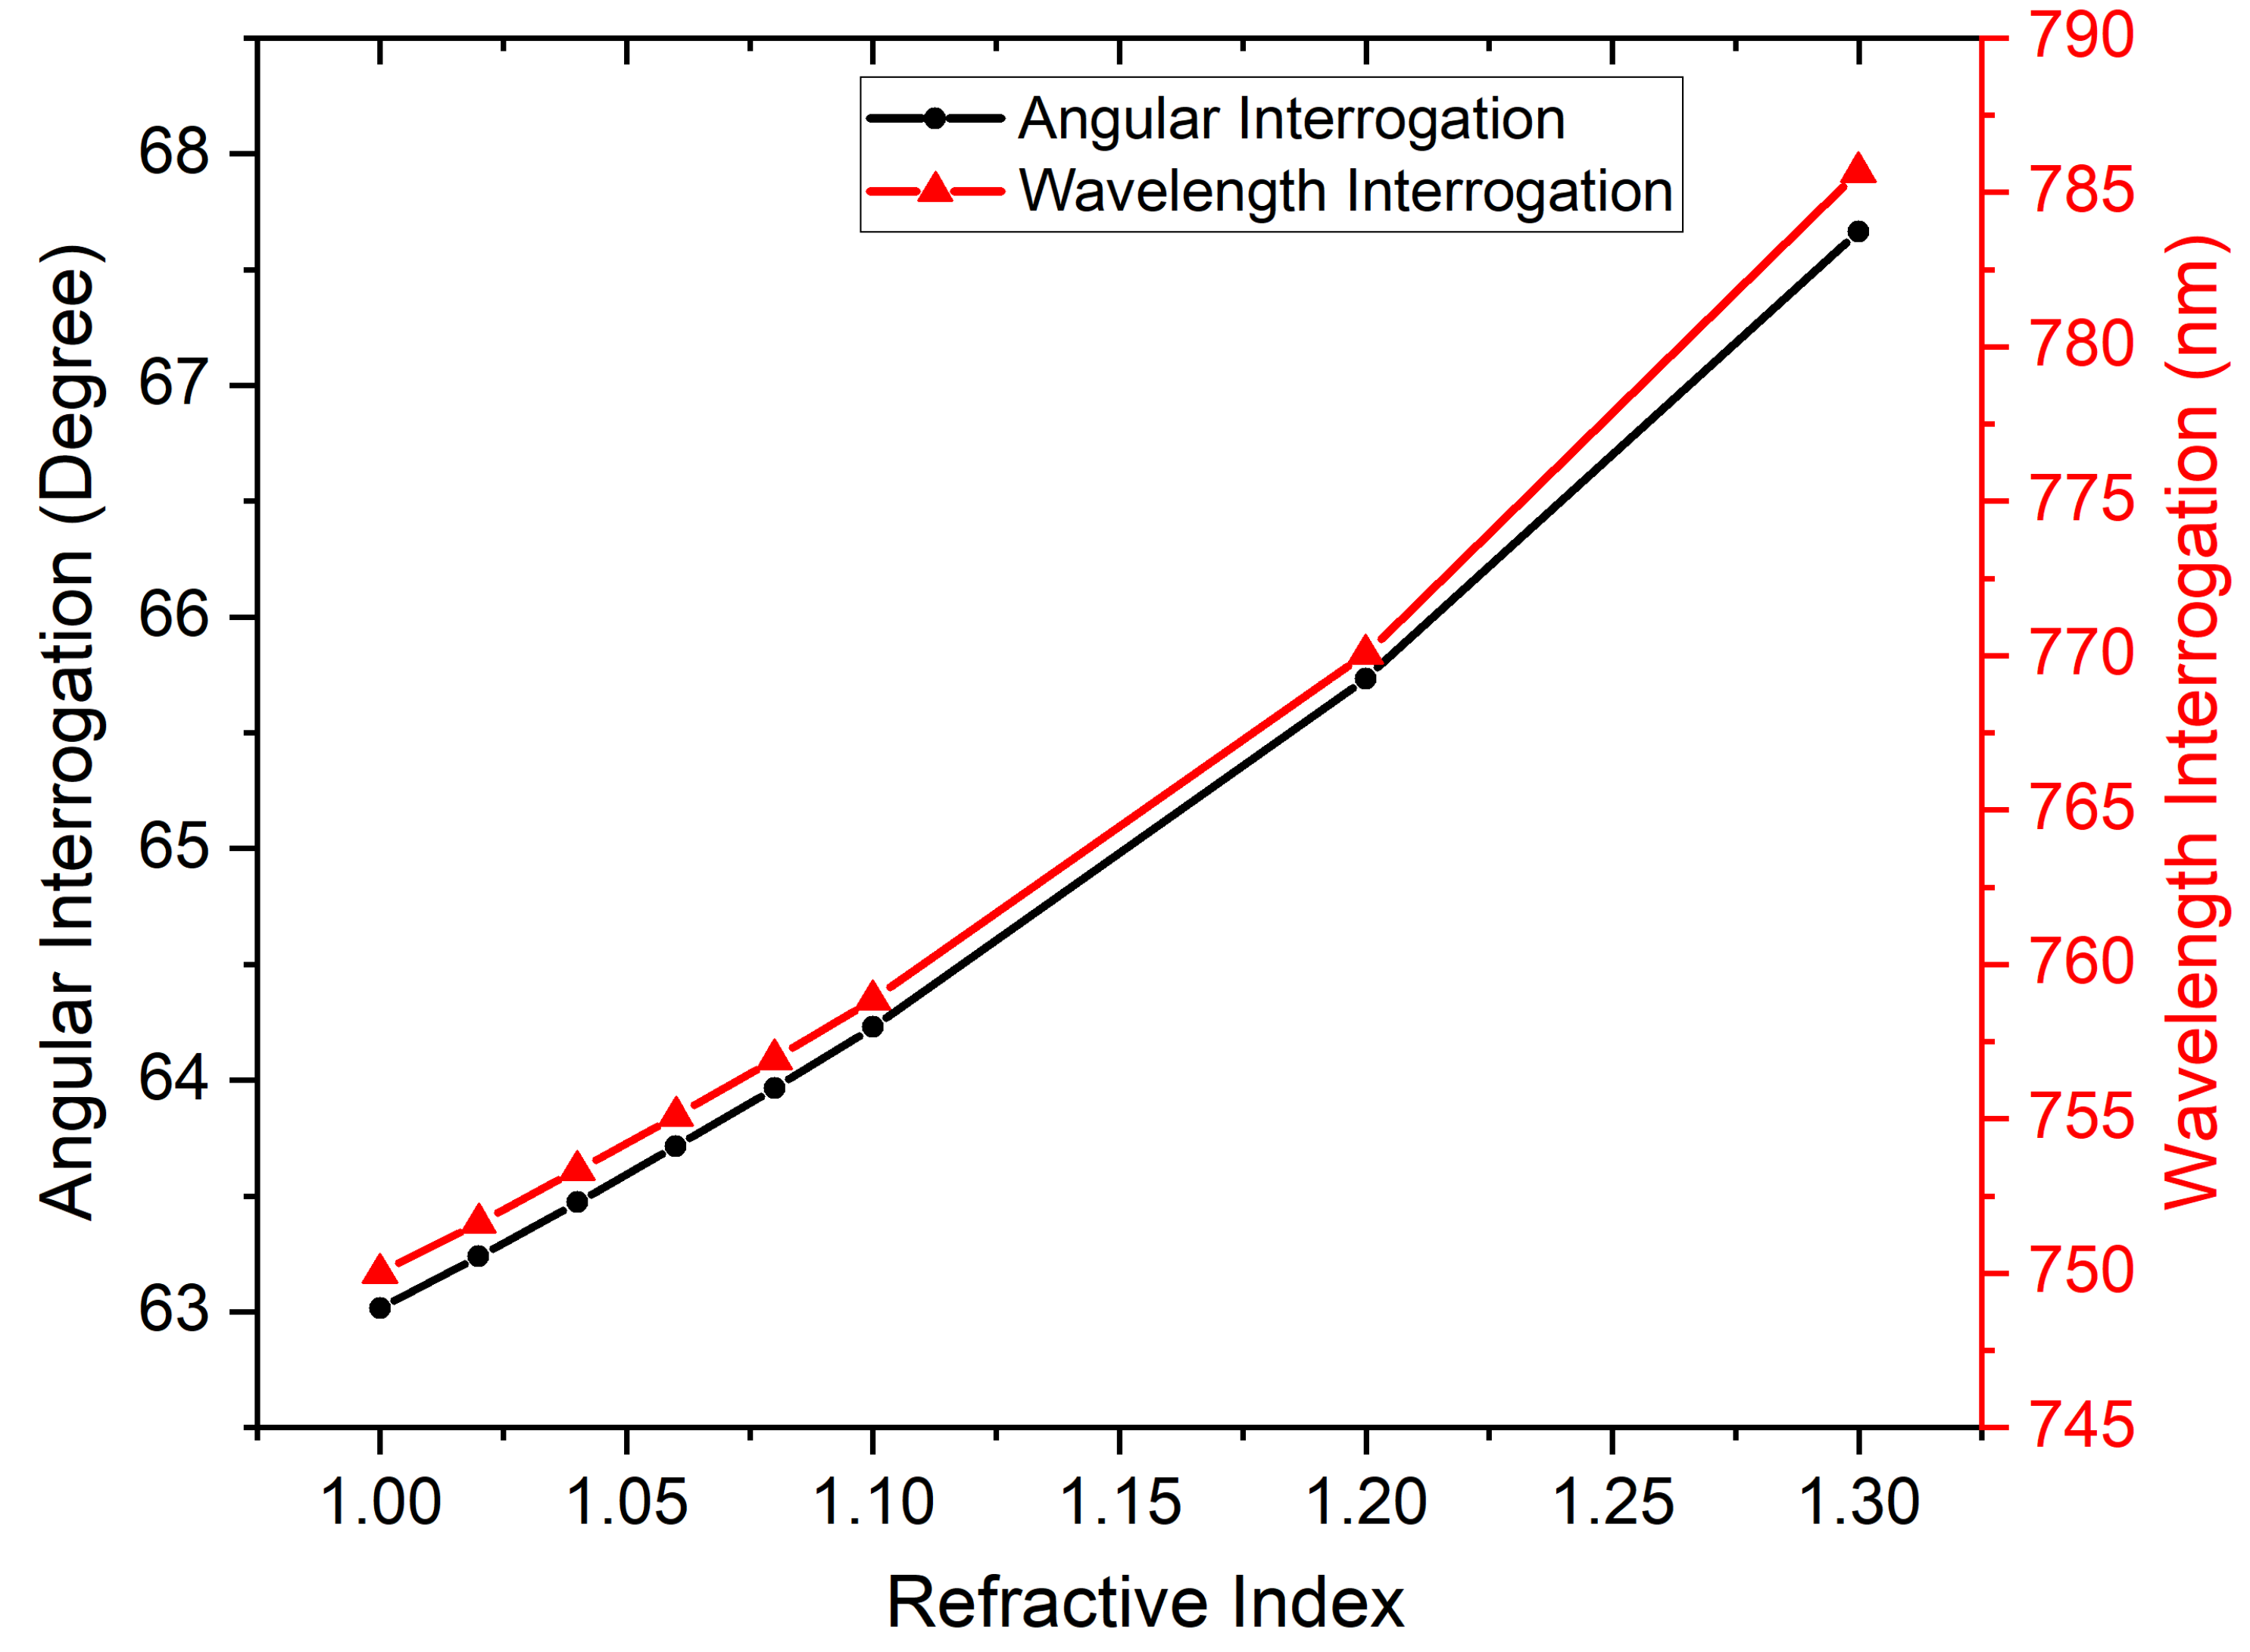
Figure 6 summarizes the angular interrogation (at a fixed operating wavelength) and wavelength interrogation (at a fixed incidence angles capabilities of the structure. The structural wavelength sensitivity response can be measured by Equation (10) and the corresponding angular sensitivity is calculated by Equation (11).
It is clearly evident from the graph that the infiltration of analyte at the top interface exhibits a good linear dependency for the smaller index variation and a very good second-order polynomial relation for the larger index variation at a fixed incidence angle of 63.0° (wavelength interrogation) and at a fixed operating wavelength of 750 nm (angular interrogation). Coefficient ‘x’ represents the analyte refractive index; ‘A’ (845.11 ± 15.49) and ‘B’ (70.42 ± 1.03) are the intercepts; ‘B1’ (−258.31 ± 27.13) and ‘C1’ (−24.93 ± 1.80) are the first order coefficients; ‘B2’ (163.43 ± 11.79) and ‘C2’ (17.54 ± 0.78) are the second order coefficients. This also shows a good polynomial relation with the coefficients of determination R, of around 0.99953 and 0.99988, respectively. This gives an average sensitivity (S ) of around 92 nm/RIU. The same can also be represented in terms of angular interrogation (S ), and is estimated to be around 12.75°/RIU, which is also summarized in Table 2. The structure provides a comparative sensing performance with much better FOM than recently reported values. Therefore, the proposed structure shows its capability as a refractive index sensor.
5. Conclusions
The presented manuscript demonstrates the localization of optical interface edge-states for a dielectric material-assisted quasi-periodic Fibonacci series-based QPhC structure. The impact of local symmetric sub-structures on Eigenstate coupling was considered over a wider wavelength range and a detailed electric field confinement study was carried out. It was observed that the lower-element QPhC structure leads to strong top interface edge state excitation (1200% higher field intensity), with potential applications in sensing, fluorescence imaging, and SERS. The higher-element QPhC structure leads to strong bulk interface guided mode excitation, with potential applications in multi-mode coupling and sensing. Finally, the structure’s capability to work as a sensor is also demonstrated.
Author Contributions
Conceptualization, A.K.G. and Y.M.; Formal analysis, A.K.G.; Investigation, Y.M.; Methodology, A.K.G.; Supervision, Y.M.; Validation, A.K.G. and Y.M.; Writing—original draft, A.K.G.; Writing—review and editing, Y.M. All authors have read and agreed to the published version of the manuscript.
Funding
The authors would like to acknowledge the research funding to the Innovative Technologies Laboratories (ITL) from King Abdullah University of Science and Technology (KAUST).
Institutional Review Board Statement
Not applicable.
Informed Consent Statement
Not applicable.
Data Availability Statement
Data underlying the results presented in this paper are not publicly available at this time, but may be obtained from the authors upon reasonable request.
Conflicts of Interest
The authors declare no conflict of interest.
References
- Fan, S.; Villeneuve, P.R.; Joannopoulos, J.D. Large omnidirectional band gaps in metallodielectric photonic crystals. Phys. Rev. B 1996, 54, 11245. [Google Scholar] [CrossRef] [PubMed]
- Vinogradov, A.P.; Dorofeenko, A.V.; Erokhin, S.G.; Inoue, M.; Lisyansky, A.A.; Merzlikin, A.M.; Granovsky, A.B. Surface state peculiarities in one-dimensional photonic crystal interfaces. Phys. Rev. B 2006, 74, 045128. [Google Scholar] [CrossRef]
- Maciá, E. The role of aperiodic order in science and technology. Rep. Prog. Phys. 2006, 69, 397. [Google Scholar] [CrossRef]
- Bandres, M.A.; Rechtsman, M.C.; Segev, M. Topological Photonic Quasicrystals: Fractal Topological Spectrum and Protected Transport. Phys. Rev. X 2016, 6, 011016. [Google Scholar] [CrossRef]
- Hosseini, A.; Massoud, Y. Nanoscale surface plasmon based resonator using rectangular geometry. Appl. Phys. Lett. 2007, 90, 181102. [Google Scholar] [CrossRef]
- Symonds, C.; Lheureux, G.; Hugonin, J.P.; Greffet, J.J.; Laverdant, J.; Brucoli, G.; Lemaitre, A.; Senellart, P.; Bellessa, J. Confined Tamm Plasmon Lasers. Nano Lett. 2013, 13, 3179. [Google Scholar] [CrossRef]
- Hosseini, A.; Nejati, H.; Massoud, Y. Design of a maximally flat optical low pass filter using plasmonic nanostrip waveguides. Opt. Exp 2007, 15, 15280–15286. [Google Scholar] [CrossRef]
- Hosseini, A.; Nieuwoudt, A.; Massoud, Y. Optimizing Dielectric Strips Over a Metallic Substrate for Subwavelength Light Confinement. IEEE Photonics Lett. 2007, 19, 522–524. [Google Scholar] [CrossRef]
- Alam, M.; Massoud, Y. A closed-form analytical model for single nanoshells. IEEE Trans. Nanotechnol. 2006, 5, 265–272. [Google Scholar] [CrossRef]
- Goyal, A.K.; Pal, S. Design analysis of Bloch surface wave based sensor for haemoglobin concentration measurement. Appl. Nanosci. 2020, 10, 3639–3647. [Google Scholar] [CrossRef]
- Goyal, A.K.; Saini, J. Performance Analysis of Bloch Surface Wave Based Sensor using Transition Metal Dichalcogenides. Appl. Nanosci. 2020, 10, 4307–4313. [Google Scholar] [CrossRef]
- Goyal, A.K. Design Analysis of One-dimensional Photonic Crystal Based Structure for Hemoglobin Concentration Measurement. Prog. Electromagn. Res. M 2020, 197, 77. [Google Scholar] [CrossRef]
- Goyal, A.K.; Dutta, H.; Pal, S. Development of Uniform Porous One-dimensional Photonic Crystal Based Sensor. Optik 2020, 223, 165597. [Google Scholar] [CrossRef]
- Chan, Y.S.; Chan, C.T.; Liu, Z.Y. Photonic Band Gaps in Two Dimensional Photonic Quasicrystals. Phys. Rev. Lett. 1998, 80, 956. [Google Scholar] [CrossRef]
- Chongjun, J.; Bingying, C.; Baoyuan, M.; Zhaolin, L.; Daozhong, Z. Band gap and wave guiding effect in a quasiperiodic photonic crystal. Appl. Phys. Lett. 1999, 75, 1848. [Google Scholar]
- Aly, A.H.; Elsayed, H.A.; Malek, C. Transmittance properties of a quasi-periodic one-dimensional photonic crystals that incorporate nanocomposite material. Int. J. Mod. Phys. B 2018, 32, 1850220. [Google Scholar] [CrossRef]
- Berzera, C.G.; Albuquerque, E.L.; Nogueira, E. On the spin wave multifractal spectra in magnetic multilayers. Physica A 1999, 267, 124. [Google Scholar] [CrossRef]
- Vardeny, Z.V.; Nahata, A.; Agrawal, A. Optics of photonic quasicrystals. Nat. Photonics 2013, 7, 177. [Google Scholar] [CrossRef]
- Hattori, T.; Tsurumachi, N.; Kawato, S.; Nakatsuka, H. Photonic dispersion relation in a one-dimensional qnasicrystal. Phys. Rev. B 1994, 50, 4220. [Google Scholar] [CrossRef]
- Kaliteevski, M.A.; Nikolaev, V.V.; Abram, R.A.; Brand, S. Bandgap Structure of Optical Fibonacci Lattices after Light Diffraction. Opt. Spectrosc. 2001, 91, 109–118. [Google Scholar] [CrossRef]
- Huang, X.Q.; Jiang, S.S.; Peng, R.W.; Hu, A. Perfect transmission and self-similar optical transmission spectra in symmetric Fibonacci-class multilayers. Phys. Rev. B 2001, 63, 245104. [Google Scholar] [CrossRef]
- Jiang, X.; Zhang, Y.; Feng, S.; Huang, K.C.; Yi, Y.; Joannopoulos, J.D. Photonic band gaps and localization in the Thue-Morse structures. Appl. Phys. Lett. 2005, 86, 201110. [Google Scholar] [CrossRef]
- Lei, H.; Chen, J.; Nouet, G.; Feng, S.; Gong, Q.; Jiang, X. Photonic band gap structures in the Thue–Morse lattice. Phys. Rev. B 2007, 75, 205109. [Google Scholar] [CrossRef]
- Kohmoto, M.; Sutherland, B.; Iguchi, K. Localization in Optics: Quasiperiodic Media. Phys. Rev. B 1987, 58, 2436. [Google Scholar] [CrossRef]
- Capaz, R.B.; Koiller, B.; de Queiroz, S.L.A. Gap states and localization properties of one-dimensional Fibonacci quasicrystals. Phys. Rev. B 1990, 42, 6402. [Google Scholar] [CrossRef]
- Fujiwara, T.; Kohmoto, M.; Tokihiro, T. Multifractal wave functions on a Fibonacci lattice. Phys. Rev. B 1989, 40, 7413. [Google Scholar] [CrossRef]
- Abbas, M.; Kim, J.; Rana, A.; Kim, I.; Rehman, B.; Ahmad, Z.; Massoud, Y.; Seong, J.; Badloe, T.; Park, K.; et al. Nanostructured chromium-based broadband absorbers and emitters to realize thermally stable solar thermophotovoltaic systems. Nanoscale 2022, 14, 6425–6436. [Google Scholar] [CrossRef]
- Han, P.; Wang, H. Criterion of omnidirectional reflection in a one-dimensional photonic heterostructure. J. Opt. Soc. Am. B 2005, 22, 1571–1575. [Google Scholar] [CrossRef]
- Goyal, A.K.; Kumar, A. Recent advances and progresses in photonic devices for passive radiative cooling application: A review. J. Nanophotonics 2020, 14, 030901. [Google Scholar] [CrossRef]
- Delfan, A.; Liscidini, M.; Sipe, J.E. Surface enhanced Raman scattering in the presence of multilayer dielectric structures. J. Opt. Soc. Am. B 2012, 29, 1863. [Google Scholar] [CrossRef]
- Kohmoto, M.; Kadanoff, L.P.; Tang, C. Localization Problem in One Dimension: Mapping and Escape. Phys. Rev. Lett. 1983, 50, 1870. [Google Scholar] [CrossRef]
- Goyal, A.K.; Dutta, H.S.; Pal, S. Porous photonic crystal structure for sensing applications. J. Nanophotonics 2018, 12, 040501. [Google Scholar] [CrossRef]
- Ratra, K.; Singh, M.; Goyal, A.K. Design and Analysis of Omni-directional Solar Spectrum Reflector using One-dimensional Photonic Crystal. J. Nanophotonics 2020, 14, 026005. [Google Scholar] [CrossRef]
- Goyal, A.K.; Kumar, A.; Massoud, Y. Performance Analysis of DAST Material-Assisted Photonic-Crystal-Based Electrical Tunable Optical Filter. Crystals 2022, 12, 992. [Google Scholar] [CrossRef]
- Gryga, M.; Ciprian, D.; Gembalova, L.; Hlubina, P. Sensing based on Bloch surface wave and self-referenced guided mode resonances employing a one-dimensional photonic crystal. Opt. Express 2021, 29, 12996. [Google Scholar] [CrossRef]
- Malitson, I.H. Interspecimen comparison of the refractive index of fused silica. J. Opt. Soc. Am. 1965, 55, 1205–1208. [Google Scholar] [CrossRef]
- Devore, J.R. Refractive indices of rutile and sphalerite. J. Opt. Soc. Am. 1951, 41, 416–419. [Google Scholar] [CrossRef]
- Goyal, A.K.; Kumar, A.; Massoud, Y. Thermal Stability Analysis of Surface Wave Assisted Bio-Photonic Sensor. Photonics 2022, 9, 324. [Google Scholar] [CrossRef]
- Pochi, Y. Electromagnetic propagation in periodic stratified media I. General theory. J. Opt. Soc. Am. 1977, 67, 423–438. [Google Scholar]
- Hosseini, A.; Nejati, H.; Massoud, Y. Modeling and design methodology for metal-insulator-metal plasmonic Bragg reflectors. Opt. Exp. 2008, 16, 1475–1480. [Google Scholar] [CrossRef]
- Hosseini, A.; Massoud, Y. Optical range microcavities and filters using multiple dielectric layers in metal-insulator-metal structures. JOSA A 2007, 24, 221–224. [Google Scholar] [CrossRef] [PubMed]
- Hosseini, A.; Nieuwoudt, A.; Massoud, Y. Efficient simulation of subwavelength plasmonic waveguides using implicitly restarted Arnoldi. Opt. Exp. 2006, 14, 7291–7298. [Google Scholar] [CrossRef]
- Yeh, P.; Yariv, A.; Cho, A.Y. Optical surface waves in periodic layered media. Appl. Phys. Lett. 1978, 32, 104–105. [Google Scholar] [CrossRef]
- Charalambos, C.; Siapkas, D.I. General transfer-matrix method for optical multilayer systems with coherent, partially coherent, and incoherent interference. Appl. Opt. 2002, 41, 3978–3987. [Google Scholar]
- Wan, N.; Meng, F.; Schröder, T.; Shiue, R.; Chen, E.H.; Englund, D. High-resolution optical spectroscopy using multimode interference in a compact tapered fibre. Nat. Commun. 2015, 6, 7762. [Google Scholar] [CrossRef]
- Augustyniak, A.; Zdanowicz, M.; Osuch, T. Self-Similarity Properties of Complex Quasi-Periodic Fibonacci and Cantor Photonic Crystals. Photonics 2021, 8, 558. [Google Scholar] [CrossRef]
- Gevorgyan, A.H. Broadband optical diode and giant nonreciprocal tunable light localization. Opt. Mater. 2021, 113, 110807. [Google Scholar] [CrossRef]
- Pirotta, S.; Xu, X.G.; Delfan, A.; Mysore, S.; Maiti, S.; Dacorro, G.; Patrini, M.; Galli, M.; Guizzetti, G.; Dajoni, D.; et al. Surface-Enhanced Raman Scattering in Purely Dielectric Structures via Bloch Surface Waves. J. Phys. Chem. C 2013, 117, 6821. [Google Scholar] [CrossRef]
- Angelini, A.; Enrico, E.; Leo, N.D.; Munzert, P.; Boarino, L.; Michelotti, F.; Giorgis, F.; Descrovi, E. Fluorescence diffraction assisted by Bloch surface waves on a one-dimensional photonic crystal. New J. Phys. 2013, 15, 073002. [Google Scholar] [CrossRef]
- Hosseini, A.; Massoud, Y. A low-loss metal-insulator-metal plasmonic bragg reflector. Opt. Express 2006, 14, 11318–11323. [Google Scholar] [CrossRef] [PubMed]
- Goyal, A.K.; Dutta, H.S.; Pal, S. Design and analysis of photonic crystal micro-cavity based optical sensor platform. AIP Conf. Proc. 2016, 1724, 020005. [Google Scholar] [CrossRef]
- Meng, Q.-Q.; Zhao, X.; Lin, C.-Y.; Chen, S.-J.; Ding, Y.-C.; Chen, Z.-Y. Figure of Merit Enhancement of a Surface Plasmon Resonance Sensor Using a Low-Refractive-Index Porous Silica Film. Sensors 2017, 17, 1846. [Google Scholar] [CrossRef] [PubMed]
- Quyang, Q. Sensitivity enhancement of transition metal dichalcogenides/silicon nanostructure-based surface plasmon resonance biosensor. Sci. Rep. 2016, 6, 28190. [Google Scholar]
- Sharma, A.K. Plasmonic biosensor for detection of hemoglobin concentra-tion in human blood: Design considerations. J. Appl. Phys. 2013, 114, 044701. [Google Scholar] [CrossRef]
- Brahmachari, K.; Ray, M. Modelling and performance analysis of a plasmonic biosensor comprising of silicon and chalcogenide materials for detecting refractive index variations of hemoglobin in near infrared. Optik 2016, 127, 3517–3522. [Google Scholar] [CrossRef]
Figure 1.
Schematic illustration of proposed quasiperiodic photonic crystal structure to analyze interface mode localization, (a) 3D representation and; (b) 2D representation of starting four elements.
Figure 1.
Schematic illustration of proposed quasiperiodic photonic crystal structure to analyze interface mode localization, (a) 3D representation and; (b) 2D representation of starting four elements.

Figure 2.
Transmission spectrum of proposed QPhC structure at normal incidence (a) for n = 6 QPhC structure; (b) corresponding angular dispersion characteristics. (c) n = 7 QPhC structure and (d) corresponding angular dispersion characteristics.
Figure 2.
Transmission spectrum of proposed QPhC structure at normal incidence (a) for n = 6 QPhC structure; (b) corresponding angular dispersion characteristics. (c) n = 7 QPhC structure and (d) corresponding angular dispersion characteristics.

Figure 3.
Transmission characteristics of the proposed structure at an oblique incidence angle for n = 6 QPhC: (a) angular dispersion characteristic, (b) angular reflectance characteristic, (c) normalized surface electric field confinement along with the length of the proposed structure, and (d) corresponding spectral electric field distribution and mode confinement.

Figure 4.
Transmission characteristics of the proposed structure at an oblique incidence angle for n = 7 QPhC: (a) angular dispersion characteristic, (b) angular reflectance characteristic, (c) normalized surface electric field confinement along with the length of the proposed structure for 750 nm operating wavelength at 45.4° incidence angle, and (d) normalized surface electric field confinement structure for 750 nm operating wavelength at 79.0° incidence angle.

Figure 5.
Sensitivity analysis of the n = 6 QPhC structure: (a) wavelength interrogation method and, (b) angular interrogation method.
Figure 5.
Sensitivity analysis of the n = 6 QPhC structure: (a) wavelength interrogation method and, (b) angular interrogation method.

Figure 6.
Comparative sensitivity analysis of both angular and wavelength interrogation methods.


Table 1.
The first six members of the considered QPhC design.
| S.N. | Fibonacci Series Member (Sn) | QPhC |
|---|---|---|
| 1 | S | A |
| 2 | S | AB |
| 3 | S | BA |
| 4 | S | BAB |
| 5 | S | BABBA |
| 6 | S | BABBABAB |
| 7 | S6 | BABBABABBABBA |
Table 2.
Summary of sensitivity analysis for both angular and wavelength interrogation.
| Analyte Refractive Index | Angular Interrogation (at 750 nm Wavelength) | Wavelength Interrogation (at 63.0° Incidence Angle) | ||||||
|---|---|---|---|---|---|---|---|---|
| Incidence Angle | Sensitivity (°/RIU) | FWHM (°) | FOM (1/RIU) | Operating Wavelength (nm) | Sensitivity (nm/RIU) | FWHM (nm) | FOM (1/RIU) | |
| 1.00 | 63.00° | - | 0.045 | - | 750.00 | - | 0.33 | - |
| 1.02 | 63.24° | 12.00 | 0.046 | 260.9 | 751.63 | 81.50 | 0.34 | 239.7 |
| 1.04 | 63.47° | 11.75 | 0.047 | 250.0 | 753.33 | 83.25 | 0.35 | 237.9 |
| 1.06 | 63.71° | 11.83 | 0.047 | 251.7 | 755.08 | 84.67 | 0.36 | 235.2 |
| 1.08 | 63.97° | 12.13 | 0.044 | 275.7 | 756.93 | 86.63 | 0.37 | 234.1 |
| 1.10 | 64.23° | 12.30 | 0.044 | 279.5 | 758.86 | 88.60 | 0.39 | 227.2 |
| 1.20 | 65.73° | 13.65 | 0.056 | 243.8 | 770.05 | 100.25 | 0.45 | 222.8 |
| 1.30 | 67.66° | 15.53 | 0.059 | 263.2 | 785.66 | 118.87 | 0.53 | 224.3 |
Publisher’s Note: MDPI stays neutral with regard to jurisdictional claims in published maps and institutional affiliations. |
© 2022 by the authors. Licensee MDPI, Basel, Switzerland. This article is an open access article distributed under the terms and conditions of the Creative Commons Attribution (CC BY) license (https://creativecommons.org/licenses/by/4.0/).
Share and Cite
MDPI and ACS Style
Goyal, A.K.; Massoud, Y. Interface Edge Mode Confinement in Dielectric-Based Quasi-Periodic Photonic Crystal Structure. Photonics 2022, 9, 676. https://doi.org/10.3390/photonics9100676
AMA Style
Goyal AK, Massoud Y. Interface Edge Mode Confinement in Dielectric-Based Quasi-Periodic Photonic Crystal Structure. Photonics. 2022; 9(10):676. https://doi.org/10.3390/photonics9100676
Chicago/Turabian StyleGoyal, Amit Kumar, and Yehia Massoud. 2022. "Interface Edge Mode Confinement in Dielectric-Based Quasi-Periodic Photonic Crystal Structure" Photonics 9, no. 10: 676. https://doi.org/10.3390/photonics9100676
Note that from the first issue of 2016, this journal uses article numbers instead of page numbers. See further details here.