Transcriptional Dynamics and Candidate Genes Involved in Pod Maturation of Common Bean (Phaseolus vulgaris L.)

 , , , , , , and
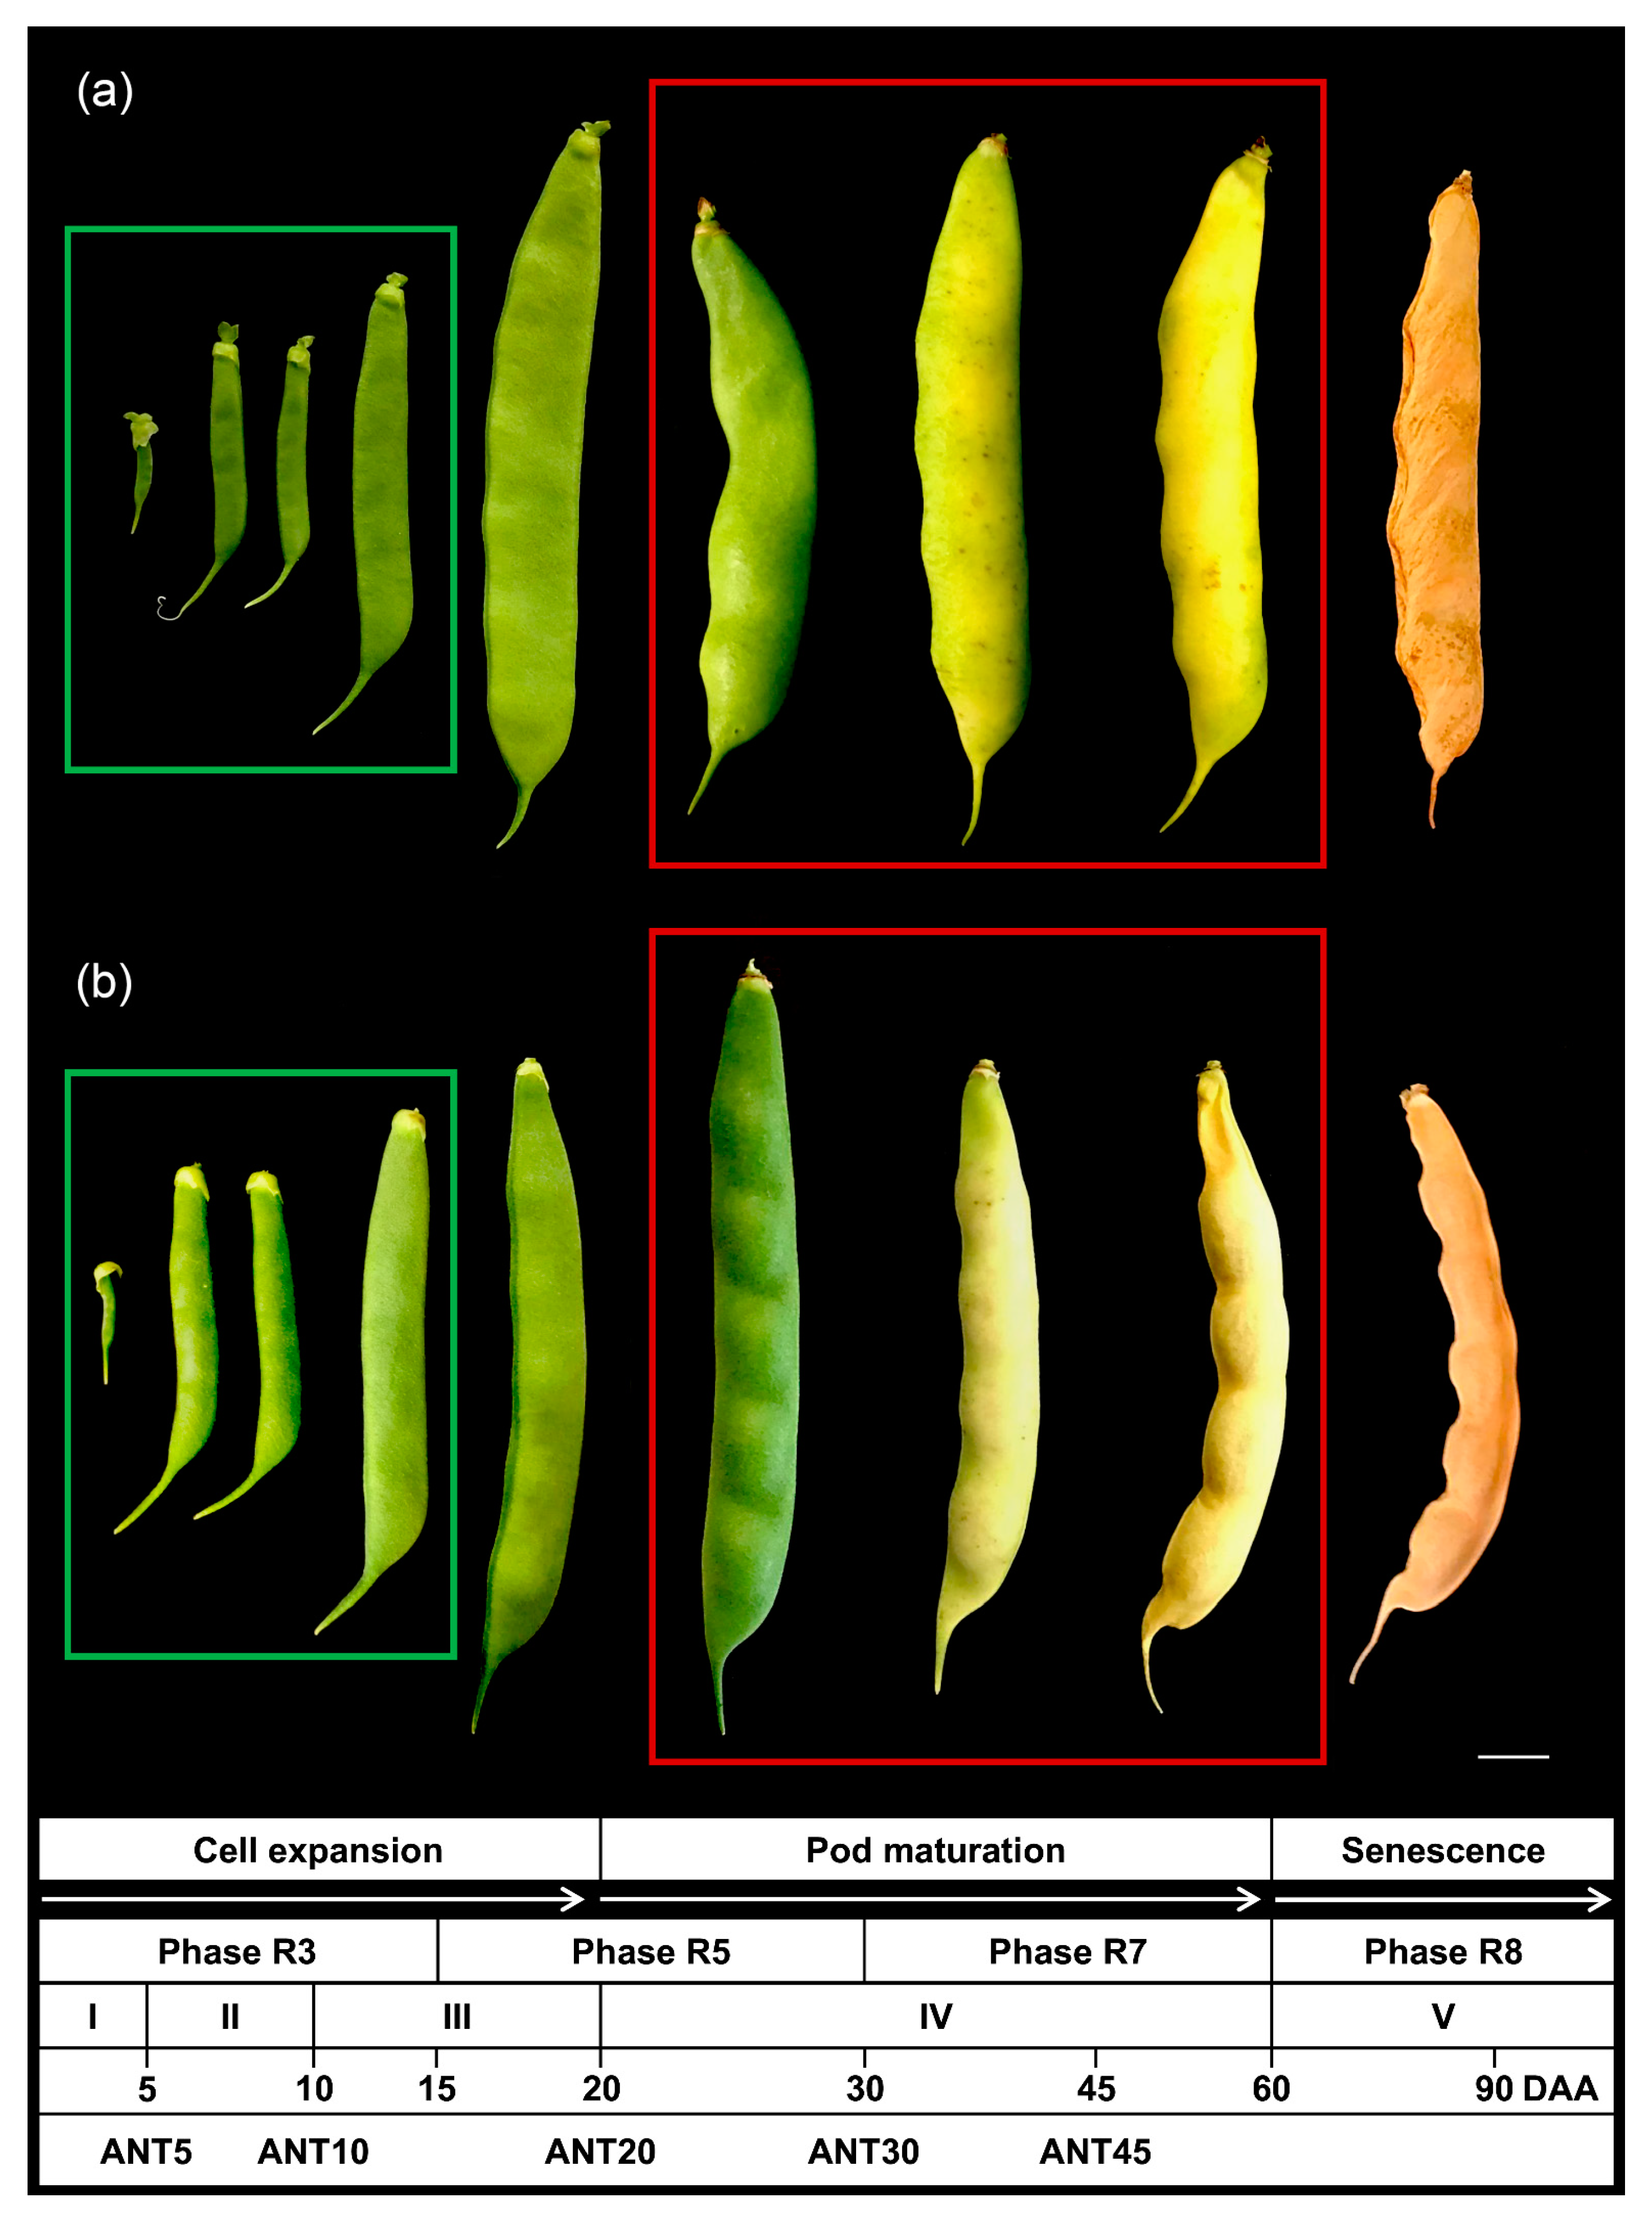
Abstract
:1. Introduction
2. Results
2.1. Pod Development of PMB0225 and PHA1037 Common Bean Accessions
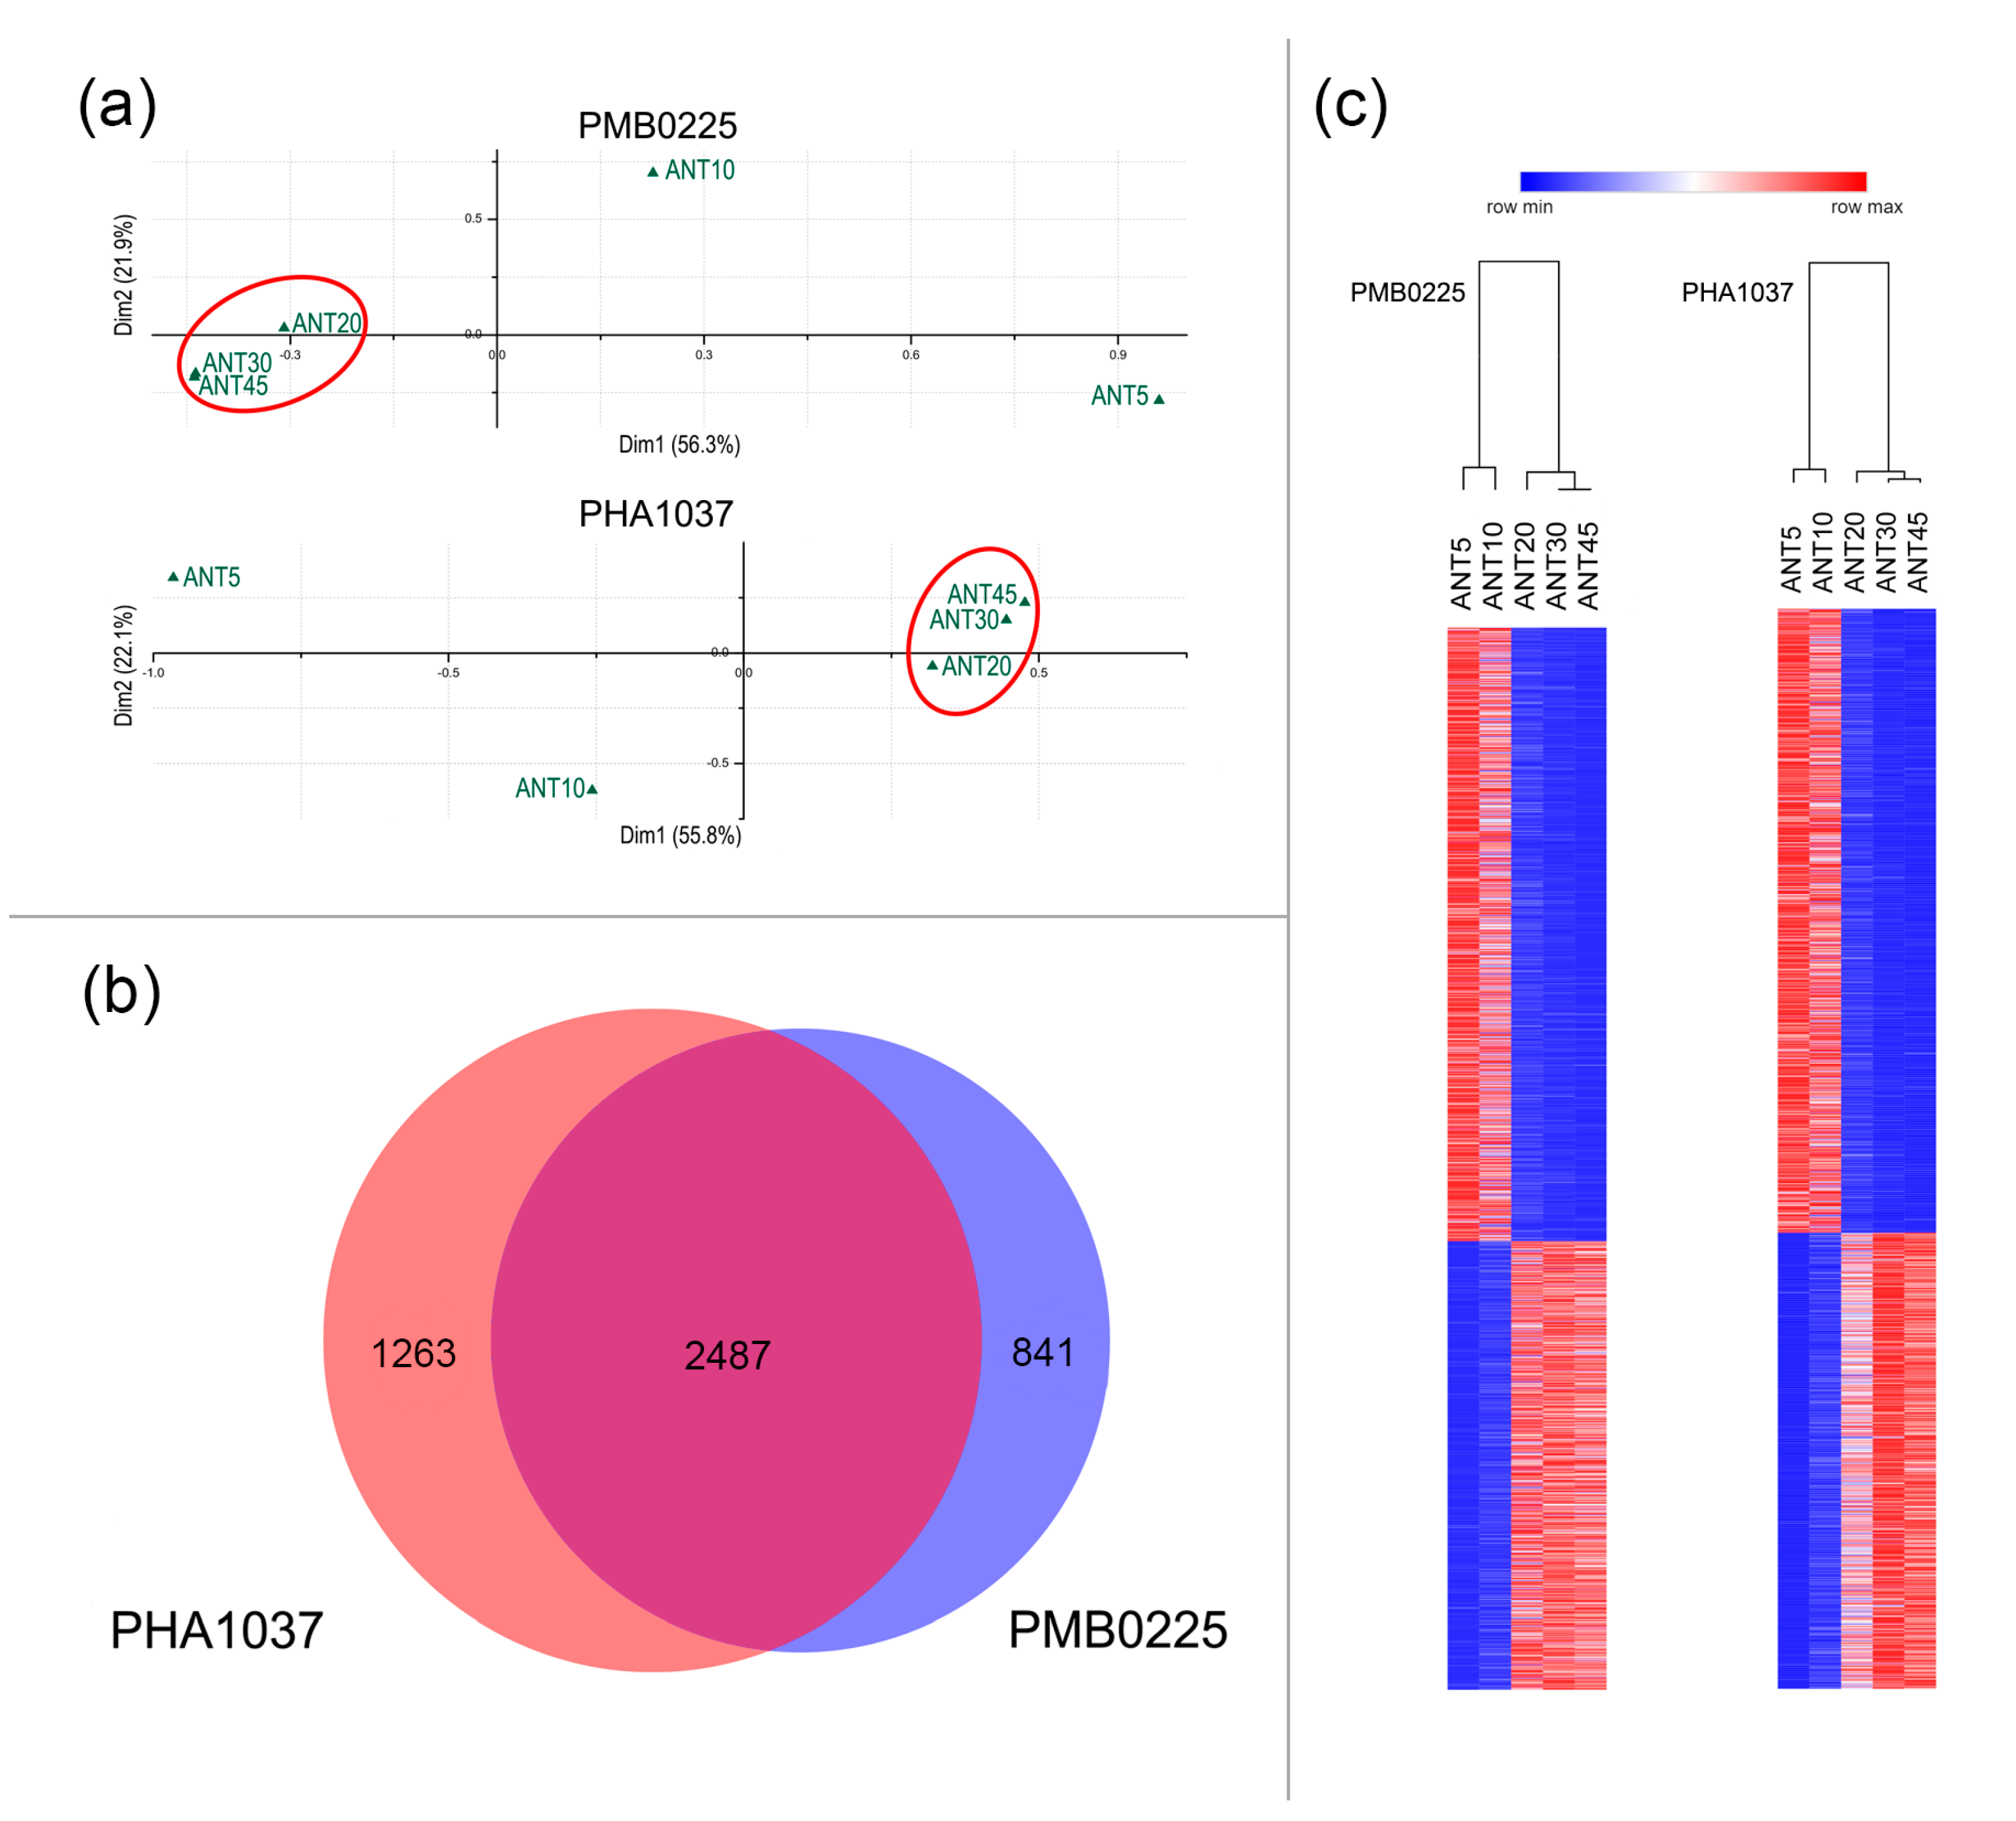
2.2. Gene Expression Changes Occurring during Pod Maturation of Common Bean
2.3. Comparative Analysis of Pod Maturation Process in Common Bean and Arabidopsis
2.4. Identification of Putative Transcriptional Regulators Involved in Pod Maturation
3. Discussion
3.1. Transcriptome Analyses Reveal Pod Maturation Specific Genes of Common Bean
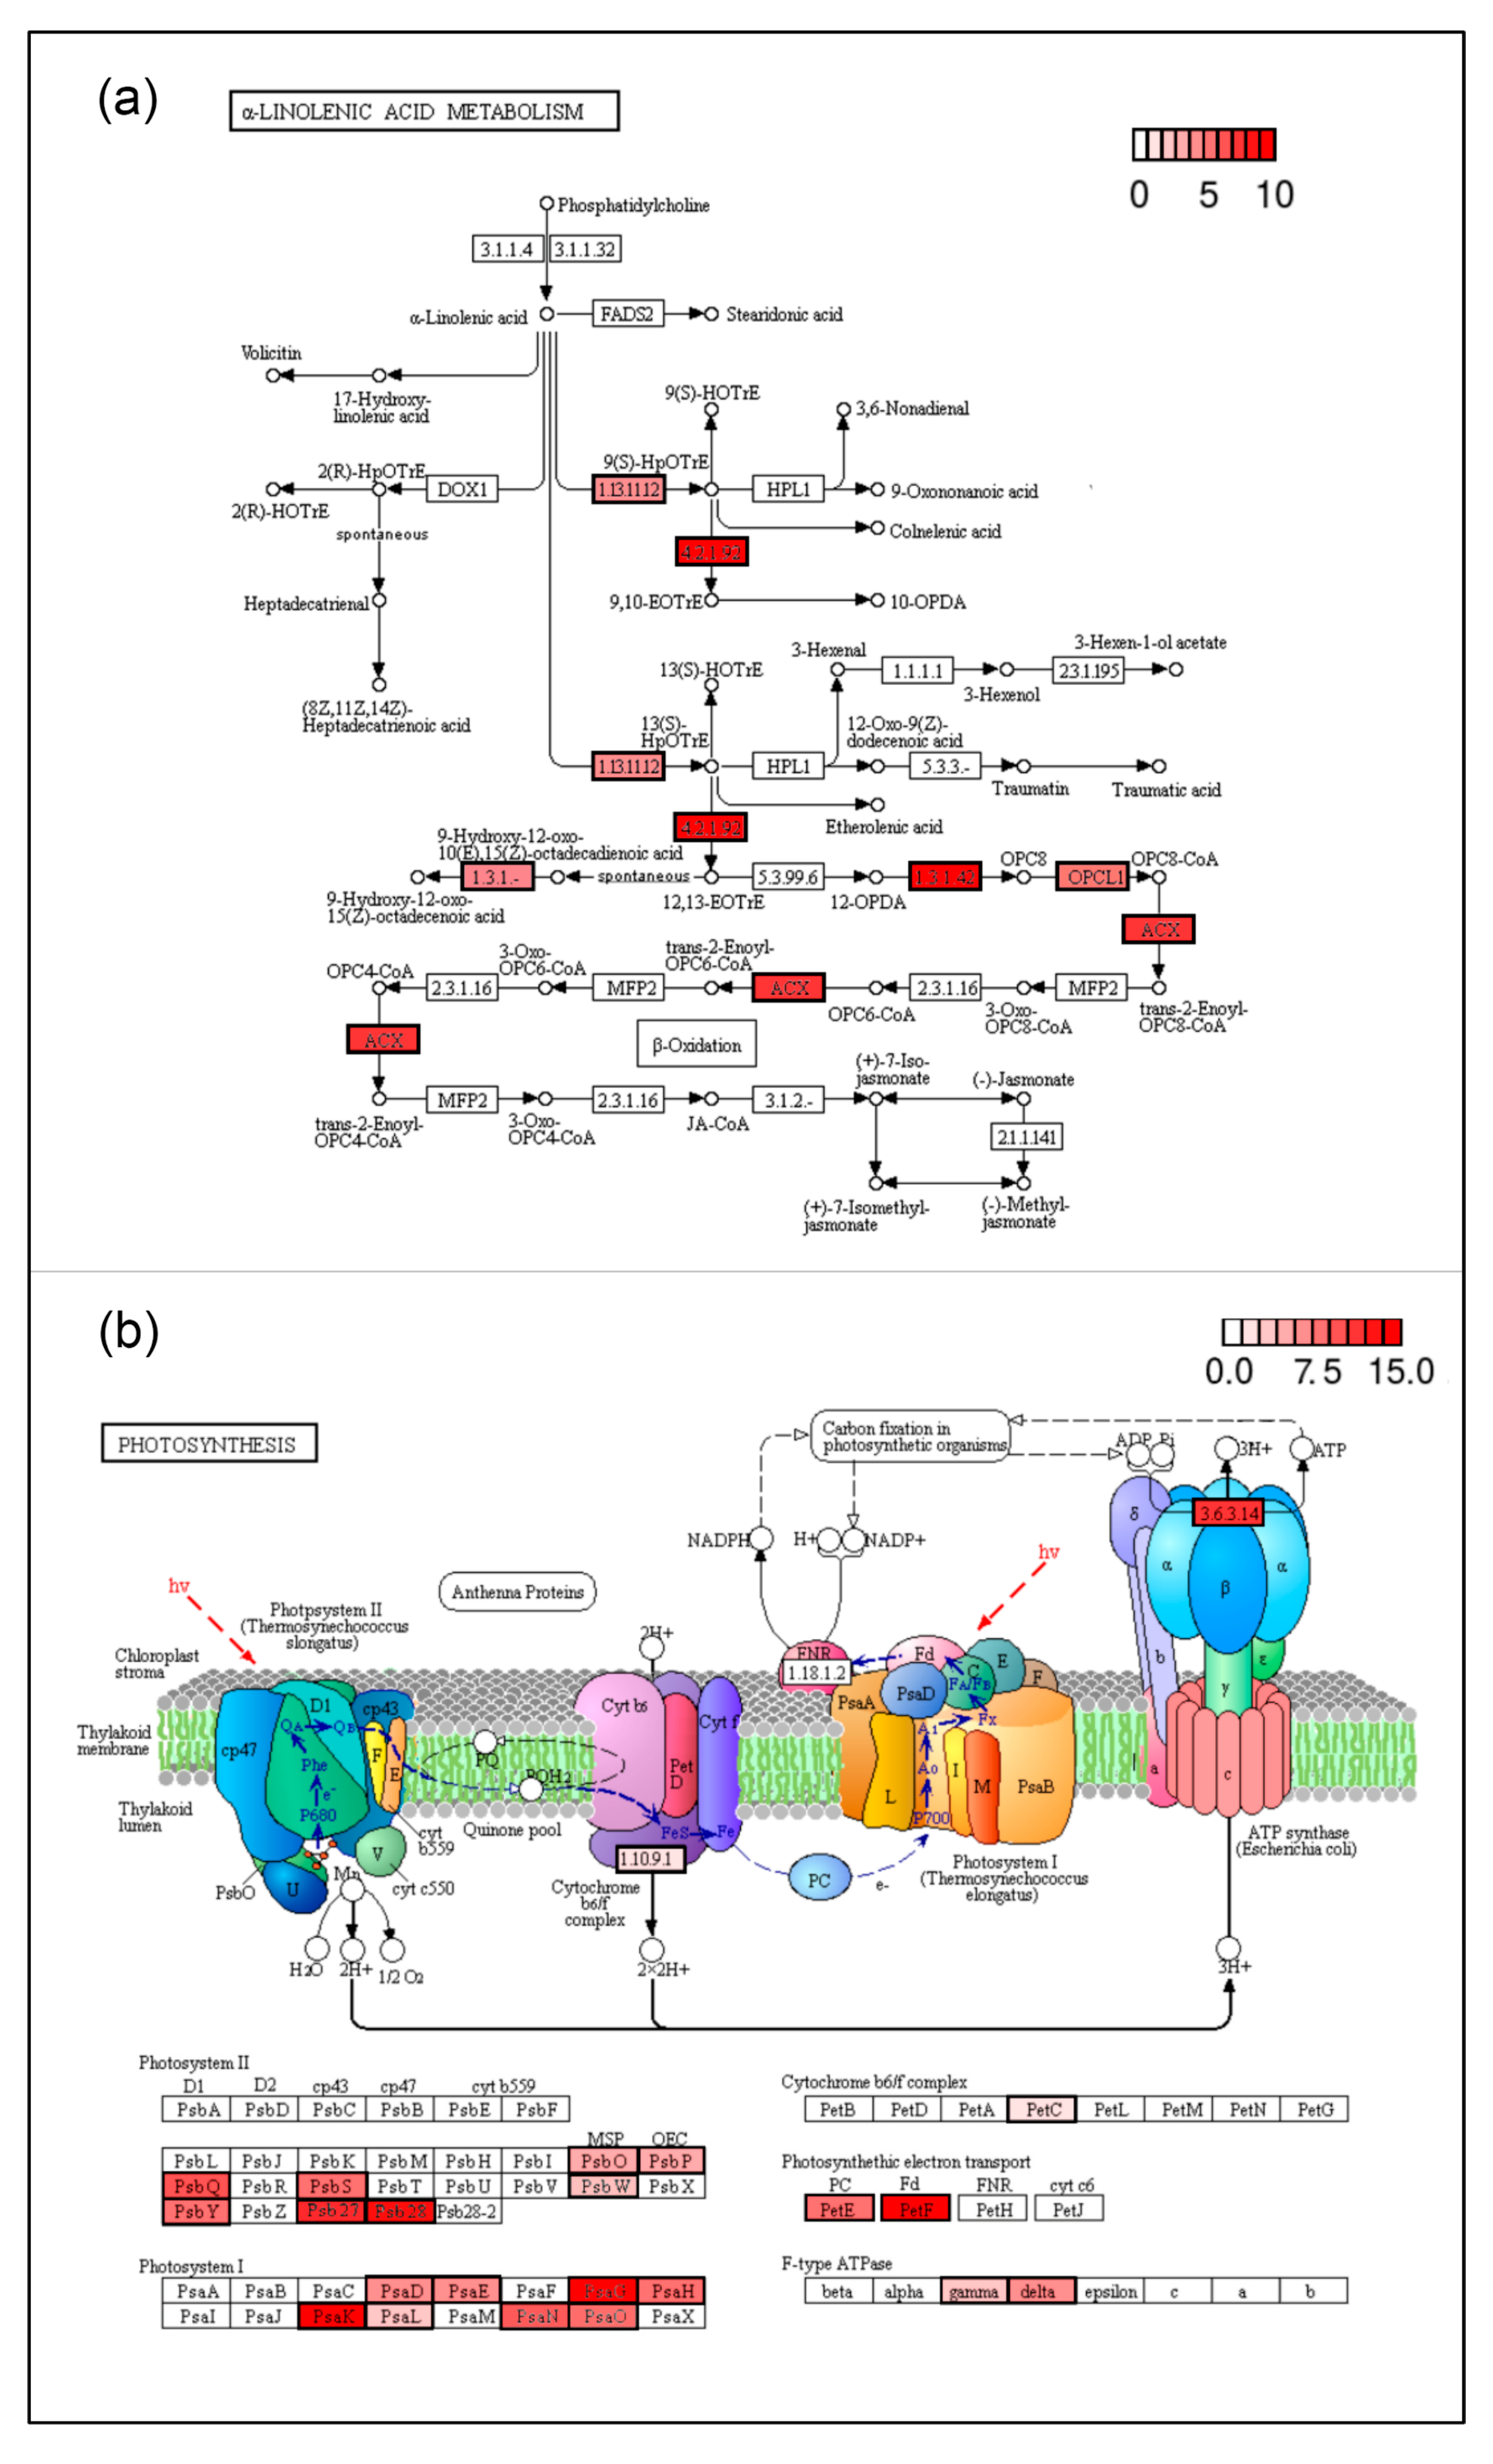
3.2. Pod Maturation Is Regulated at Translational Level and Involves Important Expression Changes of Photosynthesis-Related Genes
3.3. Genes Regulating Metabolism Pathways Modify Their Expression Pattern during Pod Maturation
4. Materials and Methods
4.1. Plant Material and Sample Collection
4.2. RNA Extraction, Library Construction and RNA-Seq
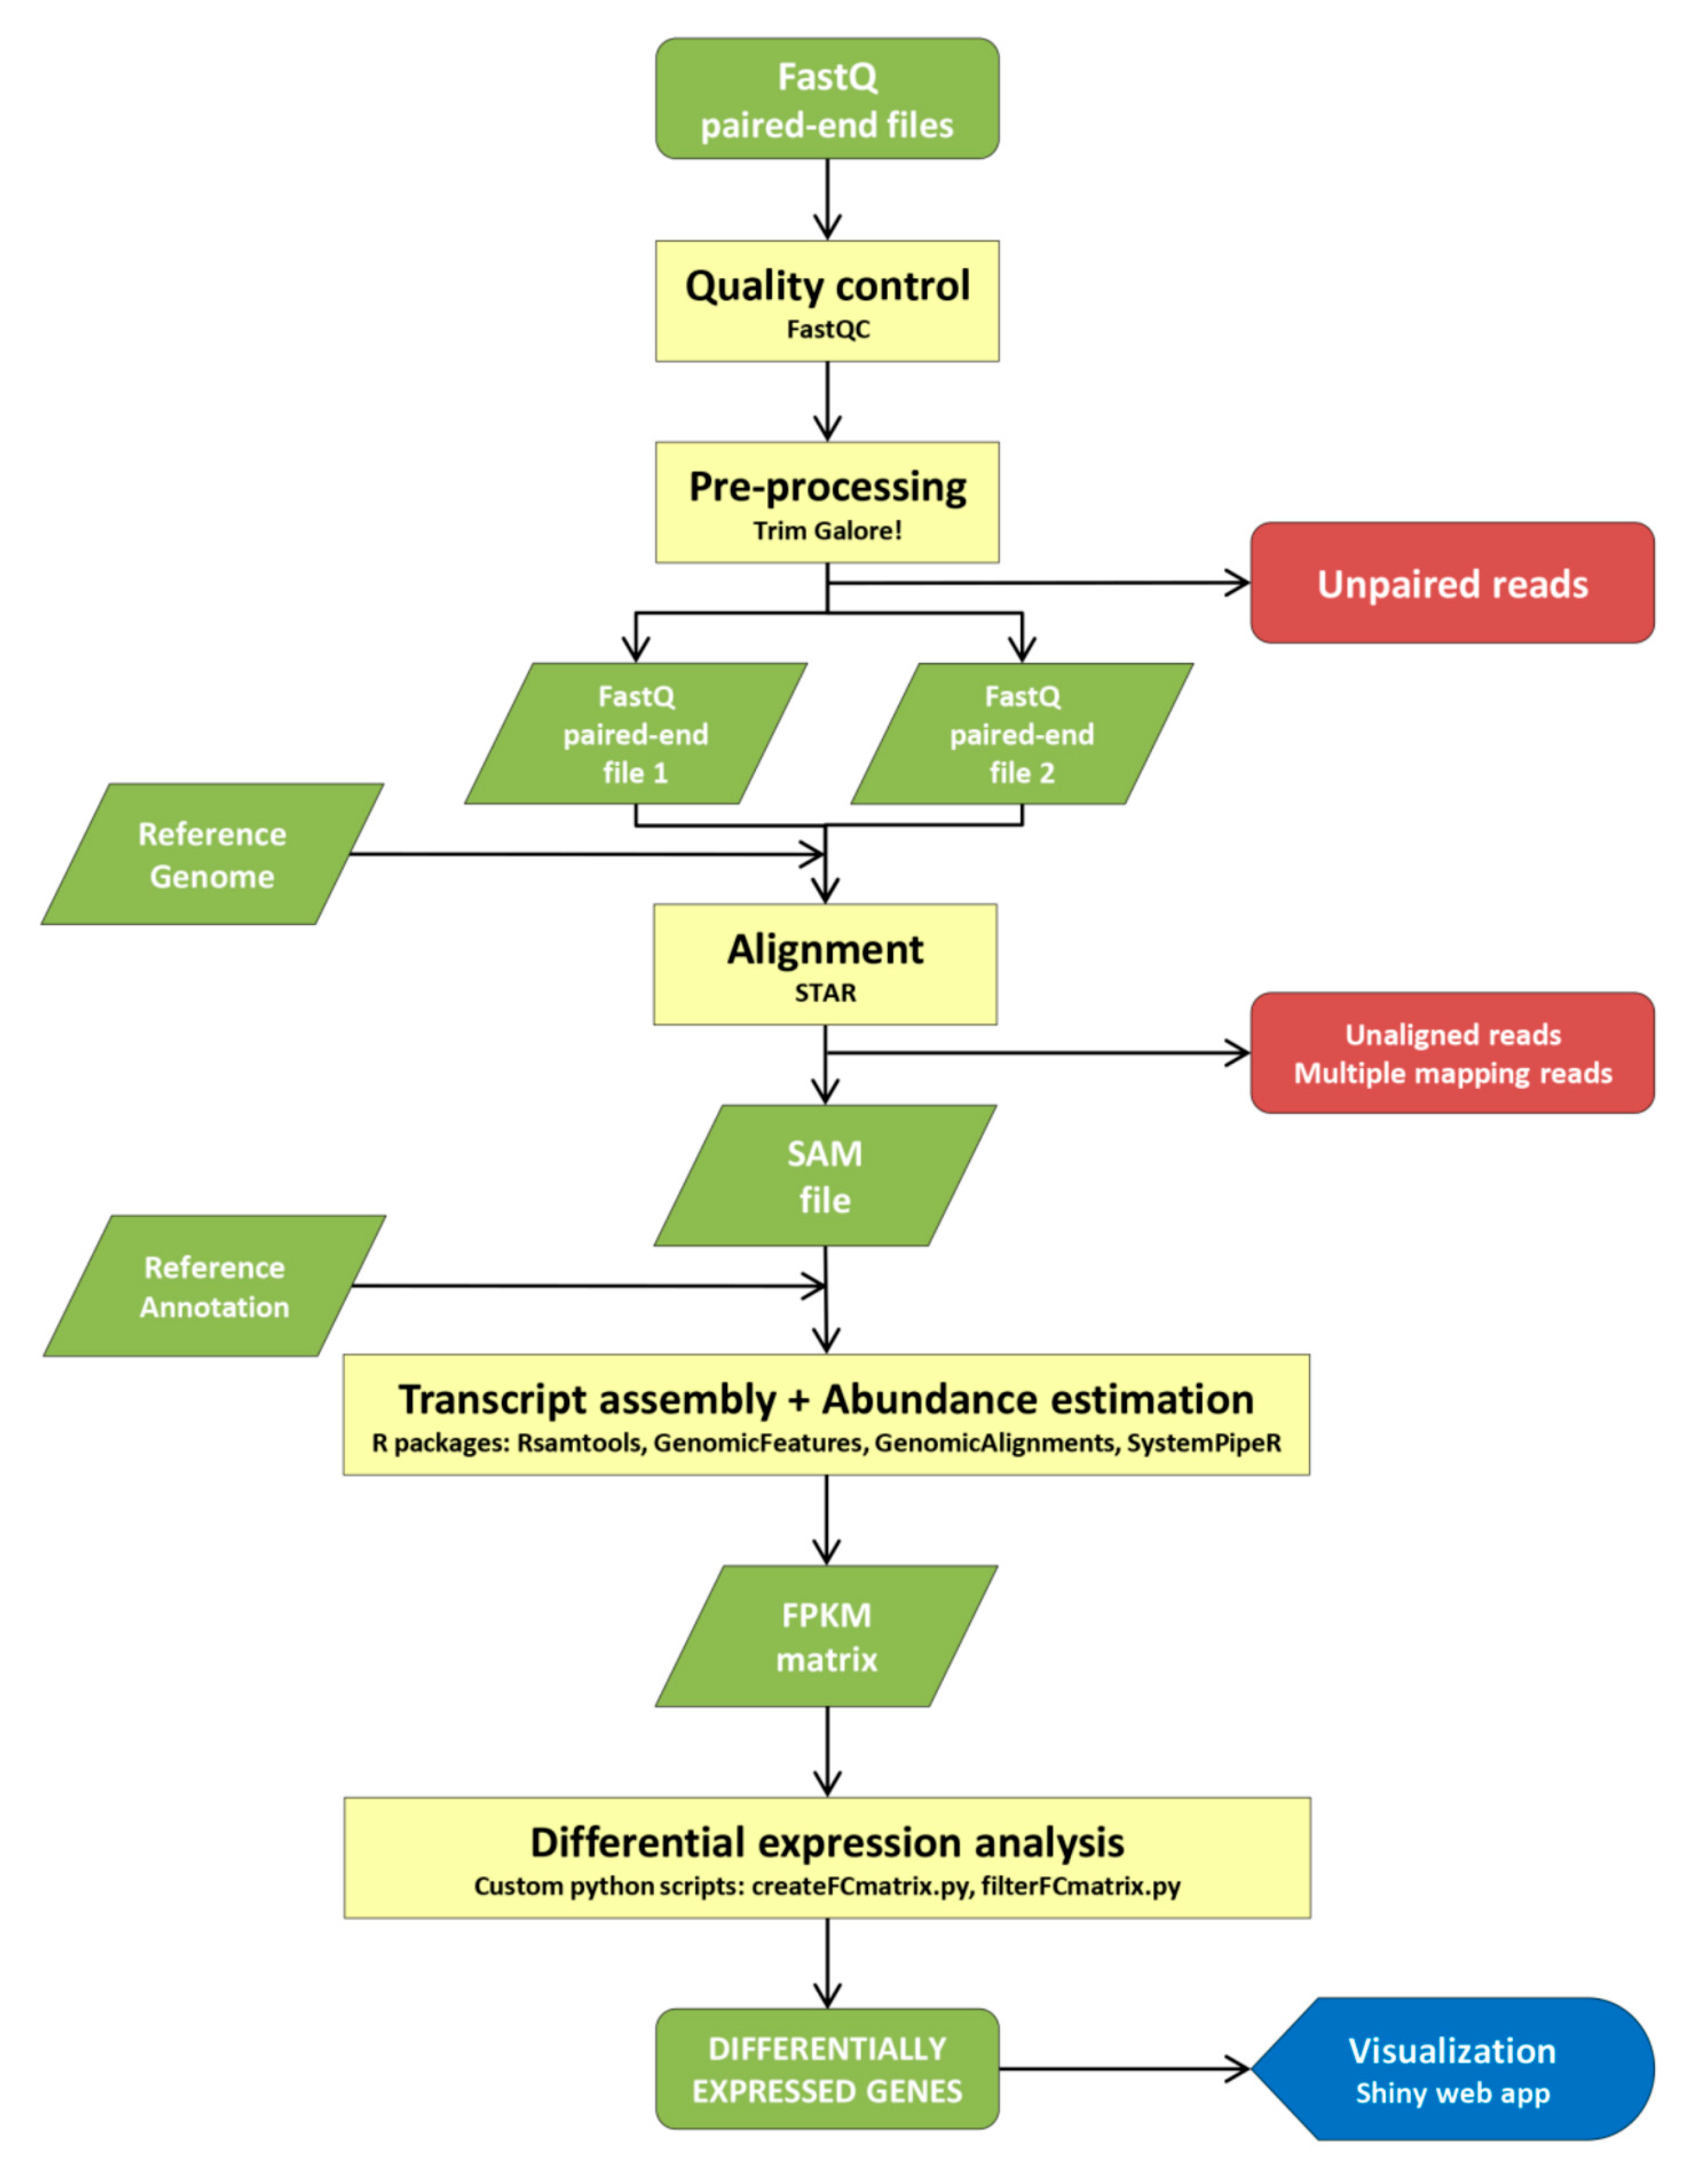
4.3. RNA-Seq Bioinformatics Protocol
4.4. Determination of Differential Gene Expression
4.5. Multivariate Analysis
4.6. Functional Annotation and Pathway Enrichment
4.7. Comparative Analysis of Common Bean and Arabidopsis Fruit Maturation Genes
4.8. Enrichment Analysis of Transcription Factor Binding Sites (TFBSs)
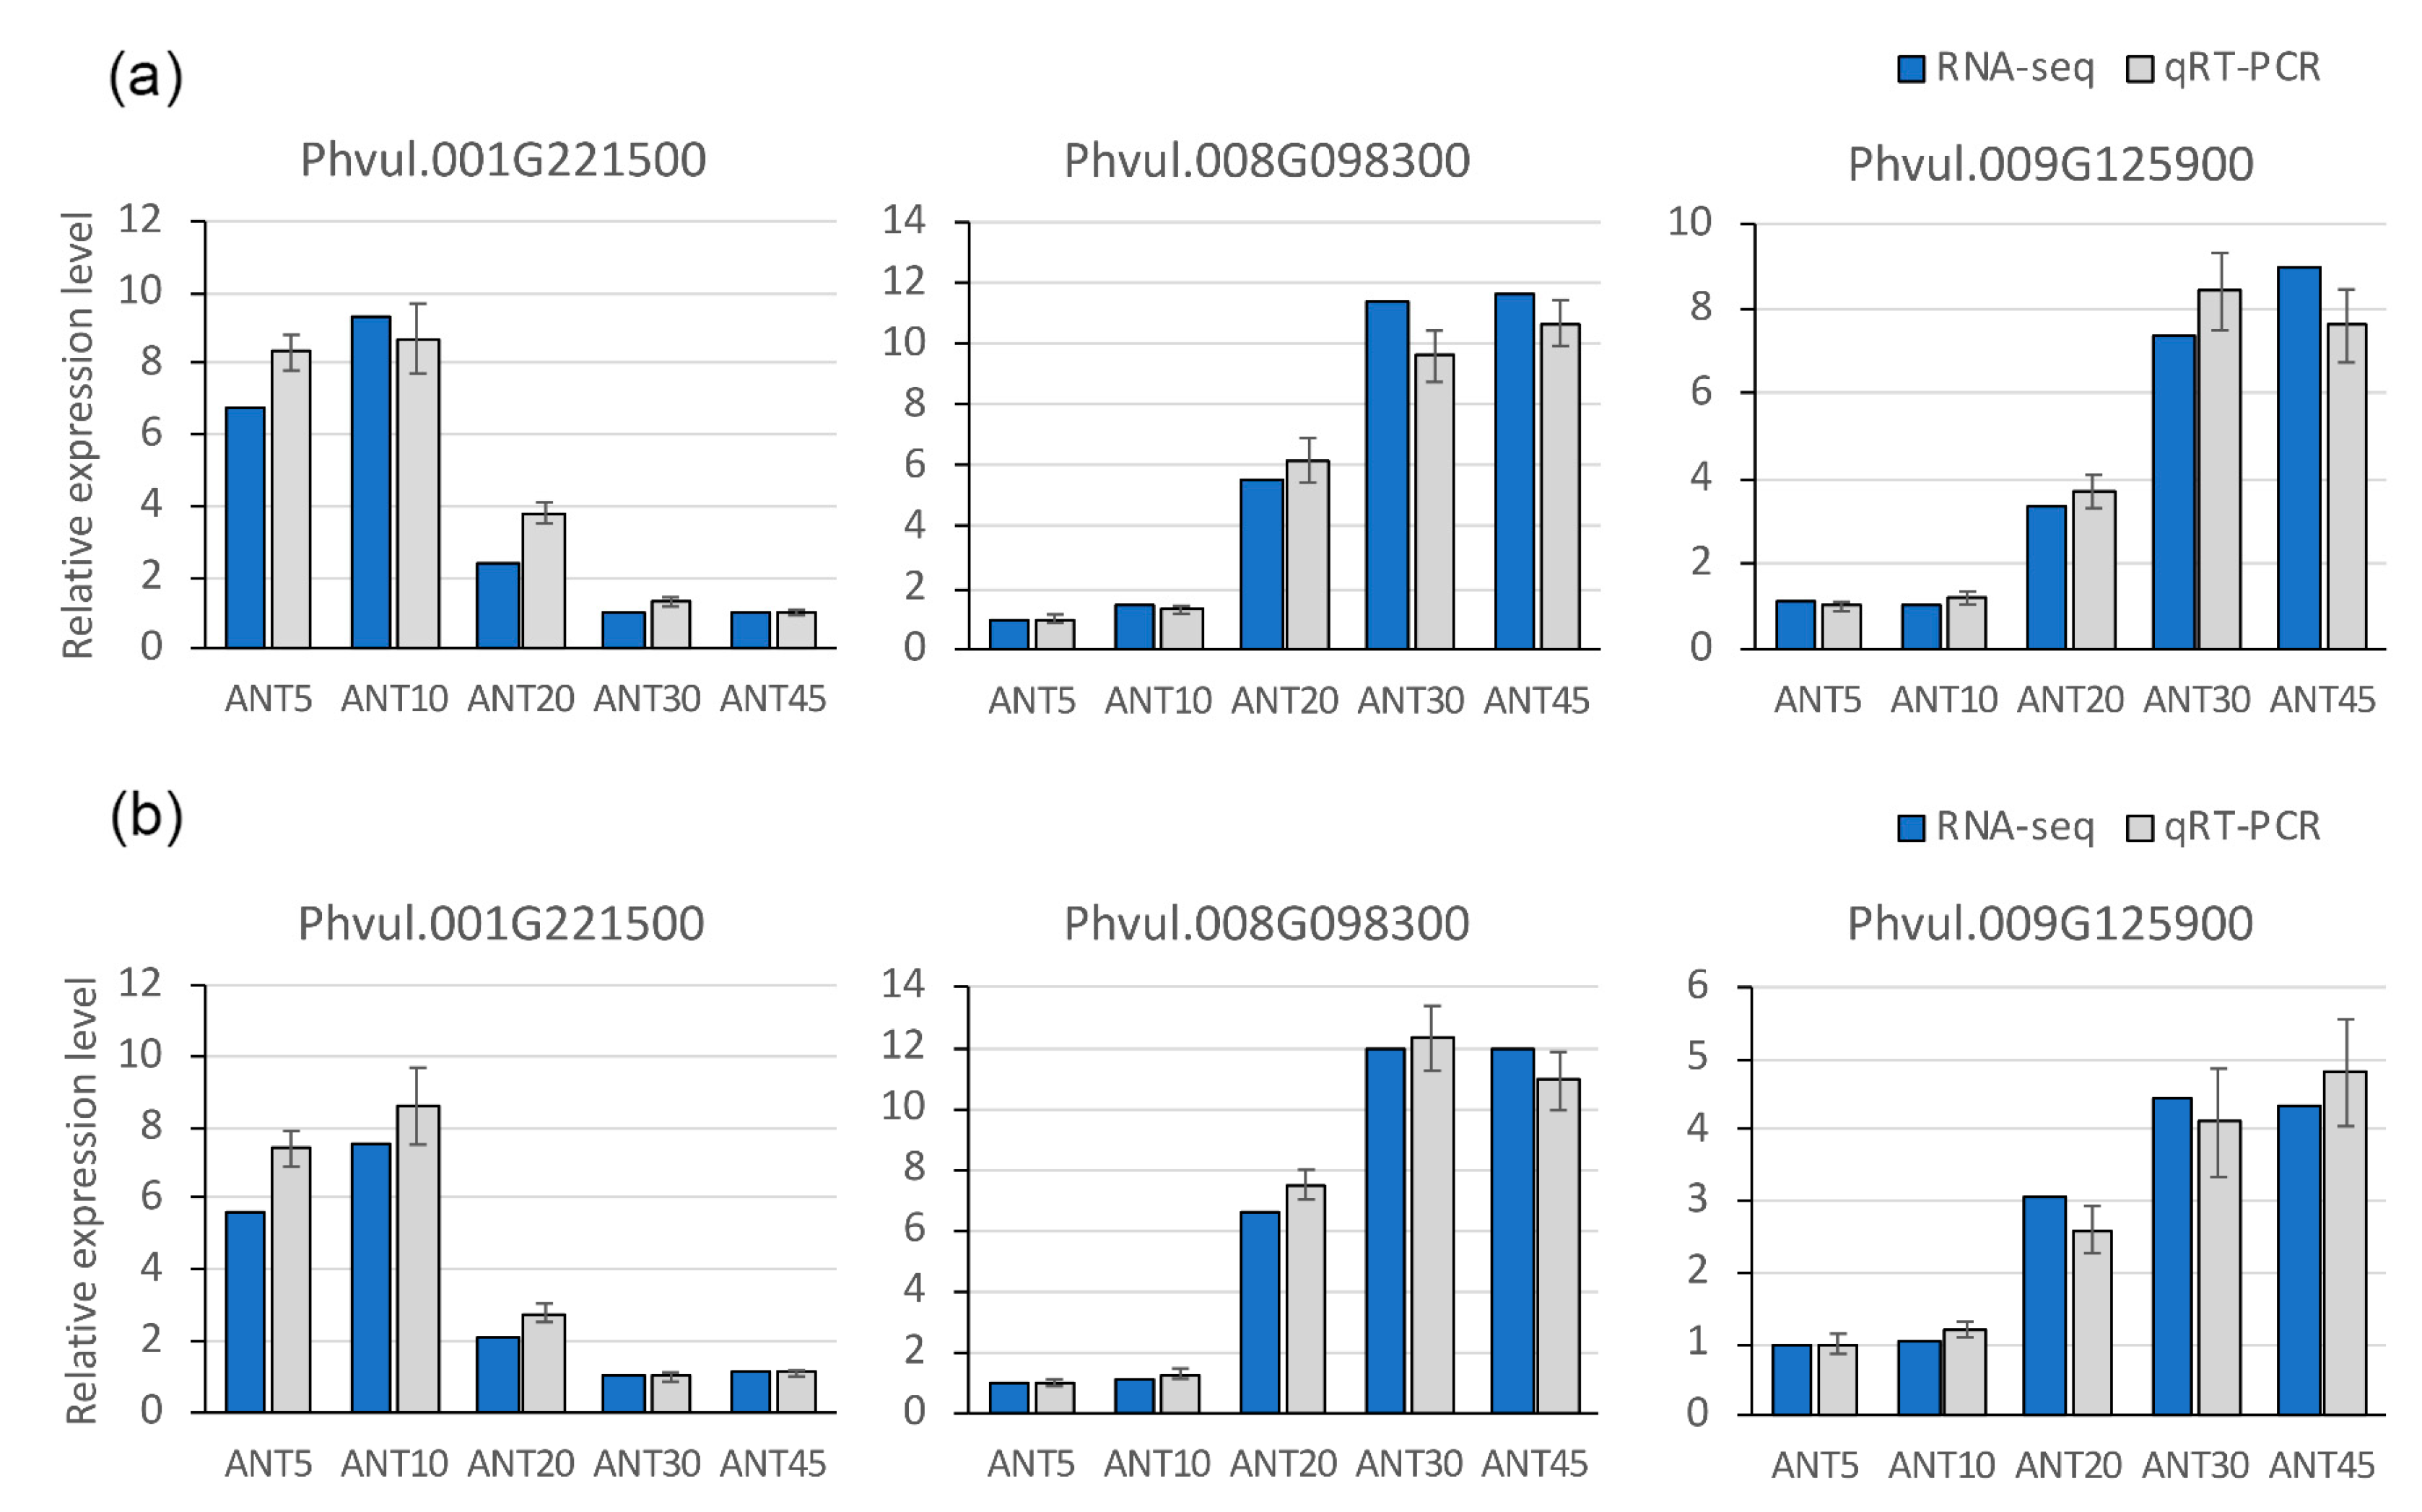
4.9. Quantitative Real-Time PCR (qRT-PCR)
5. Conclusions
Supplementary Materials
Author Contributions
Funding
Acknowledgments
Conflicts of Interest
References
- Seymour, G.B.; Østergaard, L.; Chapman, N.H.; Knapp, S.; Martin, C. Fruit development and ripening. Annu. Rev. Plant Biol. 2013, 64, 219–241. [Google Scholar] [CrossRef] [PubMed] [Green Version]
- Gómez, M.D.; Vera-Sirera, F.; Pérez-Amador, M.A. Molecular programme of senescence in dry and fleshy fruits. J. Exp. Bot. 2014, 65, 4515–4526. [Google Scholar] [CrossRef] [PubMed] [Green Version]
- Karlova, R.; Chapman, N.; David, K.; Angenent, G.C.; Seymour, G.B.; de Maagd, R.A. Transcriptional control of fleshy fruit development and ripening. J. Exp. Bot. 2014, 65, 4527–4541. [Google Scholar] [CrossRef] [Green Version]
- Pattison, R.J.; Csukasi, F.; Zheng, Y.; Fei, Z.; van der Knaap, E.; Catalá, C. Comprehensive tissue-specific transcriptome analysis reveals distinct regulatory programs during early tomato fruit development. Plant Physiol. 2015, 168, 1684–1701. [Google Scholar] [CrossRef] [PubMed] [Green Version]
- Zhang, S.; Xu, M.; Qiu, Z.; Wang, K.; Du, Y.; Gu, L.; Cui, X. Spatiotemporal transcriptome provides insights into early fruit development of tomato (Solanum lycopersicum). Sci. Rep. 2016, 6, 23173. [Google Scholar] [CrossRef] [PubMed] [Green Version]
- Ortiz-Ramírez, C.I.; Plata-Arboleda, S.; Pabón-Mora, N. Evolution of genes associated with gynoecium patterning and fruit development in Solanaceae. Ann. Bot. 2018, 121, 1211–1230. [Google Scholar] [CrossRef] [PubMed]
- Gillaspy, G.; Ben-David, H.; Gruissem, W. Fruits: A developmental perspective. Plant Cell 1993, 5, 1439–1451. [Google Scholar] [CrossRef] [Green Version]
- Eckhardt, U.; Grimm, B.; Hörtensteiner, S. Recent advances in chlorophyll biosynthesis and breakdown in higher plants. Plant Mol. Biol. 2004, 56, 1–14. [Google Scholar] [CrossRef]
- Klee, H.J.; Giovannoni, J.J. Genetics and control of tomato fruit ripening and quality attributes. Annu. Rev. Genet. 2011, 45, 41–59. [Google Scholar] [CrossRef]
- Hörtensteiner, S. Update on the biochemistry of chlorophyll breakdown. Plant Mol. Biol. 2013, 82, 505–517. [Google Scholar] [CrossRef] [PubMed]
- Ohmiya, A.; Hirashima, M.; Yagi, M.; Tanase, K.; Yamamizo, C. Identification of genes associated with chlorophyll accumulation in flower petals. PLoS ONE 2014, 9, e113738. [Google Scholar] [CrossRef] [PubMed]
- Ueda, J.; Kato, J.; Yamane, H.; Takahashi, N. Inhibitory effect of methyl jasmonate and its related compounds on kinetin-induced retardation of oat leaf senescence. Physiol. Plantarum 1981, 52, 305–309. [Google Scholar] [CrossRef]
- Creelman, R.A.; Mullet, J.E. Biosynthesis and action of jasmonates in plants. Annu. Rev. Plant Physiol. Plant Mol. Biol. 1997, 48, 355–381. [Google Scholar] [CrossRef] [PubMed] [Green Version]
- Wasternack, C. Jasmonates: An update on biosynthesis, signal transduction and action in plant stress response, growth and development. Ann. Bot. 2007, 100, 681–697. [Google Scholar] [CrossRef] [Green Version]
- Balbi, V.; Devoto, A. Jasmonate signalling network in Arabidopsis thaliana: Crucial regulatory nodes and new physiological scenarios. New Phytol. 2008, 177, 301–318. [Google Scholar] [CrossRef]
- Cuello, J. Differential effects of linolenic acid and methyl jasmonate on the degradation of chlorophylls and carotenoids of senescing barley leaves. Acta Bot. Neerl. 1997, 46, 303–314. [Google Scholar] [CrossRef]
- Bouvier, F.; Backhaus, R.A.; Camara, B. Induction and control of chromoplast-specific carotenoid genes by oxidative stress. J. Biol. Chem. 1998, 273, 30651–30659. [Google Scholar] [CrossRef] [Green Version]
- Jiménez, A.; Gómez, J.M.; Navarro, E.; Sevilla, F. Changes in the antioxidative systems in mitochondria during ripening of pepper fruits. Plant Physiol. Biochem. 2002, 40, 515–520. [Google Scholar] [CrossRef]
- Pilati, S.; Perazzolli, M.; Malossini, A.; Cestaro, A.; Demattè, L.; Fontana, P.; Dal Ri, A.; Viola, R.; Velasco, R.; Moser, C. Genome-wide transcriptional analysis of grapevine berry ripening reveals a set of genes similarly modulated during three seasons and the occurrence of an oxidative burst at vèraison. BMC Genom. 2007, 8, 428. [Google Scholar] [CrossRef] [Green Version]
- Bennett, E.J.; Roberts, J.A.; Wagstaff, C. The role of the pod in seed development: Strategies for manipulating yield. New Phytol. 2011, 190, 838–885. [Google Scholar] [CrossRef] [Green Version]
- Biale, J.B. Growth, maturation, and senescence in fruits: Recent knowledge on growth regulation and on biological oxidations has been applied to studies with fruits. Science 1964, 146, 880–888. [Google Scholar] [CrossRef] [PubMed]
- Setia, N.; Malik, C.P. Changes in some enzyme of carbohydrate metabolism in developing pod and seed of chickpea (Cicer arietinum). Phyton 1985, 25, 93–99. [Google Scholar]
- Setia, R.C.; Setia, N.; Malik, C.P. The podwall structure and function in relation to seed development in some legumes. Phyton 1987, 27, 205–220. [Google Scholar]
- Schmutz, J.; McClean, P.; Mamidi, S.; Wu, G.A.; Cannon, S.B.; Grimwood, J.; Jenkins, J.; Shu, S.; Song, Q.; Chavarro, C.; et al. A reference genome for common bean and genome-wide analysis of dual domestications. Nat. Genet. 2014, 46, 707–713. [Google Scholar] [CrossRef] [Green Version]
- Bitocchi, E.; Rau, D.; Bellucci, E.; Rodriguez, M.; Murgia, M.L.; Gioia, T.; Santo, D.; Nanni, L.; Attene, G.; Papa, R. Beans (Phaseolus ssp.) as a model for understanding crop evolution. Front. Plant Sci. 2017, 8, 722. [Google Scholar] [CrossRef] [Green Version]
- Durán, L.A.; Blair, M.W.; Giraldo, M.C.; Macchiavelli, R.; Prophete, E.; Nin, J.C.; Beaver, J.S. Morphological and molecular characterization of common bean landraces and cultivars from the Caribbean. Crop Sci. 2005, 45, 1320–1328. [Google Scholar] [CrossRef]
- Rendón-Anaya, M.; Montero-Vargas, J.M.; Saburido-Álvarez, S.; Vlasova, A.; Capella-Gutierrez, S.; Ordaz-Ortiz, J.J.; Aguilar, O.M.; Vianello-Brondani, R.P.; Santalla, M.; Delaye, L.; et al. Genomic history of the origin and domestication of common bean unveils its closest sister species. Genome Biol. 2017, 18, 60. [Google Scholar] [CrossRef] [Green Version]
- International Center for Tropical Agricultrue (CIAT). Bean Program Annual Report 1985; CIAT Program Annual Reports: Cali, Colombia, 1986. [Google Scholar]
- Hagerty, C.H.; Cuesta-Marcos, A.; Cregan, P.; Song, Q.; McClean, P.; Myers, J.R. Mapping snap bean pod and color traits, in a dry bean × snap bean recombinant inbred population. J. Am. Soc. Hortic. Sci. 2016, 141, 131–138. [Google Scholar] [CrossRef] [Green Version]
- Di Vittori, V.; Gioia, T.; Rodriguez, M.; Bellucci, E.; Bitocchi, E.; Nanni, L.; Attene, G.; Rau, D.; Papa, R. Convergent evolution of the seed shattering trait. Genes (Basel) 2019, 10, 68. [Google Scholar] [CrossRef] [Green Version]
- Hrdlickova, R.; Toloue, M.; Tian, B. RNA-Seq methods for transcriptome analysis. Wiley Interdiscip. Rev. RNA 2017, 8. [Google Scholar] [CrossRef] [Green Version]
- Stolle-Smits, T.; Beekhuizen, J.G.; Kok, M.T.; Pijnenburg, M.; Recourt, K.; Derksen, J.; Voragen, A.G. Changes in cell wall polysaccharides of green bean pods during development. Plant Physiol. 1999, 121, 363–372. [Google Scholar] [CrossRef] [PubMed] [Green Version]
- Clavijo Michelangeli, J.A.; Bhakta, M.; Gezan, S.A.; Boote, K.J.; Vallejos, C.E. From flower to seed: Identifying phenological markers and reliable growth functions to model reproductive development in the common bean (Phaseolus vulgaris L.). Plant Cell Environ. 2013, 36, 2046–2058. [Google Scholar] [CrossRef] [PubMed]
- Benzecri, J. Correspondence Analysis Handbook; Marcel Dekker: New York, NY, USA, 1992. [Google Scholar]
- Kassambara, A. Practical Guide to Principal Component Methods in R; Createspace Independent Publishing Platform: Charleston, SC, USA, 2017. [Google Scholar]
- Gómez-Martín, C. RNAseqScripts in Python; GitHub Inc., 2017; Available online: https://github.com/cris12gm/rnaseqScripts (accessed on 26 February 2020).
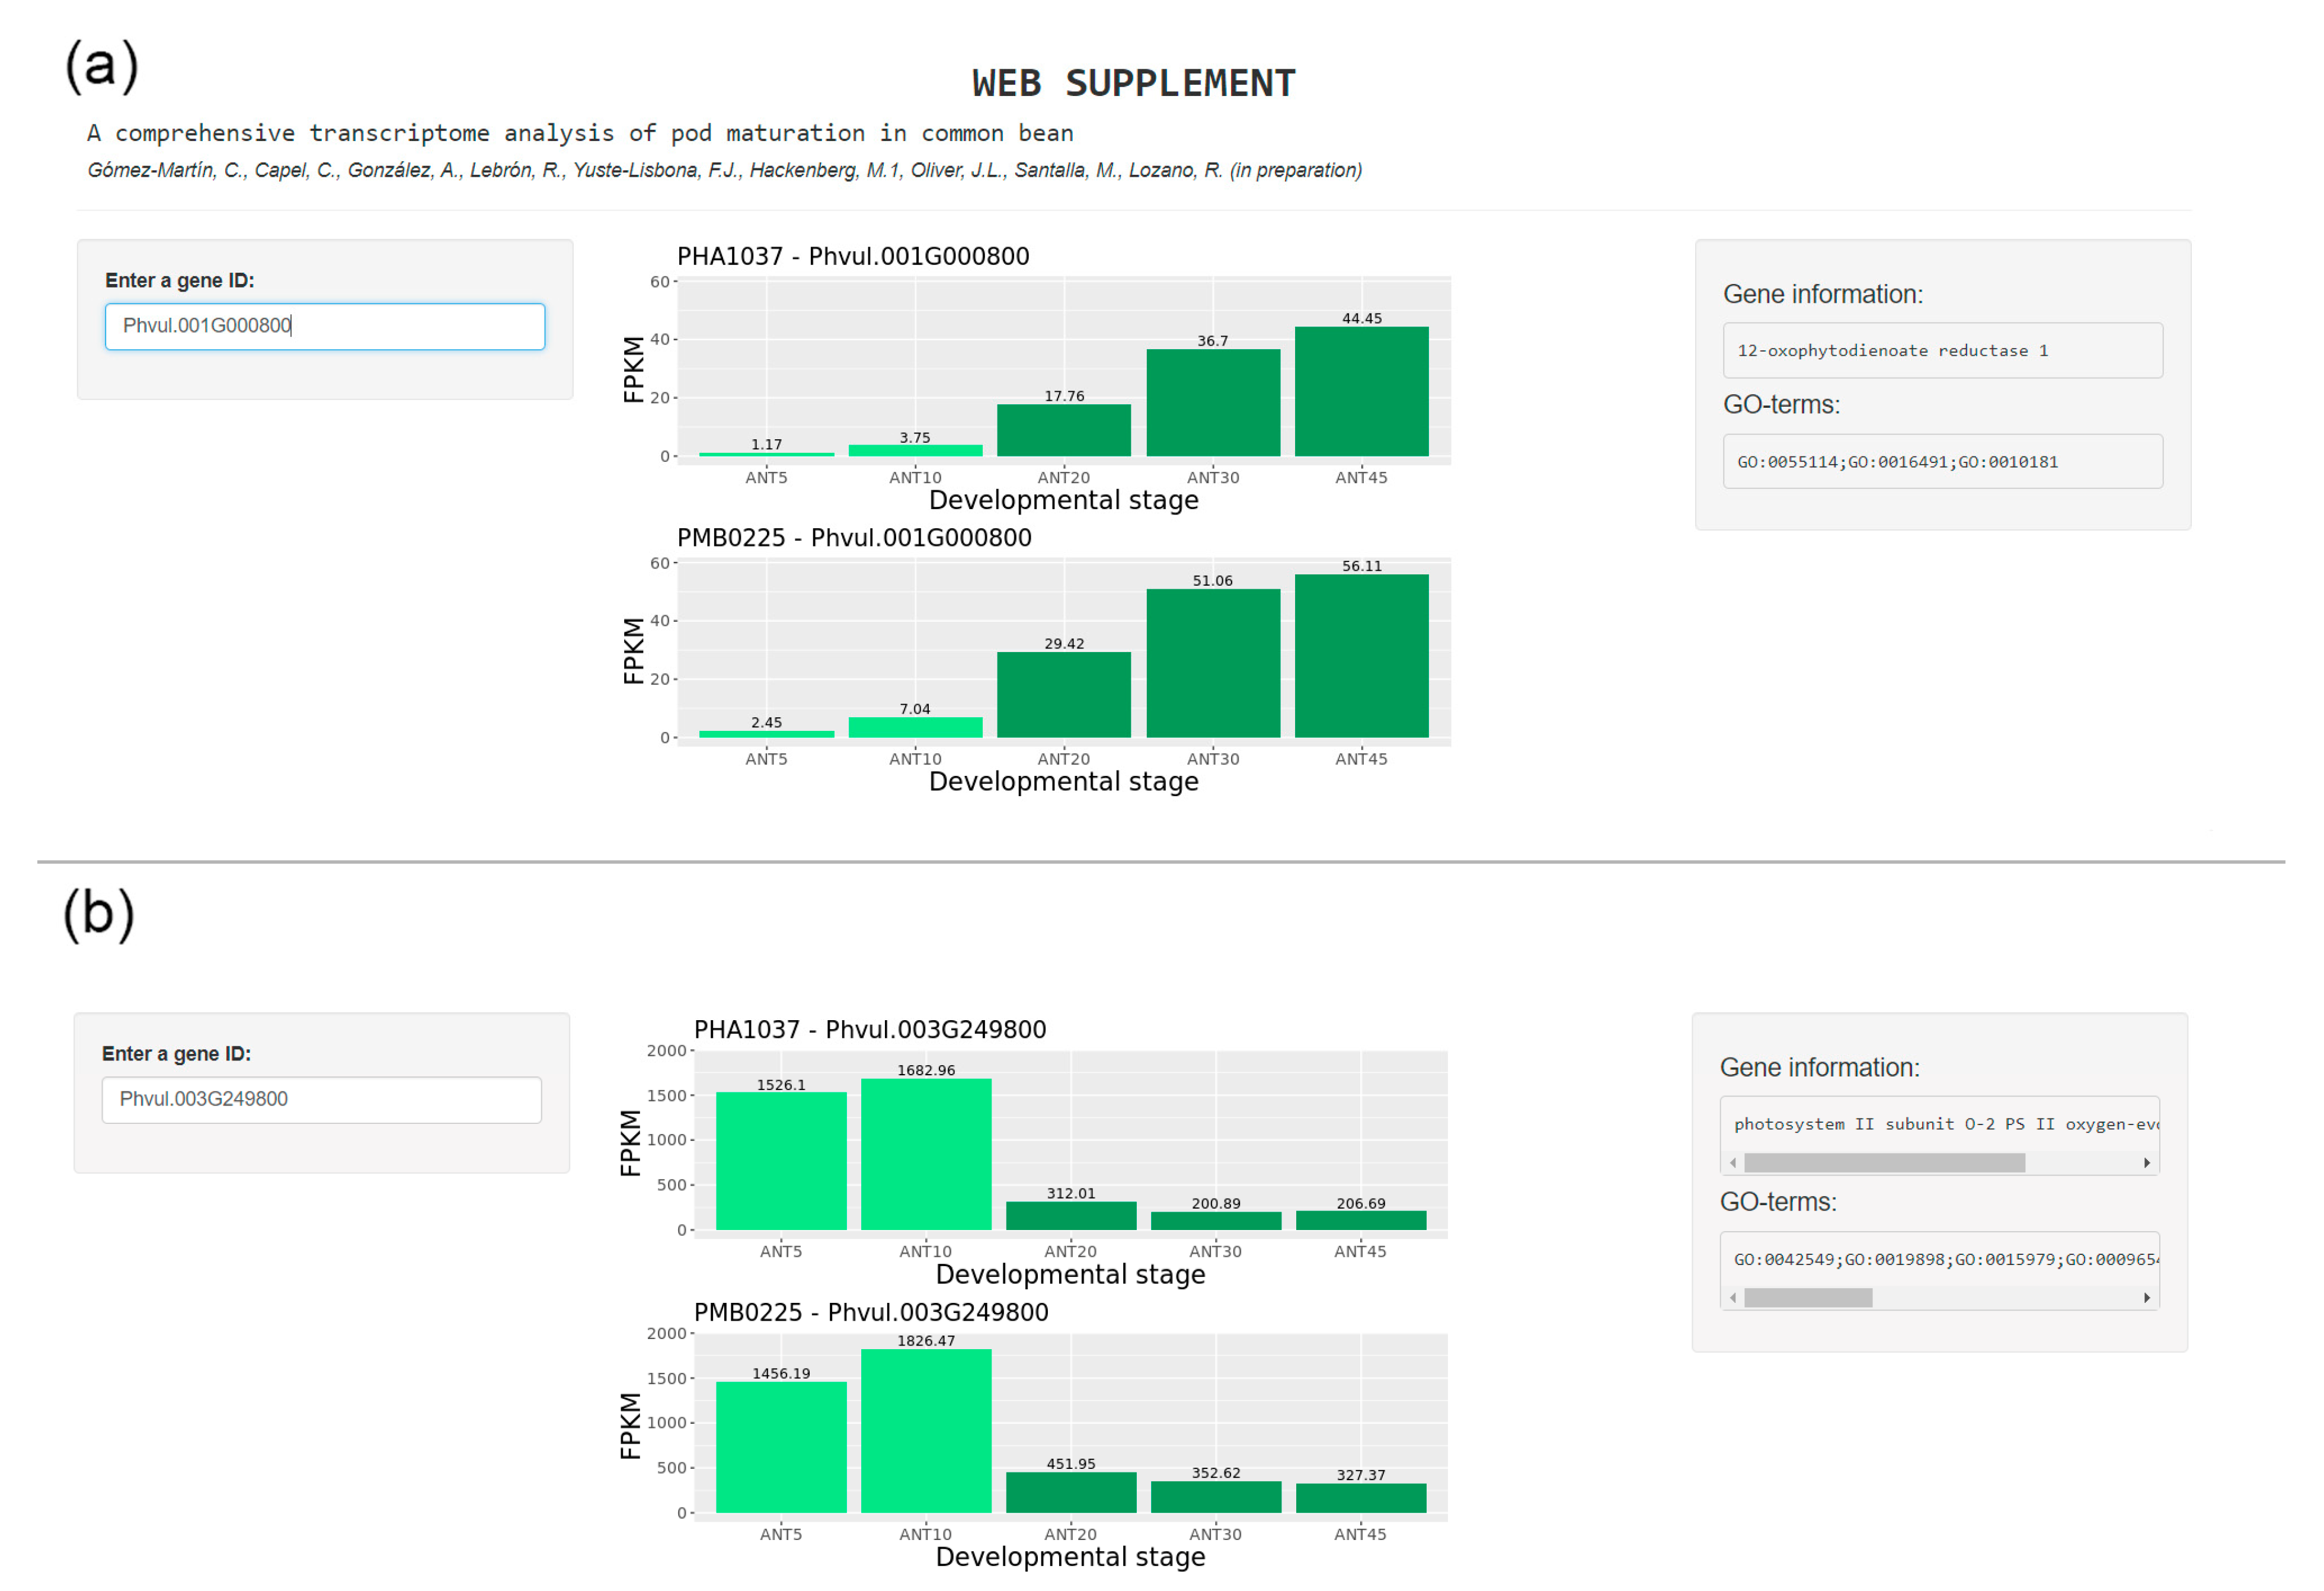
- Gómez-Martín, C.; Oliver, J.L. Phaseolus Web Supplement; 2020; Available online: https://bioinfo2.ugr.es/shinyWebs/phaseolus/phaseolusMaturationApp/ (accessed on 26 February 2020).
- Ogata, H.; Goto, S.; Sato, K.; Fujibuchi, W.; Bono, H.; Kanehisa, M. KEGG: Kyoto encyclopedia of genes and genomes. Nucleic Acids Res. 1999, 27, 29–34. [Google Scholar] [CrossRef] [PubMed] [Green Version]
- Luo, W.; Brouwer, C. Pathview: An R/Bioconductor package for pathway-based data integration and visualization. Bioinformatics 2013, 29, 1830–1831. [Google Scholar] [CrossRef] [PubMed] [Green Version]
- Simpson, J.P.; Thrower, N.; Ohlrogge, J.B. How did nature engineer the highest surface lipid accumulation among plants? Exceptional expression of acyl-lipid-associated genes for the assembly of extracellular triacylglycerol by Bayberry (Myrica pensylvanica) fruits. Biochim. Biophys. Acta 2016, 1861, 1243–1252. [Google Scholar] [CrossRef] [Green Version]
- Mizzotti, C.; Rotasperti, L.; Moretto, M.; Tadini, L.; Resentini, F.; Galliani, B.; Galbiati, M.; Engelen, K.; Pesaresi, P.; Masiero, S. Time-course transcriptome analysis of Arabidopsis siliques discloses genes essential for fruit development and maturation. Plant Physiol. 2018, 178, 1249–1268. [Google Scholar] [CrossRef] [Green Version]
- Oda-Yamamizo, C.; Mitsuda, N.; Sakamoto, S.; Ogawa, D.; Ohme-Takagi, M.; Ohmiya, A. The NAC transcription factor ANAC046 is a positive regulator of chlorophyll degradation and senescence in Arabidopsis leaves. Sci. Rep. 2016, 6, 23609. [Google Scholar] [CrossRef] [Green Version]
- Garapati, P.; Xue, G.P.; Munné-Bosch, S.; Balazadeh, S. Transcription factor ATAF1 in Arabidopsis promotes senescence by direct regulation of key chloroplast maintenance and senescence transcriptional cascades. Plant Physiol. 2015, 168, 1122–1139. [Google Scholar] [CrossRef] [Green Version]
- Dong, Y.; Yang, X.; Liu, J.; Wang, B.H.; Liu, B.L.; Wang, Y.Z. Pod shattering resistance associated with domestication is mediated by a NAC gene in soybean. Nat. Commun. 2014, 5, 3352. [Google Scholar] [CrossRef] [Green Version]
- Pysh, L.D.; Wysocka-Diller, J.W.; Camilleri, C.; Bouchez, D.; Benfey, P.N. The GRAS gene family in Arabidopsis: Sequence characterization and basic expression analysis of the SCARECROW-LIKE genes. Plant J. 1999, 18, 111–119. [Google Scholar] [CrossRef]
- Wang, L.; Zhang, X.L.; Wang, L.; Tian, Y.; Jia, N.; Chen, S.; Shi, N.B.; Huang, X.; Zhou, C.; Yu, Y.; et al. Regulation of ethylene-responsive SlWRKYs involved in color change during tomato fruit ripening. Sci. Rep. 2017, 7, 16674. [Google Scholar] [CrossRef] [PubMed] [Green Version]
- Huang, G.Q.; Gong, S.Y.; Xu, W.L.; Li, W.; Li, P.; Zhang, C.J.; Li, D.D.; Zheng, Y.; Li, F.G.; Li, X.B. A fasciclin-like arabinogalactan protein, GhFLA1, is involved in fiber initiation and elongation of cotton. Plant Physiol. 2013, 161, 1278–1290. [Google Scholar] [CrossRef] [PubMed] [Green Version]
- Romano, J.M.; Dubos, C.; Prouse, M.B.; Wilkins, O.; Hong, H.; Poole, M.; Kang, K.; Li, E.; Douglas, C.J.; Western, T.L.; et al. AtMYB61, an R2R3-MYB transcription factor, functions as a pleiotropic regulator via a small gene network. New Phytol. 2012, 195, 774–786. [Google Scholar] [CrossRef] [PubMed]
- Newman, L.J.; Perazza, D.E.; Juda, L.; Campbell, M.M. Involvement of the R2R3-MYB, AtMYB61, in the ectopic lignification and dark-photomorphogenic components of the det3 mutant phenotype. Plant J. 2004, 37, 239–250. [Google Scholar] [CrossRef] [PubMed]
- Penfield, S.; Meissner, R.C.; Shoue, D.A.; Carpita, N.C.; Bevan, M.W. MYB61 is required for mucilage deposition and extrusion in the Arabidopsis seed coat. Plant Cell 2001, 13, 2777–2791. [Google Scholar] [CrossRef] [PubMed] [Green Version]
- Zhang, M.; Su, J.; Zhang, Y.; Xu, J.; Zhang, S. Conveying endogenous and exogenous signals: MAPK cascades in plant growth and defense. Curr. Opin. Plant Biol. 2018, 45, 1–10. [Google Scholar] [CrossRef] [PubMed]
- Vighi, I.L.; Crizel, R.L.; Perin, E.C.; Rombaldi, C.V.; Galli, V. Crosstalk during fruit ripening and stress response among abscisic acid, calcium-dependent protein kinase and phenylpropanoid. Crit. Rev. Plant Sci. 2019, 38, 99–116. [Google Scholar] [CrossRef]
- Huang, D.; Wang, S.; Zhang, B.; Shang-Guan, K.; Shi, Y.; Zhang, D.; Liu, X.; Wu, K.; Xu, Z.; Fu, X.; et al. A gibberellin-mediated DELLA-NAC signaling cascade regulates cellulose synthesis in rice. Plant Cell 2015, 27, 1681–1696. [Google Scholar] [CrossRef] [Green Version]
- Hirano, K.; Kondo, M.; Aya, K.; Miyao, A.; Sato, Y.; Antonio, B.A.; Namiki, N.; Nagamura, Y.; Matsuoka, M. Identification of transcription factors involved in rice secondary cell wall formation. Plant Cell Physiol. 2013, 54, 1791–1802. [Google Scholar] [CrossRef]
- Rissler, H.M.; Collakova, E.; DellaPenna, D.; Whelan, J.; Pogson, B.J. Chlorophyll biosynthesis. Expression of a second chl I gene of magnesium chelatase in Arabidopsis supports only limited chlorophyll synthesis. Plant Physiol. 2002, 128, 770–779. [Google Scholar] [CrossRef]
- Manara, A.; DalCorso, G.; Leister, D.; Jahns, P.; Baldan, B.; Furini, A. AtSIA1 and AtOSA1: Two Abc1 proteins involved in oxidative stress responses and iron distribution within chloroplasts. New Phytol. 2014, 201, 452–465. [Google Scholar] [CrossRef] [PubMed]
- Kim, J.; Eichacker, L.A.; Rudiger, W.; Mullet, J.E. Chlorophyll regulates accumulation of the plastid-encoded chlorophyll proteins P700 and D1 by increasing apoprotein stability. Plant Physiol. 1994, 104, 907–916. [Google Scholar] [CrossRef] [PubMed] [Green Version]
- Piechulla, B.; Imlay, K.R.; Gruissem, W. Plastid gene expression during fruit ripening in tomato. Plant Mol. Biol. 1985, 5, 373–384. [Google Scholar] [CrossRef] [PubMed]
- Barsan, C.; Zouine, M.; Maza, E.; Bian, W.; Egea, I.; Rossignol, M.; Bouyssie, D.; Pichereaux, C.; Purgatto, E.; Bouzayen, M.; et al. Proteomic analysis of chloroplast-to-chromoplast transition in tomato reveals metabolic shifts coupled with disrupted thylakoid biogenesis machinery and elevated energy-production components. Plant Physiol. 2012, 160, 708–725. [Google Scholar] [CrossRef] [Green Version]
- Jaradat, M.R.; Ruegger, M.; Bowling, A.; Butler, H.; Cutler, A.J. A comprehensive transcriptome analysis of silique development and dehiscence in Arabidopsis and Brassica integrating genotypic, interspecies and developmental comparisons. GM Crops Food 2014, 5, 302–320. [Google Scholar] [CrossRef] [Green Version]
- Zhang, J.; Yuan, H.; Yang, Y.; Fish, T.; Lyi, S.M.; Thannhauser, T.W.; Zhang, L.; Li, L. Plastid ribosomal protein S5 is involved in photosynthesis, plant development, and cold stress tolerance in Arabidopsis. J. Exp. Bot. 2016, 67, 2731–2744. [Google Scholar] [CrossRef] [Green Version]
- Mayland, H.F.; Dean, L.L. Chlorophyll content of persistent-green and normal snap bean pods (Phaseolus vulgaris L.). J. Am. Soc. Hortic. Sci. 1971, 96, 362–365. [Google Scholar]
- Andrews, A.K.; Svec, L.V. Photosynthetic activity of soybean pods at different growth stages compared to leaves. Can. J. Plant Sci. 1975, 55, 501–505. [Google Scholar] [CrossRef]
- Sakuraba, Y.; Schelbert, S.; Park, S.Y.; Han, S.H.; Lee, B.D.; Andrès, C.B.; Kessler, F.; Hörtensteiner, S.; Paek, N.C. STAY-GREEN and chlorophyll catabolic enzymes interact at light-harvesting complex II for chlorophyll detoxification during leaf senescence in Arabidopsis. Plant Cell 2012, 24, 507–518. [Google Scholar] [CrossRef] [Green Version]
- Kusaba, M.; Ito, H.; Morita, R.; Iida, S.; Sato, Y.; Fujimoto, M.; Kawasaki, S.; Tanaka, R.; Hirochika, H.; Nishimura, M.; et al. Rice NON-YELLOW COLORING1 is involved in light-harvesting complex II and grana degradation during leaf senescence. Plant Cell 2007, 19, 1362–1375. [Google Scholar] [CrossRef] [Green Version]
- Ren, G.; An, K.; Liao, Y.; Zhou, X.; Cao, Y.; Zhao, H.; Ge, X.; Kuai, B. Identification of a novel chloroplast protein AtNYE1 regulating chlorophyll degradation during leaf senescence in Arabidopsis. Plant Physiol. 2007, 144, 1429–1441. [Google Scholar] [CrossRef] [PubMed] [Green Version]
- Barry, C.S.; McQuinn, R.P.; Chung, M.Y.; Besuden, A.; Giovannoni, J.J. Amino acid substitutions in homologs of the STAY-GREEN protein are responsible for the green-flesh and chlorophyll retainer mutations of tomato and pepper. Plant Physiol. 2008, 147, 179–187. [Google Scholar] [CrossRef] [PubMed] [Green Version]
- Luo, Z.; Zhang, J.; Li, J.; Yang, C.; Wang, T.; Ouyang, B.; Li, H.; Giovannoni, J.; Ye, Z. A STAY-GREEN protein SlSGR1 regulates lycopene and β-carotene accumulation by interacting directly with SlPSY1 during ripening processes in tomato. New Phytol. 2013, 198, 442–452. [Google Scholar] [CrossRef] [PubMed]
- Giovannoni, J.J. Genetic regulation of fruit development and ripening. Plant Cell 2004, 16, S170–S180. [Google Scholar] [CrossRef] [Green Version]
- Tian, S.; Qin, G.; Li, B. Reactive oxygen species involved in regulating fruit senescence and fungal pathogenicity. Plant Mol. Biol. 2013, 82, 593–602. [Google Scholar] [CrossRef]
- Balboa, M.A.; Balsinde, J. Oxidative stress and arachidonic acid mobilization. Biochim. Biophys. Acta 2006, 1761, 385–391. [Google Scholar] [CrossRef]
- Matamoros, M.A.; Loscos, J.; Dietz, K.J.; Aparicio-Tejo, P.M.; Becana, M. Function of antioxidant enzymes and metabolites during maturation of pea fruits. J. Exp. Bot. 2010, 61, 87–97. [Google Scholar] [CrossRef] [Green Version]
- Santalla, M. PRJNA578479; Misión Biológica de Galicia, CSIC, 2019. Available online: https://www.ncbi.nlm.nih.gov/bioproject/PRJNA578479 (accessed on 26 February 2020).
- Andrews, S. FASTQC: A Quality Control Tool for High Throughput Sequence Data; Babraham Bioinformatics, 2010; Available online: http://www.bioinformatics.babraham.ac.uk/projects/fastqc (accessed on 26 February 2020).
- Krueger, F. Taking Appropriate QC Measures for RRBS-Type or Other -Seq Applications with Trim Galore; GitHub Inc., 2017; Available online: https://github.com/FelixKrueger/TrimGalore (accessed on 26 February 2020).
- Dobin, A.; Davis, C.A.; Schlesinger, F.; Drenkow, J.; Zaleski, C.; Jha, S.; Batut, P.; Chaisson, M.; Gingeras, T.R. STAR: Ultrafast universal RNA-seq aligner. Bioinformatics 2013, 29, 15–21. [Google Scholar] [CrossRef]
- Morgan, M.; Pagès, H.; Obenchain, V.; Hayden, N. Rsamtools: Binary Alignment (BAM), FASTA, Variant Call (BCF), and Tabix File Import, R Package Version 1.22.0; 2010; Available online: http://bioconductor.org/packages/Rsamtools (accessed on 26 February 2020).
- Lawrence, M.; Huber, W.; Pagès, H.; Aboyoun, P.; Carlson, M.; Gentleman, R.; Morgan, M.T.; Carey, V.J. Software for computing and annotating genomic ranges. PLoS Comput. Biol. 2013, 9, e1003118. [Google Scholar] [CrossRef]
- Backman, T.W.H.; Girke, T. systemPipeR: NGS workflow and report generation environment. BMC Bioinform. 2016, 17, 388. [Google Scholar] [CrossRef] [Green Version]
- Warnes, G.R.; Bolker, B.; Bonebakker, L.; Gentleman, R.; Huber, W.; Liaw, A.; Lumley, T.; Maechler, M.; Magnusson, A.; Moeller, S.; et al. gplots: Various R Programming Tools for Plotting Data. R package version 3.0.3; 2020; Available online: https://cran.r-project.org/package=gplots (accessed on 26 February 2020).
- Chang, W. Shiny: Web Application Framework for R; 2017; Available online: https://cran.r-project.org/web/packages/shiny/index.html (accessed on 26 February 2020).
- Chen, H.; Boutros, P. VennDiagram: Generate High-Resolution Venn and Euler Plots. R Package Version 1.6.20; 2018; Available online: https://cran.r-project.org/web/packages/VennDiagram/VennDiagram.pdf (accessed on 26 February 2020).
- Morpheus; Available online: https:/software.broadinstitute.org/morpheus (accessed on 26 February 2020).
- Tian, T.; Liu, Y.; Yan, H.; You, Q.; Yi, X.; Du, Z.; Xu, W.; Su, Z. agriGO v2.0: A GO analysis toolkit for the agricultural community, 2017 update. Nucleic Acids Res. 2017, 45, W122–W129. [Google Scholar] [CrossRef] [PubMed]
- Supek, F.; Bošnjak, M.; Škunca, N.; Šmuc, T. REVIGO summarizes and visualizes long lists of gene ontology terms. PLoS ONE 2011, 6, e21800. [Google Scholar] [CrossRef] [Green Version]
- Yu, G.; Wang, L.G.; Han, Y.; He, Q.Y. clusterProfiler: An R package for comparing biological themes among gene clusters. OMICS 2012, 16, 284–287. [Google Scholar] [CrossRef]
- Lebrón, R. KEGG Enrichment and Pathway Mapping; GitHub Inc., 2017; Available online: https://github.com/rlebron88/PhaseolusVulgaris (accessed on 26 February 2020).
- Goodstein, D.M.; Shu, S.; Howson, R.; Neupane, R.; Hayes, R.D.; Fazo, J.; Mitros, T.; Dirks, W.; Hellsten, U.; Putnam, N.; et al. Phytozome: A comparative platform for green plant genomics. Nucleic Acids Res. 2012, 40, D1178–D1186. [Google Scholar] [CrossRef] [PubMed]
- Tian, F.; Yang, D.C.; Meng, Y.Q.; Jin, J.; Gao, G. PlantRegMap: Charting functional regulatory maps in plants. Nucleic Acids Res. 2020, 48, D1104–D1113. [Google Scholar] [CrossRef] [PubMed]
- Grant, C.E.; Bailey, T.L.; Noble, W.S. FIMO: Scanning for occurrences of a given motif. Bioinformatics 2011, 27, 1017–1018. [Google Scholar] [CrossRef] [Green Version]
- Ramani, R.; Krumholz, K.; Huang, Y.F.; Siepel, A. Phastweb: A web interface for evolutionary conservation scoring of multiple sequence alignments using phastCons and phyloP. Bioinformatics 2019, 35, 2320–2322. [Google Scholar] [CrossRef]
- Winer, J.; Jung, C.K.; Shackel, I.; Williams, P.M. Development and validation of real-time quantitative reverse transcriptase-polymerase chain reaction for monitoring gene expression in cardiac myocytes in vitro. Anal. Biochem. 1999, 270, 41–49. [Google Scholar] [CrossRef]


© 2020 by the authors. Licensee MDPI, Basel, Switzerland. This article is an open access article distributed under the terms and conditions of the Creative Commons Attribution (CC BY) license (http://creativecommons.org/licenses/by/4.0/).
Share and Cite
Gómez-Martín, C.; Capel, C.; González, A.M.; Lebrón, R.; Yuste-Lisbona, F.J.; Hackenberg, M.; Oliver, J.L.; Santalla, M.; Lozano, R. Transcriptional Dynamics and Candidate Genes Involved in Pod Maturation of Common Bean (Phaseolus vulgaris L.). Plants 2020, 9, 545. https://doi.org/10.3390/plants9040545
Gómez-Martín C, Capel C, González AM, Lebrón R, Yuste-Lisbona FJ, Hackenberg M, Oliver JL, Santalla M, Lozano R. Transcriptional Dynamics and Candidate Genes Involved in Pod Maturation of Common Bean (Phaseolus vulgaris L.). Plants. 2020; 9(4):545. https://doi.org/10.3390/plants9040545
Chicago/Turabian StyleGómez-Martín, Cristina, Carmen Capel, Ana M. González, Ricardo Lebrón, Fernando J. Yuste-Lisbona, Michael Hackenberg, José L. Oliver, Marta Santalla, and Rafael Lozano. 2020. "Transcriptional Dynamics and Candidate Genes Involved in Pod Maturation of Common Bean (Phaseolus vulgaris L.)" Plants 9, no. 4: 545. https://doi.org/10.3390/plants9040545