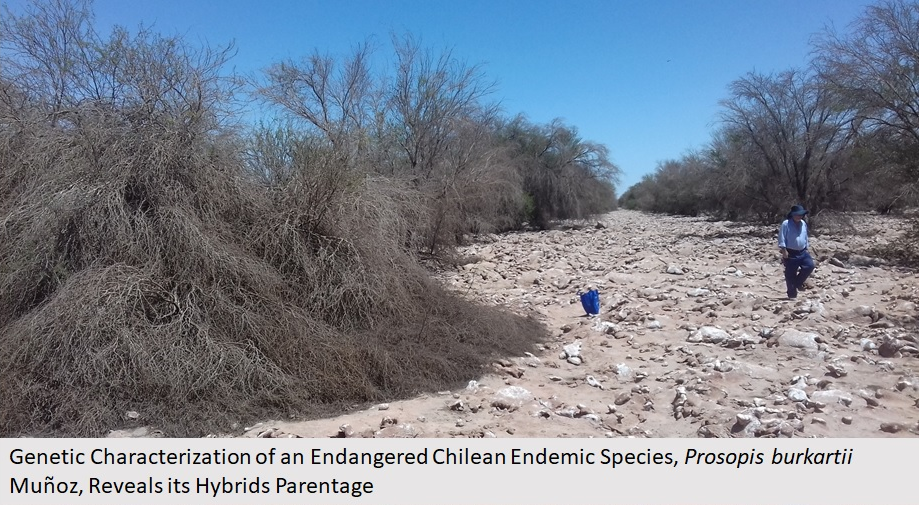
Genetic Characterization of an Endangered Chilean Endemic Species, Prosopis burkartii Muñoz, Reveals its Hybrids Parentage

 , ,
, ,
Abstract
:
1. Introduction
2. Results
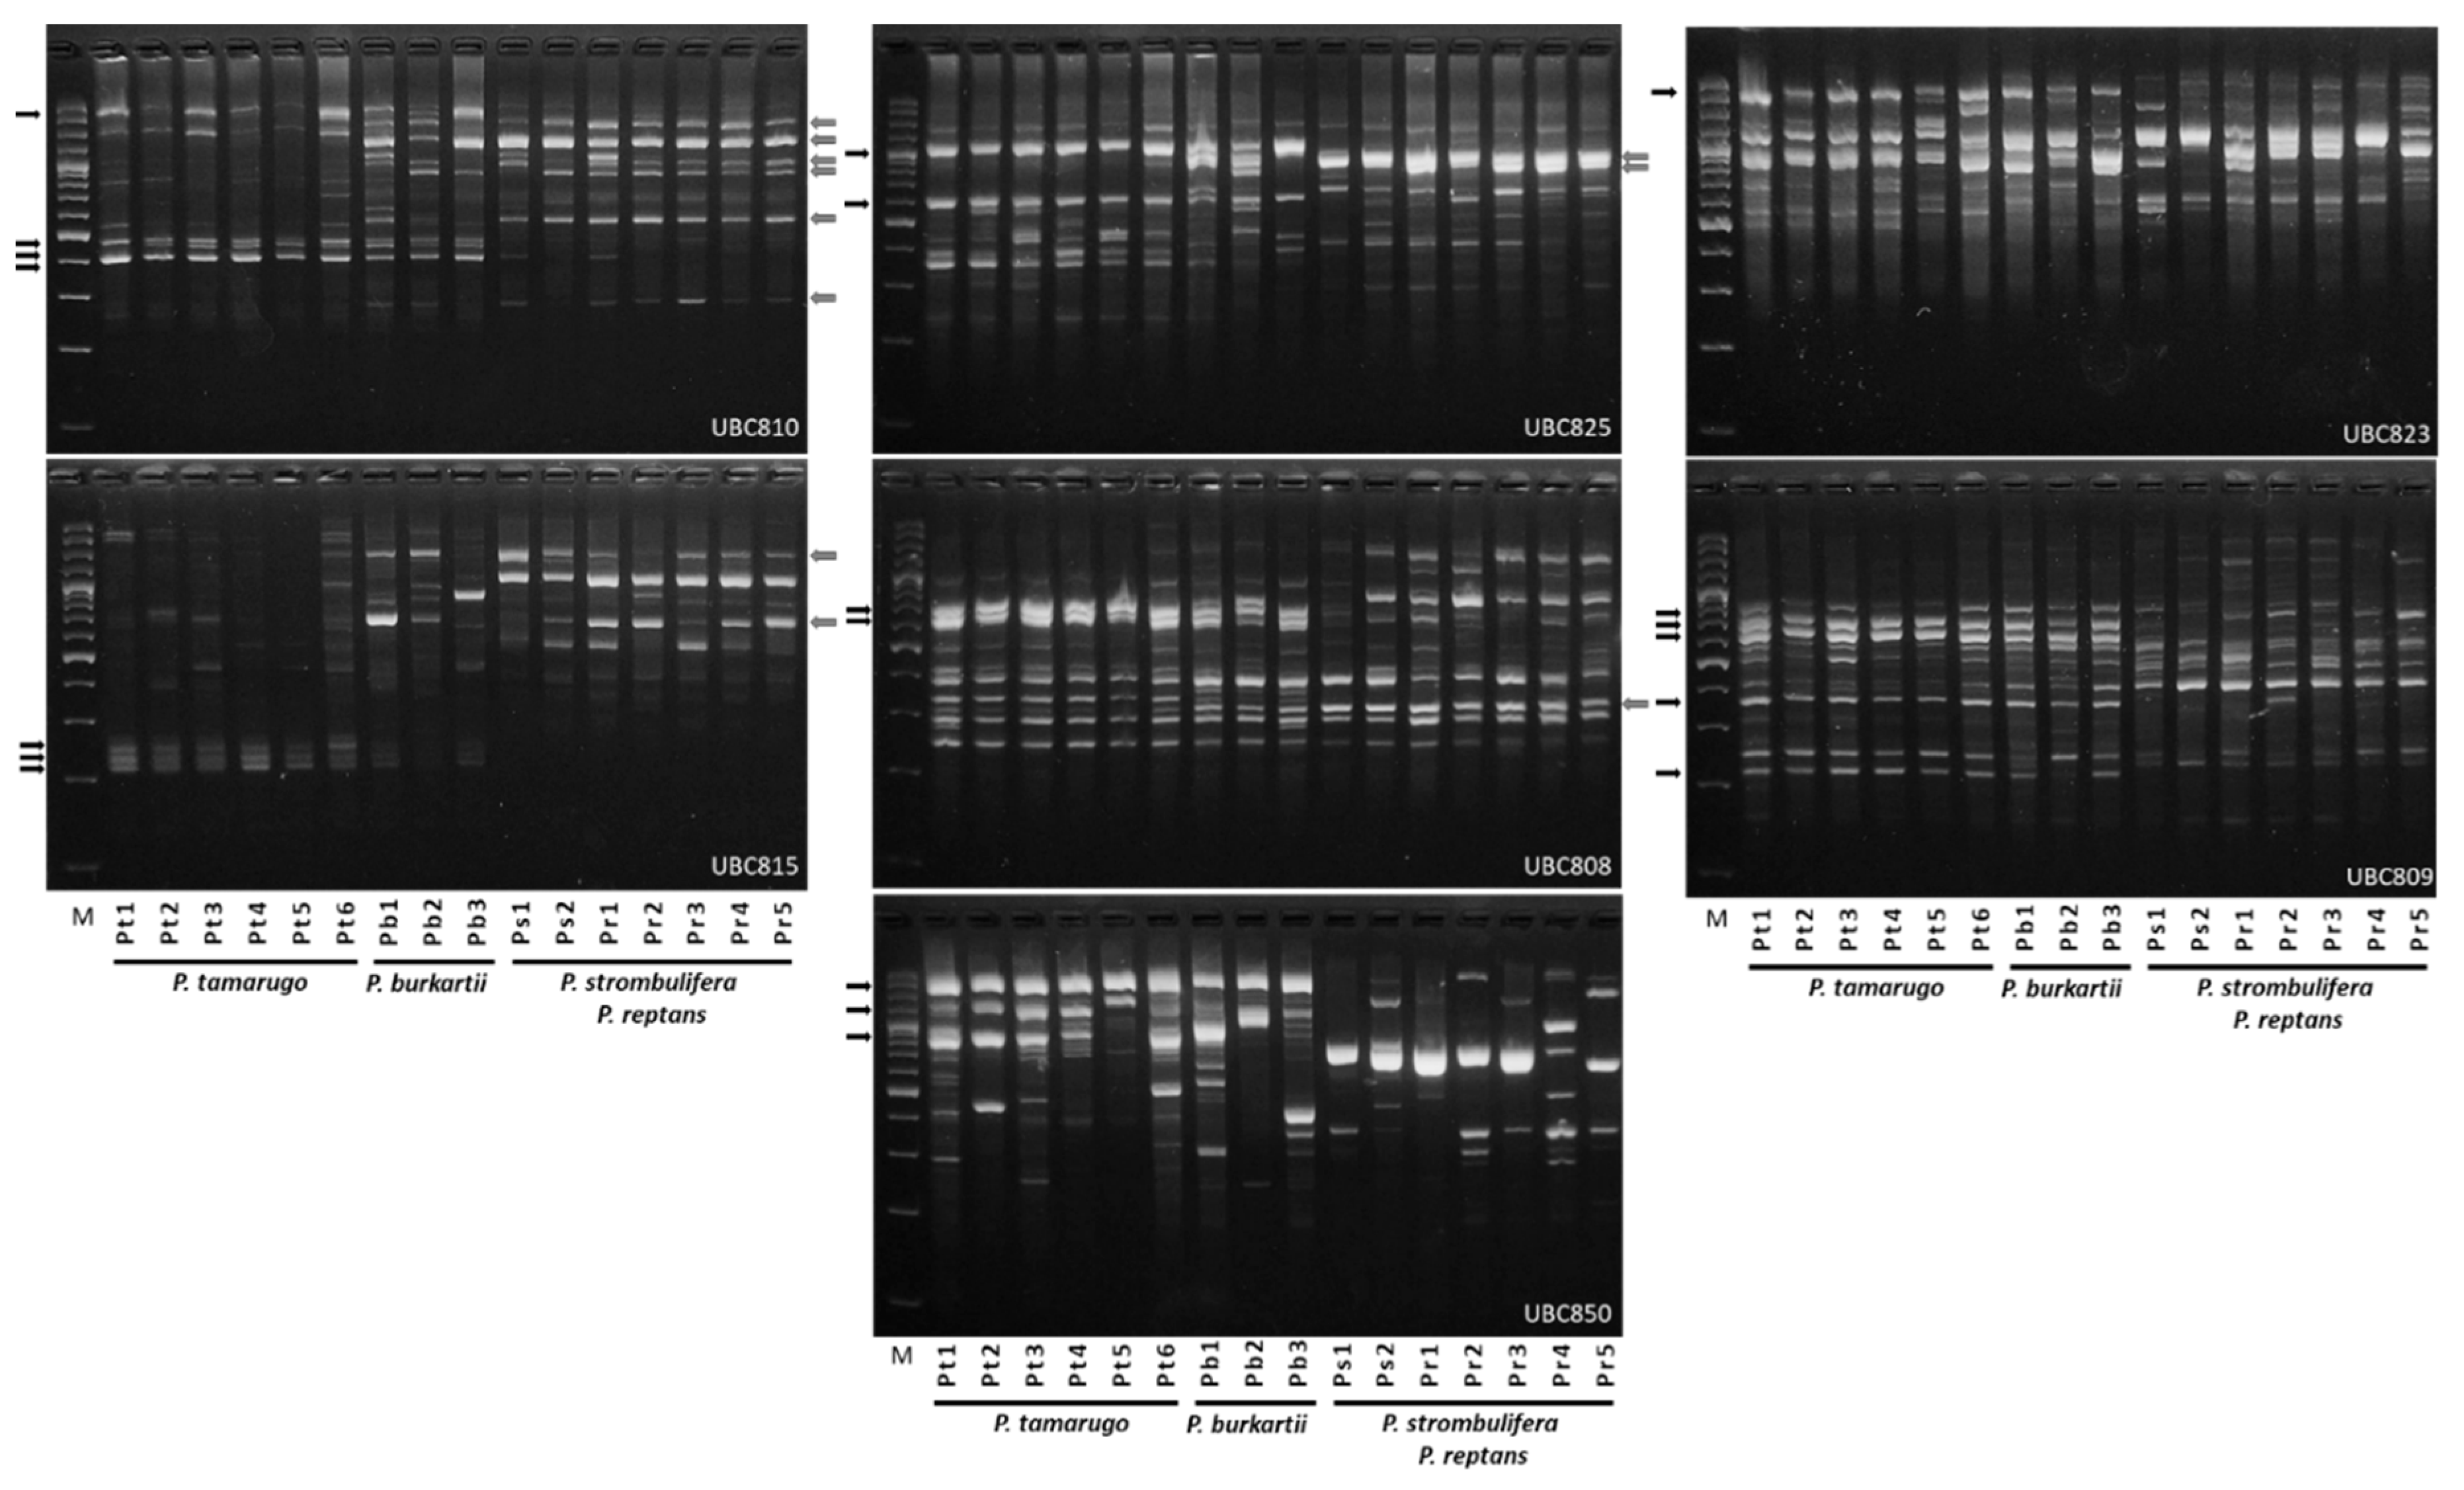
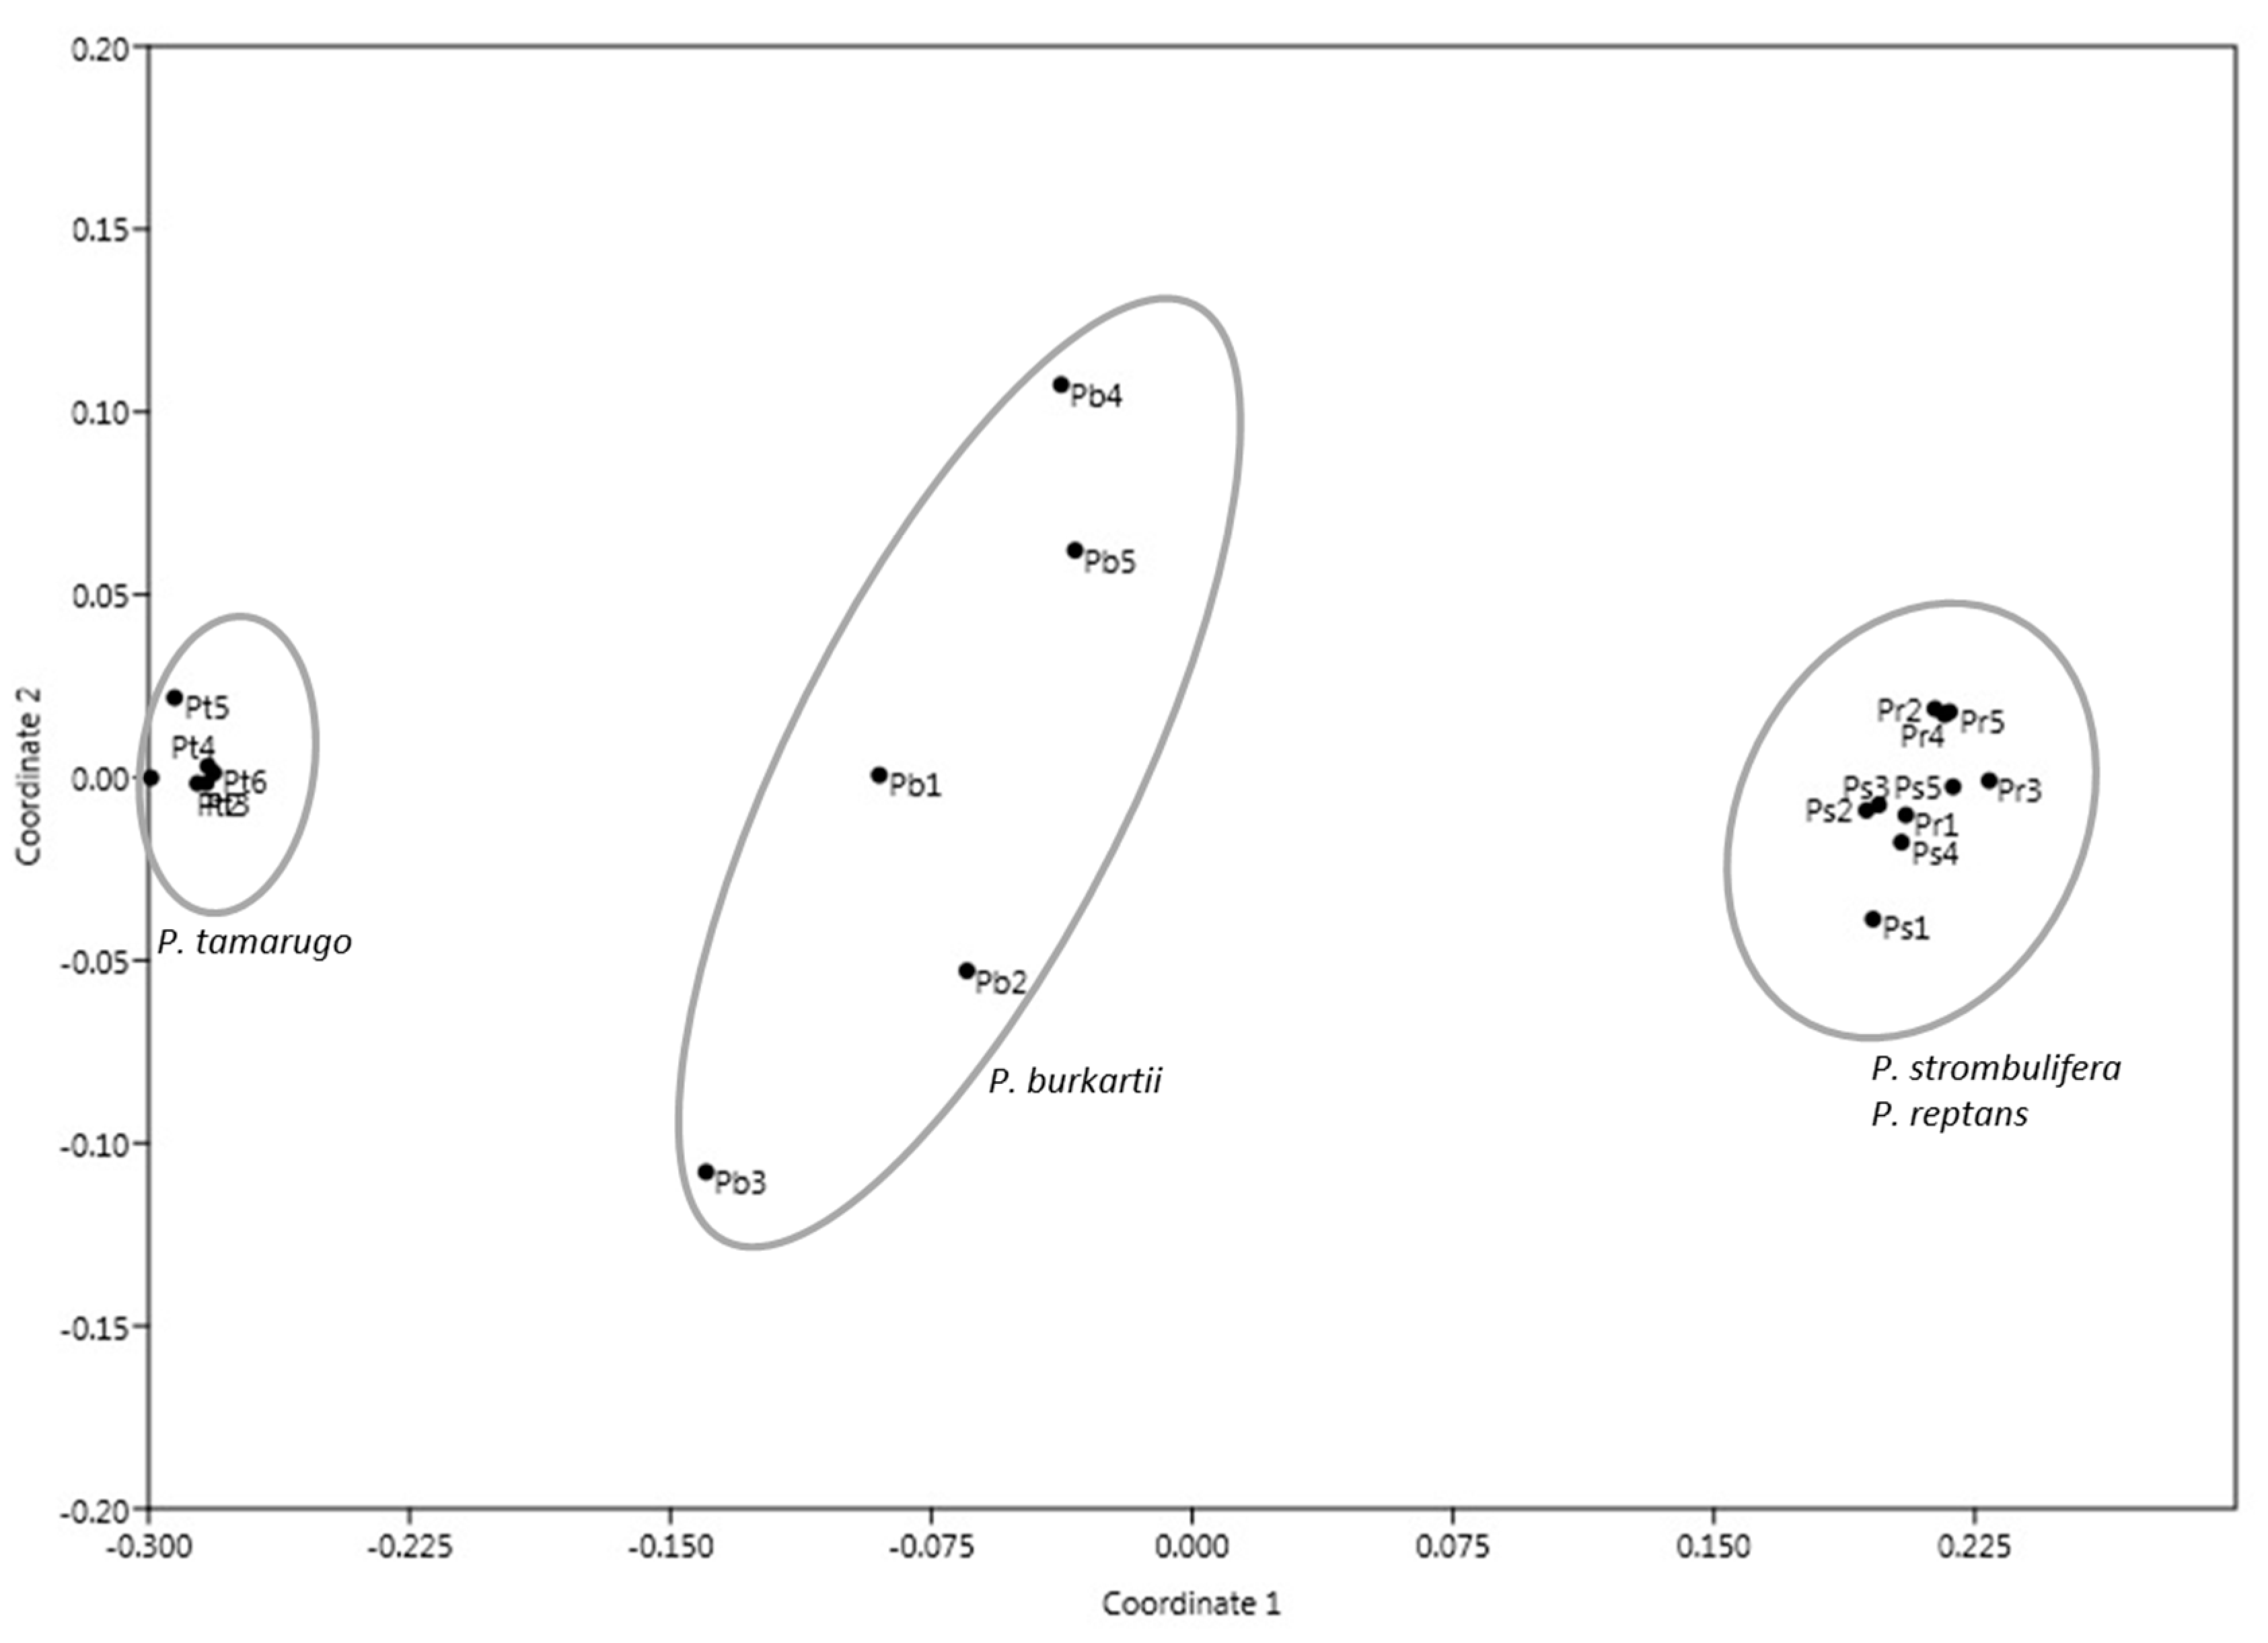
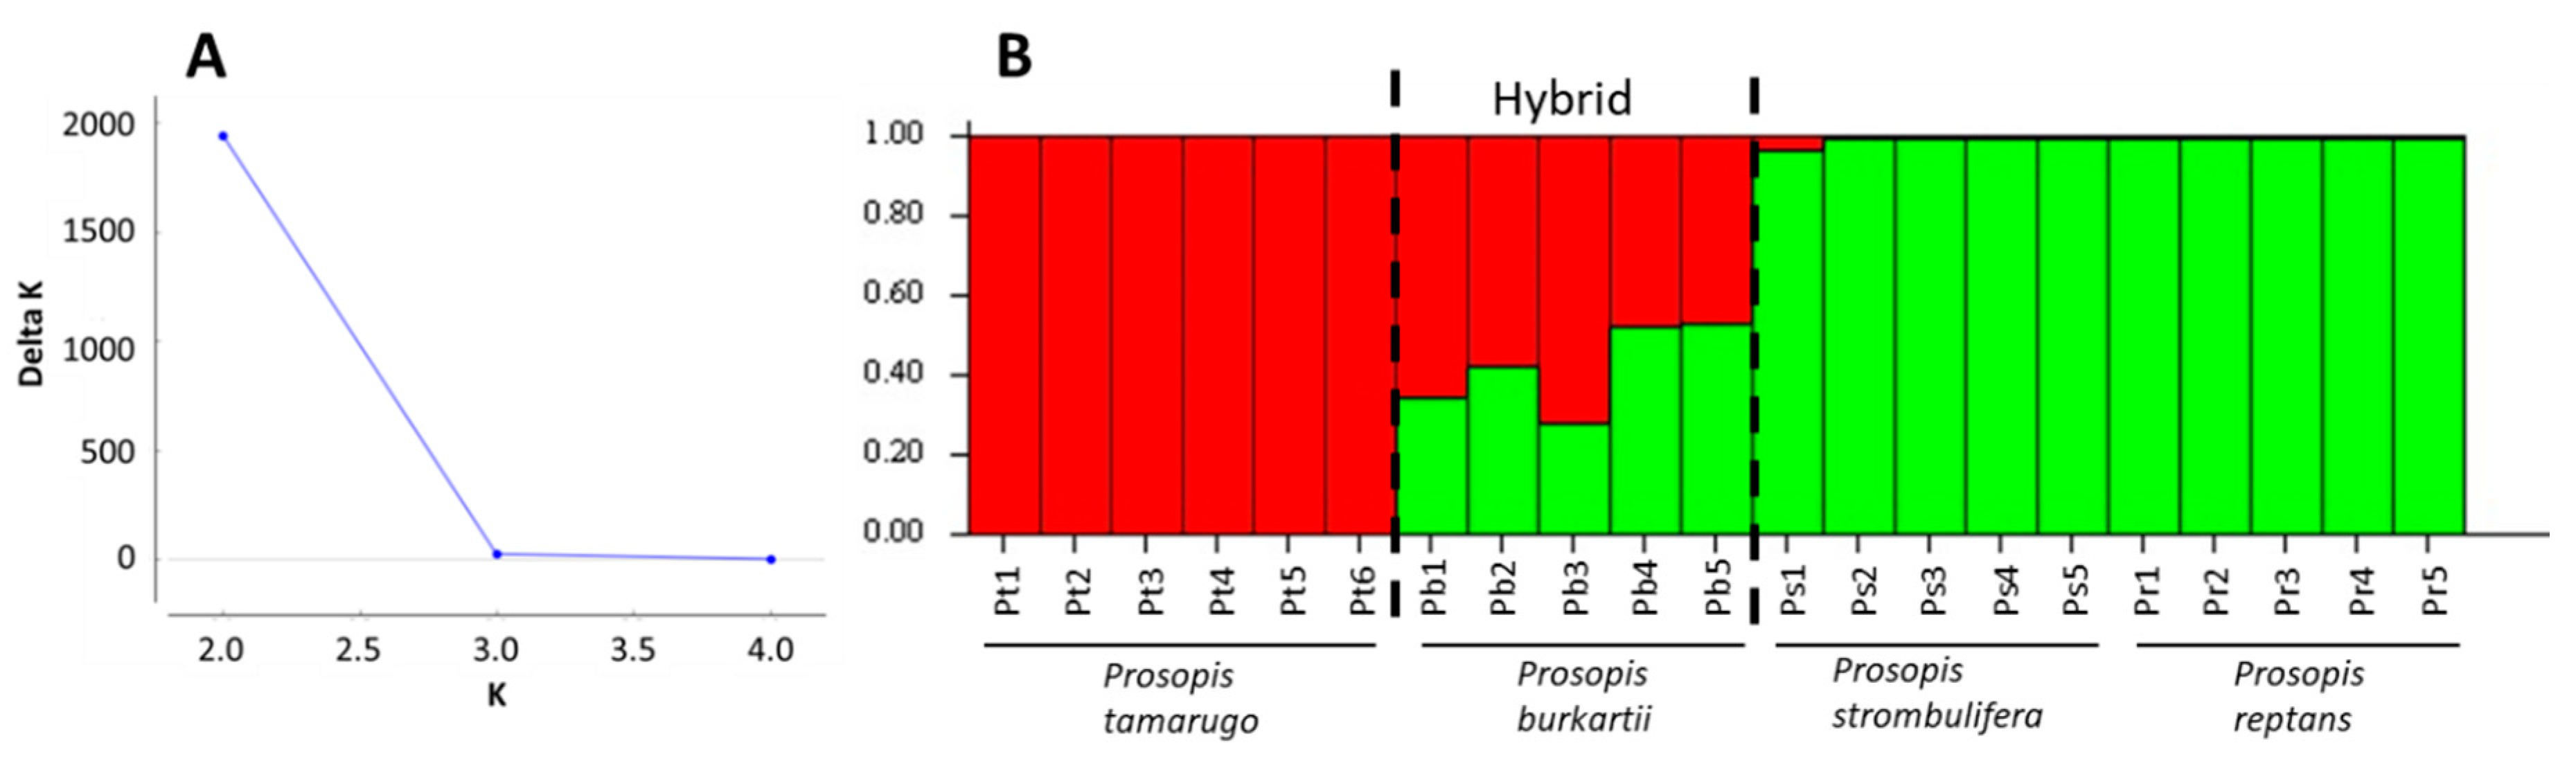
2.1. ISSR Analysis
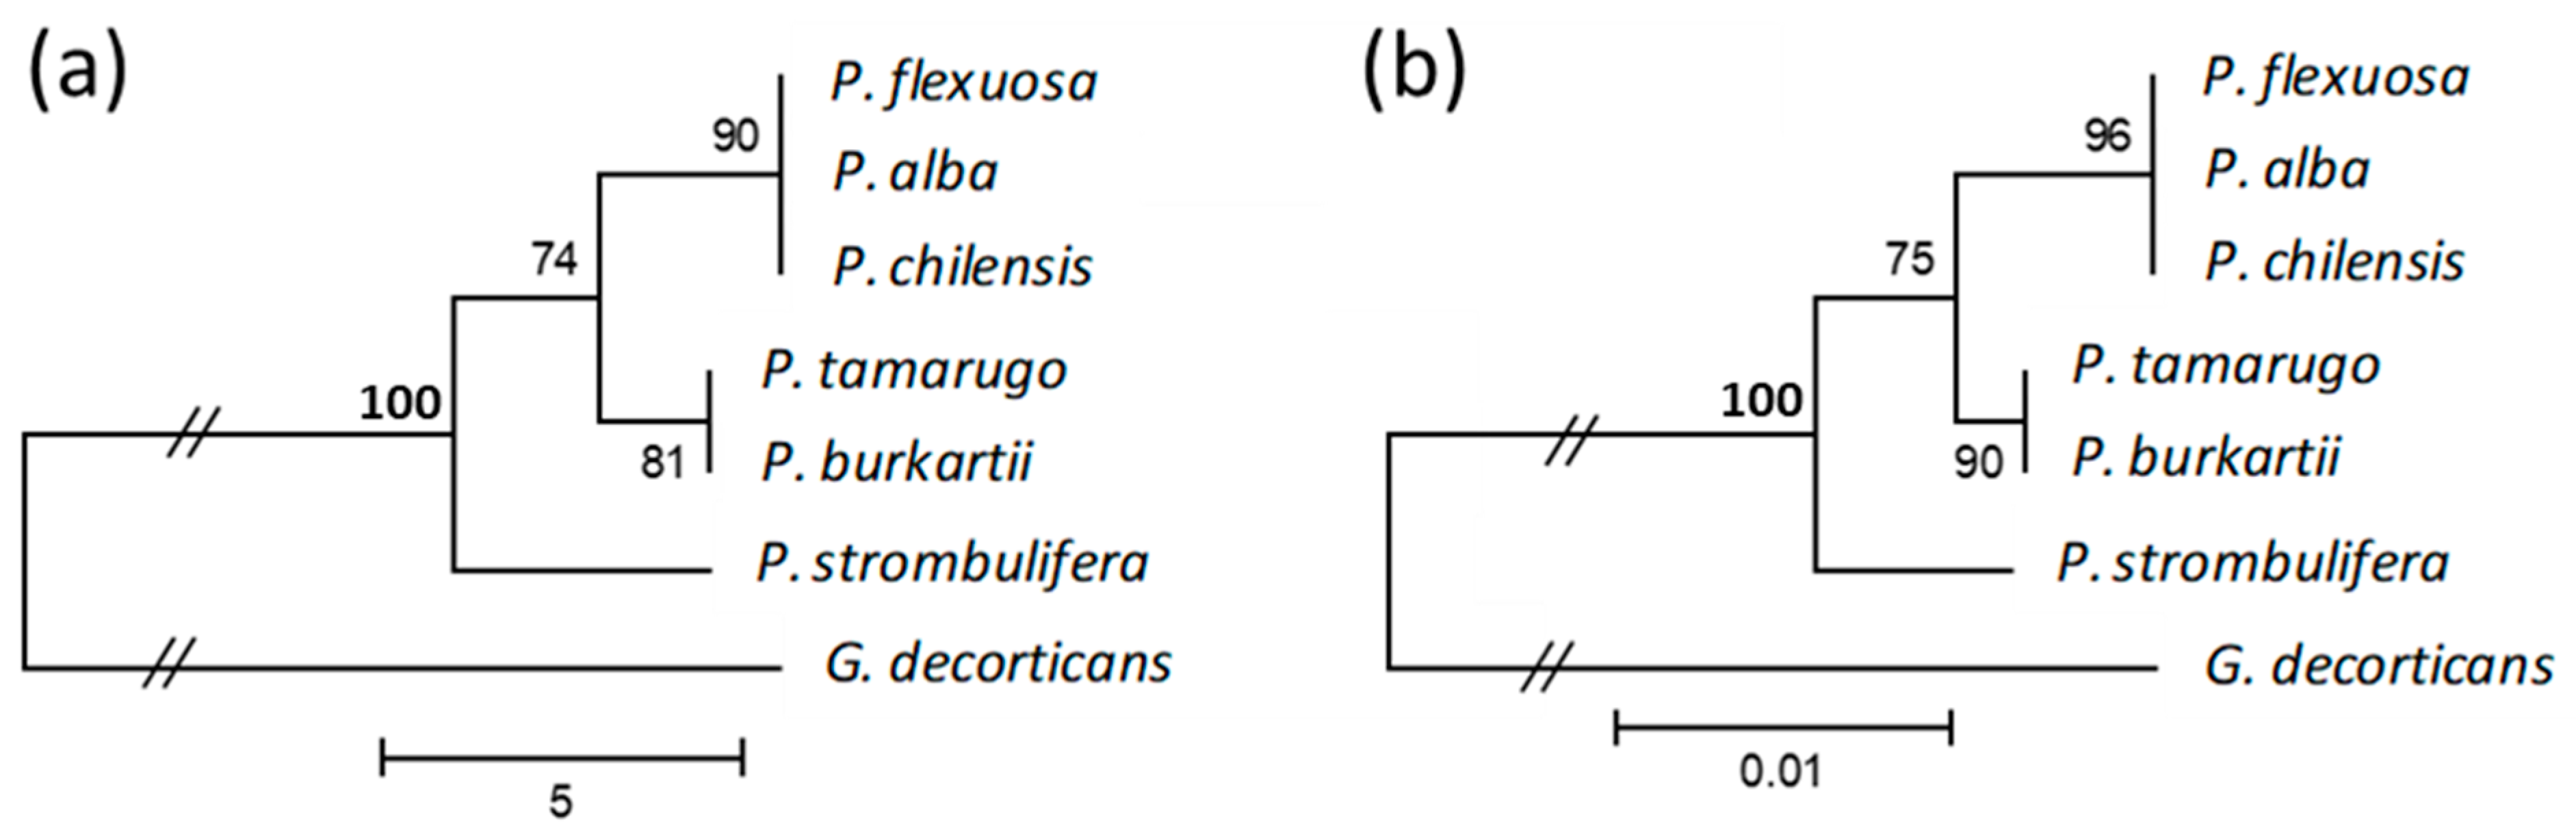
2.2. Characterization of the trnL Intron
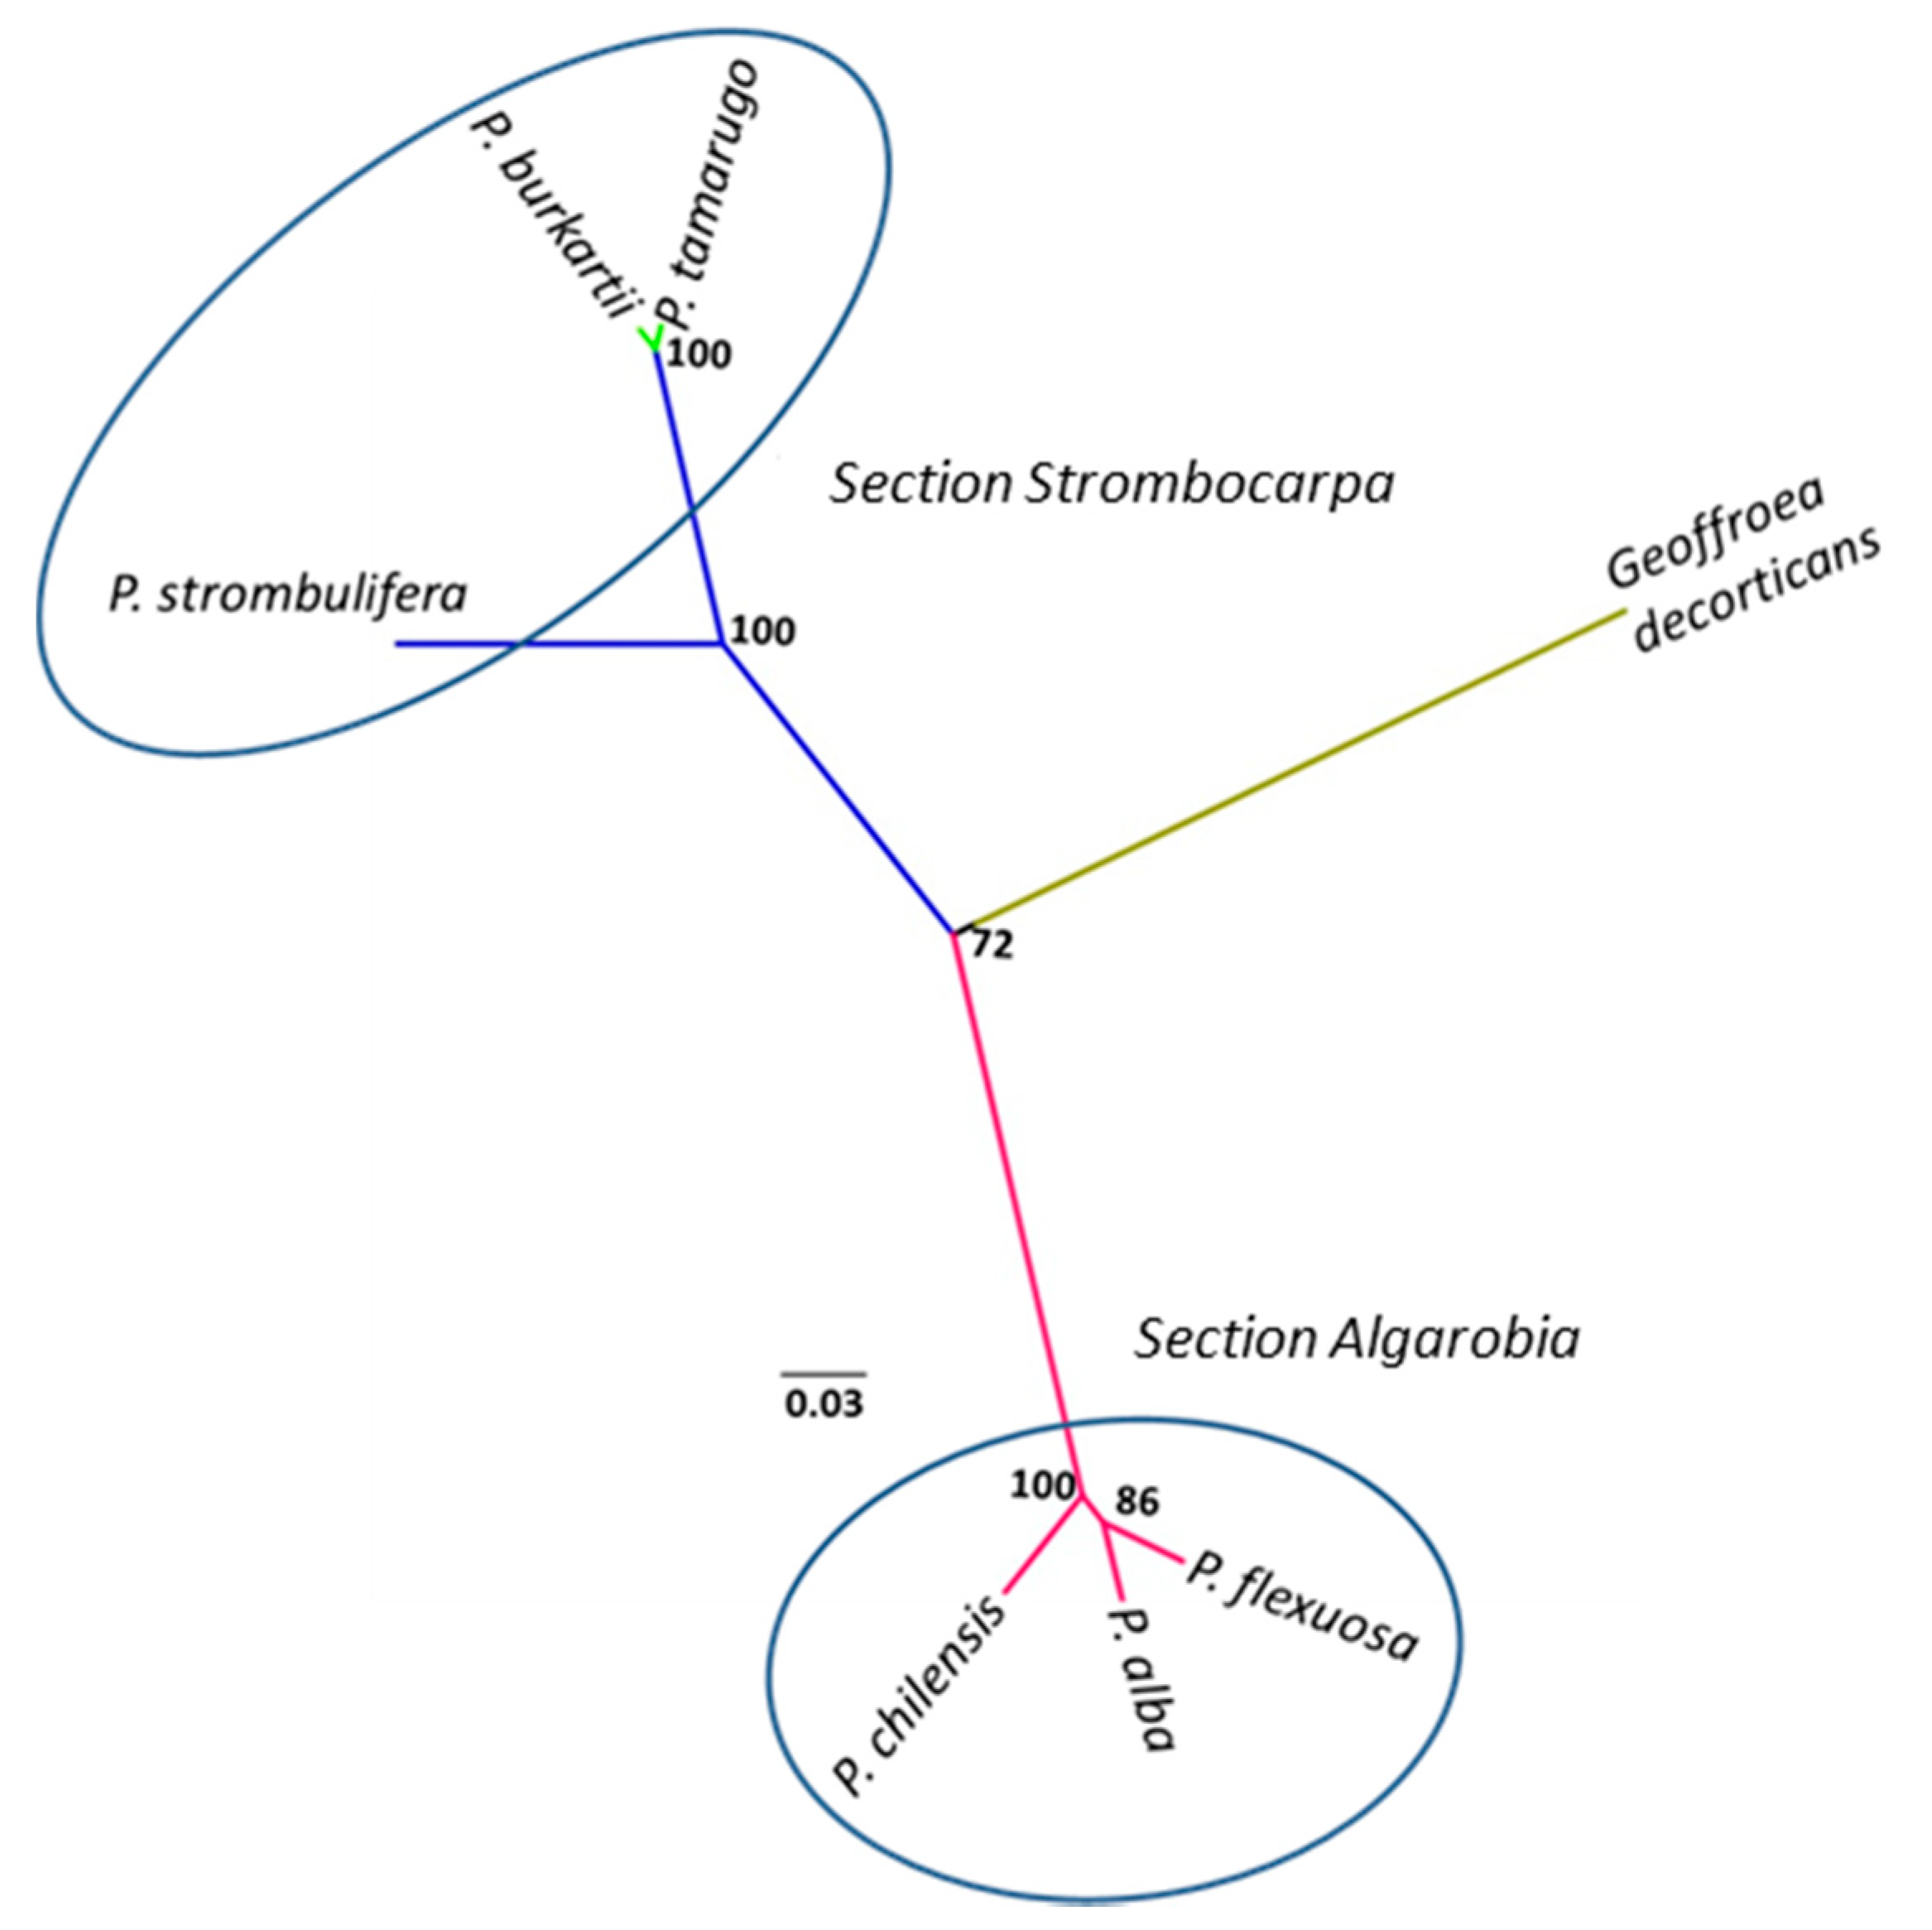
2.3. Cluster Analysis Using trnL Intron
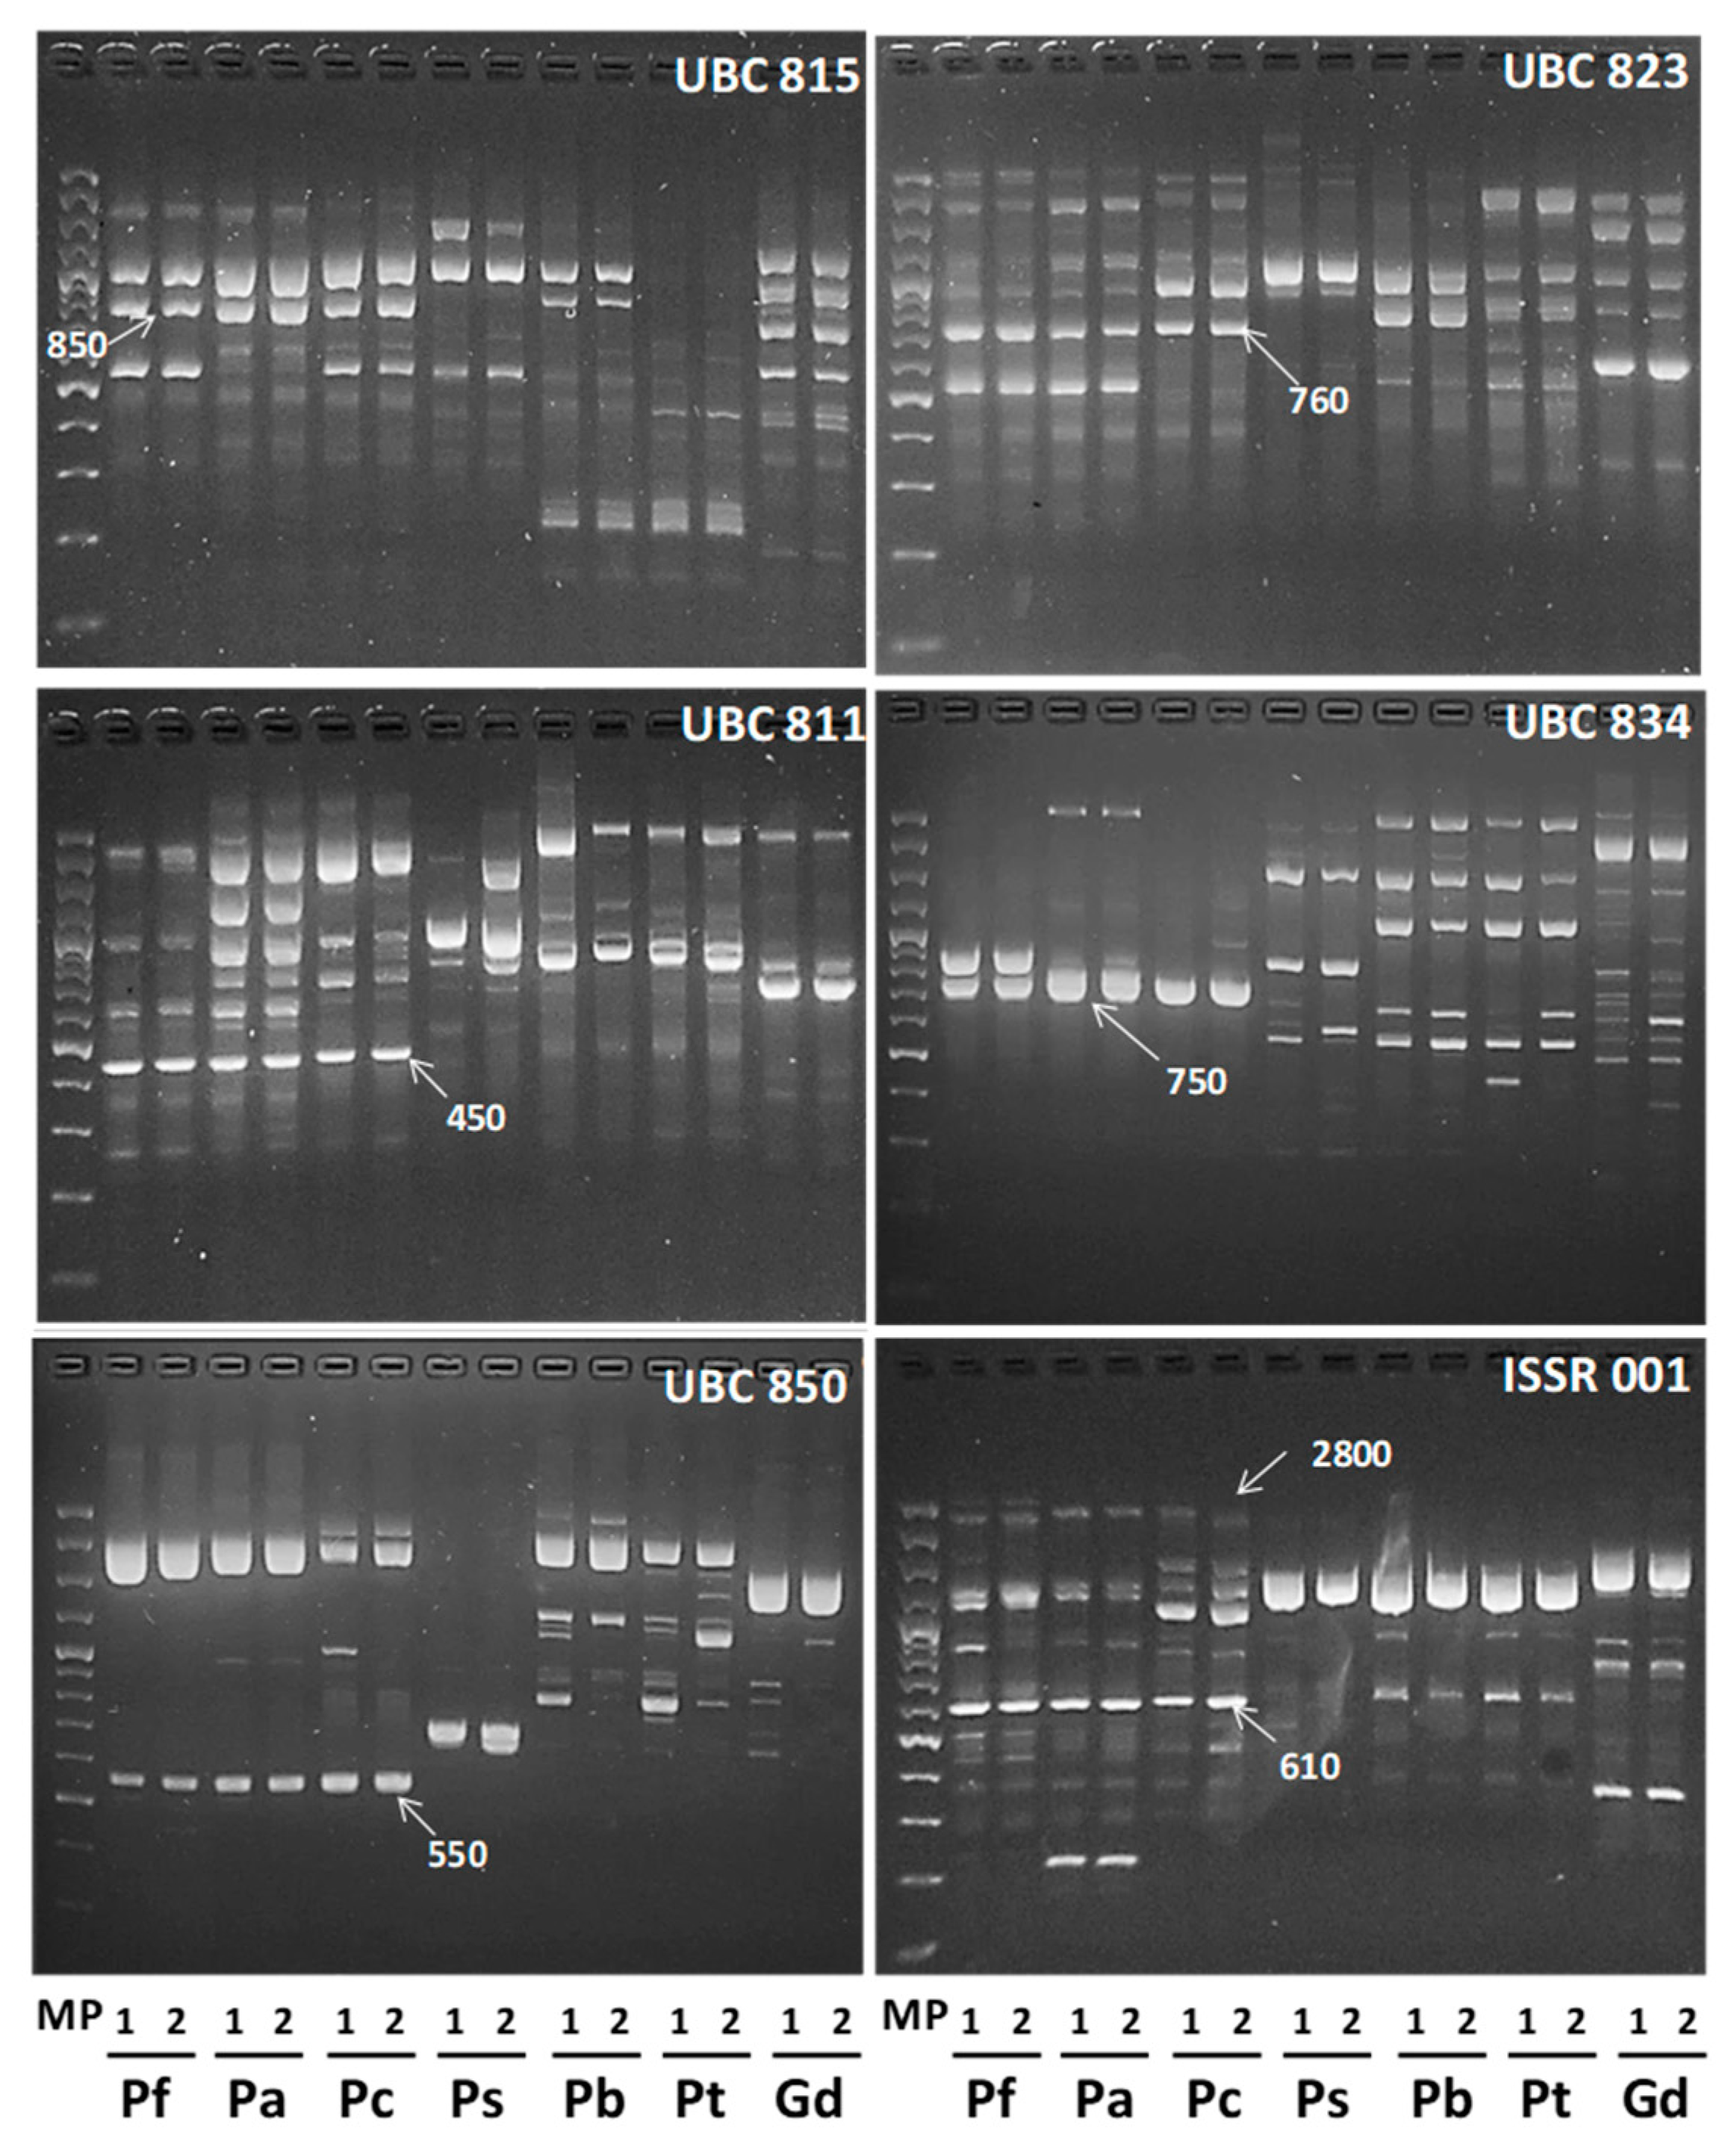
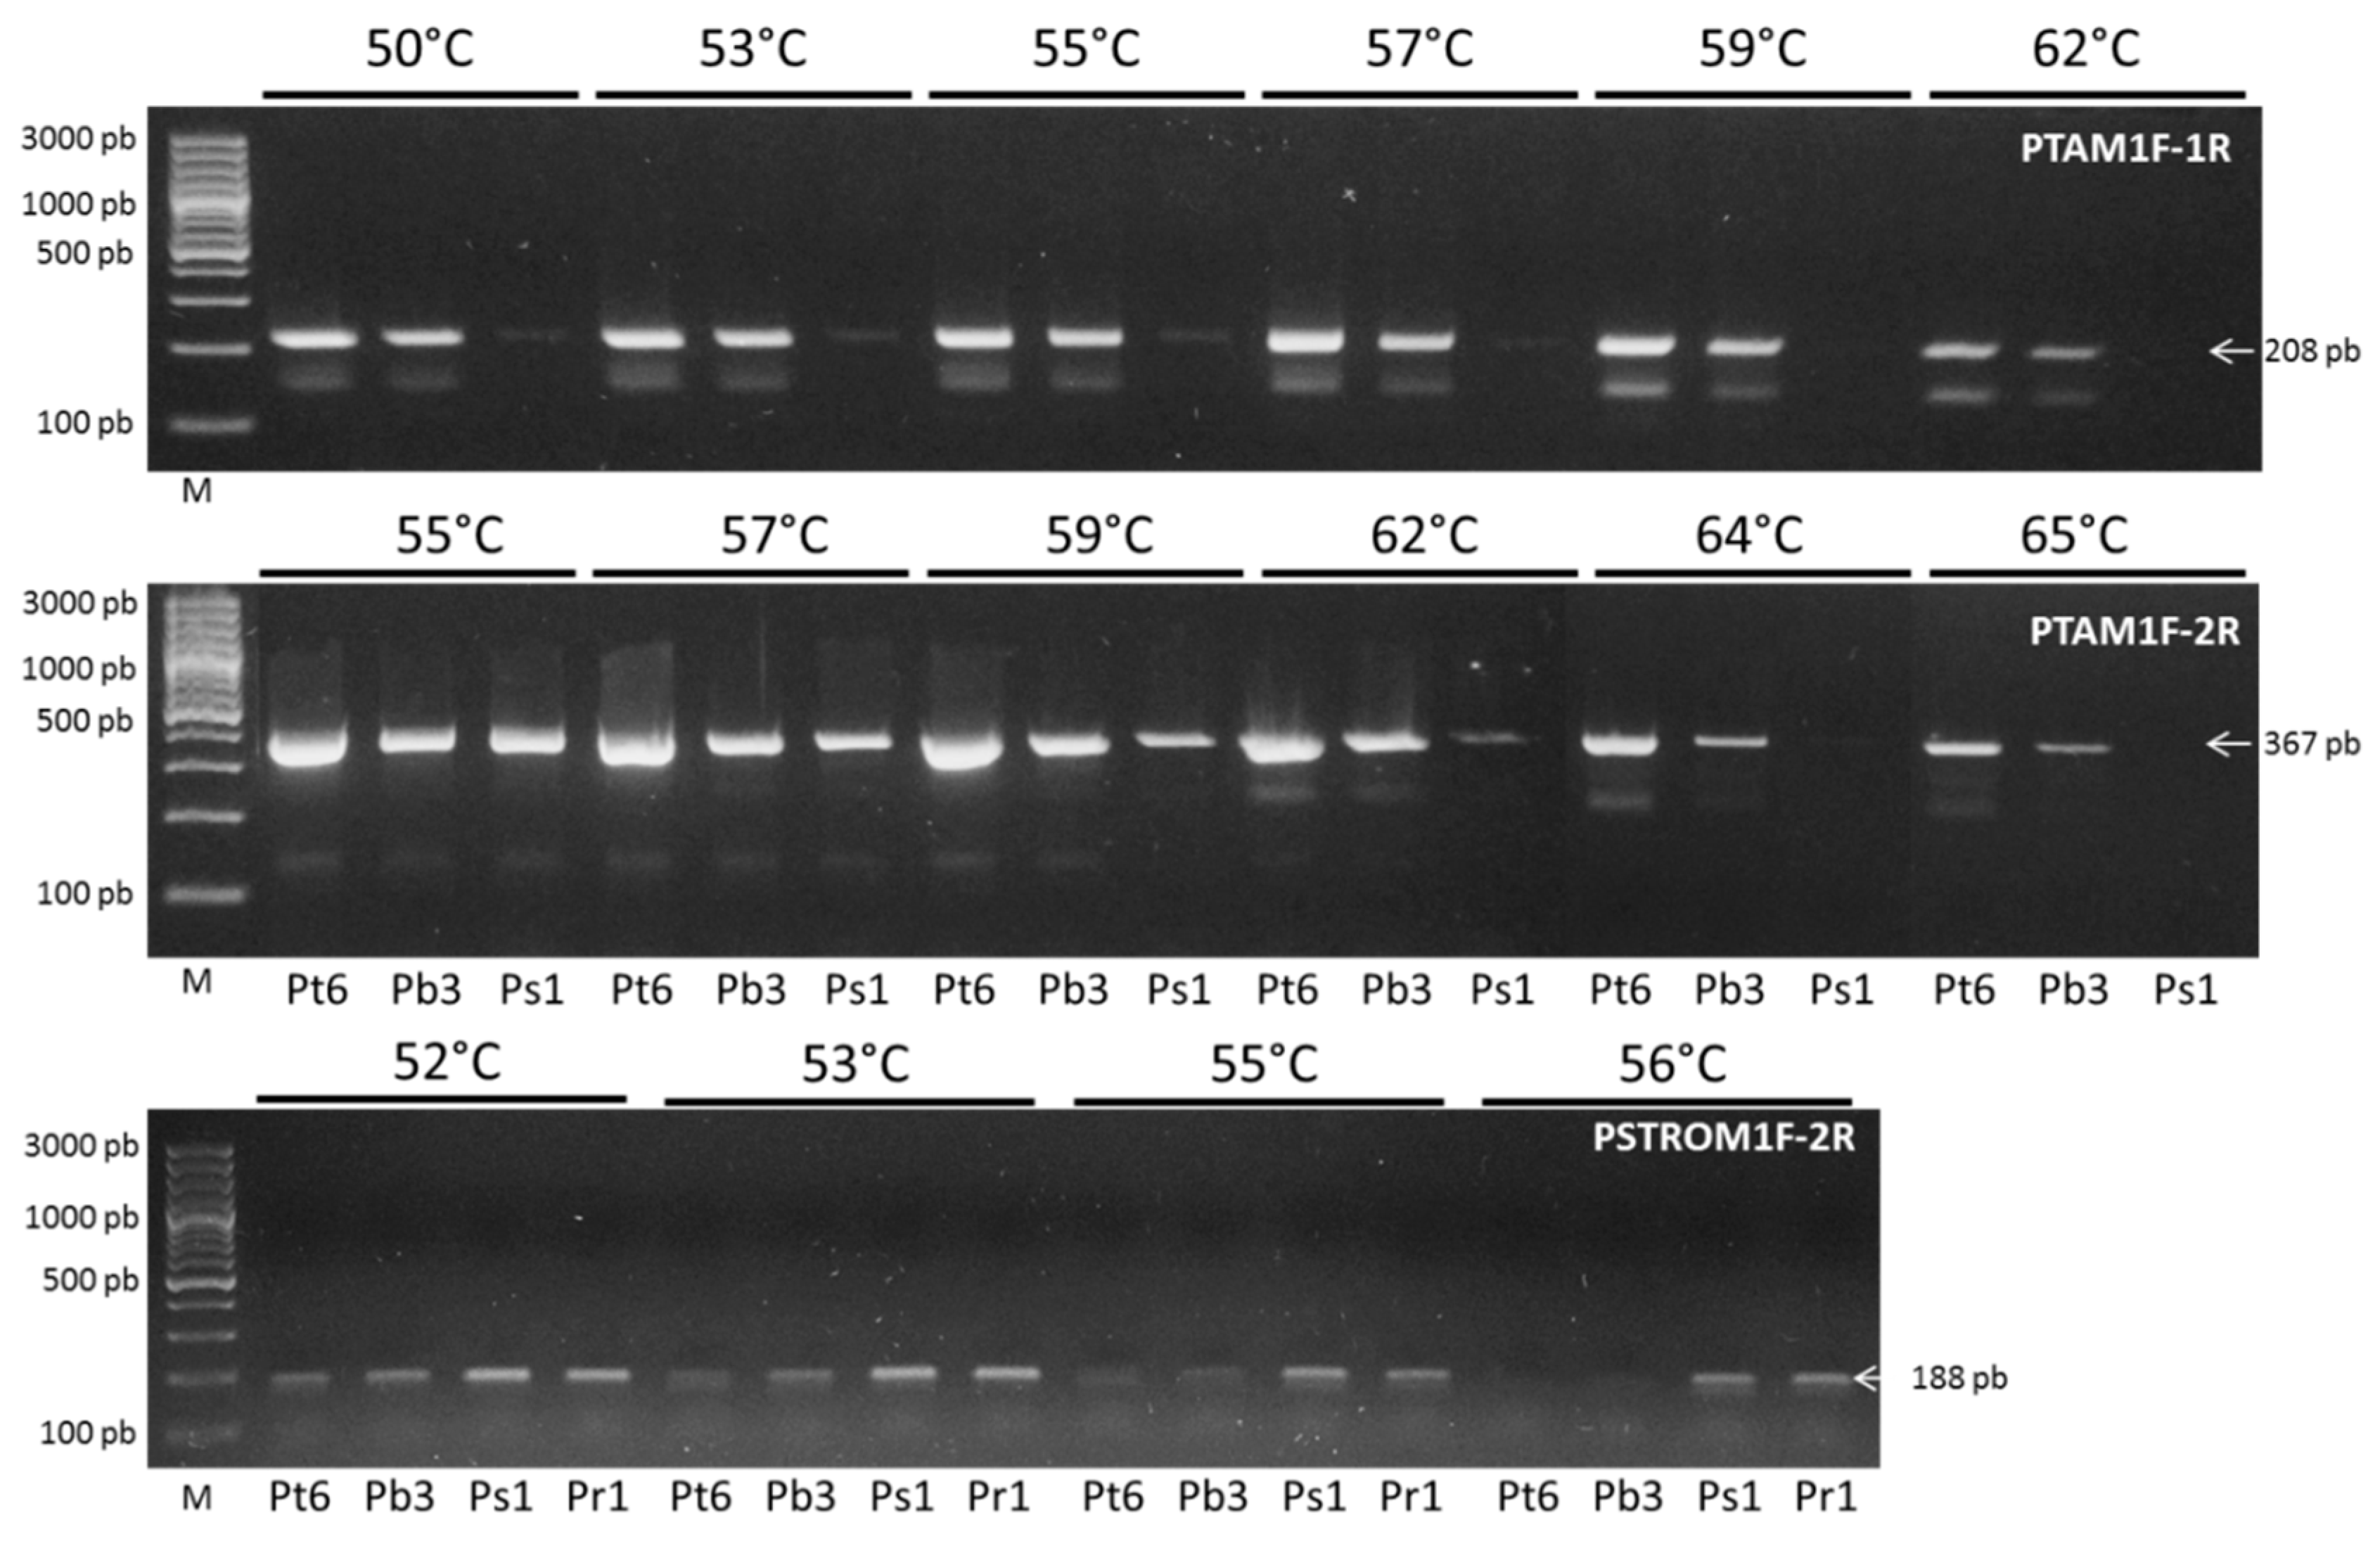
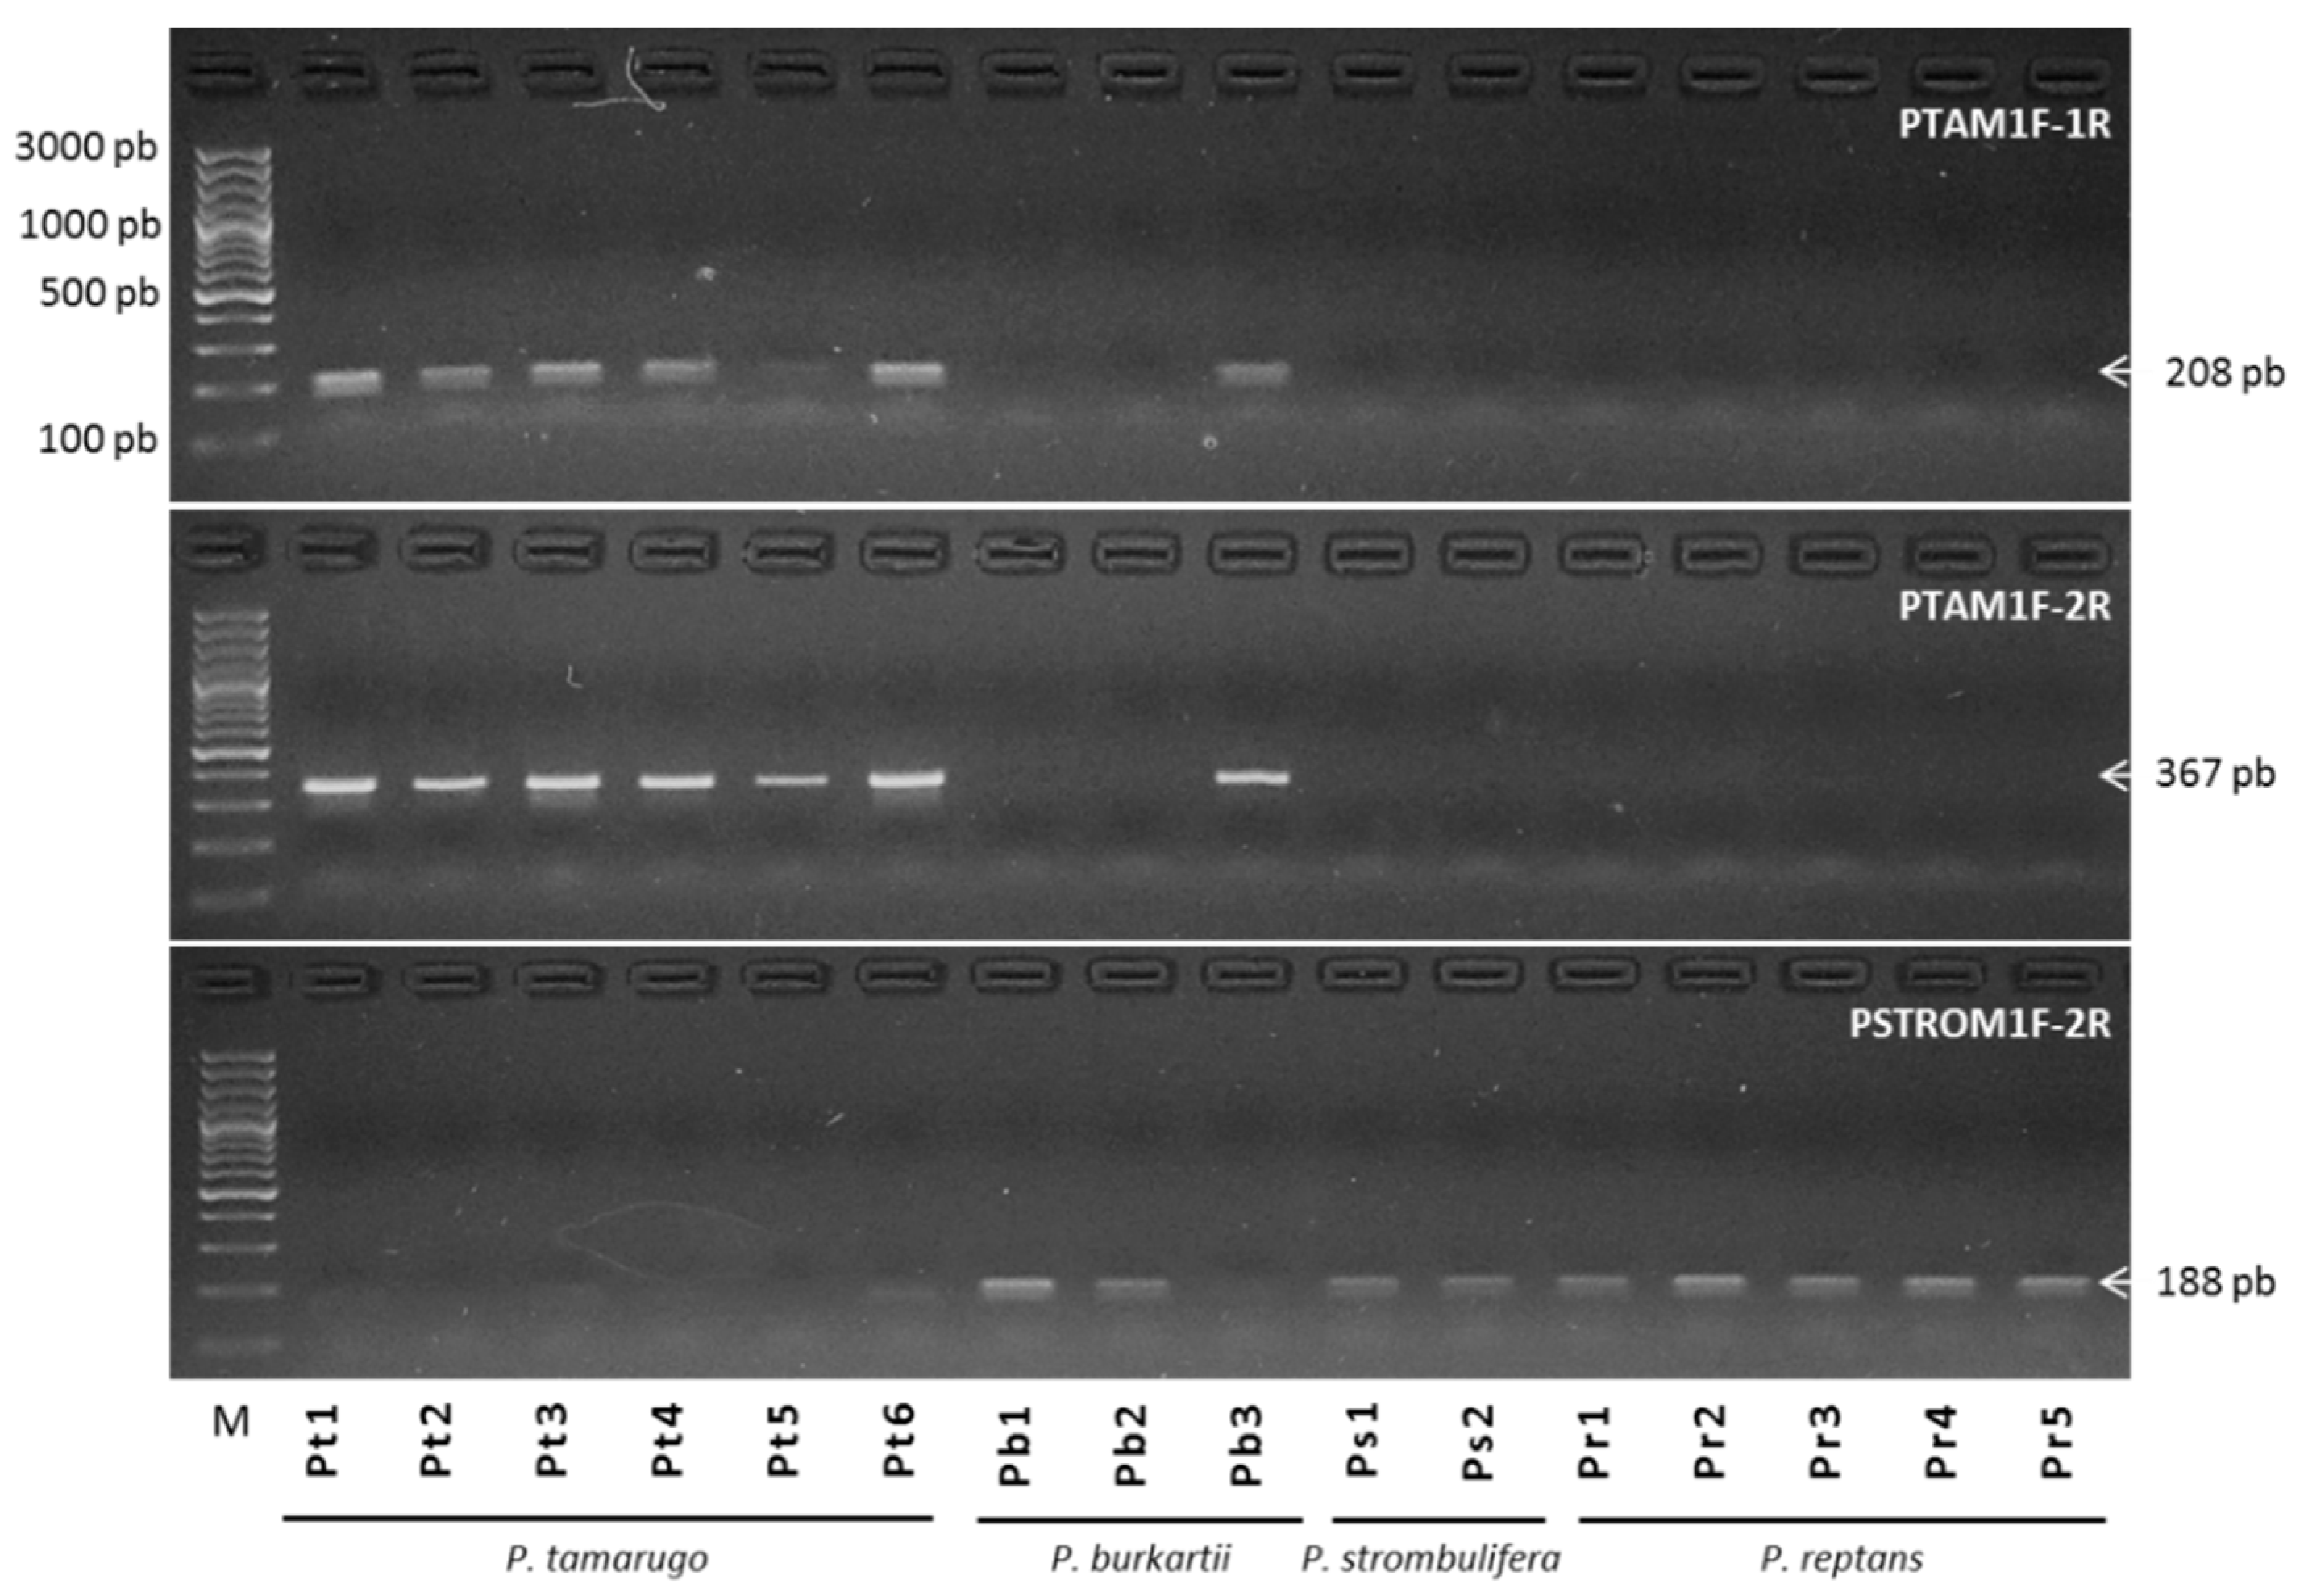
2.4. Parent-Diagnostic cpDNA Markers
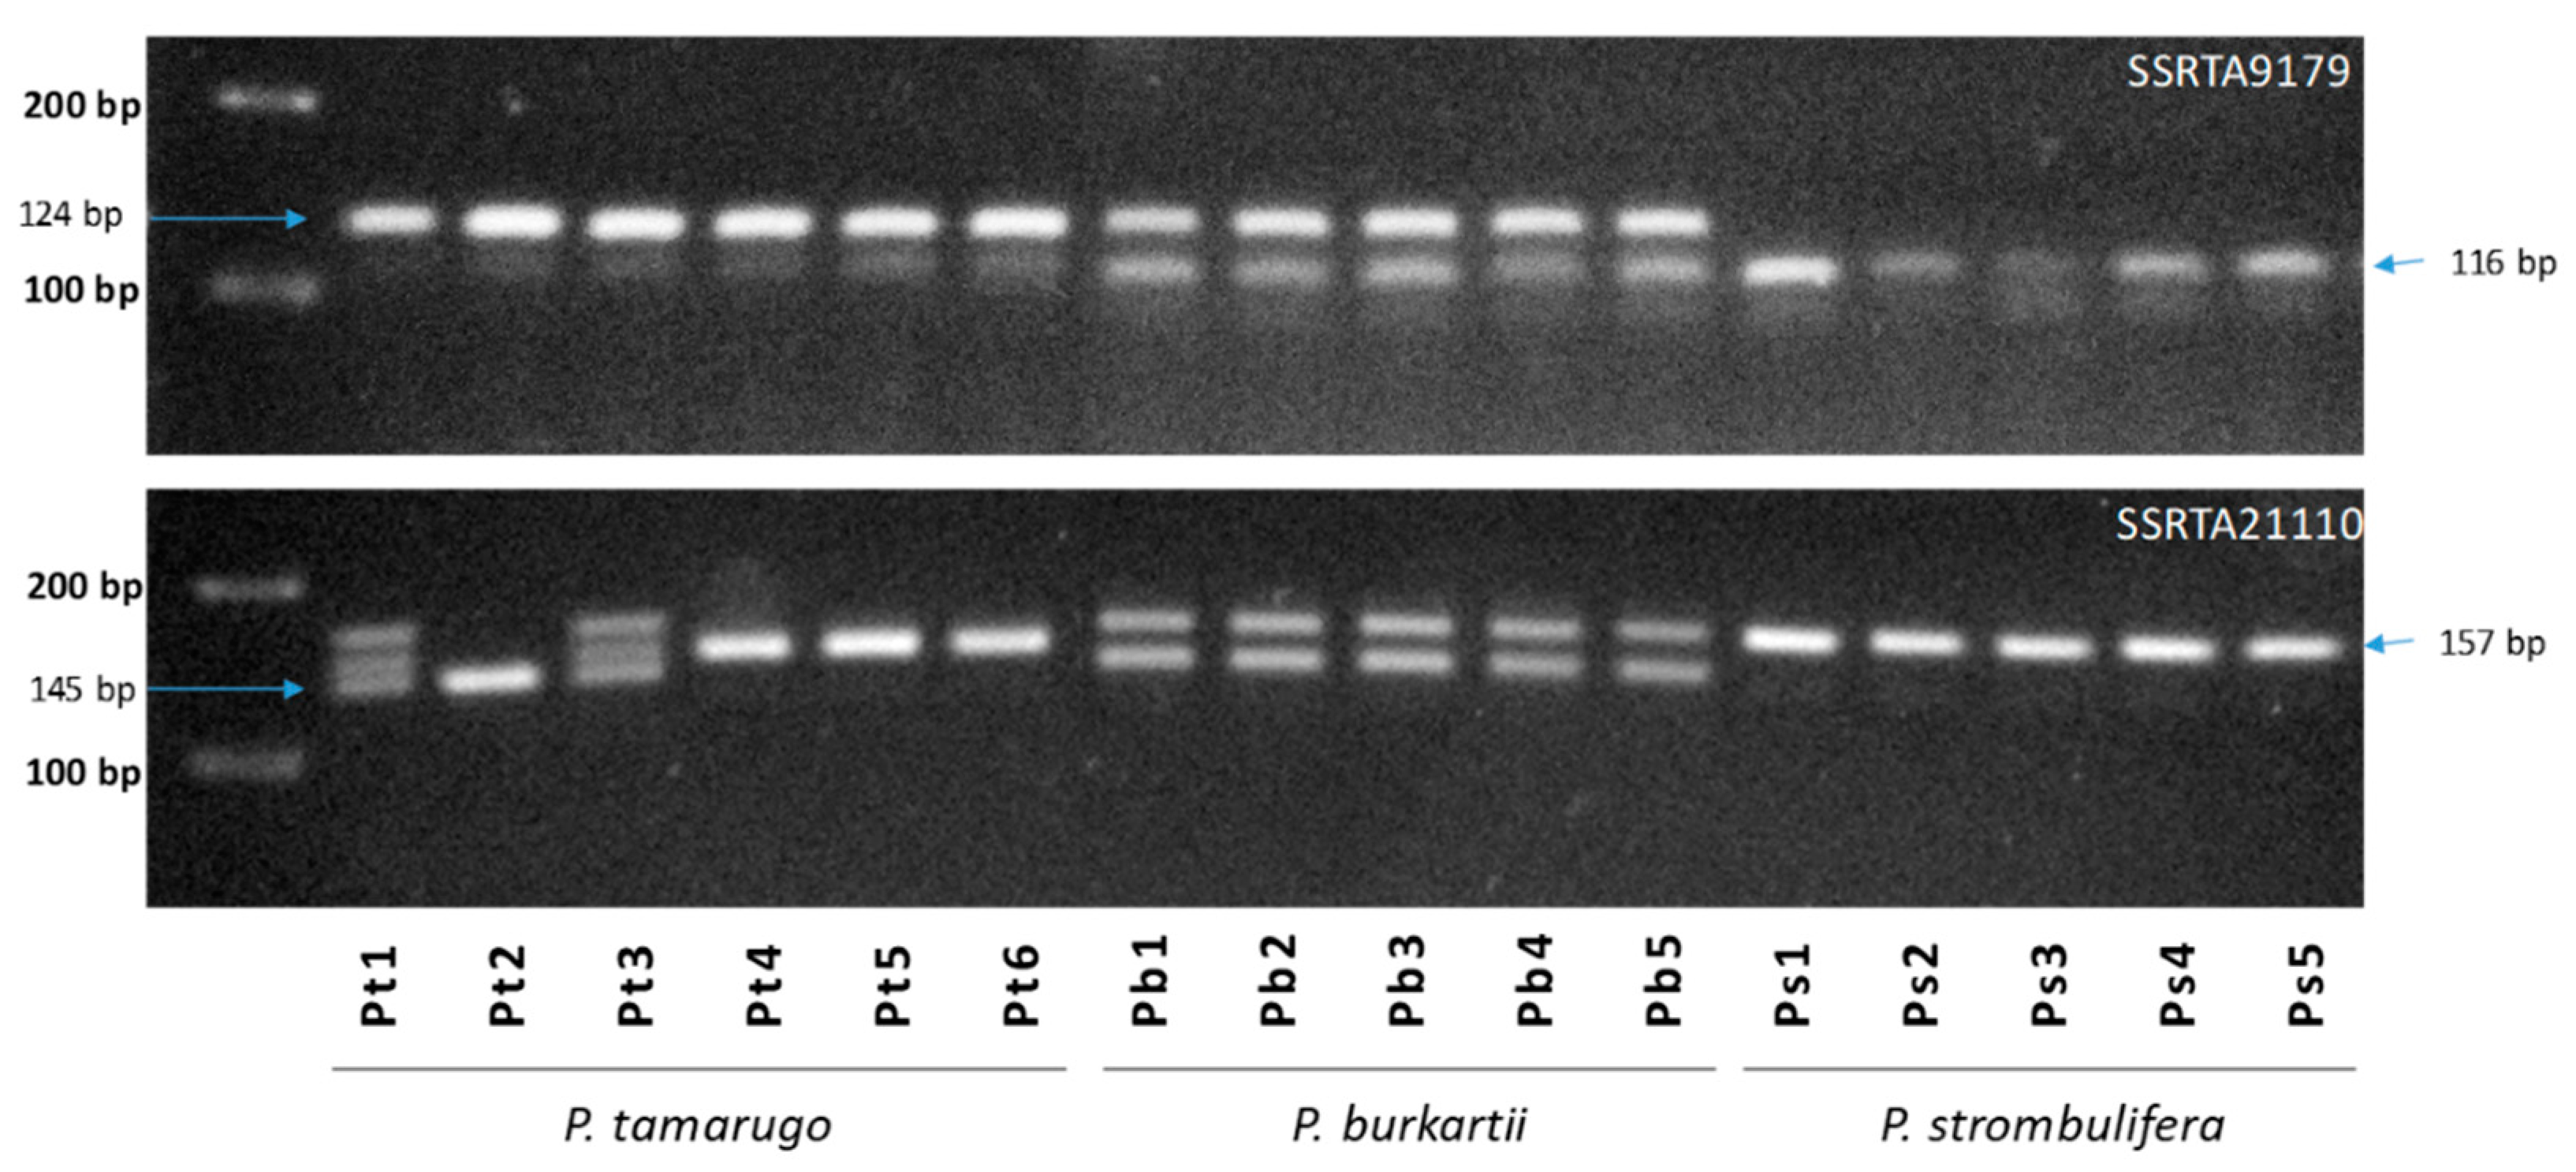
2.5. Species Diagnostic by SSR-PCR Markers
3. Discussion
4. Materials and Methods
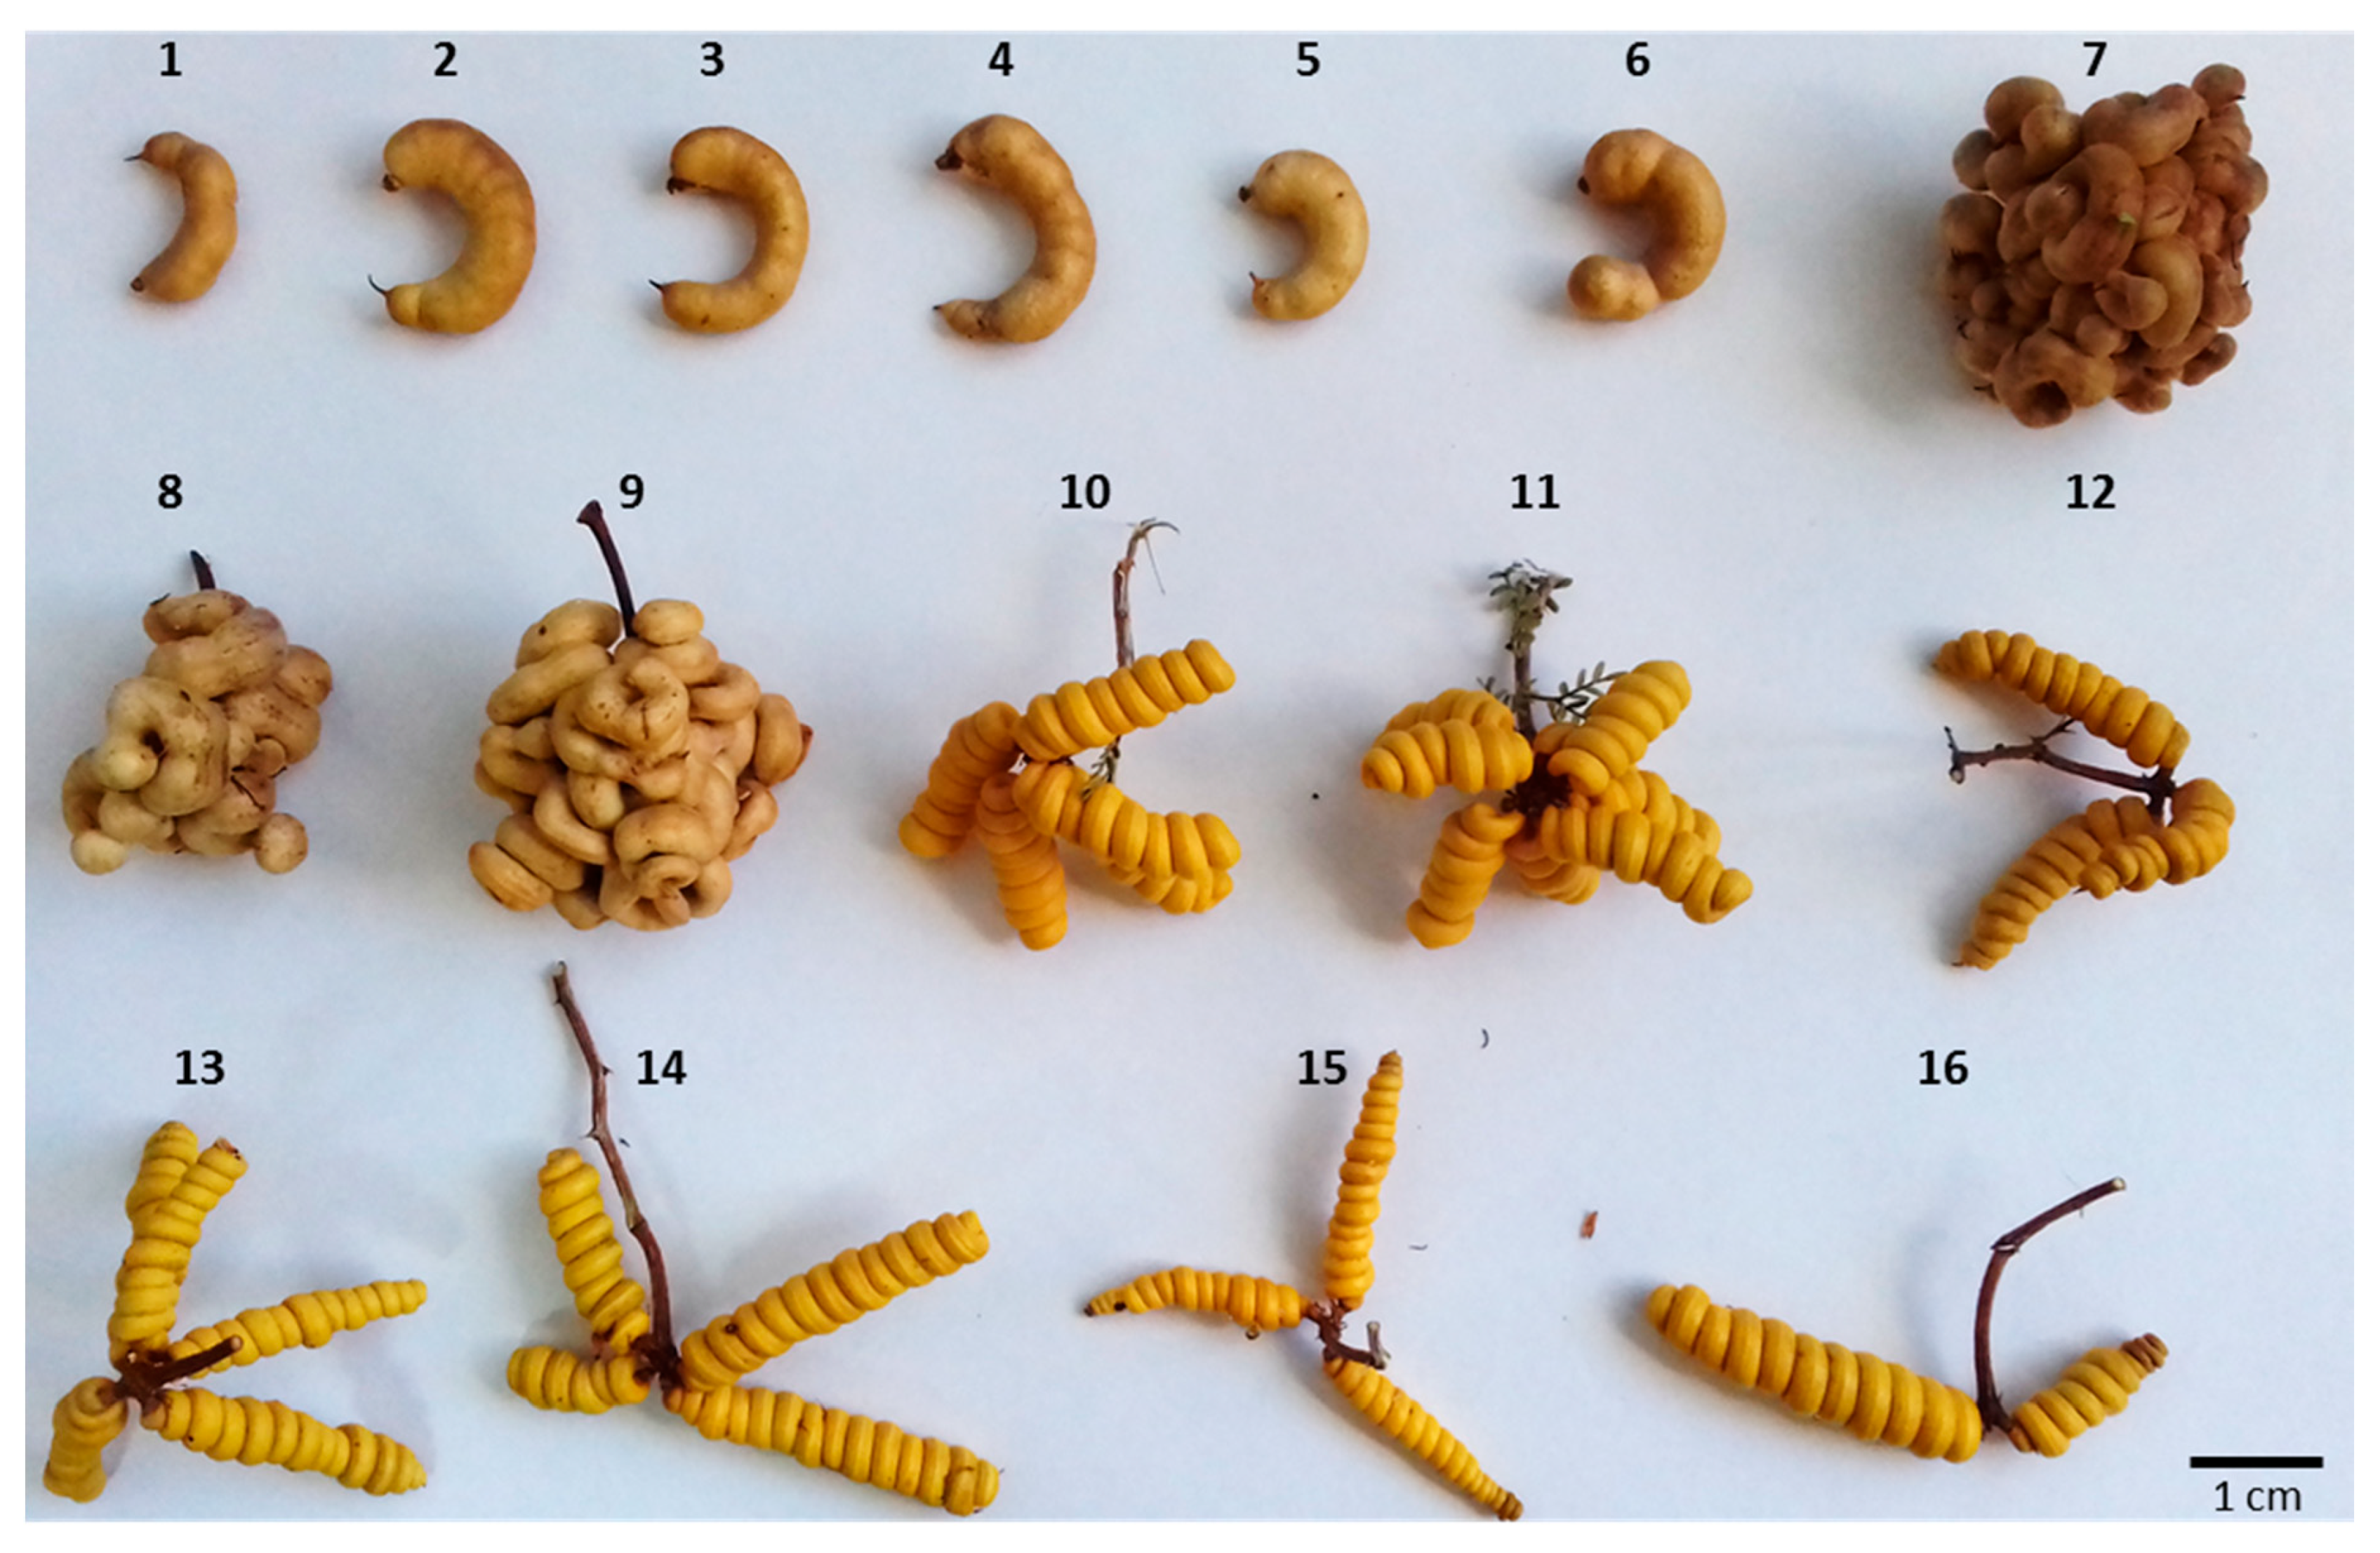
4.1. Plant Material
4.2. DNA Extraction
4.3. ISSR Amplification
4.4. TrnL Amplification and Sequencing
4.5. ISSR Analysis
4.6. Barcode Analysis
4.7. Specific Primer Design and PCR Optimization
4.8. Fingerprinting by SSR–PCR Reaction
5. Conclusions
Author Contributions
Funding
Acknowledgments
Conflicts of Interest
References
- Barros, S. El género Prosopis, valioso recurso forestal de las zonas áridas y semiáridas de América, Asia y Africa. Cienc. Invest. 2010, 16, 91–128. [Google Scholar]
- Burkart, A. A monograph of the genus Prosopis (leguminosae subfam. mimosoideae). J. Arnold Arbor. 1976, 57, 219–249. [Google Scholar]
- Barros, S.; Wrann, J. El Género Prosopis en Chile. Cienc. Invest. 1992, 6, 295–334. [Google Scholar]
- Ministerio de Medio Ambiente de Chile. Available online: http://www.mma.gob.cl/clasificacionespecies/index2.htm (accessed on 5 May 2020).
- Muñoz, P. Una nueva especie de Prosopis para el norte de Chile. Bol. Mus. Nac. Hist. Nat. Chile 1971, 32, 363–370. [Google Scholar]
- Ministerio de Medio Ambiente de Chile. Available online: http://www.mma.gob.cl/clasificacionespecies/fichas8proceso/fichas_finales/Prosopis_burkartii_P08_propuesta (accessed on 5 May 2020).
- Palacios, R.A.; Brizuela, M.M.; Burghardt, A.D.; Zallocchi, E.M.; Mom, M.P. Prosopis burkartii and its possible hybrid origin. Bull. Int. Group Study Mimosoideae 1991, 19, 146–161. [Google Scholar]
- Burghardt, A.D. Estudio electroforético de proteínas de semilla en Prosopis (Leguminosae) II: Sección Strombocarpa. Bol. Soc. Argent. Bot. 2000, 35, 149–156. [Google Scholar]
- Baack, E.J.; Rieseberg, L.H. A genomic view of introgression and hybrid speciation. Curr. Opin. Genet. Dev. 2007, 17, 513–518. [Google Scholar] [CrossRef] [Green Version]
- Wolfe, A.D.; Xiang, Q.Y.; Kephart, S.R. Diploid hybrid speciation in Penstemon (Scrophulariaceae). Proc. Natl. Acad. Sci. USA 1998, 95, 5112–5115. [Google Scholar] [CrossRef] [Green Version]
- Nadeem, M.A.; Nawaz, M.A.; Shahid, M.Q.; Doğan, Y.; Comertpay, G.; Yıldız, M.; Hatipoğlu, R.; Ahmad, F.; Alsaleh, A.; Labhane, N. DNA molecular markers in plant breeding: Current status and recent advancements in genomic selection and genome editing. Biotechnol. Biotechnol. Equip. 2017, 32, 1–25. [Google Scholar] [CrossRef] [Green Version]
- Hegarty, M.J.; Hiscock, J.S. Hybrid speciation in plants: New insights from molecular studies. New Phytol. 2004, 165, 411–423. [Google Scholar] [CrossRef]
- Zhang, R.; Gong, X.; Ryan, F. Evidence for continual hybridization rather than hybrid speciation between Ligularia duciformis and l. paradoxa (asteraceae). PeerJ 2017, 5, 3884. [Google Scholar] [CrossRef] [Green Version]
- Zietkiewicz, E.; Rafalski, A.; Labuda, D. Genome fingerprinting by simple sequence repeat (SSR-Anchored) polymerase chain reaction amplification. Genomics 1994, 20, 176–183. [Google Scholar] [CrossRef]
- Mogensen, H.L. The hows and whys of cytoplasmic inheritance in seed plants. Am. J. Bot. 1996, 83, 383–404. [Google Scholar] [CrossRef]
- McCauley, D.E.; Sunby, A.K.; Bailey, M.F.; Welch, M.E. Inheritance of chloroplast DNA is not strictly maternal in Silene vulgaris (Caryophyllaceae): Evidence from experimental crosses and natural populations. Am. J. Bot. 2007, 94, 1333–1337. [Google Scholar] [CrossRef] [PubMed] [Green Version]
- Hebert, P.D.N.; Cywinska, A.; Ball, S.L.; Dewaard, J.R. Biological identifications through DNA barcodes. Proc. Biol. Sci. 2003, 270, 313–321. [Google Scholar] [CrossRef] [PubMed] [Green Version]
- Pei, N.; Chen, B.; Kress, W.J. Advances of community-level plant DNA barcoding in China. Front. Plant. Sci. 2017, 8, 225. [Google Scholar] [CrossRef] [Green Version]
- Santos, C.; Pereira, F. Identification of plant species using variable length chloroplast DNA sequences. Forensic Sci. Int. Genet. 2018, 36, 1–12. [Google Scholar] [CrossRef]
- Taberlet, P.; Gielly, L.; Pautou, G.; Bouvet, J. Universal primers for amplification of three noncoding regions of chloroplast DNA. Plant Mol. Biol. 1991, 17, 1105–1109. [Google Scholar] [CrossRef]
- Taberlet, P.; Coissac, E.; Pompanon, F.; Gielly, L.; Miquel, C.; Valentini, A.; Vermat, T.; Corthier, G.; Brochmann, C.; Willerslev, E. Power and limitations of the chloroplast trnL (UAA) intron for plant DNA barcoding. Nucleic Acids Res. 2006, 35, e14. [Google Scholar] [CrossRef] [Green Version]
- Quandt, D.; Müller, K.; Stech, M.; Frahm, J.P.; Frey, W.; Hilu, K.W.; Borsch, T. Molecular evolution of the chloroplast trnL-F region in land plants. Monogr. Syst. Bot. Missouri Botanic Garden 2004, 98, 13–37. [Google Scholar]
- Bessega, C.; Vilardi, J.C.; Saidman, B.O. Genetic relationships among American species of the genus Prosopis (Mimosoideae, Leguminosae) inferred from ITS sequences: Evidence for long-distance dispersal. J. Biogeogr. 2006, 33, 1905–1915. [Google Scholar] [CrossRef]
- Catalano, S.A.; Vilardi, J.C.; Tosto, D.; Saidman, B.O. Molecular phylogeny and diversification history of Prosopis (Fabaceae: Mimososideae). Biol. J. Linn. Soc. 2008, 93, 621–640. [Google Scholar] [CrossRef] [Green Version]
- Maloukh, L.; Kumarappan, A.; Jarrar, M.; Salehi, J.; El-Wakil, H.; Lakshmi, T.R. Discriminatory power of rbcL barcode locus for authentication of some of United Arab Emirates (UAE) native plants. 3 Biotech 2017, 7, 144. [Google Scholar] [CrossRef] [PubMed] [Green Version]
- Hunziker, J.H.; Saidman, B.O.; Naranjo, C.A.; Palacios, R.A.; Poggio, L.; Burghardt, A.D. Hybridization and genetic variation of Argentine species of Prosopis. For. Ecol. Manag. 1986, 16, 301–315. [Google Scholar] [CrossRef]
- Saidman, B.O.; Vilardi, J.C.; Pocovi, M.I.; Acreche, N. Genetic divergence among species of the section Strombocarpa genus Prosopis (Leguminosae). J. Genet. 1996, 75, 139–149. [Google Scholar] [CrossRef]
- Burghardt, A.D.; Espert, S.M. Phylogeny of Prosopis (Leguminosae) as shown by morphological and biochemical evidence. Austral. Syst. Bot. 2007, 20, 332–339. [Google Scholar] [CrossRef]
- Ramírez, L.; De La Vega, A.; Razkin, N.; Luna, V.; Harris, P.J.C. Analysis of the relationship between species of the Genus Prosopis revealed by the use of molecular markers. Agronomie 1999, 19, 31–43. [Google Scholar] [CrossRef] [Green Version]
- Ruas, P.M.; Ruas, C.F.; Rampim, L.; Carvalho, V.P.; Ruas, E.A.; Sera, T. Genetic relationship in Coffea species and parentage determination of inter-specific hybrids using ISSR (inter-simple sequence repeat) markers. Genet. Mol. Biol. 2003, 26, 319–327. [Google Scholar] [CrossRef] [Green Version]
- Sun, M.; Lo, E. Genomic markers reveal introgressive hybridization in the indo-west pacific mangroves: A case study. PLoS ONE 2011, 6, e19671. [Google Scholar] [CrossRef] [Green Version]
- Sutkowska, A.; Pasierbinski, A.; Baba, W.; Warzecha, T.; Mitka, J. Additivity of ISSR markers in natural hybrids of related forest species Bromus benekenii and B. ramosus (Poaceae). Acta Biol. Cracov. Bot. 2015, 57, 82–94. [Google Scholar] [CrossRef] [Green Version]
- Burghardt, A.D.; Prosopis, L. Caracterización Electroforética de sus Especies. Ph.D. Thesis, Universidad de Buenos Aires, Buenos Aires, Argentina, 1992. [Google Scholar]
- Saidman, B.O. Estudio de la Variación Alozímica en el Género Prosopis. Ph.D. Thesis, Universidad de Buenos Aires, Buenos Aires, Argentina, 1985. [Google Scholar]
- Carevic, F.; Delatorre-Herrera, J.; Carrasco, H. Plant water variables and reproductive traits are influenced by seasonal climatic variables in Prosopis burkartii (Fabaceae) at Northern Chile. Flora 2017, 233, 7–11. [Google Scholar] [CrossRef]
- Schwarzacher, T.; Anamthawat-Jensson, K.; Harrison, G.E. Genomic in situ hybridization to identify alien chromosomes and chromosome segments in wheat. Theor. Appl. Genet. 1992, 84, 778–786. [Google Scholar] [CrossRef]
- Younis, A.; Ramzan, F.; Hwang, Y.J.; Lim, K.B. FISH and GISH: Molecular cytogenetic tools and their applications in ornamental plants. Plant Cell Rep. 2015, 34, 1477–1488. [Google Scholar] [CrossRef]
- Lo, E.Y.Y. Testing hybridization hypotheses and evaluating the evolutionary potential of hybrids in mangrove plant species. J. Evol. Biol. 2010, 23, 2249–2261. [Google Scholar] [CrossRef]
- Silva, J.N.; Bezerra Da Costa, A.; Silva, J.S.; Almeida, C. DNA barcoding and phylogeny in neotropical species of the genus spondias. Biochem. Syst. Ecol. 2015, 61, 240–243. [Google Scholar] [CrossRef]
- Larranaga, N.; Hormaza, J.I. DNA barcoding of perennial fruit tree species of agronomic interest in the genus Annona (Annonaceae). Front. Plant Sci. 2015, 6, 589. [Google Scholar] [CrossRef] [Green Version]
- Balasaravanan, T.; Chezhian, P.; Kamalakannan, R.; Yasodha, R.; Varghese, R.; Gurumurthi, K.; Ghosh, M. Identification of species-diagnostic ISSR markers for six Eucalyptus species. Silvae Genet. 2006, 55, 119–122. [Google Scholar] [CrossRef]
- Dong, W.; Xu, C.; Cheng, T.; Lin, K.; Zhou, S. Sequencing angiosperm plastid genomes made easy: A complete set of universal primers and a case study on the phylogeny of saxifragales. Genome Biol. Evol. 2013, 5, 989–997. [Google Scholar] [CrossRef] [PubMed] [Green Version]
- Cbol Plant Working Group. A DNA barcode for land plants. Proc. Natl. Acad. Sci. USA 2009, 106, 12794–12797. [Google Scholar] [CrossRef] [PubMed] [Green Version]
- Besnard, G.; Rubio De Casas, R.; Christin, P.; Vargas, P. Phylogenetics of Olea (Oleaceae) based on plastid and nuclear ribosomal DNA sequences: Tertiary climatic shifts and lineage differentiation times. Ann. Bot. 2009, 104, 143–160. [Google Scholar] [CrossRef] [Green Version]
- Kwok, P.Y. Methods for genotyping single nucleotide polymorphisms. Annu. Rev. Genom. Hum. Genet. 2001, 2, 235–258. [Google Scholar] [CrossRef] [PubMed] [Green Version]
- Liu, J.; Huang, S.; Sun, M.; Liu, S.; Liu, Y.; Wang, W.; Zhang, X.; Wang, H.; Hua, W. An improved allele-specific PCR primer design method for SNP marker analysis and its application. Plant Methods 2012, 8, 34. [Google Scholar] [CrossRef] [PubMed] [Green Version]
- Contreras, R.; Sepúlveda, B.; Aguayo, F.; Porcile, V. Rapid diagnostic PCR method for identification of the genera Sarcocornia and Salicornia. Idesia 2018, 36, 95–106. [Google Scholar] [CrossRef] [Green Version]
- Birky, C.W. Uniparental inheritance of organelle genes. Curr. Biol. 2008, 18, 692–695. [Google Scholar] [CrossRef] [PubMed] [Green Version]
- Zimmer, E.A.; Wen, J. Using nuclear gene data for plant phylogenetics: Progress and prospects. Mol. Phylogenet. Evol. 2013, 66, 539–550. [Google Scholar] [CrossRef]
- Zöllner, O.; Olivares, M.A. Prosopis reptans Benth. var. chilensis (Mimosaceae), una nueva variedad para Chile. Noticiario Mensual del Museo Nacional de Historia Natural (Chile) 2001, 344, 9–14. [Google Scholar]
- Burkart, A. A monograph of the genus prosopis (Leguminosae, subfam. Mimosoideae). Cataloque of the recognized species of Prosopis. J. Arnold Arbor. 1977, 57, 450–525. [Google Scholar]
- Contreras, R.; Aguayo, F.; Gugiana-Nilo, D.; Porcile, V. An efficient protocol to perform genetic traceability in Geoffroea decorticans foods. Chil. J. Agric. Anim. Sci. 2019, 35, 224–237. [Google Scholar] [CrossRef] [Green Version]
- Contreras, R.; Tapia, F. Identificación genética de la variedad de olivo (Olea europaea L.) Sevillana y su relación con variedades productivas existentes en la provincia del Huasco. Idesia 2016, 34, 15–22. [Google Scholar] [CrossRef] [Green Version]
- Contreras, R.; Porcile, V.; Aguayo, F. Genetic diversity of Geoffroea decorticans, a native woody leguminous species from Atacama Desert in Chile. Bosque 2018, 39, 321–332. [Google Scholar] [CrossRef]
- Prevost, A.; Wilkinson, M.J. A new system of comparing PCR primers applied to ISSR fingerprinting of potato cultivars. Theor. Appl. Genet. 1999, 98, 107–112. [Google Scholar] [CrossRef]
- Roldan-Ruiz, I.; Dendauw, J.; Vanbockstaele, E.; Depicker, A.; De Loose, M. AFLP markers reveal high polymorphic rates in ryegrasses (Lolium spp.). Mol. Breed. 2000, 6, 125–134. [Google Scholar] [CrossRef]
- Yap, I.V.; Nelson, R.J. Winboot: A Program for Performing Bootstrap Analysis of Binary Data to Determine the Confidence Limits of UPGMA-Based Dendrograms; International Rice Research Institute: Manila, Philippines, 1996; 22p. [Google Scholar]
- Felsenstein, J. PHYLIP-Phylogeny inference package (version 3.2). Cladistics 1989, 5, 164–166. [Google Scholar]
- Figtree: Tree Figure Drawing Tool Version 1.4. Available online: http://tree.bio.ed.ac.uk/software/figtree (accessed on 6 May 2020).
- PAST: Paleontological Statistics Software Package for Education and Data Analysis. Available online: http://palaeo-electronica.org/2001_1/past/issue1_01.htm (accessed on 6 May 2020).
- Pritchard, J.K.; Stephens, M.; Donnelly, P. Inference of population structure using multilocus genotype data. Genetics 2000, 155, 945–959. [Google Scholar] [CrossRef]
- Evanno, G.; Regnaut, S.; Goudet, J. Detecting the number of clusters of individuals using the software STRUCTURE: A simulation study. Mol. Ecol. 2005, 14, 2611–2620. [Google Scholar] [CrossRef] [Green Version]
- Earl, D.A. STRUCTURE HARVESTER: A website and program for visualizing STRUCTURE output and implementing the Evanno method. Conserv. Genet. Resour. 2012, 4, 359–361. [Google Scholar] [CrossRef]
- Tamura, K.; Stecher, G.; Peterson, D.; Filipski, A.; Kumar, S. MEGA6: Molecular evolutionary genetics analysis version 6.0. Mol. Biol. Evol. 2013, 30, 2725–2729. [Google Scholar] [CrossRef] [Green Version]
- Chenna, R.; Sugawara, H.; Koike, T.; Lopez, R.; Gibson, T.J.; Higgins, D.G.; Thompson, J.D. Multiple sequence alignment with the clustal series of programs. Nucleic Acids Res. 2003, 31, 3497–3500. [Google Scholar] [CrossRef] [Green Version]
- Contreras, R. Development and characterization of microsatellites in Prosopis tamarugo Phil using next-generation sequencing (NGS). In Proceedings of the VII Congreso Chileno de Ciencias Forestales, Concepción, Chile, 8–10 October 2019. Abstract Number 24 (in topic 4: Innovations in Forest Biotechnology). [Google Scholar]


| Primer | TNB | NPB (99%) | P% (99%) | NG | Rp | NEB | PIC |
|---|---|---|---|---|---|---|---|
| UBC810 | 12 | 12 | 100 | 11 | 8.8571 | 0 | 0.4596 |
| UBC825 | 15 | 14 | 93 | 9 | 9.3333 | 1 | 0.3888 |
| UBC815 | 10 | 10 | 100 | 10 | 8.0000 | 0 | 0.4680 |
| UBC808 | 13 | 10 | 77 | 6 | 7.1429 | 0 | 0.3279 |
| UBC809 | 13 | 12 | 92 | 9 | 8.3810 | 0 | 0.3677 |
| UBC850 | 7 | 7 | 100 | 7 | 4.2500 | 0 | 0.4107 |
| UBC823 | 8 | 5 | 63 | 10 | 3.3333 | 0 | 0.2642 |
| TOTAL | 78 | 70 | 1 | ||||
| Average | 11 | 89 | 9 | 7.0425 | 0.1 | 0.3838 |
| Species | Name | Province | Latitud (S) | Longitud (W) | Herbarium 1 |
|---|---|---|---|---|---|
| P. tamarugo | Pt1 | El Tamarugal | 20°19′46.1″ | 69°42′27.2″ | EIF 13338 |
| P. tamarugo | Pt2 | El Tamarugal | 20°20′37.1″ | 69°39′53.2″ | EIF 13337 |
| P. tamarugo | Pt3 | El Tamarugal | 20°20′57.5″ | 69°39′51.1″ | EIF 13336 |
| P. tamarugo | Pt4 | El Tamarugal | 20°21′03.6″ | 69°39′48.1″ | EIF 13335 |
| P. tamarugo | Pt5 | El Tamarugal | 20°21′03.6″ | 69°39′47.9″ | EIF 13334 |
| P. tamarugo | Pt6 | El Tamarugal | 20°21′22.5″ | 69°39′12.9″ | EIF 13333 |
| P. burkartii | Pb1 | El Tamarugal | 20°23′11.5″ | 69°35′57.3″ | EIF 13344 |
| P. burkartii | Pb2 | El Tamarugal | 20°27′59.2″ | 69°33′23.2″ | EIF 13347 |
| P. burkartii | Pb3 | El Loa | 22°59′3.29″ | 68°9′19.23″ | EIF 13824 |
| P. burkartii | Pb4 | El Tamarugal | 20°28′00.1″ | 69°33′23.2″ | EIF 13348 |
| P. burkartii | Pb5 | El Tamarugal | 20°24′45.0″ | 69°41′29.7″ | EIF 13355 |
| P. strombulifera | Ps1 | El Tamarugal | 20°27′59.8″ | 69°33′23.5″ | EIF 13332 |
| P. strombulifera | Ps2 | El Tamarugal | 20°28′00.1″ | 69°33′23.3″ | EIF 13351 |
| P. strombulifera | Ps3 | El Tamarugal | 20°27′59.9″ | 69°33′23.5″ | EIF 13350 |
| P. strombulifera | Ps4 | El Tamarugal | 20°28′00.2″“ | 69°33′23.3″ | EIF 13352 |
| P. strombulifera | Ps5 | El Tamarugal | 20°30′09.7″“ | 69°22′54.1″ | EIF 13822 |
| P. reptans | Pr1 | Copiapó | 27°20′10.1″ | 70°35′42.8″ | EIF 13324 |
| P. reptans | Pr2 | Copiapó | 27°20′10.9″ | 70°35′42.7″ | EIF 13331 |
| P. reptans | Pr3 | Copiapó | 27°20′10.7″ | 70°35′42.6″ | EIF 13325 |
| P. reptans | Pr4 | Copiapó | 27°20′06.3″ | 70°35′45.1″ | ------------- |
| P. reptans | Pr5 | Copiapó | 27°20′08.6″ | 70°35′42.8″ | EIF 13326 |
| P. flexuosa | Pf | Copiapó | 27°21′21.8″ | 70°39′54.7″ | EIF 13330 |
| P. chilensis | Pc | Chacabuco | 33°05′24.9″ | 70°39′07.4″ | EIF 13328 |
| P. alba | Pa | Copiapó | 27°21′39.3″ | 70°20′33.8″ | EIF 13329 |
© 2020 by the authors. Licensee MDPI, Basel, Switzerland. This article is an open access article distributed under the terms and conditions of the Creative Commons Attribution (CC BY) license (http://creativecommons.org/licenses/by/4.0/).
Share and Cite
Contreras, R.; van den Brink, L.; Burgos, B.; González, M.; Gacitúa, S. Genetic Characterization of an Endangered Chilean Endemic Species, Prosopis burkartii Muñoz, Reveals its Hybrids Parentage. Plants 2020, 9, 744. https://doi.org/10.3390/plants9060744
Contreras R, van den Brink L, Burgos B, González M, Gacitúa S. Genetic Characterization of an Endangered Chilean Endemic Species, Prosopis burkartii Muñoz, Reveals its Hybrids Parentage. Plants. 2020; 9(6):744. https://doi.org/10.3390/plants9060744
Chicago/Turabian StyleContreras, Roberto, Liesbeth van den Brink, Boris Burgos, Marlene González, and Sandra Gacitúa. 2020. "Genetic Characterization of an Endangered Chilean Endemic Species, Prosopis burkartii Muñoz, Reveals its Hybrids Parentage" Plants 9, no. 6: 744. https://doi.org/10.3390/plants9060744