Preparation and Identification of Optimal Synthesis Conditions for a Novel Alkaline Anion-Exchange Membrane


 ,
,  ,
,  and
and 
Abstract
: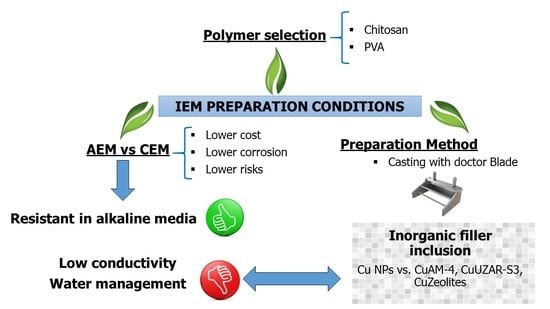
1. Introduction
2. Materials and Methods
2.1. Layered Silicates
2.2. Zeolites
2.3. Membrane Preparation
2.4. Membrane Characterization
2.5. Analysis of Variance: Effects of the Preparation Variables in Membrane Properties
3. Results and Discussion
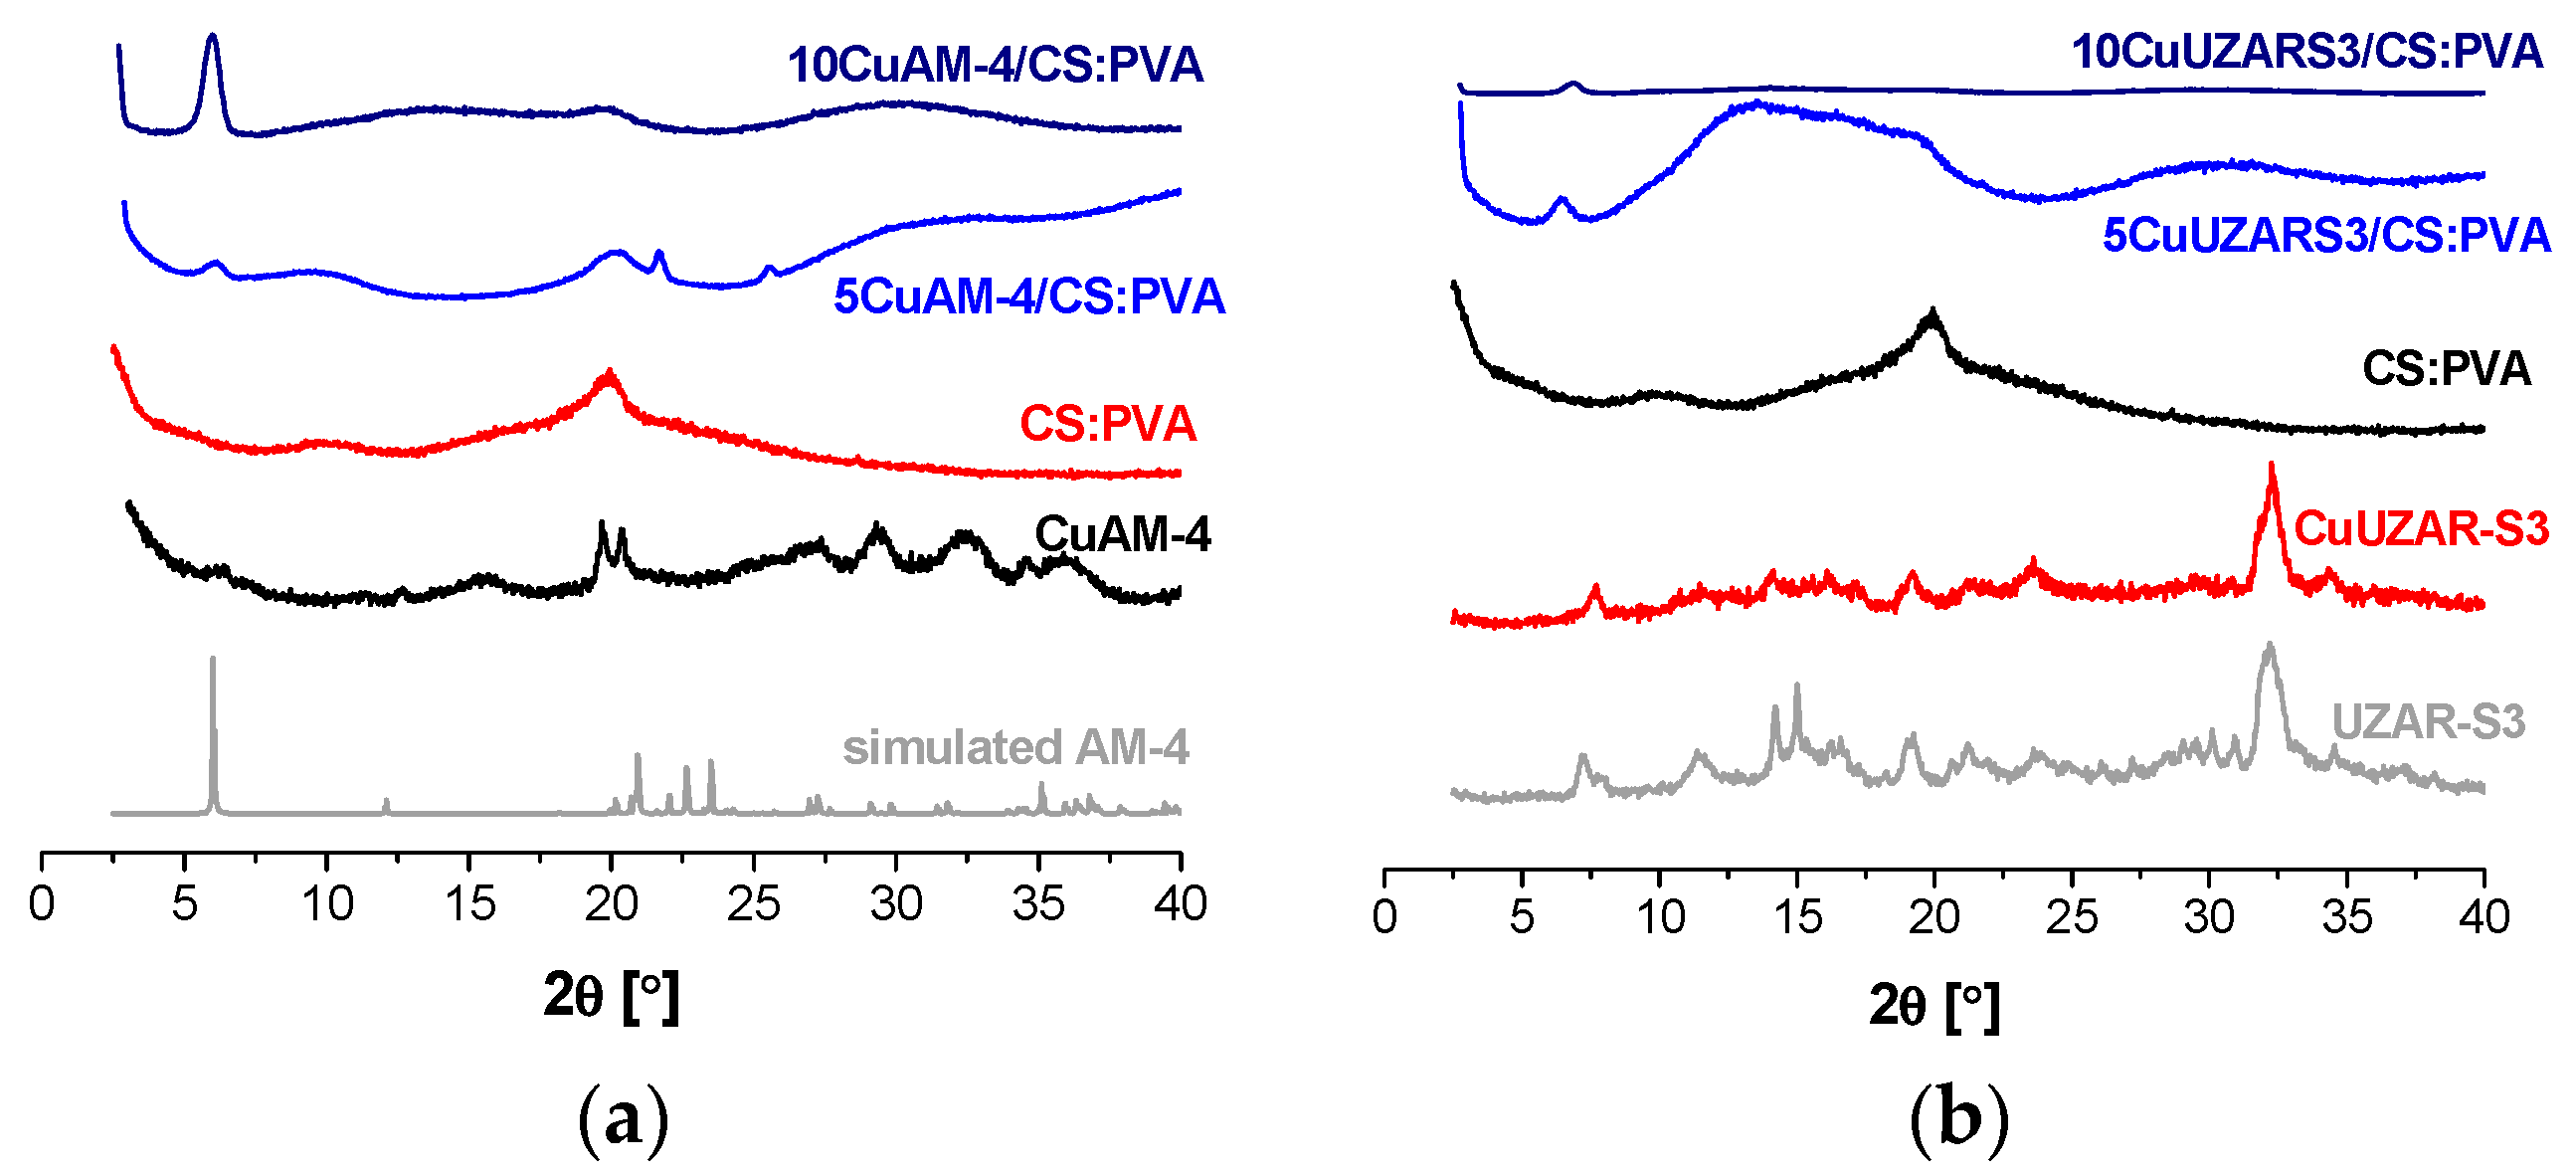
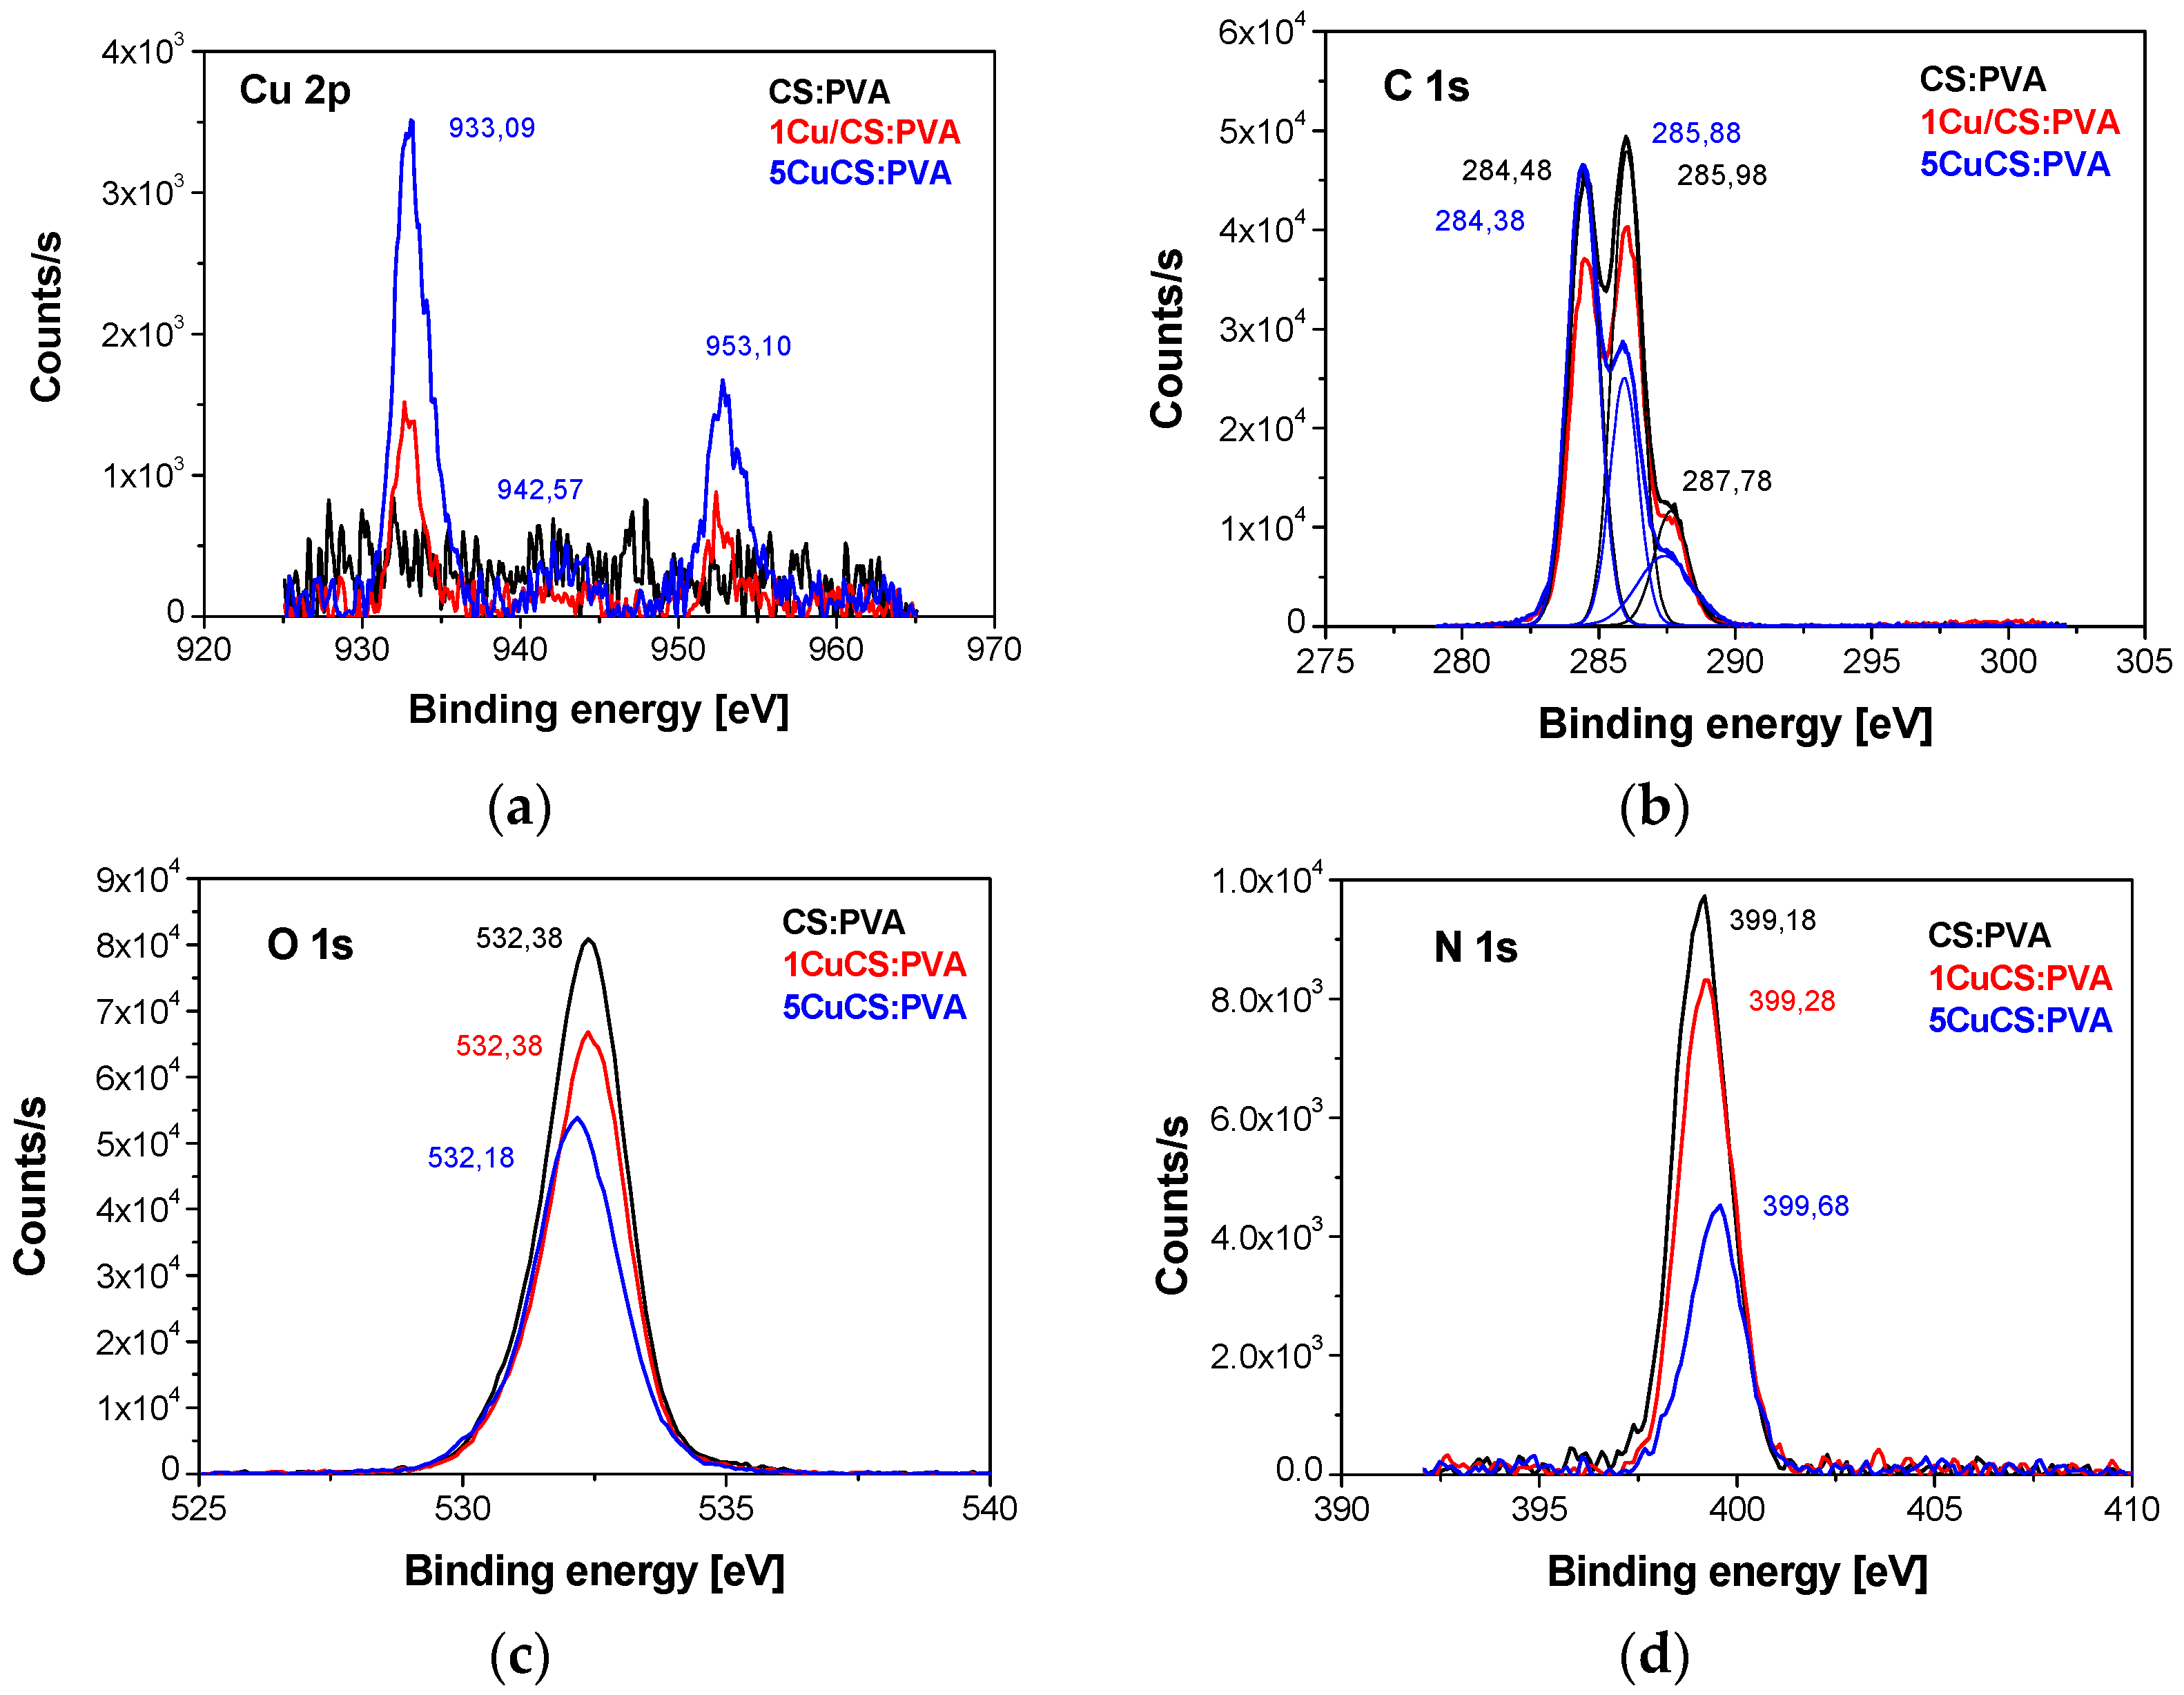
3.1. Physico-Chemical Characterization of the Membranes
3.2. Mechanical Properties
3.3. ANOVA-Based Statistical Analysis
4. Conclusions
Supplementary Materials
Author Contributions
Funding
Acknowledgments
Conflicts of Interest
References
- Varcoe, J.R.; Atanassov, P.; Dekel, D.R.; Herring, A.M.; Hickner, M.A.; Kohl, P.A.; Kucernak, A.R.; Mustain, W.E.; Nijmeijer, K.; Scott, K.; et al. Anion-exchange membranes in electrochemical energy systems. Energy Environ. Sci. 2014, 7, 3135–3191. [Google Scholar] [CrossRef] [Green Version]
- Dekel, D.R. Review of cell performance in anion exchange membrane fuel cells. J. Power Sources 2018, 375, 158–169. [Google Scholar] [CrossRef]
- Gottesfeld, S.; Dekel, D.R.; Page, M.; Bae, C.; Yan, Y.; Zelenay, P.; Kim, Y.S. Anion exchange membrane fuel cells: Current status and remaining challenges. J. Power Sources 2018, 375, 170–184. [Google Scholar] [CrossRef]
- Deng, H.; Wang, D.; Xie, X.; Zhou, Y.; Yin, Y.; Du, Q.; Jiao, K. Modeling of hydrogen alkaline membrane fuel cell with interfacial effect and water management optimization. Renew. Energy 2016, 91, 166–177. [Google Scholar] [CrossRef]
- Park, C.H.; Lee, S.Y.; Hwang, D.S.; Shin, D.W.; Cho, D.H.; Lee, K.H.; Kim, T.; Hill, A.J.; Guiver, M.D.; Kim, T.; et al. Nanocrack-regulated self-humidifying membranes. Nature 2016, 532, 480–483. [Google Scholar] [CrossRef] [PubMed]
- Domènech, B.; Romero, V.; Vázquez, M.I.; Avila, M.; Benavente, J.; Muñoz, M.; Macanás, J. Chemical and electrochemical characterization of Nafion containing silver nanoparticles in a stripe-like distribution. RSC Adv. 2016, 6, 9923–9931. [Google Scholar] [CrossRef] [Green Version]
- Ran, J.; Wu, L.; He, Y.; Yang, Z.; Wang, Y.; Jiang, C.; Ge, L.; Bakangura, E.; Xu, T. Ion exchange membranes: New developments and applications. J. Membr. Sci. 2017, 522, 267–291. [Google Scholar] [CrossRef]
- Ma, J.; Sahai, Y. Chitosan biopolymer for fuel cell applications. Carbohydr. Polym. 2013, 92, 955–975. [Google Scholar] [CrossRef] [PubMed]
- Maiti, J.; Kakati, N.; Lee, S.H.; Jee, S.H.; Viswanathan, B.; Yoon, Y.S. Where do poly(vinyl alcohol) based membranes stand in relation to Nafion® for direct methanol fuel cell applications? J. Power Sources 2012, 216, 48–66. [Google Scholar] [CrossRef]
- García-Cruz, L.; Casado-Coterillo, C.; Iniesta, J.; Montiel, V.; Irabien, Á. Chitosan: Poly (vinyl) alcohol composite alkaline membrane incorporating organic ionomers and layered silicate materials into a PEM electrochemical reactor. J. Membr. Sci. 2016, 498, 395–407. [Google Scholar] [CrossRef] [Green Version]
- Hyder, M.N.; Chen, P. Pervaporation dehydration of ethylene glycol with chitosan-poly(vinyl alcohol) blend membranes: Effect of CS-PVA blending ratios. J. Membr. Sci. 2009, 340, 171–180. [Google Scholar] [CrossRef]
- Devi, D.A.; Smitha, B.; Sridhar, S.; Aminabhavi, T.M. Novel crosslinked chitosan/poly(vinylpyrrolidone) blend membranes for dehydrating tetrahydrofuran by the pervaporation technique. J. Membr. Sci. 2006, 280, 45–53. [Google Scholar] [CrossRef]
- Guibal, E. Interactions of metal ions with chitosan-based sorbents: A review. Sep. Purif. Technol. 2004, 38, 43–74. [Google Scholar] [CrossRef]
- Abiraman, T.; Ramanathan, E.; Kavitha, G.; Rengasamy, R.; Balasubramanian, S. Synthesis of chitosan capped copper oxide nanoleaves using high intensity (30 kHz) ultrasound sonication and their application in antifouling coatings. Ultrason. Sonochem. 2017, 34, 781–791. [Google Scholar] [CrossRef] [PubMed]
- De Godoi, F.C.; Rabelo, R.B.; da Cruz Vasconcellos, F.; Beppu, M.M. Preparation of copper nanoparticles in chitosan membranes and their application as irreversible humidity indicators. Chem. Eng. Trans. 2011, 24, 217–222. [Google Scholar] [CrossRef]
- Elmezayyen, A.S.; Reicha, F.M. Preparation of chitosan copper complexes molecular dynamic studies of chitosan and chitosan copper complexes. Open J. Appl. Sci. 2015, 5, 415–427. [Google Scholar] [CrossRef]
- Kickelbick, G. Concepts for the incorporation of inorganic building blocks into organic polymers on a nanoscale. Prog. Polym. Sci. 2003, 28, 83–114. [Google Scholar] [CrossRef]
- Regiel, A.; Irusta, S.; Kyzioł, A.; Arruebo, M.; Santamaria, J. Preparation and characterization of chitosan-silver nanocomposite films and their antibacterial activity against Staphylococcus aureus. Nanotechnology 2013, 24, 015101. [Google Scholar] [CrossRef] [PubMed]
- García-cruz, L.; Casado-coterillo, C.; Irabien, Á.; Montiel, V.; Iniesta, J. High performance of alkaline anion-exchange membranes based on chitosan/poly (vinyl) alcohol doped with graphene oxide for the electrooxidation. C J. Carbon Res. 2016, 2. [Google Scholar] [CrossRef] [Green Version]
- Pérez-carvajal, J.; Lalueza, P.; Casado, C.; Téllez, C.; Coronas, J. Layered titanosilicates JDF-L1 and AM-4 for biocide applications. Appl. Clay Sci. 2012, 56, 30–35. [Google Scholar] [CrossRef]
- Abu-Zied, B.M. Cu2+-acetate exchanged X zeolites: Preparation, characterization and N2O decomposition activity. Microporous Mesoporous Mater. 2011, 139, 59–66. [Google Scholar] [CrossRef]
- Casado, C.; Ambroj, D.; Mayoral, Á.; Vispe, E.; Téllez, C.; Coronas, J. Synthesis, swelling, and exfoliation of microporous lamellar titanosilicate AM-4. Eur. J. Inorg. Chem. 2011, 2247–2253. [Google Scholar] [CrossRef]
- Rubio, C.; Murillo, B.; Casado-Coterillo, C.; Mayoral, Á.; Téllez, C.; Coronas, J.; Berenguer-Murcia, Á.; Cazorla-Amorós, D. Development of exfoliated layered stannosilicate for hydrogen adsorption. Int. J. Hydrog. Energy 2014, 39, 13180–13188. [Google Scholar] [CrossRef] [Green Version]
- Higa, M.; Kobayashi, M.; Kakihana, Y.; Jikihara, A.; Fujiwara, N. Charge mosaic membranes with semi-interpenetrating network structures prepared from a polymer blend of poly(vinyl alcohol) and polyelectrolytes. J. Membr. Sci. 2013, 428, 267–274. [Google Scholar] [CrossRef]
- Karas, F.; Hnát, J.; Paidar, M.; Schauer, J.; Bouzek, K. Determination of the ion-exchange capacity of anion-selective membranes. Int. J. Hydrogen Energy 2014, 39, 5054–5062. [Google Scholar] [CrossRef]
- Ziv, N.; Mustain, W.E.; Dekel, D.R. The effect of ambient carbon dioxide on anion-exchange membrane fuel cells. ChemSusChem 2018, 11, 1136–1150. [Google Scholar] [CrossRef] [PubMed]
- García-cruz, L.; Casado-Coterillo, C.; Iniesta, J.; Montiel, V.; Irabien, Á. Preparation and characterization of novel chitosan-based mixed matrix membranes resistant in alkaline media. J. Appl. Polym. Sci. 2015, 132, 42240. [Google Scholar] [CrossRef]
- Franck-Lacaze, L.; Sistat, P.; Huguet, P.; Lapicque, F. Protonation and diffusion phenomena in poly(4-vinylpyridine)-based weak anion-exchange membranes. J. Membr. Sci. 2009, 340, 257–265. [Google Scholar] [CrossRef]
- McHugh, T.H.; Avenabustillos, R.; Krochta, J.M. Hydrophilic Edible Films—Modified Procedure for Water-Vapor Permeability and Explanation of Thickness Effects. J. Food Sci. 1993, 58, 899–903. [Google Scholar] [CrossRef]
- Hosseini, S.F.; Rezaei, M.; Zandi, M.; Farahmandghavi, F. Development of bioactive fish gelatin/chitosan nanoparticles composite films with antimicrobial properties. Food Chem. 2016, 194, 1266–1274. [Google Scholar] [CrossRef] [PubMed]
- Simonelli, L.; Marini, C.; Olszewski, W.; Avila-Perez, M.; Ramanan, N.; Guilera, G.; Cuartero, V.; Klementiev, K. CLAESS: The hard X-ray absorption beamline of the ALBA CELLS synchrotron. Cogent Phys. 2016, 3, 1–10. [Google Scholar] [CrossRef]
- Ravel, B.; Newville, M. ATHENA, ARTEMIS, HEPHAESTUS: Data analysis for X-ray absorption spectroscopy using IFEFFIT. J. Synchrotron Radiat. 2005, 12, 537–541. [Google Scholar] [CrossRef] [PubMed]
- Dadachov, M.S.; Rocha, J.; Ferreira, A.; Lin, Z.; Anderson, M.W. Ab initio structure determination of layered sodium titanium silicate containing edge-sharing titanate chains (AM-4) Na3(Na,H)Ti2O2[Si2O6]·2.2H2O. Chem. Commun. 1997, 3, 2371–2372. [Google Scholar] [CrossRef]
- Wang, X.; Wang, C. Chitosan-poly (vinyl alcohol)/ attapulgite nanocomposites for copper (II) ions removal: pH dependence and adsorption mechanisms. Colloids Surf. A Physicochem. Eng. Asp. 2016, 500, 186–194. [Google Scholar] [CrossRef]
- Du, G.H.; van Tendeloo, G. Cu(OH)2 nanowires, CuO nanowires and CuO nanobelts. Chem. Phys. Lett. 2004, 393, 64–69. [Google Scholar] [CrossRef]
- Domènech, B.; Muñoz, M.; Muraviev, D.N.; Macanás, J. Uncommon patterns in Nafion films loaded with silver nanoparticles. Chem. Commun. 2014, 50, 4693–4695. [Google Scholar] [CrossRef] [PubMed] [Green Version]
- Anandan, S.; Lee, G.J.; Wu, J.J. Sonochemical synthesis of CuO nanostructures with different morphology. Ultrason. Sonochem. 2012, 19, 682–686. [Google Scholar] [CrossRef] [PubMed]
- Shrivastava, B.D. X-ray absorption fine structure (XAFS) spectroscopy using synchrotron radiation. J. Phys. Conf. Ser. 2012, 365, 012002. [Google Scholar] [CrossRef] [Green Version]
- Martini, A.; Borfecchia, E.; Lomachenko, K.A.; Pankin, I.A.; Negri, C.; Berlier, G.; Beato, P.; Falsig, H.; Bordiga, S.; Lamberti, C. Composition-driven Cu-speciation and reducibility in Cu-CHA zeolite catalysts: A multivariate XAS/FTIR approach to complexity. Chem. Sci. 2017, 8, 6836–6851. [Google Scholar] [CrossRef] [PubMed]
- Borfecchia, E.; Lomachenko, K.A.; Giordanino, F.; Falsig, H.; Beato, P.; Soldatov, A.V.; Bordiga, S.; Lamberti, C. Revisiting the nature of Cu sites in the activated Cu-SSZ-13 catalyst for SCR reaction. Chem. Sci. 2015, 6, 548–563. [Google Scholar] [CrossRef] [PubMed] [Green Version]
- Wu, H.; Zheng, B.; Zheng, X.; Wang, J.; Yuan, W.; Jiang, Z. Surface-modified Y zeolite-filled chitosan membrane for direct methanol fuel cell. J. Power Sources 2007, 173, 842–852. [Google Scholar] [CrossRef]
- García-Cruz, L.; Casado-Coterillo, C.; Irabien, Á.; Montiel, V.; Iniesta, J. Performance assessment of a polymer electrolyte membrane electrochemical reactor under alkaline conditions—A case study with the electrooxidation of alcohols. Electrochim. Acta 2016, 206, 165–175. [Google Scholar] [CrossRef]
- Palomino, G.T.; Fisicaro, P.; Bordiga, S.; Zecchina, A.; Giamello, E.; Lamberti, C. Oxidation States of Copper Ions in ZSM-5 Zeolites. A Multitechnique Investigation. J. Phys. Chem. B 2000, 104, 4064–4073. [Google Scholar] [CrossRef] [PubMed]
- Geise, G.M.; Hickner, M.A.; Logan, B.E. Ionic resistance and permselectivity tradeoffs in anion exchange membranes. ACS Appl. Mater. Interfaces 2013, 5, 10294–10301. [Google Scholar] [CrossRef] [PubMed]
- Bierhalz, A.C.K.; Moraes, Â.M. Tuning the properties of alginate—Chitosan membranes by varying the viscosity and the proportions of polymers. J. Appl. Polym. Sci. 2016, 133, 44216. [Google Scholar] [CrossRef]
- Alix, S.; Follain, N.; Tenn, N.; Alexandre, B.; Bourbigot, S.; Soulestin, J.; Marais, S. Effect of highly exfoliated and oriented organoclays on the barrier properties of polyamide 6 based nanocomposites. J. Phys. Chem. C 2012, 116, 4937–4947. [Google Scholar] [CrossRef]
- El-Azzami, L.A.; Grulke, E.A. Carbon dioxide separation from hydrogen and nitrogen by fixed facilitated transport in swollen chitosan membranes. J. Membr. Sci. 2008, 323, 225–234. [Google Scholar] [CrossRef]
- Lue, S.J.; Wang, F.J.; Hsiaw, S.Y. Pervaporation of benzene/cyclohexane mixtures using ion-exchange membrane containing copper ions. J. Membr. Sci. 2004, 240, 149–158. [Google Scholar] [CrossRef]
- Zuo, G.; Wan, Y.; Wang, L.; Liu, C.; He, F.; Luo, H. Synthesis and characterization of laminated hydroxyapatite/chitosan nanocomposites. Mater. Lett. 2010, 64, 2126–2128. [Google Scholar] [CrossRef]
- Choi, Y.J.; Song, J.H.; Kang, M.S.; Seo, B.K. Preparation and electrochemical characterizations of anion-permselective membranes with structurally stable ion-exchange sites. Electrochim. Acta 2015, 180, 71–77. [Google Scholar] [CrossRef]
- Kikhavani, T.; Ashrafizadeh, S.N.; van der Bruggen, B. Identification of optimum synthesis conditions for a novel anion exchange membrane by response surface methodology. J. Appl. Polym. Sci. 2014, 131, 39888. [Google Scholar] [CrossRef]
- Montgomery, D.C. Design and Analysis of Experiments, 4th ed.; Wiley: New York, NY, USA, 1997. [Google Scholar]
- Giner-Sanz, J.J.; Ortega, E.M.; Pérez-Herranz, V. Statistical analysis of the effect of temperature and inlet humidities on the parameters of a semiempirical model of the internal resistance of a polymer electrolyte membrane fuel cell. J. Power Sources 2018, 381, 84–93. [Google Scholar] [CrossRef]


| Membrane 1 | Filler Loading (wt %) | Viscosity (mPa s) | Color of Solution | Color of Membrane | Cu (wt %) |
|---|---|---|---|---|---|
| CS:PVA | 0 | 223 | Yellowish | Transparent | 0 |
| 1Cu/CS:PVA | 1 | 19.8 | Grey/green | Light blue | 1 |
| 5Cu/CS:PVA | 5 | 7.80 | Grey/green | Dark blue | 5 |
| 10Cu/CS:PVA | 10 | 4.50 | Grey/green | Green | 10 |
| 5CuUZAR-S3/CS:PVA | 5 | 120 | Light blue | Blue | 1.47 |
| 10CuUZAR-S3/CS-PVA | 10 | 114 | Light blue | Blue | 2.93 |
| 15CuUZAR-S3/CS:PVA | 15 | 112 | Light blue | Blue | 4.40 |
| 5CuAM-4/CS:PVA | 5 | 126 | Light blue | Blue | 0.84 |
| 10CuAM-4/CS:PVA | 10 | 123 | Light blue | Blue | 1.68 |
| 15CuAM-4/CS:PVA | 15 | 121 | Light blue | Blue | 2.51 |
| 5CuY/CS:PVA | 5 | 117 | White | Transparent | 0.15 |
| 10CuY/CS:PVA | 10 | 110 | White | Transparent | 0.30 |
| 5CuMOR/CS:PVA | 5 | 116 | White | Transparent | 0.22 |
| 10CuMOR/CS:PVA | 10 | 111 | White | Transparent | 0.45 |
| 5CuBEA/CS:PVA | 5 | 120 | White | Transparent | 0.47 |
| 10CuBEA/CS:PVA | 10 | 114 | White | Transparent | 0.94 |
| Membrane | WU (wt %) | IEC (mmol/g) | Conductivity (mS/cm) | WVP (g·mm/m2·h·kPa) | Thickness (µm) |
|---|---|---|---|---|---|
| FAA-3 | 23.2 ± 2.9 | 0.36 ± 0.021 | 2.92 [28] | 1.159 | 41 ± 1 2 |
| CS:PVA | 60.1 ± 2.9 | 0.27 ± 0.03 | 0.26 ± 0.06 | 0.577 ± 0.043 | 38 ± 4 |
| 5Cu/CS:PVA | 47.2 ± 2.8 | 0.37 ± 0.12 | - 1 | 2.187 ± 0.073 | 183 ± 27 |
| 10Cu/CS:PVA | 51.4 ± 4.3 | 0.28 ± 0.04 | 0.218 | 1.354 ± 0.117 | 130 ± 32 |
| 5CuUZAR-S3/CS:PVA | 56.5 ± 3.3 | 0.27 ± 0.01 | 0.28 ± 0.00 | 1.632 ± 0.590 | 74 ± 7 |
| 10CuUZAR-S3/CS:PVA | 59.5 ± 1.3 | 0.45 ± 0.05 | 0.71 ± 0.10 | 0.427 ± 0.100 | 83 ± 12 |
| 15CuUZAR-S3/CS:PVA | 75.4 ± 2.2 | 0.448 ± 0.01 | 0.20 ± 0.05 | 0.375 ± 0.062 | 57 ± 5 |
| 5CuAM-4/CS:PVA | 60.8 ± 1.7 | 0.22 ± 0.02 | 0.25 ± 0.14 | 0.466 ± 0.049 | 71 ± 9 |
| 10CuAM4/CS:PVA | 64.7 ± 1.2 | 0.46 ± 0.07 | 0.90 ± 0.36 | 0.348 ± 0.042 | 91 ± 11 |
| 15CuAM-4/CS:PVA | 71.2 ± 2.3 | 0.44 ± 0.01 | 0.46 ± 0.13 | 0.330 ± 0.104 | 62 ± 7 |
| 5CuY/CS:PVA | 56.8 ± 0.7 | 0.30 ± 0.03 | 0.32 ± 0.02 | 0.333 ± 0.042 | 77 ± 3 |
| 10CuY/CS:PVA | 56.3 ± 0.9 | 0.29 ± 0.02 | 0.34 ± 0.08 | 0.290 ± 0.139 | 52 ± 8 |
| 5CuMOR/CS:PVA | 49.8 ± 5.6 | 0.37 ± 0.02 | 0.18 ± 0.01 | 0.390 ± 0.147 | 64 ± 9 |
| 10CuMOR/CS:PVA | 48.0 ± 4.4 | 0.34 ± 0.05 | 0.51 ± 0.16 | 0.336 ± 0.047 | 64 ± 6 |
| 5CuBEA/CS:PVA | 59.8 ± 0.8 | 0.24 ± 0.02 | - 1 | 0.219 ± 0.012 | 46 ± 10 |
| 10CuBEA/CS:PVA | 58.3 ± 5.6 | 0.21 ± 0.02 | 0.33 ± 0.07 | 0.287 ± 0.042 | 53 ± 2 |
| Membrane | TS (N/mm2) | e (%) |
|---|---|---|
| 5Cu/CS:PVA | 0.14 | 1.71 |
| 10Cu/CS:PVA | 0.11 | 1.49 |
| 5CuUZAR-S3/CS:PVA | 4.34 ± 2.07 | 56 ± 13 |
| 10CuUZAR-S3/CS:PVA | 1.18 ± 0.23 | 57 ± 40 |
| 15CuUZAR-S3/CS:PVA | 0.94 ± 0.09 | 55 ± 9.5 |
| 5CuAM-4/CS:PVA | 2.14 ± 0.10 | 66 ± 0.9 |
| 10CuAM-4/CS:PVA | 0.34 ± 0.05 | 79 ± 7.0 |
| 15CuAM-4/CS:PVA | 0.24 ± 0.11 | 18 ± 15 |
| 5CuY/CS:PVA | 3.51 ± 2.48 | 44 ± 3.1 |
| 10CuY/CS:PVA | 7.57 ± 4.10 | 36 ± 8.9 |
| 5CuMOR/CS:PVA | 0.36 ± 0.03 | 30 ± 12 |
| 10CuMOR/CS:PVA | 4.83 ± 1.62 | 37 ± 11 |
| 5Cu-BEA/CS:PVA | 0.72 ± 0.25 | 56 ± 5.9 |
| 10Cu-BEA/CS:PVA | 0.64 ± 0.24 | 67 ± 20 |
| Source | Sum of Squares (SS) | Degree of Freedom (df) | Mean Square (MS) | F-Value | p-Value |
|---|---|---|---|---|---|
| Main effects | |||||
| A-Type of filler | 9.73 × 10⁻³ | 5 | 1.94 × 10⁻³ | 57.24 | 0.017 |
| B-Filler loading | 2.84 × 10⁻³ | 1 | 2.84 × 10⁻³ | 83.46 | 0.012 |
| C-Cu content | 8.52 × 10⁻⁴ | 1 | 8.52 × 10⁻⁴ | 25.07 | 0.038 |
| Interaction | |||||
| A × B | 8.27 × 10⁻³ | 5 | 1.65·×·10−3 | 48.62 | 0.020 |
| B × C | 1.89 × 10⁻³ | 1 | 1.89 × 10⁻³ | 55.65 | 0.018 |
| A × B × C | 8.26 × 10⁻⁴ | 4 | 2.06 × 10⁻⁴ | 6.07 | 0.146 |
| Residual | 6.8 × 10⁻⁵ | 2 | 3.4 × 10⁻⁵ | ||
| Total | 0.024 | 19 | |||
| Source | Sum of Squares (SS) | Degree of Freedom (df) | Mean Square (MS) | F-Value | p-Value |
|---|---|---|---|---|---|
| Main effects | |||||
| A-Type of filler | 405 | 5 | 81 | 80.16 | 0.012 |
| B-Filler loading | 14.8 | 1 | 14.77 | 10.62 | 0.062 |
| C-Cu content | 246 | 1 | 245.9 | 243.4 | 0.004 |
| Interaction | |||||
| A × B | 96.4 | 5 | 19.28 | 19.08 | 0.050 |
| B × C | 100.4 | 1 | 100.4 | 99.39 | 0.010 |
| A × B × C | 16.9 | 4 | 4.23 | 4.186 | 0.202 |
| Residual | 2.0 | 2 | 1.01 | ||
| Total | 881.5 | 19 | |||
| Source | Sum of Squares (SS) | Degree of Freedom (df) | Mean Square (MS) | F-Value | p-Value |
|---|---|---|---|---|---|
| Main effects | |||||
| A-Type of filler | 184 | 5 | 37 | 0.231 | 0.919 |
| B-Filler loading | 110,811 | 1 | 11,081 | 69.55 | 0.014 |
| C-Cu content | 571 | 1 | 571 | 3.581 | 0.199 |
| Interaction | |||||
| A × B | 733 | 5 | 147 | 0.921 | 0.594 |
| B × C | 2221 | 1 | 2221 | 13.94 | 0.065 |
| A × B × C | 1910 | 4 | 477 | 2.997 | 0.266 |
| Residual | 319 | 2 | 159 | ||
| Total | 116,749 | 19 | |||
| Source | Sum of Squares (SS) | Degree of Freedom (df) | Mean Square (MS) | F-Value | p-Value |
|---|---|---|---|---|---|
| Main effects | |||||
| A-Type of filler | 3734 | 5 | 746.7 | 15.21 | 0.063 |
| B-Filler loading | 1737 | 1 | 1737 | 35.38 | 0.027 |
| C-Cu content | 1 | 1 | 0.8 | 0.016 | 0.910 |
| Interaction | |||||
| A × B | 1436 | 5 | 287.1 | 5.847 | 0.152 |
| B × C | 2318 | 1 | 2317 | 47.20 | 0.020 |
| A × B × C | 1419 | 4 | 354.8 | 7.224 | 0.125 |
| Residual | 98 | 2 | 49.1 | ||
| Total | 10,743 | 19 | |||
© 2018 by the authors. Licensee MDPI, Basel, Switzerland. This article is an open access article distributed under the terms and conditions of the Creative Commons Attribution (CC BY) license (http://creativecommons.org/licenses/by/4.0/).
Share and Cite
Marcos-Madrazo, A.; Casado-Coterillo, C.; García-Cruz, L.; Iniesta, J.; Simonelli, L.; Sebastián, V.; Encabo-Berzosa, M.D.M.; Arruebo, M.; Irabien, Á. Preparation and Identification of Optimal Synthesis Conditions for a Novel Alkaline Anion-Exchange Membrane. Polymers 2018, 10, 913. https://doi.org/10.3390/polym10080913
Marcos-Madrazo A, Casado-Coterillo C, García-Cruz L, Iniesta J, Simonelli L, Sebastián V, Encabo-Berzosa MDM, Arruebo M, Irabien Á. Preparation and Identification of Optimal Synthesis Conditions for a Novel Alkaline Anion-Exchange Membrane. Polymers. 2018; 10(8):913. https://doi.org/10.3390/polym10080913
Chicago/Turabian StyleMarcos-Madrazo, Aitor, Clara Casado-Coterillo, Leticia García-Cruz, Jesús Iniesta, Laura Simonelli, Víctor Sebastián, María Del Mar Encabo-Berzosa, Manuel Arruebo, and Ángel Irabien. 2018. "Preparation and Identification of Optimal Synthesis Conditions for a Novel Alkaline Anion-Exchange Membrane" Polymers 10, no. 8: 913. https://doi.org/10.3390/polym10080913