Engineering Reactive Clay Systems by Ground Rubber Replacement and Polyacrylamide Treatment


1
School of Civil, Environmental and Mining Engineering, The University of Adelaide, Adelaide, SA 5005, Australia
2
Department of Infrastructure Engineering, Melbourne School of Engineering, The University of Melbourne, Parkville, VIC 3010, Australia
3
Department of Civil, Structural and Environmental Engineering, Trinity College Dublin, Dublin 2, Ireland
*
Author to whom correspondence should be addressed.
Polymers 2019, 11(10), 1675; https://doi.org/10.3390/polym11101675
Submission received: 16 September 2019
/
Revised: 5 October 2019
/
Accepted: 11 October 2019
/
Published: 14 October 2019
Abstract
:This study investigates the combined performance of ground rubber (GR), the additive, and polyacrylamide (PAM), the binder, as a sustainable solution towards ameliorating the inferior geotechnical attributes of an expansive clay. The first phase of the experimental program examined the effects of PAM concentration on the soil’s mechanical properties—consistency, sediment volume attributes, compactability, unconfined compressive strength (UCS), reactivity and microstructure features. The second phase investigated the effects of GR content, with and without the optimum PAM concentration. An increase in PAM beyond 0.2 g/L, the identified optimum concentration, caused the excess PAM to act as a lubricant rather than a flocculant. This feature facilitated reduced overall resistance to sliding of soil particles relative to each other, thereby adversely influencing the improvement in stress–strain–strength response achieved for ≤0.2 g/L PAM. This transitional mechanism was further verified by the consistency limits and sediment volume properties, both of which exhibited only minor variations beyond 0.2 g/L PAM. The greater the GR content, the higher the mobilized UCS up to 10% GR, beyond which the dominant GR-to-GR interaction (i.e., rubber-clustering) adversely influenced the stress–strain–strength response. Reduction in the soil’s swell–shrink capacity, however, was consistently in favor of higher GR contents. Addition of PAM to the GR-blended samples amended the soil aggregate–GR connection interface, thereby achieving further improvements in the soil’s UCS and volume change behaviors. A maximum GR content of 20%, paired with 0.2 g/L PAM, managed to satisfy a major decrease in the swell–shrink capacity while improving the strength-related features, and thus was deemed as the optimum choice.
1. Introduction
Clay soils are often characterized as problematic construction materials, as their intrinsic mechanical attributes present significant challenges for geotechnical engineering systems. Meanwhile, shortage of land for development, as well as increasing costs associated with construction and raw materials, necessitate maximum utilization of locally-available materials, one being problematic clay soils. In this context, expansive clays are consistently viewed among the most significant, widespread, costly and least publicized geological hazards, and thus demand further attention [1]. A notable fraction of expansive clays consists of active smectite minerals, which exhibit significant swell–shrink volume changes, as well as desiccation-induced cracking, upon the addition or removal of moisture [2,3]. These adverse actions bring forth major instability concerns to the overlying structures, and thus demand engineering solutions to alleviate the associated socio-economic impacts [4].
The geotechnical engineer can either complete the design within the limitations imposed by the expansive soil or preferably amend the soil’s adverse behaviors by means of physical and/or chemical soil stabilization techniques [5,6]. Physical stabilization practices often involve soil-replacement, pre-wetting, compaction and/or reinforcement. The latter, reinforcement, refers to the placement of randomly-distributed or systematically-engineered geosynthetics, e.g., fibers and geogrids, in the soil regime, thus engendering the development of a spatial three-dimensional reinforcement network in favor of interlocking the soil particles into a unitary mass of induced strength resistance, improved deformability and reduced swell–shrink volume changes [7,8,9,10,11,12,13]. Chemical stabilization refers to the introduction of chemical agents, mainly cementitious binders such as cement and lime, to the soil–water medium, thereby encouraging particle flocculation and hence the development of a dense, uniform matrix coupled with enhanced mechanical properties [10,14,15,16,17,18,19]. In some cases, a combined physical–chemical stabilization scheme may be required to address extreme soil expansivity [20,21,22,23,24]. Although proven effective, conventional stabilization practices often suffer from sustainability issues, attributed to high manufacturing and/or transportation costs, as well as environmental concerns due to greenhouse gas emissions [1]. A sustainable soil stabilization scheme can be characterized as one that maintains a perfect balance between infrastructure performance and the social, economic and ecological processes required to maintain human equity, diversity, and the functionality of natural systems [24]. The transition to sustainable stabilization warrants incorporating solid waste materials (e.g., waste tires and textiles, kiln dusts and mine tailings) as an “additive” or “reinforcement” to expansive soils, while opting for non-conventional, environmentally-friendly chemical binders (e.g., polymers, resins and sulfonated oils) for further enhancements.
Discarded tires are among the largest and most problematic sources of solid waste, owing to extensive production and their durability over time [25]. Quite clearly, discarded tire rubbers are not desired at landfills, owing to their low weight-to-volume ratio, resilience, and the fact that they are rarely “flat-packed”. These adverse characteristics, from a landfill perspective, also make them one of the most reusable waste materials for soil stabilization practices, as the rubber is resilient, lightweight, and possesses a rough surface texture. The latter, its rough surface texture, may potentially promote adhesion and/or induce frictional resistance at the soil–rubber interface, and thus alter the soil fabric into a unitary mass of enhanced strength resistance [4,26,27]. The use of recycled tire rubbers in geotechnical engineering dates back to the early 1990s, where theoretical concepts governing the mechanical performance of soil–rubber blends were put into perspective. Much like fiber-reinforced soils, the rubber particles randomly distribute in the soil matrix, and where optimized in content and geometry, enhance the inferior engineering characteristics of the host soil [28,29,30,31,32]. A number of studies have documented the effects of rubber-reinforcement, with and without cementitious binders, on the physical and mechanical behaviors of expansive clays [4,26,27,33,34,35,36,37,38]. Based on these studies, the clay–rubber amending mechanisms can be attributed to the rubber content, with higher contents often producing a more pronounced reduction in the swell–shrink capacity. Moreover, the rubber’s geometrical features, often defined in terms of the rubber’s mean particle size (or d50) and/or length, have also been reported to play an equally important role.
Much like conventional cementitious binders, hydrophilic, miscible synthetic polymers, such as polyacrylamides, can be employed to encourage particle flocculation, mainly through clay–polymer interactions, and hence amend the soil fabric into a coherent matrix with enhanced mechanical performance [4,39,40,41,42,43,44,45,46,47]. As the global community increasingly transitions towards sustainable infrastructure construction and development practices, the use of polymeric binders, which often do not have the environmental drawbacks associated with conventional cementitious binders, has gained increased attention. Although commercially branded and readily accessible, such products have generally not yet received widespread acceptance among practicing engineers on account of the lack of sufficient published data by independent establishments, and more importantly, the lack of standard guidelines for effective field implementations [44]. Miscible polymers also possess lubricant properties, which reduce the surface tension of water and hence facilitate the movement and sliding of soil particles across each other with much less effort/friction, thereby leading to improved soil compactability [44,48]. Although polymer-treatment appears to have a variety of promising soil amendment properties, the reported results, particularly in the context of geotechnical engineering, are still not consistent towards defining an ad hoc stabilization solution, and as such, further research is urgently required.
This study investigates the combined performance of ground rubber (GR), the additive, and polyacrylamide (PAM), the binder, as a sustainable solution towards ameliorating the inferior geotechnical attributes of an expansive clay. The experimental program was carried out in two phases. The first phase examined the effects of PAM-treatment, at varying PAM concentrations, on the soil’s mechanical properties—consistency limits, sediment volume attributes, compactability, unconfined compressive strength (UCS) and microstructure features; the results of this testing phase were analyzed to identify the optimum PAM concentration. The second phase investigated the effects of GR inclusion, with and without the optimum PAM concentration, through a series of standard Proctor compaction, UCS and soil reactivity tests.
2. Materials
2.1. Clay Soil
The soil used in this study was sourced from a landfill site located near Adelaide, South Australia; it was reddish-brown in color, and manifested the same typical texture and plasticity features as commonly reported for expansive clays. The physical and mechanical properties of the soil, determined as per relevant ASTM and Australian standards, are outlined in Table 1.
The conventional grain-size analysis indicated a clay fraction (< 2 μm) of 44%, along with 36% silt (2–75 μm) and 20% sand (0.075–4.75 mm). The liquid limit (as determined for 20-mm cone penetration depth using the 80 g–30° fall-cone device) and standard thread-rolling plastic limit were measured as wL = 78.04% and wP = 22.41%, respectively; giving a plasticity index of IP = 55.6%, such that the soil was classified as clay with high plasticity (CH) in accordance with the Unified Soil Classification System (USCS). The free swell ratio (FSR)—a quantitative measure of clay mineralogy and hence the soil’s expansive potential [50]—was obtained as FSR = 2.27, thereby indicating that the soil’s clay fraction was mainly dominated by active smectite minerals, such as montmorillonite. In terms of expansivity, the FSR corresponded to an undesirable, high expansive potential (see Table A1 of the Appendix A section for relevant classification criteria). The standard Proctor compaction test resulted in a relatively high optimum moisture content of wopt = 20.24%, along with a maximum dry density of ρdmax = 1.62 Mg/m3; the latter produces a minimum void ratio of emin = 0.702.
2.2. Ground Rubber
Commercially-available tire-derived ground rubber (GR) was used as the additive to partially replace the low-grade host soil. The physical properties and chemical composition of GR, as supplied by the manufacturer or independently measured as per relevant ASTM standards, are summarized in Table 2. In terms of gradation, the rubber particles were found to be similar in size to fine–medium sand (0.075–2 mm). The GR particle diameters corresponding to 10%, 30% and 60% finer—d10, d30 and d60—were obtained as 0.182 mm, 0.334 mm and 0.513 mm, respectively. The coefficients of uniformity and curvature were hence calculated as Cu = d60/d10 = 2.81 and Cc = d302/d60d10 = 1.20, from which the gradation of the GR material can be classified as equivalent to poorly-graded sand (SP) according to the USCS criterion. Other physical properties included a specific surface area of SSA = 0.05 m2/g and a specific gravity of GsGR = 1.09; the latter is approximately 2.5-fold lower than that of the clay soil (GsS = 2.76). The chemical composition of GR was mainly dominated by styrene–butadiene copolymer and carbon black, with mass fractions of 55% and 25–35%, respectively.
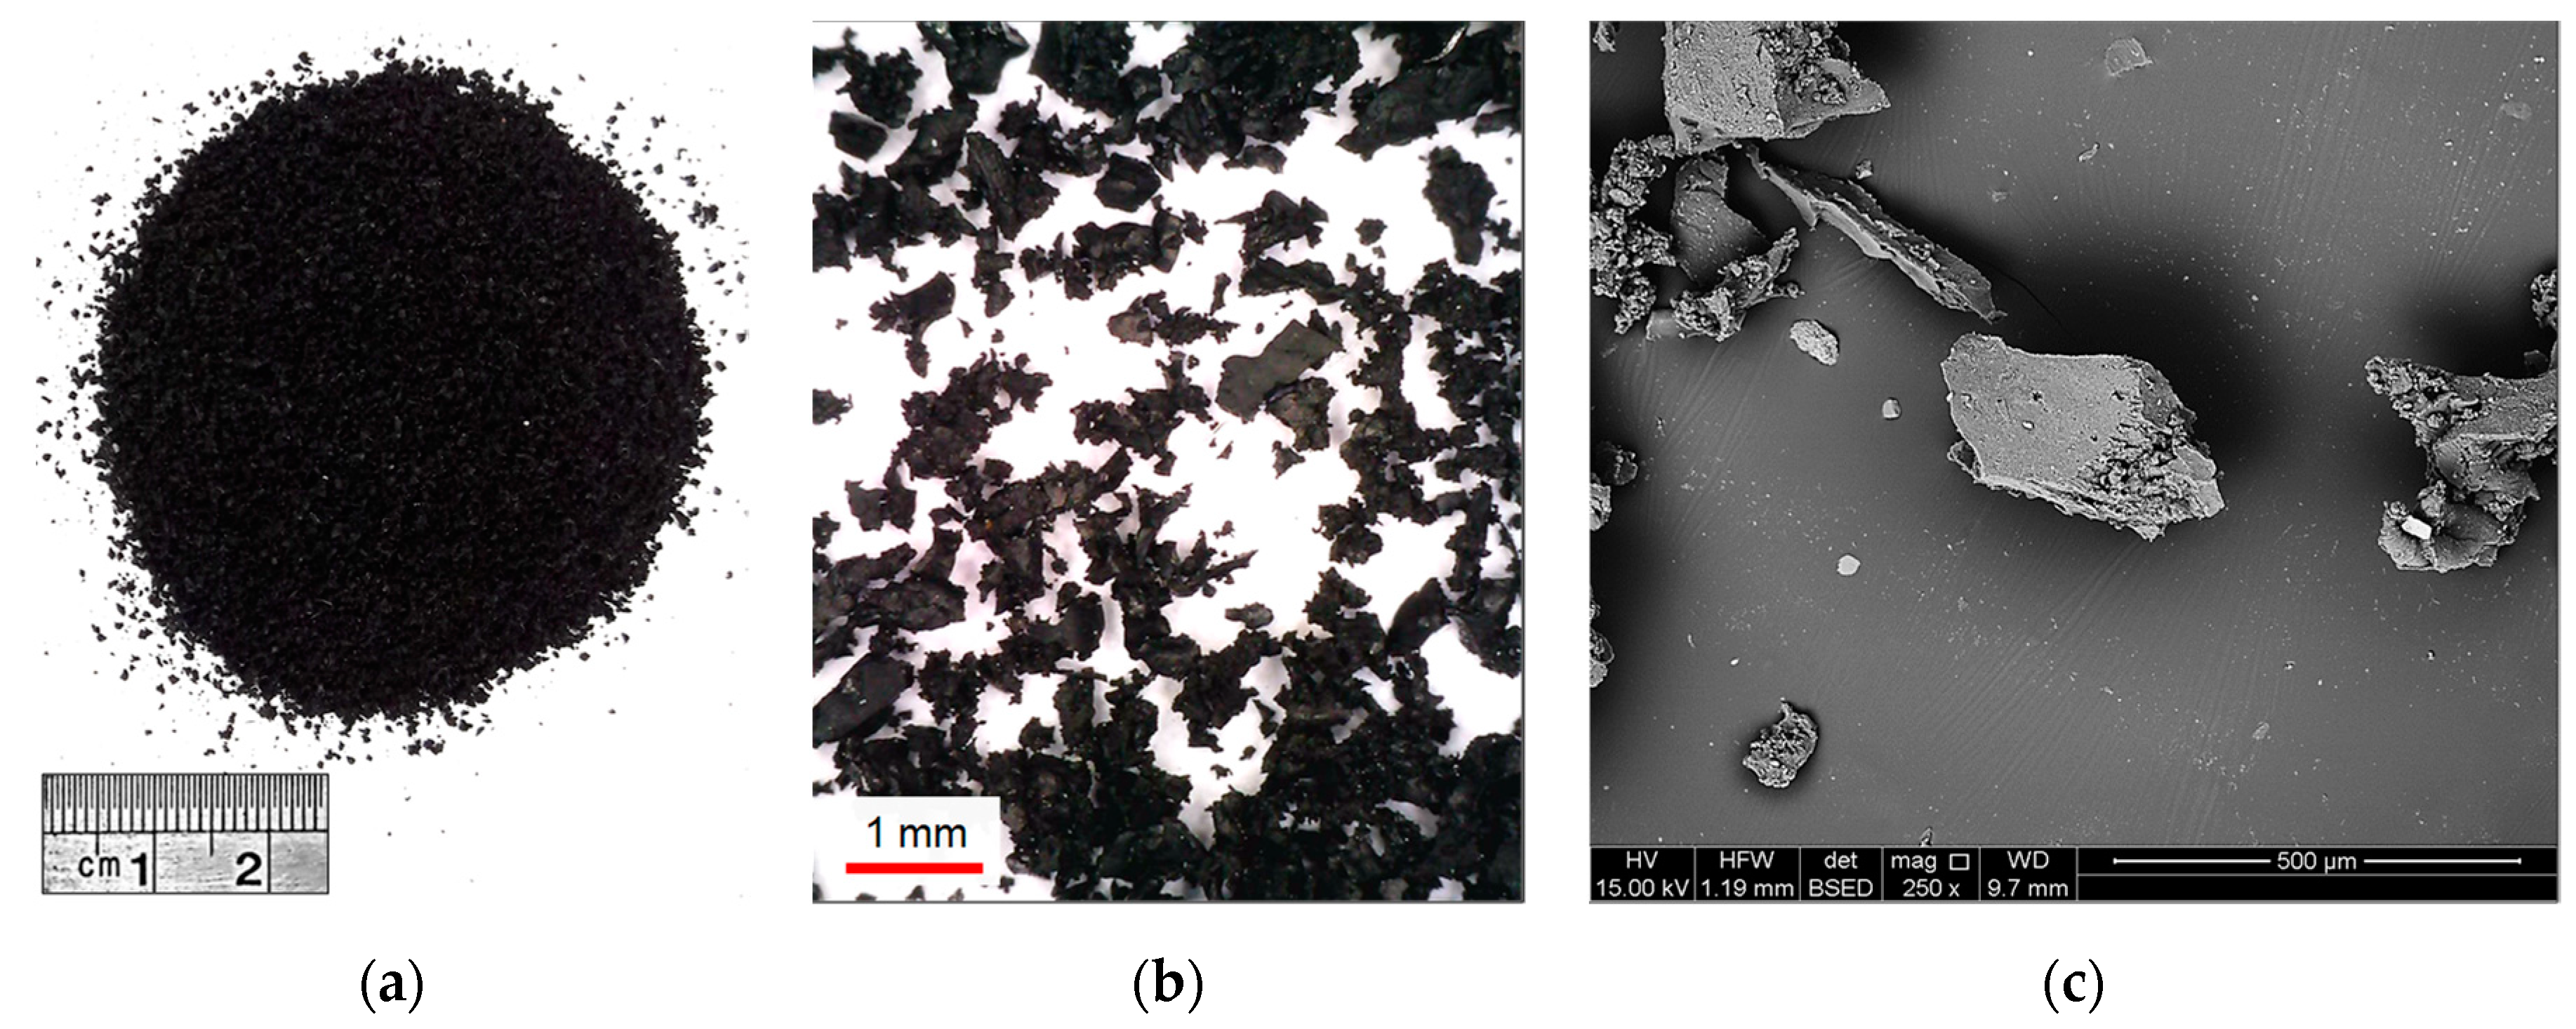
Optical and scanning electron microscopy (SEM) techniques were employed to observe the morphological features of the GR particles, and the results are illustrated in Figure 1. The GR particles were found to be non-spherical and highly-irregular in shape (see Figure 1b); their surfaces encompassed a series of peaks and troughs of varying heights, depths and spacing, as well as occasional cavities and micro-cracks, thus signifying a dominant rough surface texture (see Figure 1c). Such morphological features may potentially promote adhesion and/or generate frictional resistance at the soil aggregate–GR interface, and thus alter the soil fabric into a unitary mass of enhanced shear resistance [4,26,27].
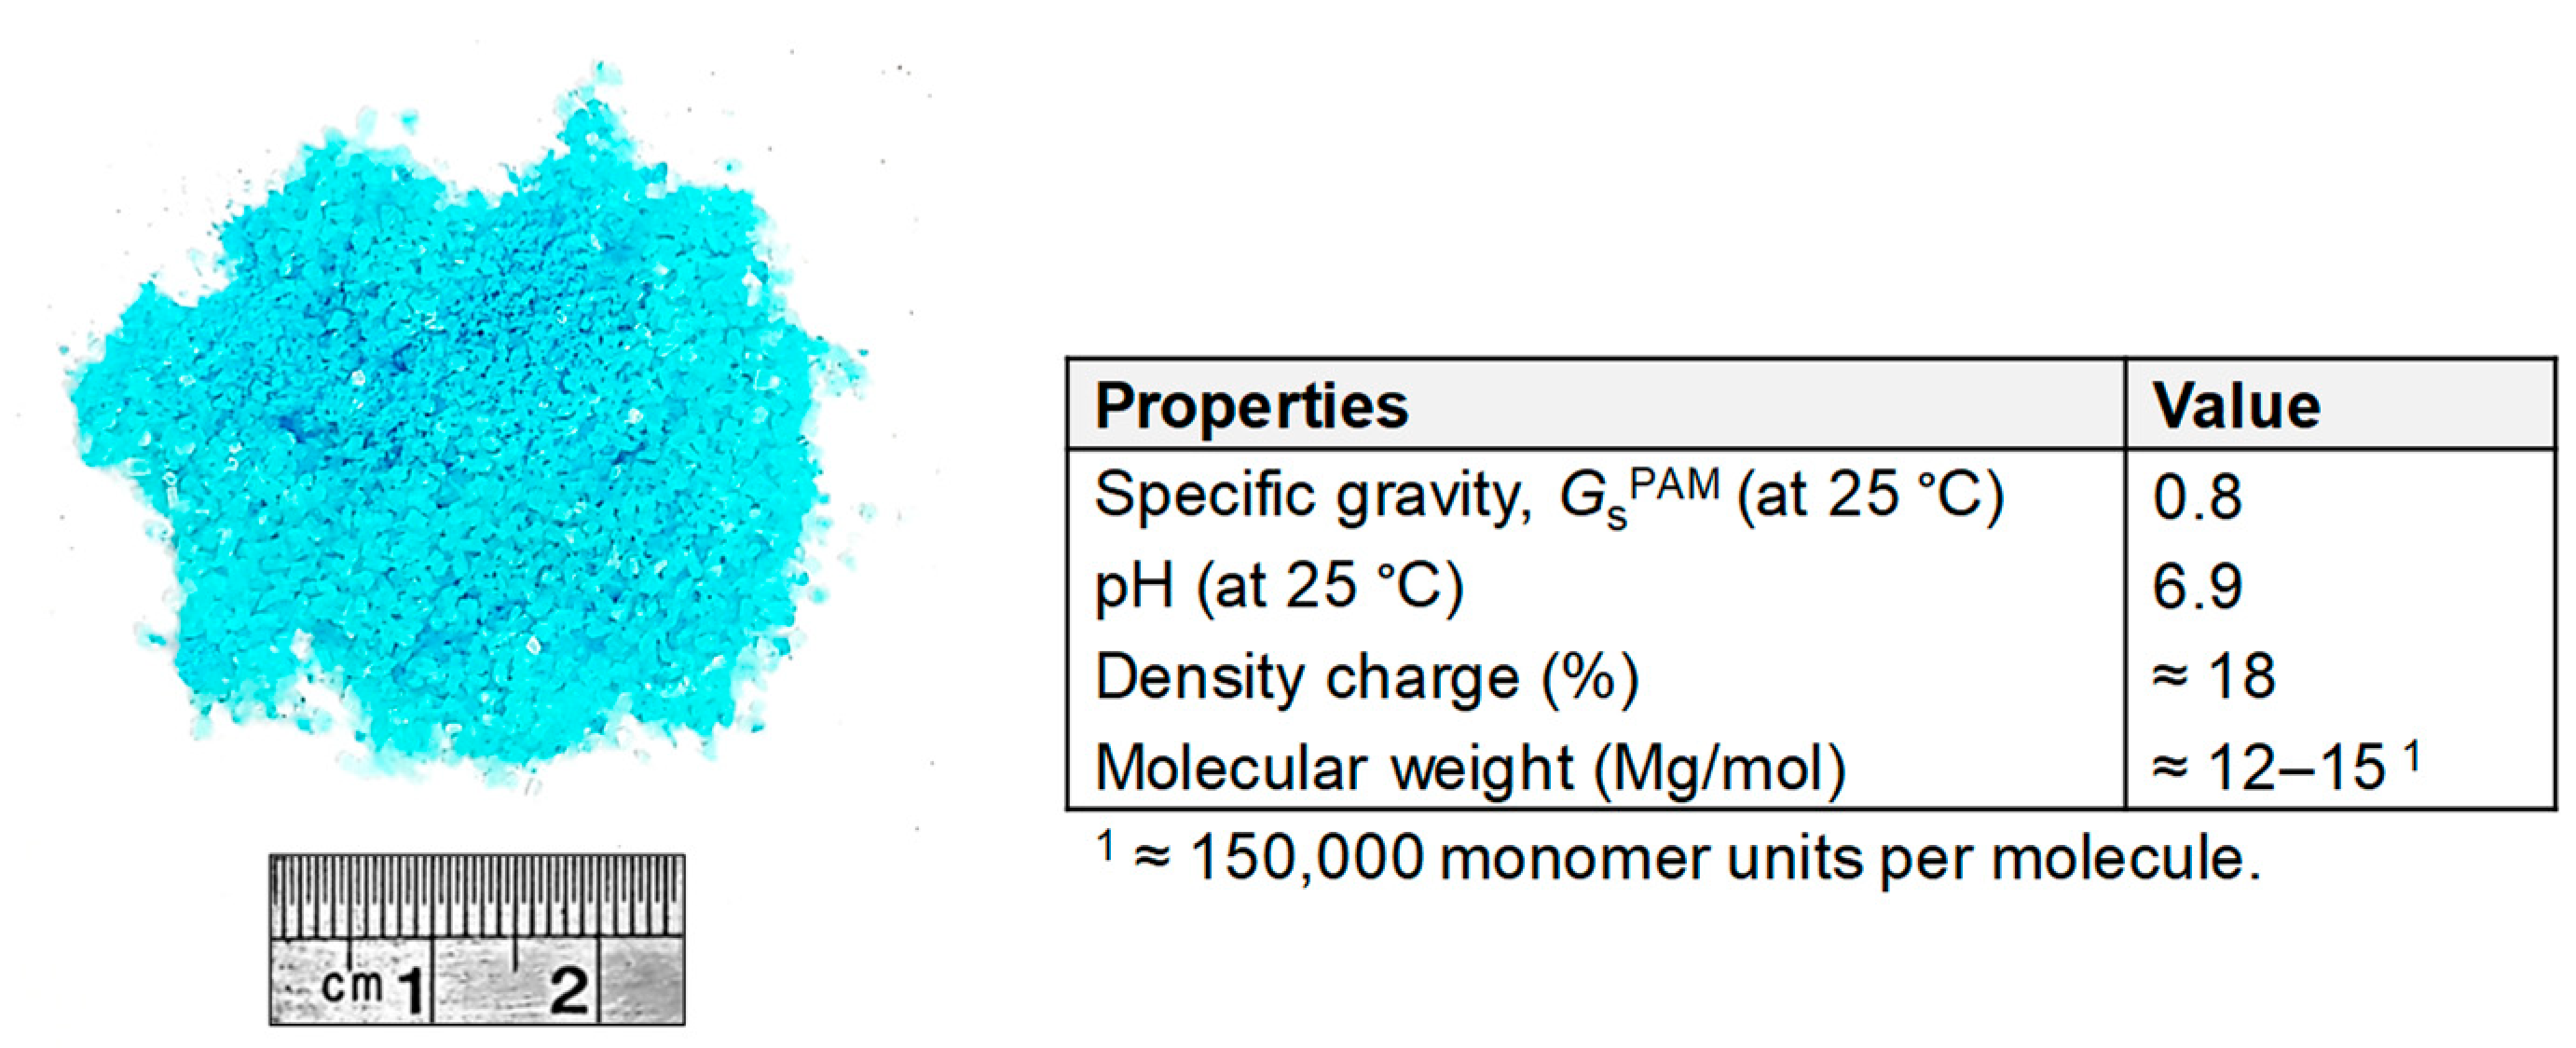
2.3. Polyacrylamide
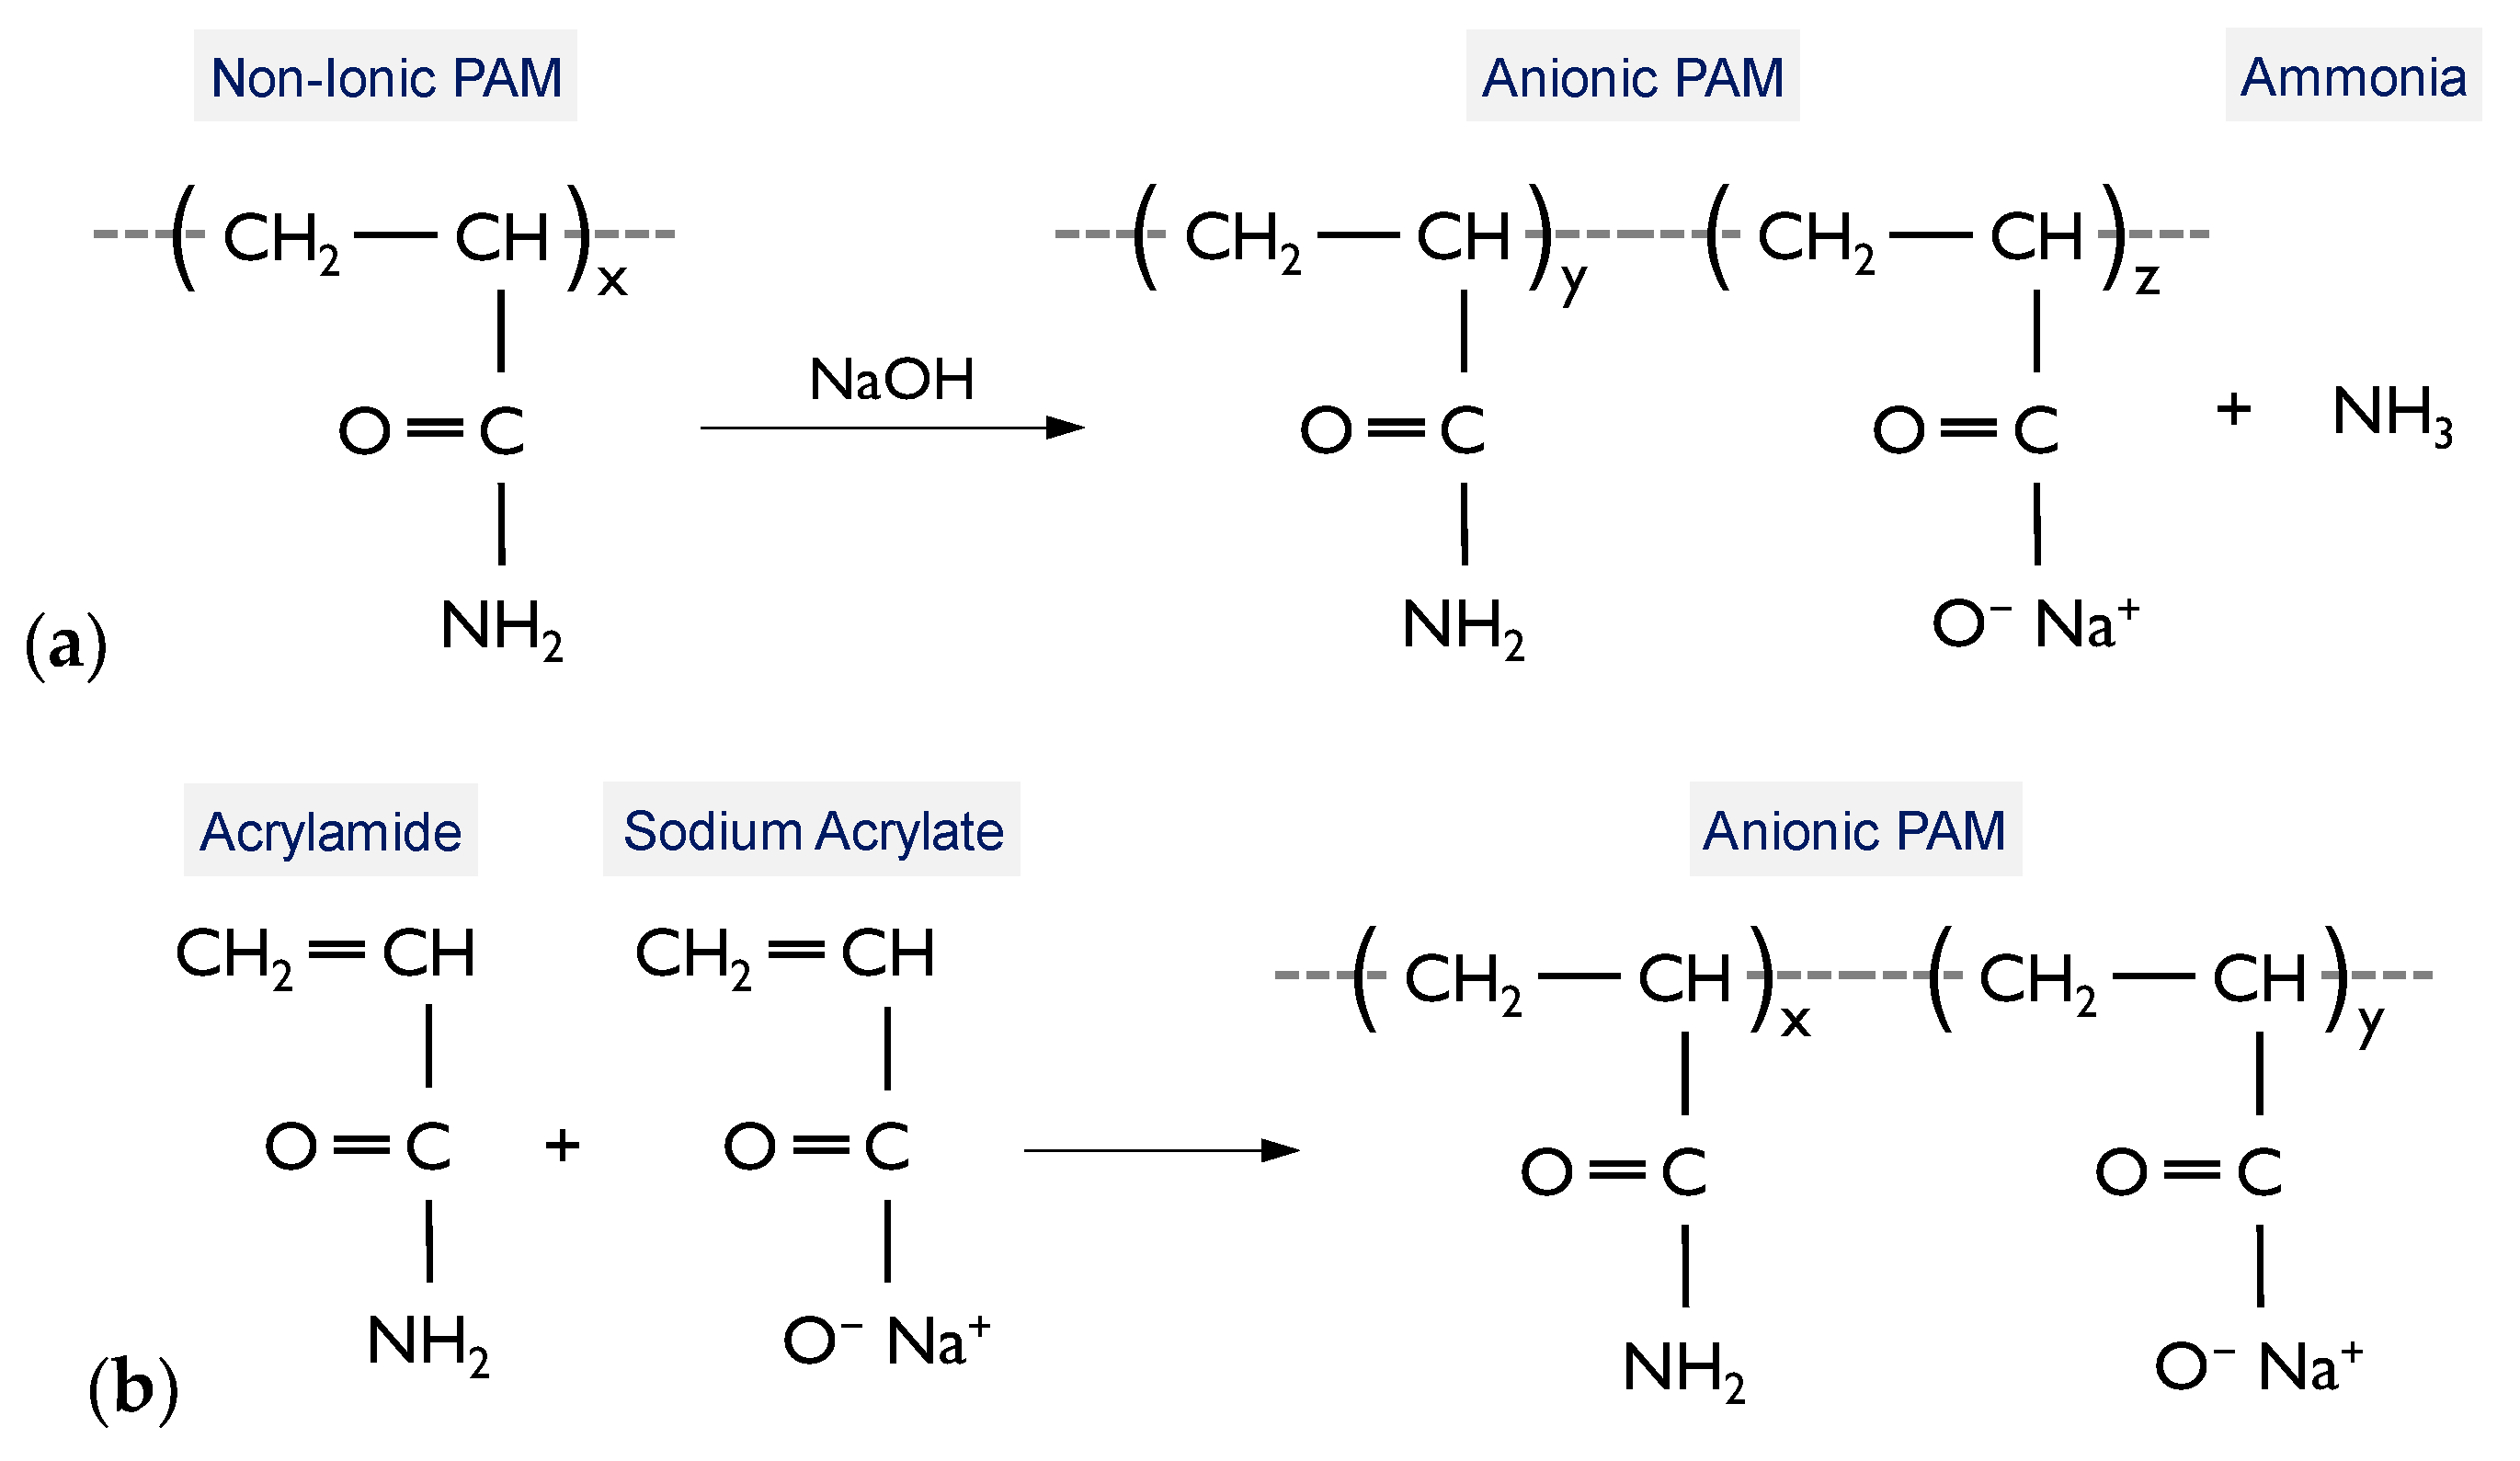
A commercially-available polymer agent, chemically referred to as polyacrylamide (PAM), was used as the binder. It was supplied in granular form and was diluted with water for application (see Figure A1 of the Appendix A section). PAMs are a group of hydrophilic, miscible synthetic polymers formed by the polymerization of acrylamide (AMD) and related monomers (CH2=CHC(O)NH2); they can be synthesized in non-ionic, cationic or anionic forms [51]. The anionic variant, as used in the present study, can be developed through two common pathways: (i) hydrolysis of non-ionic PAM with a strong base such as sodium hydroxide (NaOH), as demonstrated in Figure 2a; and (ii) copolymerization of AMD and acrylic acid or a salt of acrylic acid (e.g., sodium acrylate), as illustrated in Figure 2b [52].
Anionic PAMs are mainly employed to encourage flocculation of aqueous suspensions [51,53,54]. Other common applications, as reported in the literature, include their widespread use in the mining industry for thickening and dewatering of concentrates and tailings, as well as their successful adoption in routine construction practices, such as soil compaction, and for erosion control [52,55,56]. The physical and chemical properties of the used PAM, as supplied by the manufacturer, included a pH of 6.9 (at 25 °C), a moderate density charge of approximately 18%, and a relatively high molecular weight of 12–15 Mg/mol (equivalent to approximately 150,000 monomer units per molecule).
3. Experimental Program
3.1. Mix Designs and Sample Preparations
In this study, a total of thirteen mix designs, consisting of one control (hereafter the natural soil), four PAM-treated, four GR-blended and four PAM + GR cases, were examined (see Table 3). For ease of presentation, the following coding system was adopted to designate the various mix designs:
where S = the natural soil; Px = x g/L PAM; and Ry = y% GR.
As outlined in Table 3, the experimental program was carried out in two phases. The first phase, the results of which are presented in Section 4.1, examined the effects of PAM-treatment, at varying PAM concentrations, on the soil’s mechanical properties, namely consistency, sediment volume attributes, compactability, UCS and microstructure features; the results of this section were analyzed to identify the optimum PAM concentration. The second phase, the results of which are presented in Section 4.2, investigated the effects of GR inclusion, with and without the optimum PAM concentration (later to be found as Pc = 0.2 g/L), through a series of standard Proctor compaction, UCS and soil reactivity tests. The PAM, GR and moisture contents with respect to the various mix designs were, respectively, defined as:
where Pc = PAM concentration (g/L); Rc = GR content (%); wc = moisture content (%); MPAM = mass of PAM solids; MGR = mass of GR particles; MS = mass of soil solids; M*PAM = mass of PAM solution; MW = mass of water; and VW = volume of water.
Furthermore, the specific gravity of solids for those mix designs containing GR—SPxRy where x = {0, 0.2}, and y = {5, 10, 20, 30}—was calculated by the following theoretical relationship [34,57]:
where GsM = specific gravity of GR-blended mixtures (either with or without PAM); GsS = specific gravity of soil solids (= 2.76); and GsGR = specific gravity of GR particles (= 1.09).
The natural soil and GR were blended in dry form, as per the selected mix designs outlined in Table 3. The required volume of moisture, either water or PAM solution, corresponding to the mixtures’ standard Proctor optimum moisture content (values presented in Table 6 and Figure 6), was added to each blend and thoroughly mixed using a hand trowel. For those mix designs containing PAM, great care was taken to pulverize any clumped particles, thus targeting homogeneity of the mixtures. A special stainless-steel split mold, as previously described by the authors, was used for sample preparations by means of the static compaction technique [4,38]. The mold consisted of three segments—the top collar, the middle section, and the bottom collar. The middle section, measuring 50 mm in diameter and 100 mm in height, accommodates the samples prepared for the UCS tests (see Section 3.2), as well as the core shrinkage tests (a component of the soil reactivity test, as outlined in Section 3.3). The samples were formed by static compaction in the mold in five equal-height layers, each layer having achieved its respective standard Proctor maximum dry density (values presented in Table 6 and Figure 6). Samples for the oedometer swell tests, a second component of the soil reactivity test (see Section 3.3), were prepared in a similar fashion; in this case, however, a different mold with a middle section measuring 50 mm in diameter and 20 mm in height, along with three compaction layers, were adopted. The samples with PAM as the sole stabilizing agent were enclosed in multiple layers of cling wrap and maintained at ambient laboratory temperature conditions for Tc = 1, 4, 7 and 14 d to examine the effect of curing duration on the UCS. For those mix designs containing the optimum PAM and GR, the same curing procedure was carried out for only 7 d (later to be found as the optimum curing period). The methodologies associated with the UCS, soil reactivity and SEM tests are presented in the following sections.
3.2. UCS Test
UCS tests were carried out in accordance with ASTM D2166–16 (American Society for Testing and Materials, PA, USA). The prepared samples were axially compressed at a constant displacement rate of 1 mm/min, as commonly adopted in the literature [26,37,38]. The axial strains and corresponding axial stresses were recorded at predefined time intervals to a point at which the maximum axial stress required for sample failure, the UCS, was achieved. On account of the curing periods adopted for the samples containing PAM, a total of 25 UCS tests—one for control (natural soil), sixteen for PAM-treated, four for GR-blended and four for PAM + GR blends—were carried out to address the thirteen mix designs outlined in Table 3.
3.3. Soil Reactivity Test
Soil reactivity tests were carried out in accordance with AS 1289.7.1.1–03 (Standards Australia, NSW, Australia). The test incorporates results obtained from the core shrinkage and the oedometer swell tests, performed on two companion samples, into a unique parameter referred to as the shrink–swell index:
where Iss = shrink–swell index (%pF−1); [pF] = 1 + log[kPa]; εsh = shrinkage potential (%); εsw = swelling potential (%); ∆ψ = range of total suction change (pF); ψsh = total suction upon completion of the core shrinkage test (pF); and ψsw = total suction upon completion of the oedometer swell test (pF).
The methodologies associated with the two test components—the core shrinkage and the oedometer swell tests—are presented in the following.
- Core shrinkage test: The prepared 50-mm diameter by 100-mm long samples were allowed to desiccate at ambient laboratory temperature conditions. For each sample, the incurred axial shrinkage strain was regularly monitored (by a dial displacement transducer) to a point at which shrinkage ceased. The desiccated samples were then oven-dried at 105 °C for 24 hr. Final height measurements were taken by a Vernier caliper, from which the ultimate shrinkage strain, denoted as εsh and referred to as the shrinkage potential, was determined.
- Oedometer swell test: The prepared 50-mm diameter by 20-mm high samples were inundated with water and allowed to swell in a conventional oedometer setup under a nominal vertical stress of 25 kPa. For each sample, the incurred axial swelling strain was monitored during predefined time intervals to a point at which the ultimate swelling strain, denoted as εsw and referred to as the swelling potential, was achieved.
The shrink–swell index represents percentage axial strain, either shrinkage or swelling, per change in unit suction of the soil, and thus can be employed to estimate free ground surface movements under field conditions [58]. Other applications, as commonly adopted in Australian geotechnical practice, include its use for site classification, as well as its importance to perceive and hence specify the soil degree of expansivity. Classification procedures for expansive soils based on the shrink–swell index, as proposed by Seddon [59], are summarized in Table A2 of the Appendix A section. The denominator in Equation (6), ∆ψ = ψsh − ψsw, represents the range of total suction change with respect to the sample’s volume increase from air-dry to near saturation conditions; it is commonly taken as ∆ψ = 1.8 pF, suggested based on collective experience of the Australian AS 2870 code committee [58]. Although this standard value is widely accepted for natural fine-grained soils, the same may not necessarily hold true for stabilized expansive soils. As such, to examine the validity of the 1.8 pF value for the stabilized expansive soil under investigation in the present study, independent suction measurements were taken upon completion of the core shrinkage and oedometer swell tests by means of the WP4C (METER Group, WA, USA) dew point potentiometer apparatus device [60]. As such, two sets of Iss values were measured for each sample: (i) conventional shrink–swell index Issc, obtained by ∆ψ = 1.8 pF; and (ii) modified shrink–swell index Issm, obtained by actual ∆ψ measurements. In this regard, as outlined in Table 3, a total of eight mix designs—one for control (natural soil or SP0R0), one for PAM-treated (SP0.2R0), four for GR-blended (SP0Ry where y = {5, 10, 20, 30}) and four for PAM + GR blends (SP0.2Ry where y = {5, 10, 20, 30})—were examined.
3.4. SEM Analysis
The SEM technique was used to observe the evolution of soil fabric in response to PAM-treatment; relevant microstructure analyses were carried out using an SEM characterization scheme developed by Soltani et al. [4]. The Philips XL20 (Amsterdam, The Netherlands) scanning electron microscope was used for SEM imaging; apparatus specifications included a resolution of 4 μm, along with a maximum magnification ratio of 50,000×. In this regard, typical mix designs consisting of SP0R0 (natural soil) and SP0.2R0 were examined. The desired samples, prepared as per Section 3.1, were first air-dried for approximately 14 d. The desiccated samples were then carefully fractured into cubic-shaped pieces, approximately 1 cm3 in volume, and were further scanned at various magnification ratios ranging from 250× to 20,000×.
4. Results and Discussion
4.1. Phase I: Optimum PAM Concentration
4.1.1. Effect of PAM on Soil Consistency
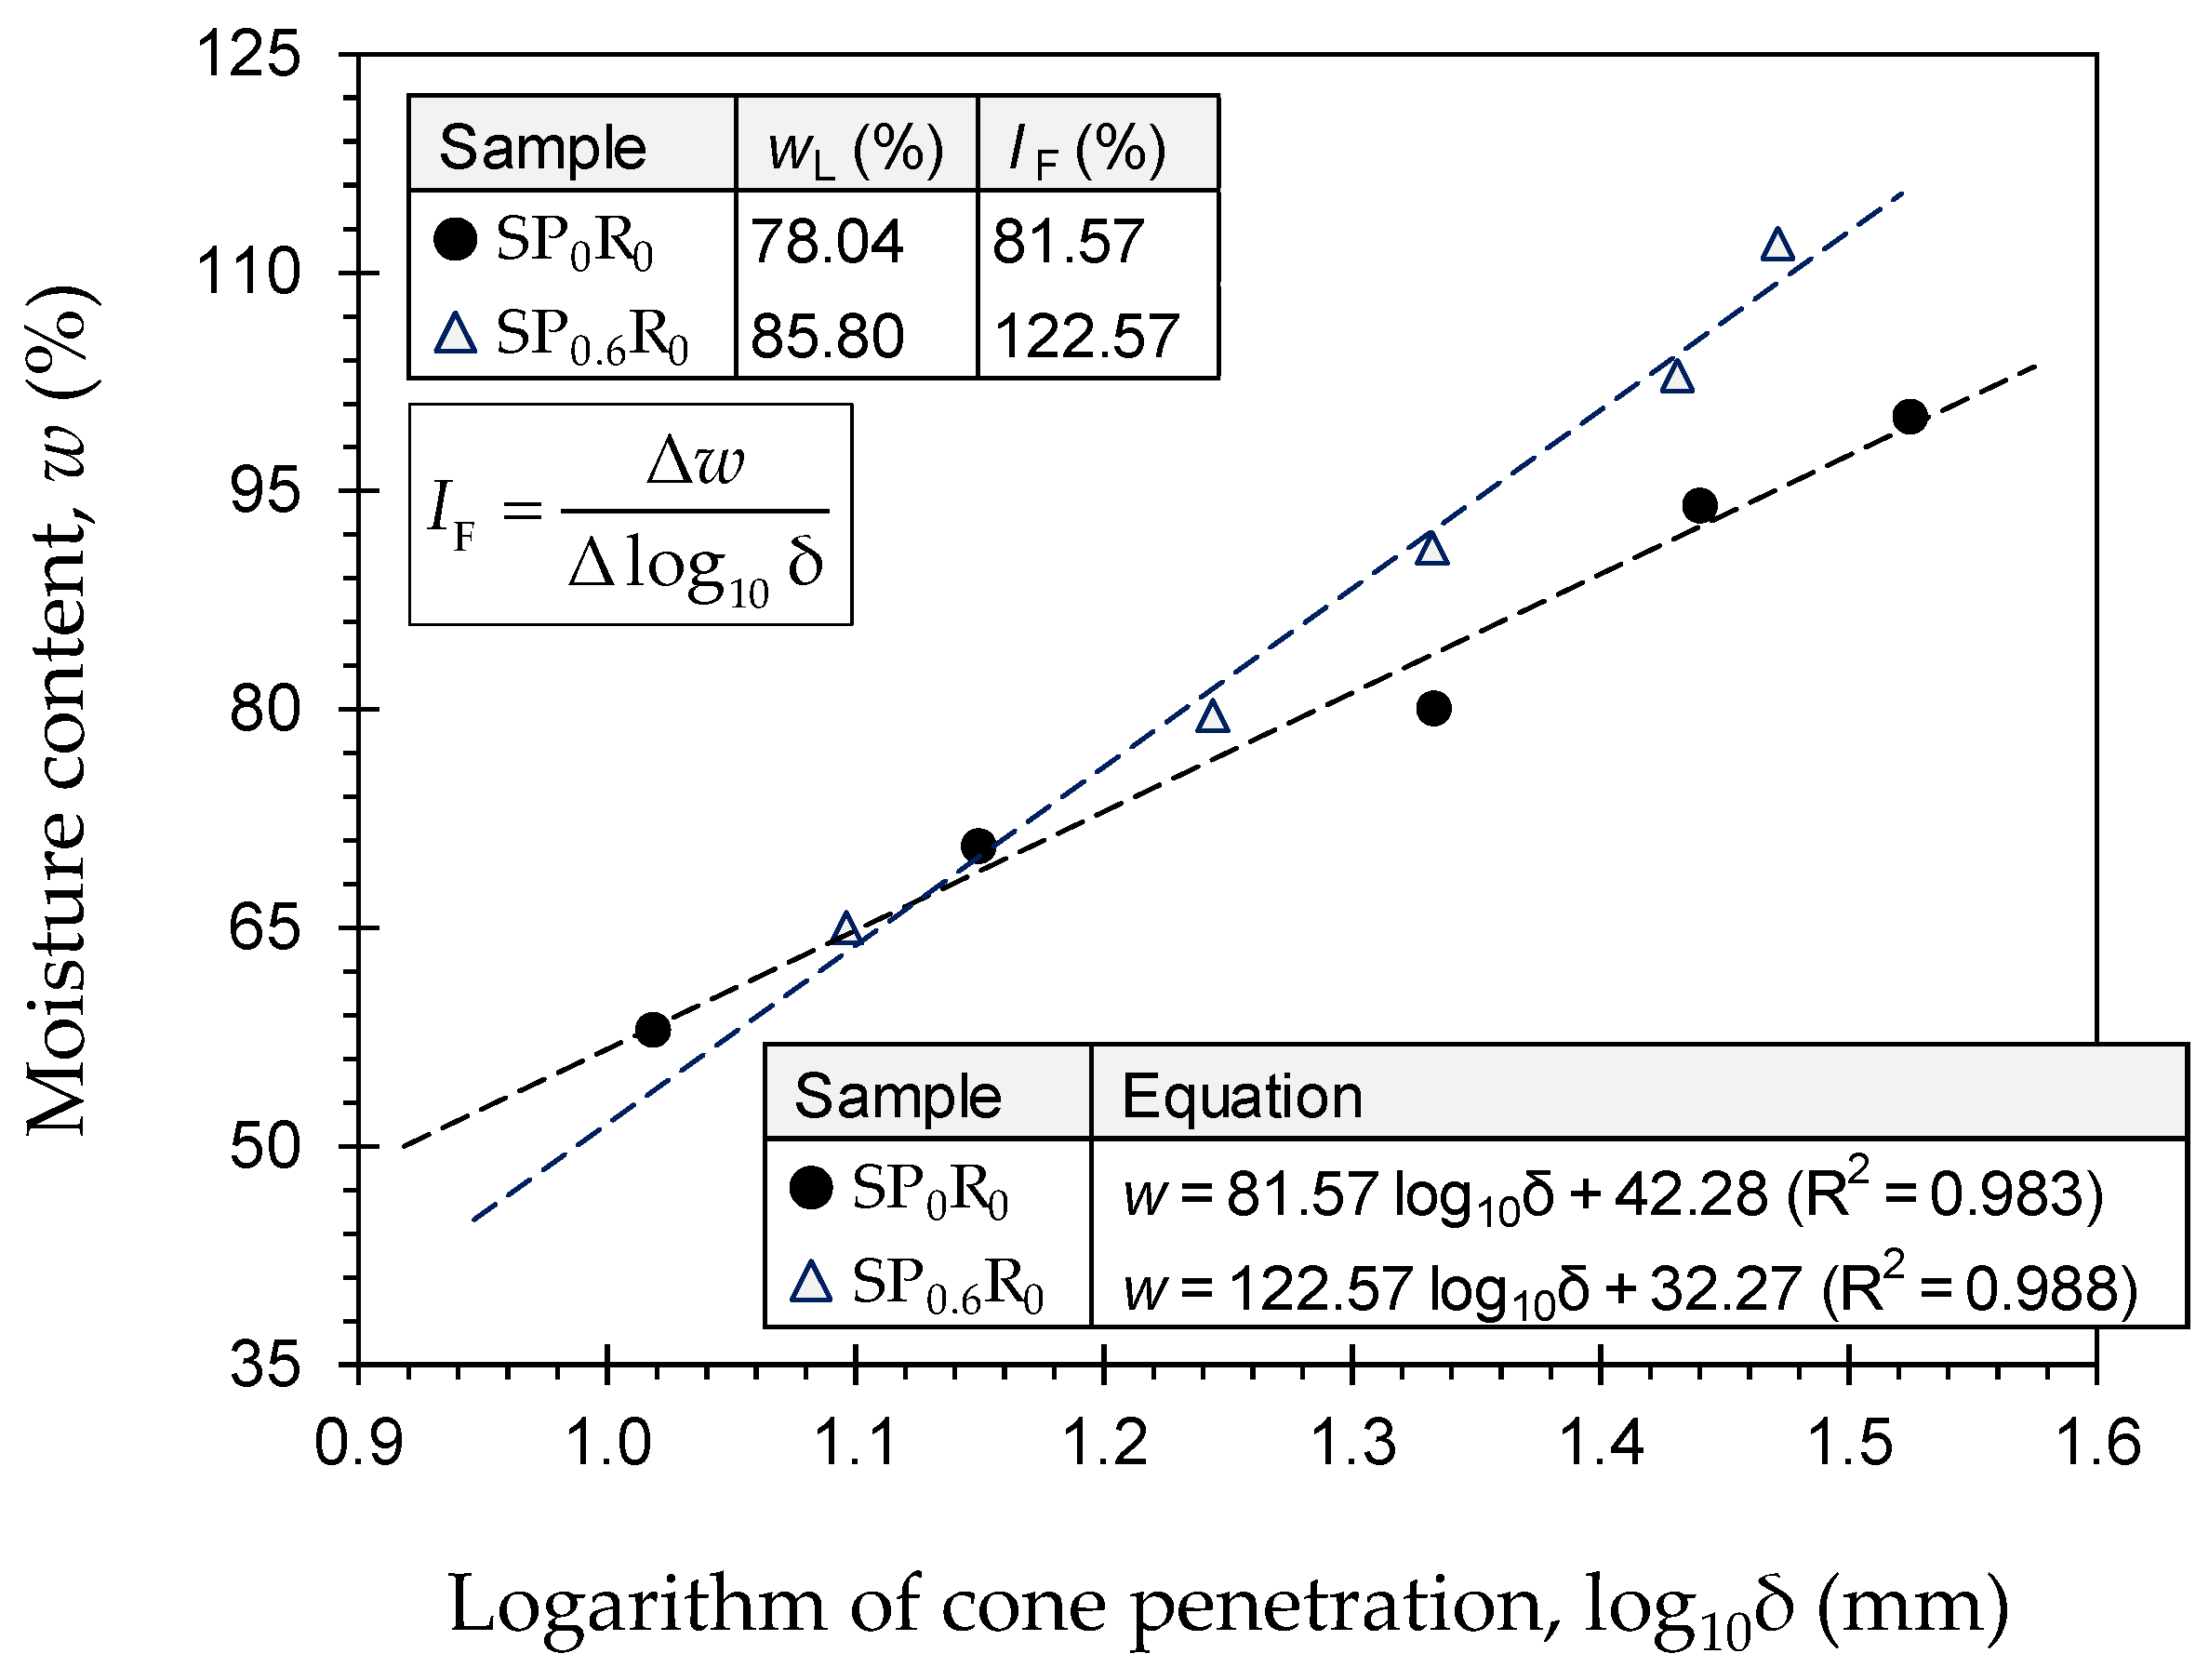
Typical flow curves for the natural soil (SP0R0) and the sample treated with 0.6 g/L PAM (SP0.6R0) are provided in Figure 3. As a result of PAM-treatment, the flow curve exhibited a notable, counterclockwise rotation, thereby leading to a major increase in values of both the flow index IF = ∆w/∆log10δ (where w = moisture content, and δ = cone penetration depth) and the liquid limit wL. Table 4 presents the complete results of the consistency limits tests for the natural soil and various PAM-treated blends—SPxR0 where x = {0, 0.1, 0.2, 0.4, 0.6}. The greater the PAM concentration, the higher the consistency limits up to Pc = 0.2 g/L, beyond which the effect of PAM-treatment was found to be marginal. The rate of increase in the liquid limit, however, was more pronounced compared with that of the plastic limit wP and the plasticity index IP. The natural soil resulted in wL = 78.04% (IP = 55.63%), while the samples treated with Pc = 0.1 g/L, 0.2 g/L, 0.4 g/L and 0.6 g/L produced higher values of wL = 82.82%, 87.61%, 87.22% and 85.80% (IP = 59.09%, 62.76%, 61.36% and 60.93%), respectively. Consequently, PAM-treatment did not alter the soil’s USCS classification, as the original CH “clay with high plasticity” category remained unchanged for all treated blends.
The consistency limits, the liquid limit and flow index in particular, can be employed to infer the development of soil fabric [40,61]. An increase in the liquid limit, as is the case with PAM-treated blends (see Table 4), implies that an edge-to-face flocculated fabric dominates the matrix [62]. Compared to a face-to-face dispersed fabric, a flocculated fabric offers higher cone penetration/shear resistance, which in turn promotes higher liquid limits—that is, the standard 20-mm cone penetration depth is achieved for higher moisture contents.
4.1.2. Effect of PAM on Sediment Volume Behavior
Sediment volume features for the soil–water and various soil–PAM suspensions—SPxR0 where x = {0, 0.1, 0.2, 0.4, 0.6}—are provided in Table 5. The greater the PAM concentration, the lower the equilibrium sediment volume (and hence the lower the FSR) up to Pc = 0.2 g/L, beyond which the rate of decrease was marginal. The soil–water suspension (SP0R0) had an equilibrium sediment volume of VD = 34.0 cm3 (FSR = 2.27), whereas the soil–PAM suspensions with Pc = 0.1 g/L, 0.2 g/L, 0.4 g/L and 0.6 g/L produced lower values of VP = 28.5 cm3, 25.0 cm3, 24.5 cm3 and 23.0 cm3 (FSR = 1.90, 1.67, 1.63 and 1.53), respectively. As outlined in Table A1, the FSR can be used to perceive the soil degree of expansivity [50]. The natural soil (SP0R0) manifested an undesirable, high degree of expansivity, while the four PAM-treated cases all exhibited an improved, moderate expansive potential.
Much like the consistency limits (see Section 4.1.1), the FSR serves as an indicator of fabric evolution in response to pore-fluid variations, or in this case PAM-treatment [4,40]. A decrease in the FSR for the PAM-treated blends (see Table 5) signifies an increased tendency for particle flocculation, which in turn justifies the observed reduction in the equilibrium sediment volume [40]. In this regard, the maximum tendency for particle flocculation seems to be achieved at Pc = 0.2 g/L, as greater PAM concentrations did not promote notable further reductions in VP and hence the FSR. These trends are also in agreement with those observed for the liquid limit and the flow index, both of which exhibited only minor variations beyond 0.2 g/L PAM.
4.1.3. Effect of PAM on Soil Compactability
Typical standard Proctor compaction curves, along with representative saturation lines (based on measured GsS = 2.76), for the natural soil (SP0R0) and the sample treated with 0.6 g/L PAM (SP0.6R0) are provided in Figure 4. As a result of PAM-treatment, the compaction locus underwent a considerable upward translation in the ρd:w space (where ρd = dry density, and w = moisture content), thereby signifying a notable increase in the maximum dry density ρdmax (follow the “Compaction Path” in Figure 4). However, the variation in corresponding optimum moisture content wopt values were found to be marginal. Table 6 presents the complete results of the compaction tests for the natural soil and various PAM-treated blends—SPxR0 where x = {0, 0.1, 0.2, 0.4, 0.6}. The natural soil resulted in ρdmax = 1.62 Mg/m3 (wopt = 20.24%), whereas the samples treated with Pc = 0.1 g/L, 0.2 g/L, 0.4 g/L and 0.6 g/L produced higher ρdmax values of 1.64 Mg/m3, 1.66 Mg/m3, 1.67 Mg/m3 and 1.70 Mg/m3 (wopt = 20.28%, 21.06%, 20.20% and 20.72%), respectively.
The increase in maximum dry density with increasing PAM concentration can be attributed to the higher viscosity of PAM solutions compared with that of water. That is, the increase in pore-fluid viscosity for the PAM-treated blends induces contact lubrication in the soil matrix; during compaction, this feature facilitates the movement and sliding of soil particles with much less effort/friction, thereby giving rise to higher maximum dry densities [44,48,61].
4.1.4. Effect of PAM on UCS
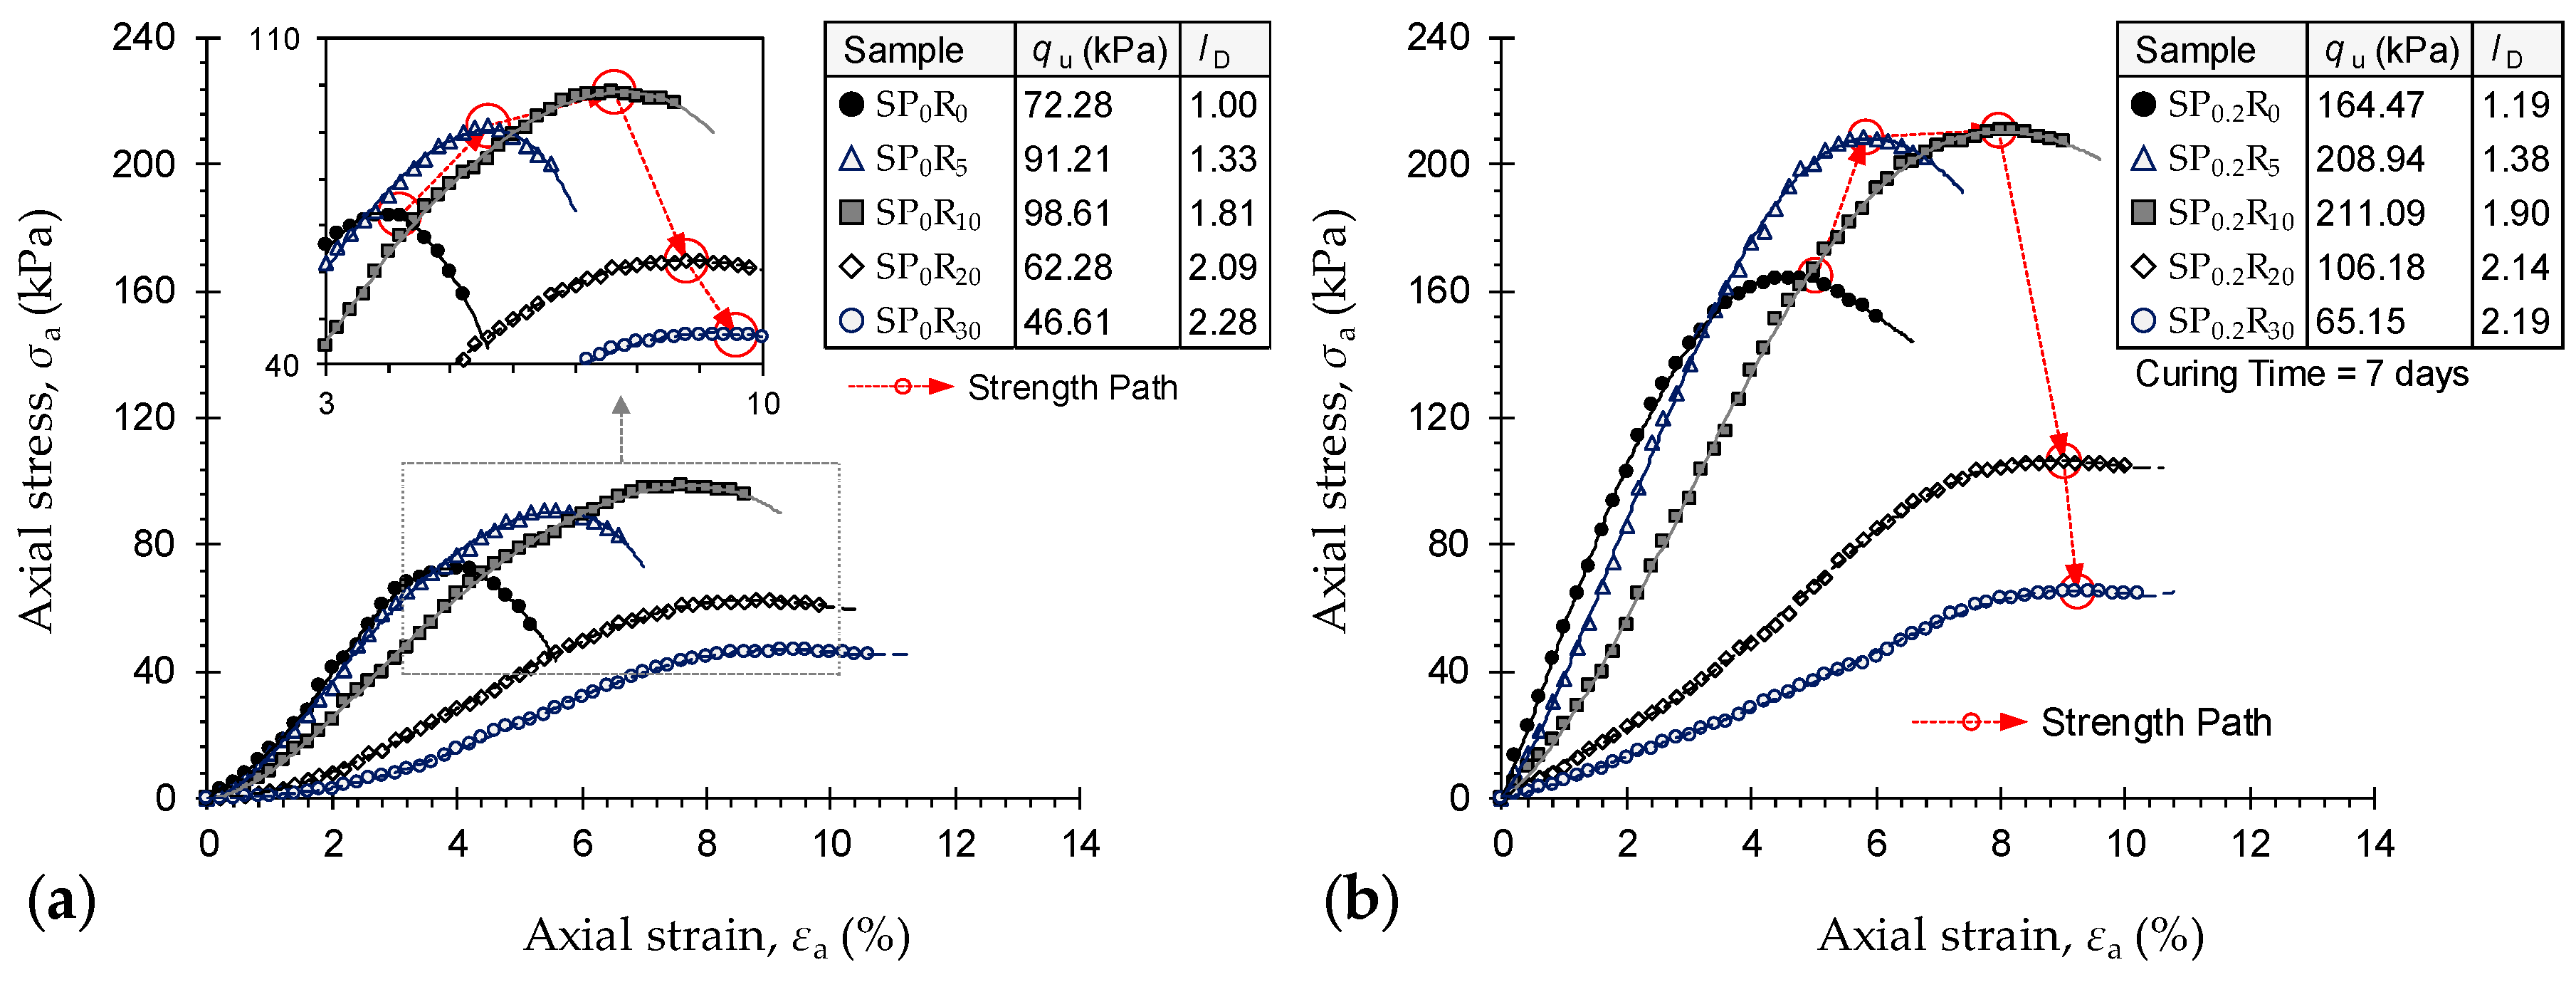
Stress–strain curves for the natural soil and various PAM-treated samples cured for Tc = 1 d—SPxR0 where x = {0, 0.1, 0.2, 0.4, 0.6}—are provided in Figure 5a. The constitutive response for the natural soil sample (SP0R0) demonstrated a rise–fall behavior with a visually-detectable peak point. As a result of increasing PAM concentration, the stress–strain trace progressively transitioned towards a more ductile behavior. In terms of UCS, the greater the PAM concentration, the higher the mobilized UCS up to Pc = 0.2 g/L, beyond which PAM-treatment was found to adversely influence strength development (follow the “Strength Path” in Figure 5a). At Tc = 1 d, the natural soil produced a UCS of qu = 72.28 kPa, while the addition of 0.1 g/L and 0.2 g/L PAM, at Tc = 1 d, led to mobilized higher values of 96.87 kPa and 128.43 kPa—equivalent to improvements of η = 34% and 78%—respectively. For the same curing period, the higher PAM concentrations of 0.4 g/L and 0.6 g/L resulted in qu = 83.18 kPa and 54.14 kPa, respectively; the former, SP0.4R0, holding a 15% advantage over the natural soil, whereas the latter, SP0.6R0, exhibits a significant 25% reduction with respect to the natural soil.
Stress–strain curves for the natural soil (SP0R0) and various samples treated with 0.2 g/L PAM (SP0.2R0) cured for Tc = 1, 4, 7 and 14 d are provided in Figure 5b. For any given PAM concentration, an increase in curing period was found to produce a major increase in the UCS up to Tc = 7 d, beyond which the effect of curing was found to be marginal (follow the “Strength Path” in Figure 5b), with the axial strain at failure (failure mode) remaining remarkably unchanged. As a typical case, the sample SP0.2R0 resulted in qu = 128.43 kPa, 141.23 kPa, 164.47 kPa and 168.34 kPa—equivalent to improvements of η = 78%, 95%, 128% and 133% with respect to the natural soil (SP0R0)—at Tc = 1, 4, 7 and 14 d, respectively.
The complete results of the UCS tests, along with other stress–strain features, namely the deformability index ID, the elastic stiffness modulus E50, the peak strain energy EU and the resilient modulus ER, are summarized in Table 7. At any given curing time, the deformability index—a measure of the sample’s ductility, as defined in the footer of Table 7 [63]—exhibited a monotonically-increasing trend with respect to PAM concentration, meaning that the greater the PAM concentration, the more ductile the sample’s response to unconfined compression. By definition, ID has a value of unity for the natural soil (SP0R0). As typical cases, the samples SP0.1R0, SP0.2R0, SP0.4R0 and SP0.6R0 cured for Tc = 1 d resulted in ID = 1.10, 1.19, 1.62 and 1.90, respectively. For any given PAM concentration, the effect of curing period was found to be marginal; for instance, the sample SP0.2R0 resulted in ID = 1.19, 1.24, 1.19 and 1.16 at Tc = 1, 4, 7 and 14 d, respectively. The elastic stiffness modulus, peak strain energy and resilient modulus, as defined in the footer of Table 7 [64,65,66], all demonstrated a trend similar to that observed for the UCS. As such, at any given curing period, the greater the PAM concentration, the higher the E50, EU and ER values up to Pc = 0.2 g/L, beyond which PAM-treatment adversely influenced the sample’s stiffness, toughness and resilience. In terms of stiffness, for instance, the natural soil resulted in E50 = 1.97 MPa, while the addition of 0.1 g/L, 0.2 g/L, 0.4 g/L and 0.6 g/L PAM at Tc = 1 d produced E50 values of 2.83 MPa, 3.67 MPa, 1.39 MPa and 0.75 MPa, respectively. Much like the UCS, the effect of curing period for any given PAM concentration was only notable up to Tc = 7 d; beyond which the variations in E50, EU and ER were negligible. As a typical case, the sample SP0.2R0 resulted in E50 = 3.67 MPa, 4.28 MPa, 5.27 MPa and 5.29 MPa at Tc = 1, 4, 7 and 14 d, respectively.
4.2. Phase II: Combined Effects of Optimum PAM and GR
4.2.1. Effect of PAM + GR on Soil Compactability
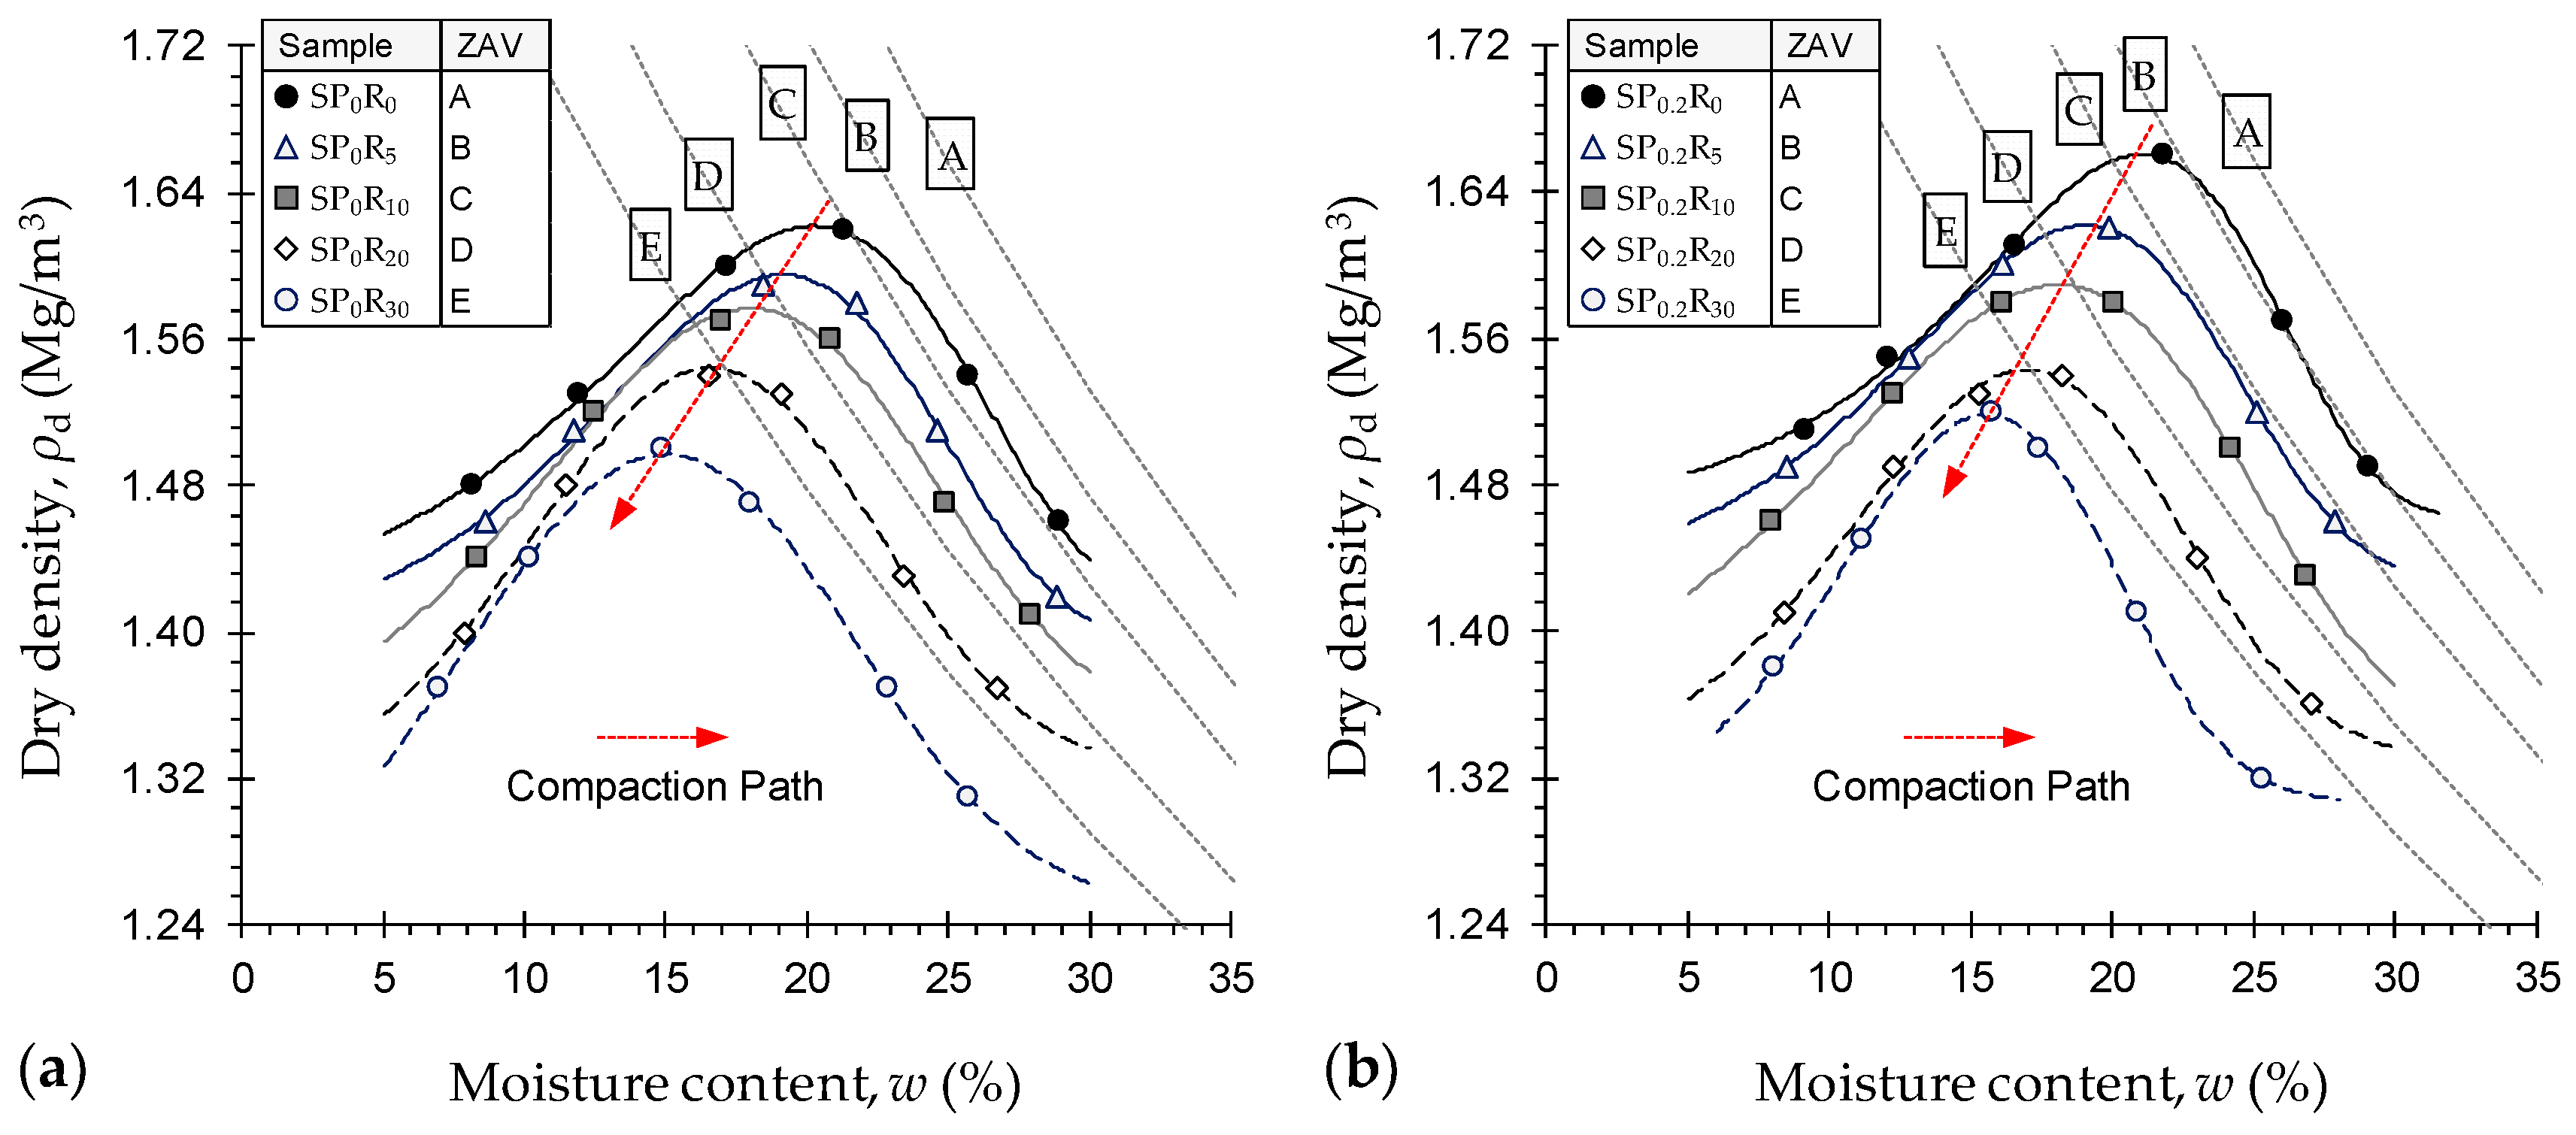
Standard Proctor compaction curves, along with corresponding zero-air void (ZAV) saturation lines, for the natural soil and various GR-blended samples untreated—SP0Ry where y = {0, 5, 10, 20, 30}—and treated with 0.2 g/L PAM—SP0.2Ry where y = {0, 5, 10, 20, 30}—are provided in Figure 6a,b, respectively. As a result of GR inclusion, the compaction locus underwent a linear downward–leftward translation over the ρd:w space, thus indicating a notable decrease in both the maximum dry density and the optimum moisture content associated with increasing GR content (follow the “Compaction Path” in Figure 6). The greater the GR content, the lower the compaction characteristics, with PAM-treated cases holding a slight advantage over their untreated counterparts. The natural soil (SP0R0) and the untreated GR-blended samples with Rc = 5%, 10%, 20% and 30% produced ρdmax = 1.62 Mg/m3, 1.60 Mg/m3, 1.58 Mg/m3, 1.54 Mg/m3 and 1.50 Mg/m3 (wopt = 20.24%, 19.15%, 18.01%, 16.58% and 15.00%), respectively. As a result of PAM-treatment, the aforementioned values were increased marginally to ρdmax = 1.66 Mg/m3, 1.62 Mg/m3, 1.59 Mg/m3, 1.54 Mg/m3 and 1.52 Mg/m3 (wopt = 21.06%, 19.07%, 18.09%, 16.95% and 15.56%), respectively.
Reduction in the compaction characteristics, particularly the maximum dry density, advocates the use of GR as a sustainable, lightweight fill alternative to traditional quarried materials, such as sands and aggregates. The GR material’s lower specific gravity of 1.09 and hydrophobic character (<4% water adsorption) compared with that of the soil grains, and active clay minerals in particular, corroborate the observed reduction in the compaction characteristics [36,37,57]. Moreover, the compacted GR particles, though rather resilient, may gradually recover their initial shape due to the elastic rebound, thereby reducing the efficiency of compactive effort and hence leading to lower maximum dry densities [26,57].
4.2.2. Effect of PAM + GR on UCS
Stress–strain curves for the natural soil and various GR-blended samples untreated—SP0Ry where y = {0, 5, 10, 20, 30}—and treated with 0.2 g/L PAM at Tc = 7 d—SP0.2Ry where y = {0, 5, 10, 20, 30}—are provided in Figure 7a,b, respectively. As a result of increasing GR content, the constitutive response progressively transitioned towards a strain-hardening character; the greater the GR content, the more pronounced the strain-hardening effect and hence the more ductile the failures (see Figure 7a). For any given GR content, the addition of PAM further enhanced the strain–hardening failure mode, while simultaneously enhancing the sample’s UCS and stiffness (see Figure 7b). In terms of UCS, the greater the GR content, the higher the UCS up to Rc = 10%, beyond which GR inclusion was found to adversely influence strength development (follow the “Strength Path” in Figure 7a). When treated with PAM, the UCS exhibited the same rise–fall behavior with GR content; however, all treated cases outperformed their untreated counterparts (follow the “Strength Path” in Figure 7b). The natural soil (SP0R0) resulted in qu = 72.28 kPa, while the addition of 5% and 10% GR produced higher values of 91.21 kPa and 98.61 kPa—equivalent to improvements of η = 26% and 36%—respectively. The higher GR contents of 20% and 30% resulted in lower values of qu = 62.28 kPa and 46.61 kPa, respectively; equating to major reductions of 14% and 36% with respect to the natural soil. As a result of PAM-treatment, the aforementioned values increased to 164.47 kPa, 208.94 kPa, 211.09 kPa, 106.18 kPa and 65.15 kPa, respectively. The latter, SP0.2R30, corresponds to a notable 10% UCS reduction with respect to the natural soil, while the former cases, i.e., SP0.2R0, SP0.2R5, SP0.2R10 and SP0.2R30, signify major improvements of 128%, 189%, 192% and 47%, respectively.
Other stress–strain features—the deformability index ID, the elastic stiffness modulus E50, the peak strain energy (or toughness) EU and the resilient modulus ER—are summarized in Table 8. The greater the GR content, the higher the deformability index and the lower the E50 value, with PAM-treated cases generally promoting higher values compared with similar untreated cases. Moreover, the peak strain energy and the resilient modulus both demonstrated trends similar to that observed for the UCS. The greater the GR content, the higher the EU and ER values up to Rc = 10%, beyond which GR inclusion adversely influenced the sample’s toughness and resilience. Moreover, the samples treated with PAM consistently outperformed their untreated counterparts by exhibiting higher EU and ER values. In terms of stiffness, for instance, the samples SP0R0, SP0R5, SP0R10, SP0R20 and SP0R30 resulted in E50 = 1.97 MPa, 1.96 MPa, 1.51 MPa, 0.72 MPa and 0.47 MPa, respectively. When treated with PAM and cured for Tc = 7 d, the aforementioned values increased to 5.27 MPa, 4.54 MPa, 3.26 MPa, 1.25 MPa and 0.66 MPa, respectively.
4.2.3. Effect of PAM + GR on Soil Reactivity
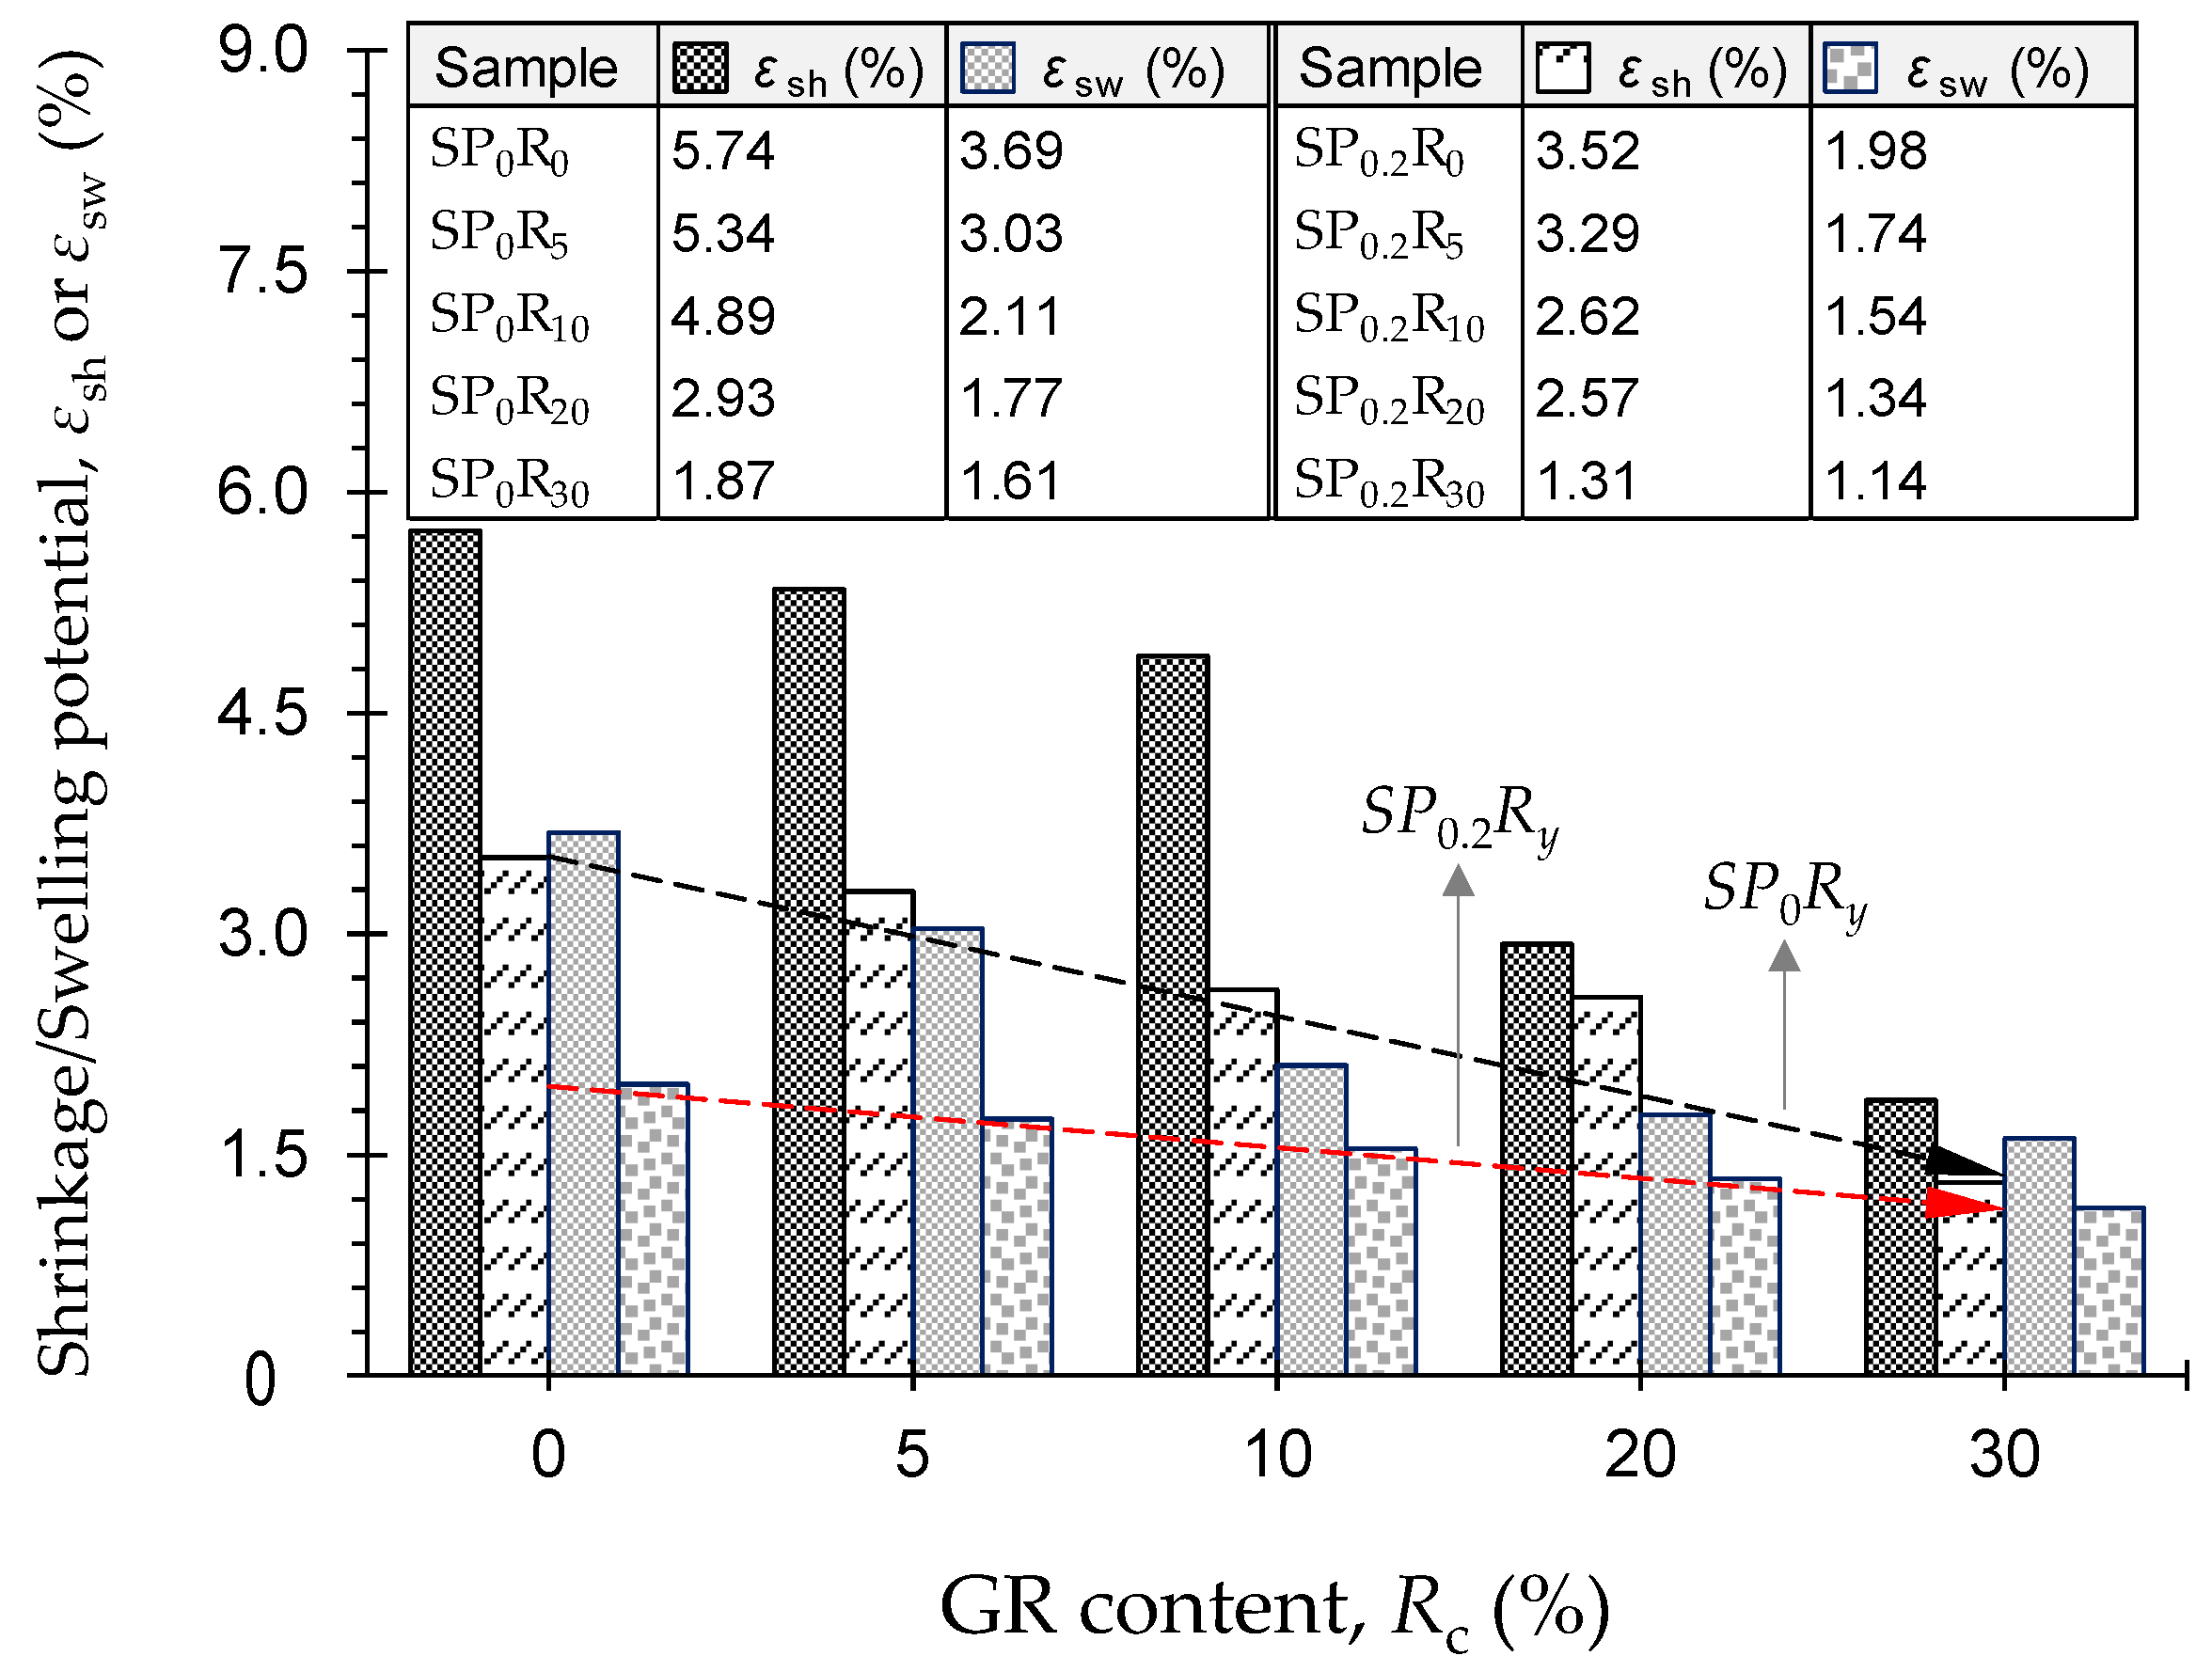
Figure 8 illustrates the variations of shrinkage and swelling potentials, εsh and εsw, against GR content for the natural soil and various GR-blended samples, untreated and treated with 0.2 g/L PAM—SPxRy where x = {0, 0.2}, and y = {0, 5, 10, 20, 30}. The greater the GR content, the lower the shrinkage and swelling potentials, following a monotonically-decreasing trend, with PAM-treated cases achieving a notable advantage over their untreated counterparts (compare the trendlines “SP0Ry” and “SP0.2Ry” in Figure 8). In terms of swelling, for instance, the natural soil (SP0R0) resulted in εsw = 3.69%, while the samples SP0R5, SP0R10, SP0R20 and SP0R30 exhibited lower values of 3.03%, 2.11%, 1.77% and 1.61%, respectively. Similar mix designs treated with PAM led to superior performance, as the aforementioned values dropped to 1.98%, 1.74%, 1.54%, 1.34% and 1.14%, respectively.
The complete results of the soil reactivity tests, including the total suction measurements, are summarized in Table 9. As a result of GR inclusion, the initial (or as-compacted) suction ψo exhibited a notable overall increase, with PAM-treated cases promoting higher values compared with similar untreated cases. The natural soil resulted in ψo = 4.73 pF (where [pF] = 1 + log[kPa]), while the addition of 5%, 10%, 20% and 30% GR produced higher values of 4.75 pF, 4.78 pF, 4.77 pF and 4.76 pF, respectively. When treated with PAM, the aforementioned values further increased to 4.74 pF, 4.77 pF, 4.81 pF, 4.79 pF and 4.77 pF, respectively. Unlike the initial suction, both the shrinkage and swelling suctions, ψsh and ψsw, were inversely-proportional to the GR content; the effect of PAM, however, was directly- and inversely-proportional to ψsh and ψsw, respectively (see Table 9). The natural soil exhibited a total suction change of ∆ψ = ψsh − ψsw = 2.07 pF, which is higher than the standard 1.8 pF value commonly adopted in practice. As a result of GR inclusion, ∆ψ exhibited a notable increasing trend; it was measured as 2.09 pF, 2.09 pF, 2.28 pF and 2.28 pF for Rc = 5%, 10%, 20% and 30%, respectively. Similar mix designs treated with PAM produced higher ∆ψ values of 2.11 pF, 2.11 pF, 2.14 pF, 2.32 pF and 2.30 pF, respectively. These trends can be attributed to the partial replacement of the hydrophilic soil grains with hydrophobic GR particles, as well as the lower molding/as-compacted moisture content of various GR-blended samples compared with that of the natural soil (e.g., see Figure 6a). Moreover, the effect of PAM on total suction, particularly for the as-compacted state, can be ascribed to its particle flocculation capacity, as well as the higher molding dry density (or lower void ratio) of PAM-treated samples compared with similar untreated cases (e.g., see Figure 6b).
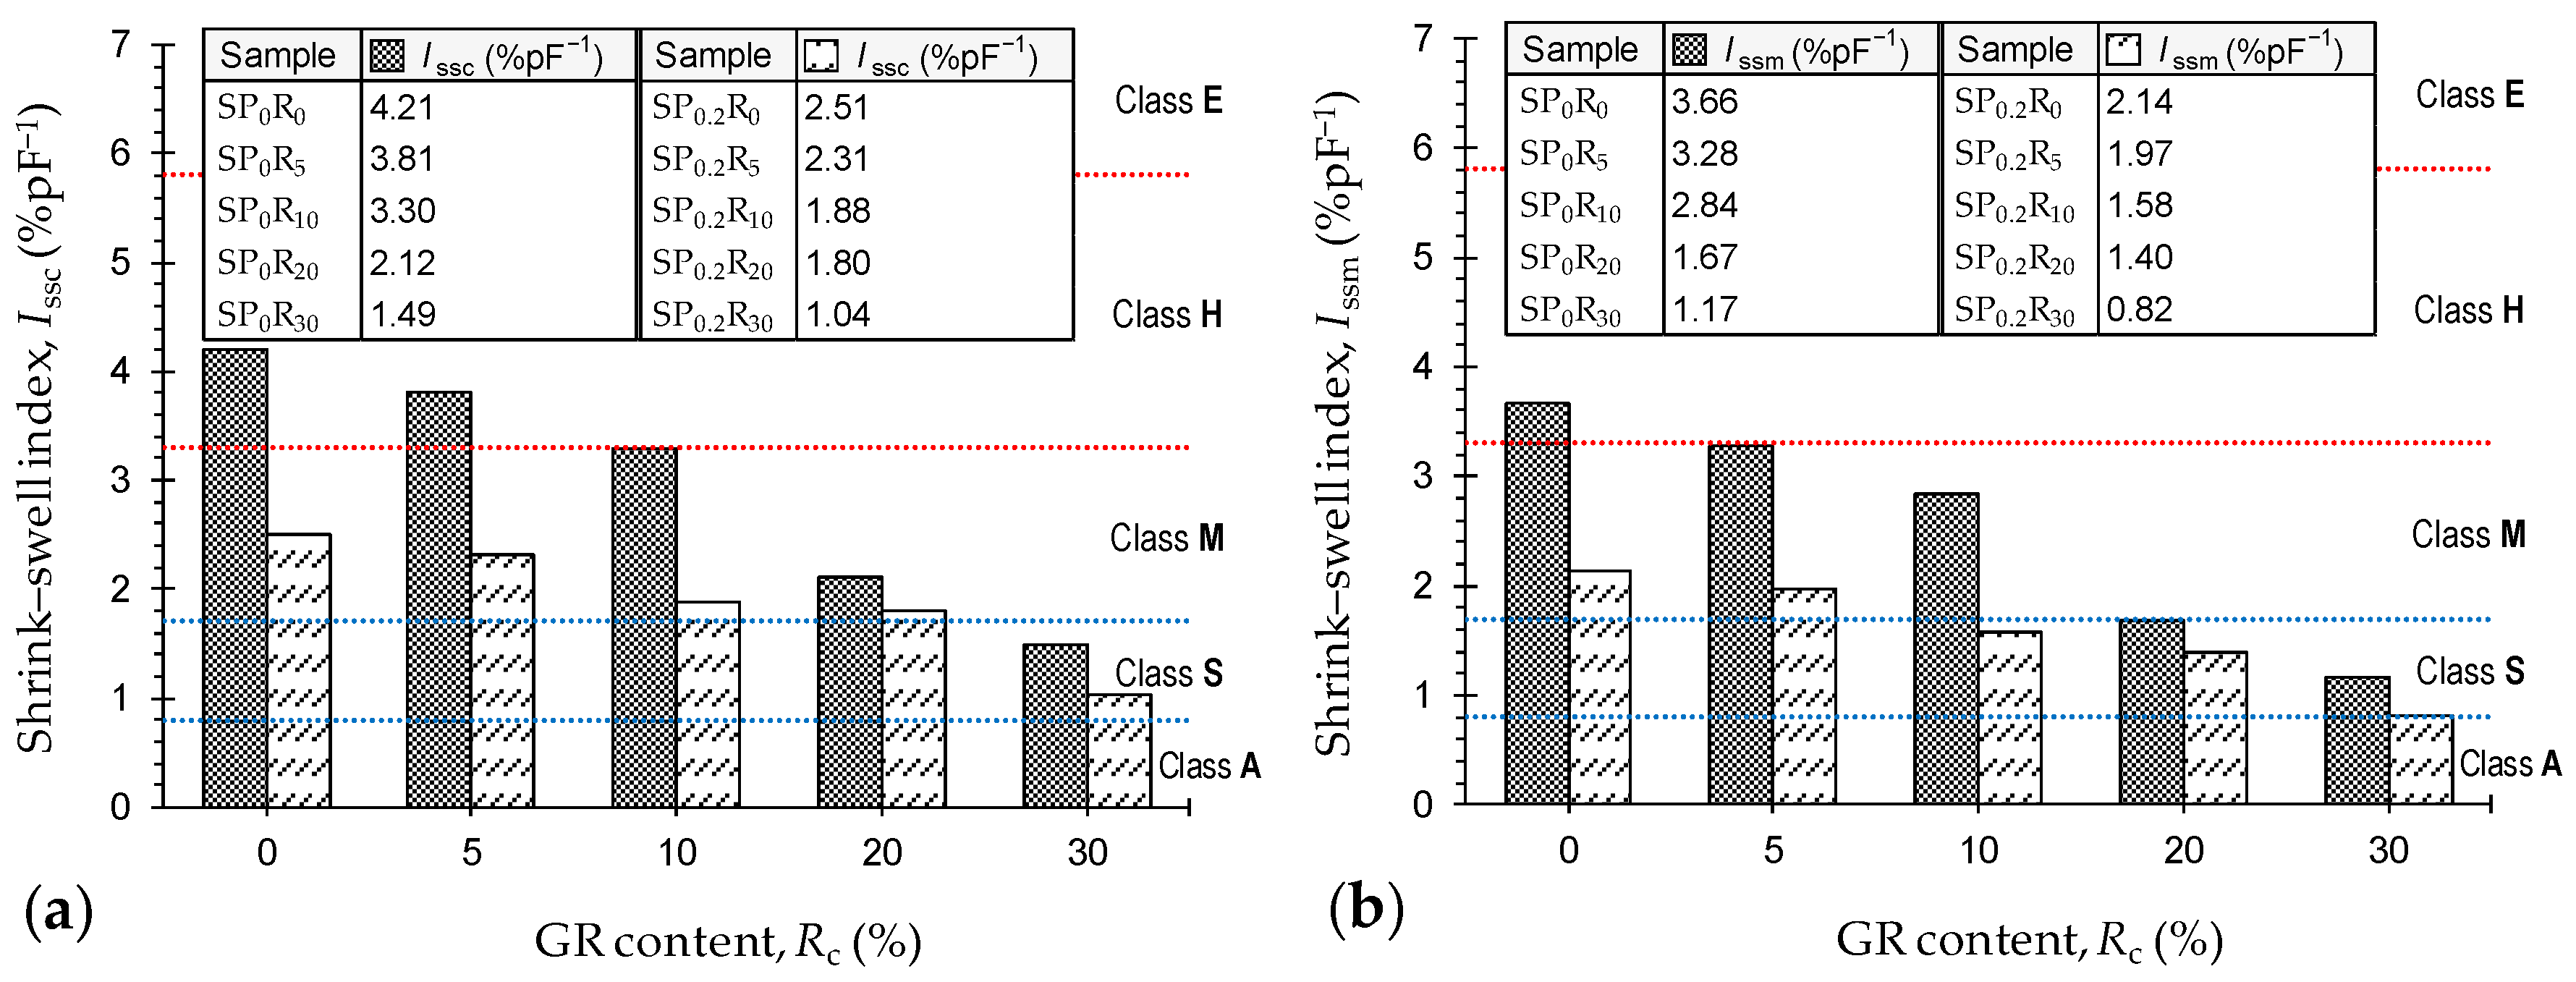
Figure 9a,b illustrate the variations of the conventional and modified shrink–swell indices (Issc and Issm, respectively) against GR content for the tested samples. As is evident from Table 9, the actual total suction change ∆ψ was consistently greater than the standard 1.8 pF value; as such, by definition (see Equation (6)), one can conclude that Issc > Issm. The greater the GR content, the lower the shrink–swell indices, following a monotonically-decreasing trend, with PAM-treated cases outperforming similar untreated cases in terms of their lower shrink–swell indices. As typical cases outlined in Figure 9b, the samples SP0R0, SP0R5, SP0R10, SP0R20 and SP0R30 resulted in Issm = 3.66 %pF−1, 3.28 %pF−1, 2.84 %pF−1, 1.67 %pF−1 and 1.17 %pF−1, respectively. When treated with PAM, the aforementioned values dropped to 2.14 %pF−1, 1.97 %pF−1, 1.58 %pF−1, 1.40 %pF−1 and 0.82 %pF−1, respectively.
As demonstrated in Table A2, the shrink–swell index can be used to specify the soil degree of expansivity [59]—corresponding classifications based on the Issc and Issm indices are outlined in Figure 9a,b, respectively. The samples SP0R0, SP0R5, SP0R10, SP0R20 and SP0R30 were classified as H, H, H–M, M and S based on the Issc index, while consideration of the Issm index for the same samples resulted in improved classifications of H, M, M, S and S, respectively (where H = highly expansive, M = moderately expansive, and S = slightly expansive). As a result of PAM-treatment, the aforementioned classifications were either improved or maintained—M, M, M, M and S based on the Issc, and M, M, S, S and S based on the Issm. As it stands, the conventional shrink–swell index, computed based on ∆ψ = 1.8 pF, tends to overestimate the expansive potential of the test soil and various soil–GR blends, and thus can be deemed as a conservative approach [60]. The modified index, however, offers a more progressive and hence sustainable classification scheme.
4.3. Amending Mechanisms
Polymers, for the most part, alter the soil fabric through clay–polymer interactions [51]. Cationic polymers are readily adsorbed onto the negatively-charged clay particle surfaces through Coulombic (or electrostatic) attraction; this process induces localized charge reversal on each clay particle, thereby allowing localized areas with opposite charge between different clay particles to interact and form flocs [67,68]. Neutral (non-ionic) polymers, on the other hand, achieve adsorption through van der Waals and/or hydrogen bonding [67,68,69]. Although clay particles tend to repel anionic polymers due to charge repulsion, which would be the case for the anionic PAM used in this study, attraction can still be achieved through exchangeable, divalent cations in the clay–water medium, e.g., calcium (Ca2+) and magnesium (Mg2+), which act as so-called “bridges” between the polymer and the clay particle surfaces [53,67,70,71]. The development and propagation of these strong cationic bridges between adjacent clay particle surfaces in the matrix lead to a decrease in the thickness of the diffused double layers, which in turn induced aggregation and flocculation of the clay particles and hence favored an enhanced strength performance coupled with a reduced tendency for swell–shrink volume changes. It should be noted that the maximum strength benefits of flocculation are often achieved when polymers, and anionic PAMs in particular, cover a surface area equivalent to half the polymer’s saturation capacity [72]. An increase in polymer concentration beyond this level causes the excess polymer material to act as a lubricant rather than a flocculant; this feature facilitates the sliding of soil aggregates across each other, and thus may adversely influence certain mechanical attributes, such as the stress–strain–strength response. This mechanism elucidates the observed reduction in the UCS (see Table 7), as well as the minor variations noted in the consistency limits (see Table 4) and the sediment volume features (see Table 5), for PAM concentrations greater than 0.2 g/L.
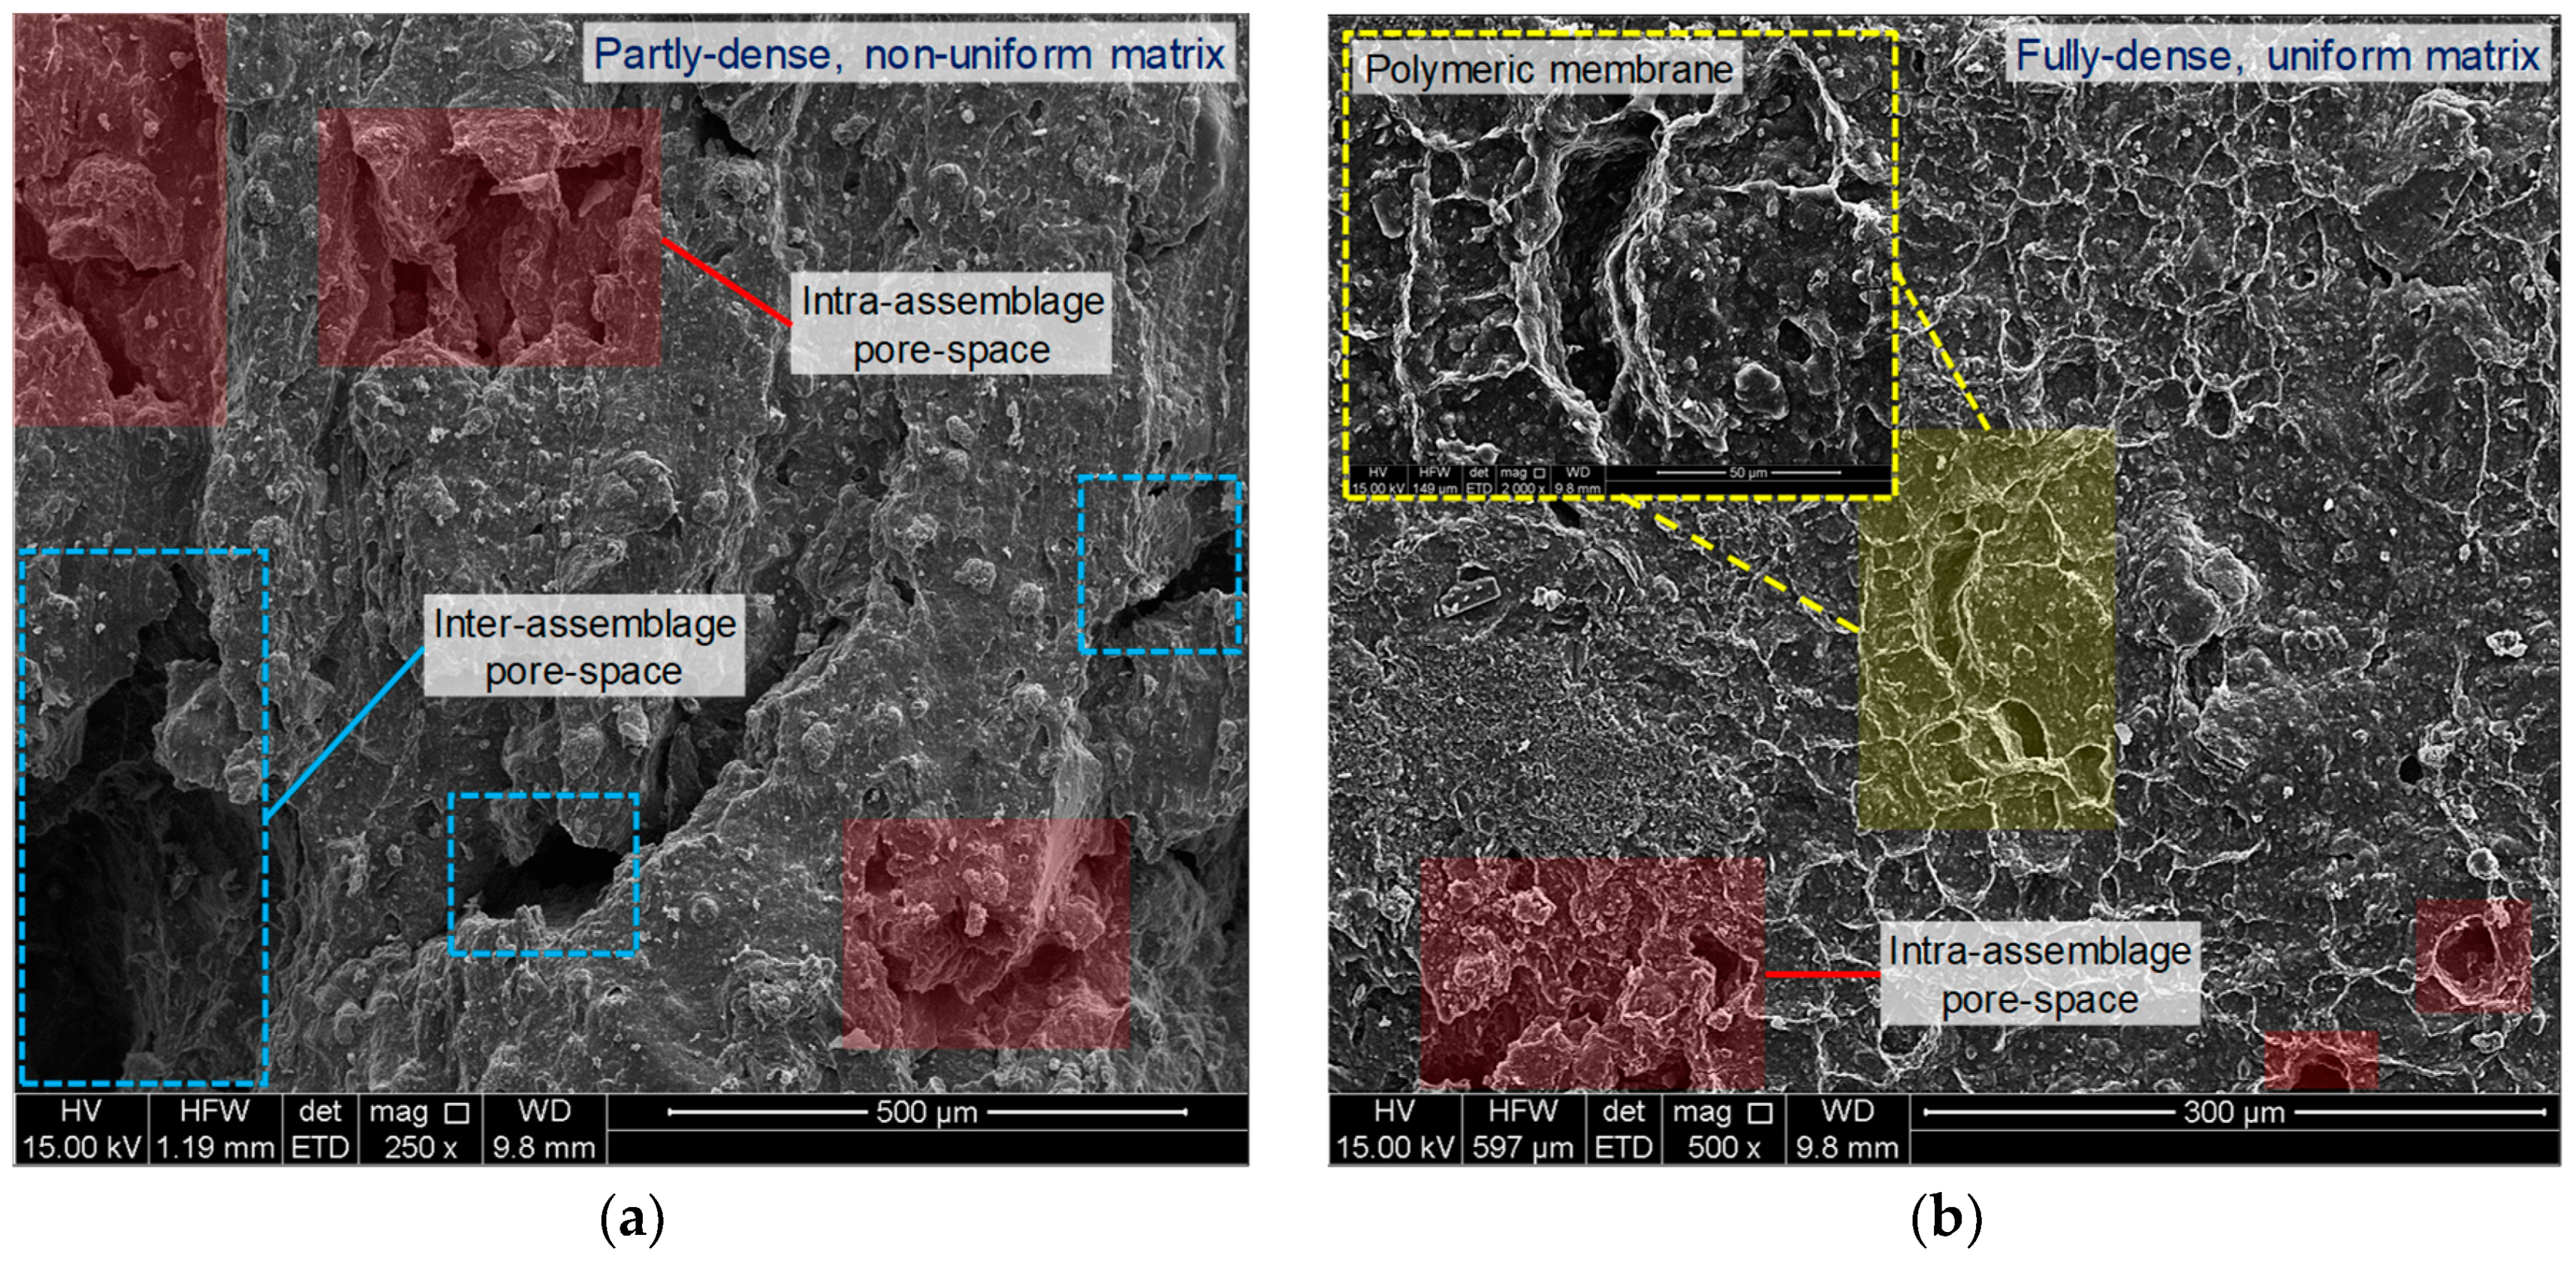
Figure 10a,b illustrate typical SEM micrographs for the natural soil (SP0R0) and the sample treated with 0.2 g/L PAM (SP0.2R0), respectively. The microfabric of the natural soil sample, as outlined in Figure 10a, showed a partly-dense, non-uniform matrix. Moreover, a notable number of large inter- and intra-assemblage pore-spaces developed between and within the soil aggregates, respectively, were found to dominate the soil matrix; these pore-spaces facilitate the entrance of water into the sample during swelling [3]. As a result of PAM-treatment (see Figure 10b), the microfabric became more uniform in nature, signifying aggregation and flocculation of the clay particles (owing to the cationic bridging mechanism), and thus the development of a fully-dense matrix with a dominant edge-to-face flocculated fabric. Polymeric membranes were also clearly visible between and within the soil aggregates, which play a major role in reducing the number and extent of the inter- and intra-assemblage pore-spaces, thereby favoring significant improvements in the soil’s UCS and volume change behaviors.
Much like fiber-reinforced soils, the GR inclusions are able to alter the soil fabric through improvements achieved in three aspects: (i) increase in non-expansive content; (ii) frictional resistance generated at soil aggregate–GR interfaces; and (iii) mechanical interlocking of soil and GR particles [1,3,4,26,33,34]. The swell–shrink capacity is primarily a function of the soil’s expansive clay content. An increase in GR content substitutes a larger portion of the expansive clay content with non-plastic, hydrophobic rubber particles, thereby leading to a further decrease in the swell–shrink capacity (see Table 9). The generated interfacial frictional resistance is a function of the soil aggregate–GR contact area, with greater contact levels offering a higher shear resistance against external forces. The greater the number of included GR particles (i.e., increase in GR content), the greater the contact levels achieved between the GR particles and soil aggregates, and thus the higher the developed frictional resistance against compression and swell–shrink movements. The mechanical interlocking of soil aggregates and GR particles is achieved during sample preparation (or compaction); it may induce sample adhesion by immobilizing the soil aggregates undergoing shearing, swelling and shrinkage. Quite clearly, the more pronounced the achieved mechanical interlocking, the higher the resistance against compression and swell–shrink movements. As such, this amending mechanism can also be ascribed to the GR content—the greater the GR content, the greater the number of potentially interlocked soil aggregates, and thus the higher the developed resistance against compression, swelling and shrinkage. In practice, however, the latter two amending mechanisms, interfacial frictional resistance and mechanical interlocking, only hold provided that the GR particles are well distributed in the soil medium—meaning that the GR particles do not cluster during compaction [1,27,36]. At high GR contents, the behavior at some points within the blended sample could be governed by a dominant GR-to-GR interaction; this effect, referred to as rubber-clustering, promotes a notable improvement in the sample’s ductility/deformability while offsetting the desired soil-to-GR interaction capable of enhancing its UCS (follow the “Strength Path” in Figure 7a). Such adverse effects were evident for all samples containing 20% and 30% GR, as the previously-improved UCS dropped below that of the natural soil (e.g., compare the samples “SP0R10” and “SP0R20” in Figure 7a). When treated with PAM, the soil aggregate–GR connection interface can be further improved, as PAM facilitates the embedment of GR particles between the flocculated soil aggregates with increased efficiency; this leads to further improvements in the sample’s UCS and swell–shrink capacity (see Figure 7b and Table 9).
5. Concluding Remarks
The present study has arrived at the following conclusions.
- The greater the PAM concentration, the higher the consistency limits and the lower the FSR up to 0.2 g/L PAM, beyond which the effect of PAM-treatment was found to be marginal. Hence, the optimum PAM concentration for particle flocculation was achieved at 0.2 g/L PAM.
- The greater the PAM concentration, the higher the maximum dry density, while the variations in optimum moisture content were rather marginal. An increase in pore-fluid viscosity, as is the case with PAM-treated blends, induces contact lubrication in the soil matrix. During compaction, this feature facilitates reduced overall resistance to the movement and sliding of soil particles relative to each other, thereby allowing a closer packing of the soil particles and hence the development of a higher maximum dry density.
- Further, the greater the PAM concentration, the higher the developed UCS, stiffness and toughness up to 0.2 g/L PAM, beyond which PAM-treatment was found to adversely influence these properties. An increase in PAM beyond 0.2 g/L, the optimum concentration, caused the excess PAM to act as a lubricant rather than a flocculant. During compression, this feature facilitated easier sliding of the soil particles relative to each other, thereby adversely influencing the previously-improved stress–strain–strength response.
- As a result of GR inclusion, both the maximum dry density and the optimum moisture content exhibited a linear, monotonically-decreasing trend with increasing GR content. The reduction in the maximum dry density, in particular, advocates the use of GR as a sustainable, lightweight alternative for common quarried fill materials, such as sands and aggregates.
- Further, the greater the GR content, the higher the developed UCS and toughness up to 10% GR, beyond which the dominant GR-to-GR interaction (i.e., rubber-clustering) adversely influenced the blended samples’ UCS and toughness. The sample stiffness, however, exhibited a monotonically-decreasing trend with GR content. Moreover, reduction in the swell–shrink capacity, and thus the degree of expansivity/reactivity, was consistently in favor of higher GR contents.
- The addition of PAM to the GR-blended samples enhanced the soil aggregate–GR connection interface, thereby producing further improvements in the samples’ compactability, stress–strain–strength response and swell–shrink capacity. A maximum GR content of 20%, paired with 0.2 g/L PAM, managed to satisfy a major decrease in the swell–shrink capacity while improving the strength-related features, and thus was deemed as the optimum choice.
Author Contributions
Conceptualization, A.S., A.D. and A.T.; Methodology, A.S., A.D., A.T. and B.C.O.; Validation, A.S. and B.C.O.; Formal analysis, A.S.; Investigation, A.S.; Writing—original draft preparation, A.S.; Writing—review and editing, A.D., A.T. and B.C.O.; Visualization, A.S.; Supervision, A.D., A.T. and B.C.O.; Funding acquisition, A.D. and A.T.
Funding
This research was funded by the Australian Research Council (ARC) by way of Project No. DP140103004; this support is gratefully acknowledged.
Acknowledgments
This research was made possible through the provision of an Australian Government Research Training Program Scholarship; this support is gratefully acknowledged.
Conflicts of Interest
The authors declare no conflicts of interest.
Abbreviations
The following abbreviations are used in this manuscript.
| A | Non-expansive |
| AMD | Acrylamide |
| AS | Australian standard |
| ASTM | American Society for Testing and Materials |
| CH | Clay with high plasticity |
| E | Extremely expansive |
| FSR | Free swell ratio |
| GR | Ground rubber |
| H | Highly expansive |
| M | Moderately expansive |
| PAM | Polyacrylamide |
| S | Slightly expansive |
| SEM | Scanning electron microscopy |
| SP | Poorly-graded sand |
| UCS | Unconfined compressive strength |
| USCS | Unified Soil Classification System |
| ZAV | Zero-air void |
Appendix A
Figure A1 shows a photograph of the anionic PAM, in its granular form, used in the present investigation.
Figure A1.
Anionic PAM in its granular form.

Classification procedures for expansive soils based on the FSR, as proposed by Prakash and Sridharan [50], are summarized in Table A1.

Table A1.
Classification procedures for expansive soils based on the FSR [50].
Table A1.
Classification procedures for expansive soils based on the FSR [50].
| FSR 1 | Degree of Expansivity | Dominant Clay Mineral |
|---|---|---|
| ≤1 | Negligible | Kaolinite |
| 1–1.5 | Low | Kaolinite and Montmorillonite |
| 1.5–2 | Moderate | Montmorillonite |
| 2–4 | High | Montmorillonite |
| >4 | Very High | Montmorillonite |
1 Ratio of equilibrium sediment volume of 10 g oven-dried soil, passing 425 μm sieve, in distilled water to that of kerosene.
Classification procedures for expansive soils based on the shrink–swell index Iss, as suggested by Seddon [59], are summarized in Table A2.
Table A2.
Classification procedures for expansive soils based on the shrink–swell index Iss [59].
Table A2.
Classification procedures for expansive soils based on the shrink–swell index Iss [59].
| Iss (%pF−1) 1 | Degree of Expansivity | ys (mm) 2 | Site Classification (AS 2870–11) |
|---|---|---|---|
| <0.8 | Non-Expansive | < 10 | Class A |
| 0.8–1.7 | Slightly Expansive | 10–20 | Class S |
| 1.7–3.3 | Moderately Expansive | 20–40 | Class M |
| 3.3–5.8 | Highly Expansive | 40–70 | Class H |
| >5.8 | Extremely Expansive | > 70 | Class E |
1 Shrink–swell index, obtained by Equation (6); and 2 Free ground surface movement.
References
- Soltani, A.; Taheri, A.; Deng, A.; Nikraz, H. Tyre rubber and expansive soils: Two hazards, one solution. Proc. Inst. Civ. Eng. Constr. Mater. 2019. [Google Scholar] [CrossRef]
- Jones, L.D.; Jefferson, I. Expansive soils. In ICE Manual of Geotechnical Engineering: Volume I; Burland, J., Chapman, T., Brown, M., Skinner, H., Eds.; ICE Publishing: London, UK, 2012; pp. 413–441. ISBN 9780727757081. [Google Scholar]
- Soltani, A.; Deng, A.; Taheri, A.; Mirzababaei, M.; Vanapalli, S.K. Swell–shrink behavior of rubberized expansive clays during alternate wetting and drying. Minerals 2019, 9, 224. [Google Scholar] [CrossRef]
- Soltani, A.; Deng, A.; Taheri, A.; Mirzababaei, M. Rubber powder–polymer combined stabilization of South Australian expansive soils. Geosynth. Int. 2018, 25, 304–321. [Google Scholar] [CrossRef]
- Winterkorn, H.F.; Pamukcu, S. Soil stabilization and grouting. In Foundation Engineering Handbook, 2nd ed.; Fang, H.Y., Ed.; Springer: Boston, MA, USA, 1991; pp. 317–378. ISBN 9781461539285. [Google Scholar] [CrossRef]
- Soltani, A.; Taheri, A.; Khatibi, M.; Estabragh, A.R. Swelling potential of a stabilized expansive soil: A comparative experimental study. Geotech. Geol. Eng. 2017, 35, 1717–1744. [Google Scholar] [CrossRef]
- Al-Omari, R.R.; Hamodi, F.J. Swelling resistant geogrid—A new approach for the treatment of expansive soils. Geotext. Geomembranes 1991, 10, 295–317. [Google Scholar] [CrossRef]
- Tang, C.S.; Shi, B.; Zhao, L.Z. Interfacial shear strength of fiber reinforced soil. Geotext. Geomembranes 2010, 28, 54–62. [Google Scholar] [CrossRef]
- Mirzababaei, M.; Miraftab, M.; Mohamed, M.; McMahon, P. Unconfined compression strength of reinforced clays with carpet waste fibers. J. Geotech. Geoenviron. Eng. 2013, 139, 483–493. [Google Scholar] [CrossRef]
- Estabragh, A.R.; Rafatjo, H.; Javadi, A.A. Treatment of an expansive soil by mechanical and chemical techniques. Geosynth. Int. 2014, 21, 233–243. [Google Scholar] [CrossRef]
- Phanikumar, B.R.; Singla, R. Swell–consolidation characteristics of fibre-reinforced expansive soils. Soils Found. 2016, 56, 138–143. [Google Scholar] [CrossRef]
- Wang, Y.X.; Guo, P.P.; Ren, W.X.; Yuan, B.X.; Yuan, H.P.; Zhao, Y.L.; Shan, S.B.; Cao, P. Laboratory investigation on strength characteristics of expansive soil treated with jute fiber reinforcement. Int. J. Geomech. 2017, 17, 04017101:1–04017101:12. [Google Scholar] [CrossRef]
- Soltani, A.; Deng, A.; Taheri, A. Swell‒compression characteristics of a fiber-reinforced expansive soil. Geotext. Geomembranes 2018, 46, 183–189. [Google Scholar] [CrossRef]
- Miller, G.A.; Azad, S. Influence of soil type on stabilization with cement kiln dust. Constr. Build. Mater. 2000, 14, 89–97. [Google Scholar] [CrossRef]
- Dash, S.K.; Hussain, M. Lime stabilization of soils: Reappraisal. J. Mater. Civ. Eng. 2012, 24, 707–714. [Google Scholar] [CrossRef]
- Estabragh, A.R.; Pereshkafti, M.R.S.; Parsaei, B.; Javadi, A.A. Stabilised expansive soil behaviour during wetting and drying. Int. J. Pavement Eng. 2013, 14, 418–427. [Google Scholar] [CrossRef]
- Keramatikerman, M.; Chegenizadeh, A.; Nikraz, H. Effect of GGBFS and lime binders on the engineering properties of clay. Appl. Clay Sci. 2016, 132–133, 722–730. [Google Scholar] [CrossRef]
- Sharma, A.K.; Sivapullaiah, P.V. Ground granulated blast furnace slag amended fly ash as an expansive soil stabilizer. Soils Found. 2016, 56, 205–212. [Google Scholar] [CrossRef]
- Zhao, Y.; Soltani, A.; Taheri, A.; Karakus, M.; Deng, A. Application of slag–cement and fly ash for strength development in cemented paste backfills. Minerals 2019, 9, 22. [Google Scholar] [CrossRef]
- Estabragh, A.R.; Namdar, P.; Javadi, A.A. Behavior of cement-stabilized clay reinforced with nylon fiber. Geosynth. Int. 2012, 19, 85–92. [Google Scholar] [CrossRef]
- Olgun, M. The effects and optimization of additives for expansive clays under freeze–thaw conditions. Cold Reg. Sci. Technol. 2013, 93, 36–46. [Google Scholar] [CrossRef]
- Shahbazi, M.; Rowshanzamir, M.; Abtahi, S.M.; Hejazi, S.M. Optimization of carpet waste fibers and steel slag particles to reinforce expansive soil using response surface methodology. Appl. Clay Sci. 2017, 142, 185–192. [Google Scholar] [CrossRef]
- Mirzababaei, M.; Arulrajah, A.; Horpibulsuk, S.; Soltani, A.; Khayat, N. Stabilization of soft clay using short fibers and poly vinyl alcohol. Geotext. Geomembr. 2018, 46, 646–655. [Google Scholar] [CrossRef]
- Zhang, J.; Soltani, A.; Deng, A.; Jaksa, M.B. Mechanical performance of jute fiber-reinforced micaceous clay composites treated with ground-granulated blast-furnace slag. Materials 2019, 12, 576. [Google Scholar] [CrossRef]
- Li, J.; Saberian, M.; Nguyen, B.T. Effect of crumb rubber on the mechanical properties of crushed recycled pavement materials. J. Environ. Manag. 2018, 218, 291–299. [Google Scholar] [CrossRef] [PubMed]
- Yadav, J.S.; Tiwari, S.K. Effect of waste rubber fibres on the geotechnical properties of clay stabilized with cement. Appl. Clay Sci. 2017, 149, 97–110. [Google Scholar] [CrossRef]
- Soltani, A.; Deng, A.; Taheri, A.; Mirzababaei, M.; Nikraz, H. Interfacial shear strength of rubber-reinforced clays: A dimensional analysis perspective. Geosynth. Int. 2019, 26, 164–183. [Google Scholar] [CrossRef]
- Edil, T.; Bosscher, P. Engineering properties of tire chips and soil mixtures. Geotech. Test. J. 1994, 17, 453–464. [Google Scholar] [CrossRef]
- Foose, G.J.; Benson, C.H.; Bosscher, P.J. Sand reinforced with shredded waste tires. J. Geotech. Eng. 1996, 122, 760–767. [Google Scholar] [CrossRef]
- Al-Tabbaa, A.; Blackwell, O.; Porter, S.A. An investigation into the geotechnical properties of soil–tyre mixtures. Environ. Technol. 1997, 18, 855–860. [Google Scholar] [CrossRef]
- Lee, J.H.; Salgado, R.; Bernal, A.; Lovell, C.W. Shredded tires and rubber sand as lightweight backfill. J. Geotech. Geoenviron. Eng. 1999, 125, 132–141. [Google Scholar] [CrossRef]
- Zornberg, J.G.; Cabral, A.R.; Viratjandr, C. Behaviour of tire shred–sand mixtures. Can. Geotech. J. 2004, 41, 227–241. [Google Scholar] [CrossRef]
- Patil, U.; Valdes, J.R.; Evans, T.M. Swell mitigation with granulated tire rubber. J. Mater. Civ. Eng. 2011, 23, 721–727. [Google Scholar] [CrossRef]
- Trouzine, H.; Bekhiti, M.; Asroun, A. Effects of scrap tyre rubber fibre on swelling behaviour of two clayey soils in Algeria. Geosynth. Int. 2012, 19, 124–132. [Google Scholar] [CrossRef]
- Kalkan, E. Preparation of scrap tire rubber fiber–silica fume mixtures for modification of clayey soils. Appl. Clay Sci. 2013, 80–81, 117–125. [Google Scholar] [CrossRef]
- Cabalar, A.F.; Karabash, Z.; Mustafa, W.S. Stabilising a clay using tyre buffings and lime. Road Mater. Pavement Des. 2014, 15, 872–891. [Google Scholar] [CrossRef]
- Signes, C.H.; Garzón-Roca, J.; Fernández, P.M.; Torre, M.E.G.; Franco, R.I. Swelling potential reduction of Spanish argillaceous marlstone Facies Tap soil through the addition of crumb rubber particles from scrap tyres. Appl. Clay Sci. 2016, 132–133, 768–773. [Google Scholar] [CrossRef]
- Soltani, A.; Deng, A.; Taheri, A.; Sridharan, A. Swell–shrink–consolidation behavior of rubber-reinforced expansive soils. Geotech. Test. J. 2019, 42, 761–788. [Google Scholar] [CrossRef]
- Inyang, H.I.; Bae, S.; Mbamalu, G.; Park, S. Aqueous polymer effects on volumetric swelling of Na–montmorillonite. J. Mater. Civ. Eng. 2007, 19, 84–90. [Google Scholar] [CrossRef]
- Kim, S.; Palomino, A.M. Polyacrylamide-treated kaolin: A fabric study. Appl. Clay Sci. 2009, 45, 270–279. [Google Scholar] [CrossRef]
- Mirzababaei, M.; Yasrobi, S.S.; Al-Rawas, A.A. Effect of polymers on swelling potential of expansive soils. Proc. Inst. Civ. Eng. Ground Improv. 2009, 162, 111–119. [Google Scholar] [CrossRef]
- Yazdandoust, F.; Yasrobi, S.S. Effect of cyclic wetting and drying on swelling behavior of polymer-stabilized expansive clays. Appl. Clay Sci. 2010, 50, 461–468. [Google Scholar] [CrossRef]
- Iyengar, S.R.; Masad, E.; Rodriguez, A.K.; Bazzi, H.S.; Little, D.; Hanley, H.J.M. Pavement subgrade stabilization using polymers: Characterization and performance. J. Mater. Civ. Eng. 2013, 25, 472–483. [Google Scholar] [CrossRef]
- Onyejekwe, S.; Ghataora, G.S. Soil stabilization using proprietary liquid chemical stabilizers: Sulphonated oil and a polymer. Bull. Eng. Geol. Environ. 2015, 74, 651–665. [Google Scholar] [CrossRef]
- Georgees, R.N.; Hassan, R.A.; Evans, R.P. A potential use of a hydrophilic polymeric material to enhance durability properties of pavement materials. Constr. Build. Mater. 2017, 148, 686–695. [Google Scholar] [CrossRef]
- Bian, X.; Zeng, L.; Deng, Y.; Li, X. The role of superabsorbent polymer on strength and microstructure development in cemented dredged clay with high water content. Polymers 2018, 10, 1069. [Google Scholar] [CrossRef] [PubMed]
- Soltani-Jigheh, H.; Bagheri, M.; Amani-Ghadim, A.R. Use of hydrophilic polymeric stabilizer to improve strength and durability of fine-grained soils. Cold Reg. Sci. Technol. 2019, 157, 187–195. [Google Scholar] [CrossRef]
- Soltani, A.; Deng, A.; Taheri, A.; Mirzababaei, M. A sulphonated oil for stabilisation of expansive soils. Int. J. Pavement Eng. 2019, 20, 1285–1298. [Google Scholar] [CrossRef]
- Sridharan, A.; Nagaraj, H.B.; Prakash, K. Determination of the plasticity index from flow index. Geotech. Test. J. 1999, 22, 175–181. [Google Scholar] [CrossRef]
- Prakash, K.; Sridharan, A. Free swell ratio and clay mineralogy of fine-grained soils. Geotech. Test. J. 2004, 27, 220–225. [Google Scholar] [CrossRef]
- Seybold, C.A. Polyacrylamide review: Soil conditioning and environmental fate. Commun. Soil Sci. Plant Anal. 1994, 25, 2171–2185. [Google Scholar] [CrossRef]
- Barvenik, F.W. Polyacrylamide characteristics related to soil applications. Soil Sci. 1994, 158, 235–243. [Google Scholar] [CrossRef]
- Lu, J.H.; Wu, L.; Letey, J. Effects of soil and water properties on anionic polyacrylamide sorption. Soil Sci. Soc. Am. J. 2002, 66, 578–584. [Google Scholar] [CrossRef]
- Graber, E.R.; Fine, P.; Levy, G.J. Soil stabilization in semiarid and arid land agriculture. J. Mater. Civ. Eng. 2006, 18, 190–205. [Google Scholar] [CrossRef]
- Orts, W.J.; Sojka, R.E.; Glenn, G.M.; Gross, R.A. Preventing soil erosion with polymer additives. Polym. News 1999, 24, 406–413. [Google Scholar]
- Orts, W.J.; Roa-Espinosa, A.; Sojka, R.E.; Glenn, G.M.; Imam, S.H.; Erlacher, K.; Pedersen, J.S. Use of synthetic polymers and biopolymers for soil stabilization in agricultural, construction, and military applications. J. Mater. Civ. Eng. 2007, 19, 58–66. [Google Scholar] [CrossRef]
- Soltani, A.; Deng, A.; Taheri, A.; Sridharan, A. Consistency limits and compaction characteristics of clay soils containing rubber waste. Proc. Inst. Civ. Eng. Geotech. Eng. 2019, 172, 174–188. [Google Scholar] [CrossRef] [Green Version]
- Fityus, S.G.; Cameron, D.A.; Walsh, P.F. The shrink swell test. Geotech. Test. J. 2005, 28, 92–101. [Google Scholar] [CrossRef]
- Seddon, K.D. Reactive soils. In Proceedings of the Seminar on Engineering Geology of Melbourne; Peck, W.A., Neilson, J.L., Olds, R.J., Seddon, K.D., Eds.; A.A. Balkema: Melbourne, VIC, Australia, 1992; pp. 33–37. [Google Scholar]
- Zou, J. Assessment of the Reactivity of Expansive Soil in Melbourne Metropolitan Area. Master’s Thesis, RMIT University, Melbourne, VIC, Australia, 2015. Available online: https://researchbank.rmit.edu.au/eserv/rmit:161578/Zou.pdf (accessed on 23 June 2019).
- Soltani, A.; Estabragh, A.R.; Taheri, A.; Deng, A.; Meegoda, J.N. Experiments and dimensional analysis of contaminated clay soils. Environ. Geotech. 2018. [Google Scholar] [CrossRef]
- Mitchell, J.K.; Soga, K. Fundamentals of Soil Behavior, 3rd ed.; John Wiley & Sons: Hoboken, NJ, USA, 2005; ISBN 9780471463023. [Google Scholar]
- Park, S.S. Unconfined compressive strength and ductility of fiber-reinforced cemented sand. Constr. Build. Mater. 2011, 25, 1134–1138. [Google Scholar] [CrossRef]
- Thompson, M.R. Mechanistic Design Concepts for Stabilized Base Pavements, Technical Report UILU-ENG-86-2008; University of Illinois at Urbana-Champaign: Urbana, IL, USA, 1986. [Google Scholar]
- Maher, M.H.; Ho, Y.C. Mechanical properties of kaolinite/fiber soil composite. J. Geotech. Eng. 1994, 120, 1381–1393. [Google Scholar] [CrossRef]
- Radovic, M.; Lara-Curzio, E.; Riester, L. Comparison of different experimental techniques for determination of elastic properties of solids. Mater. Sci. Eng. A 2004, 368, 56–70. [Google Scholar] [CrossRef]
- Theng, B.K.G. Clay–polymer interactions: Summary and perspectives. Clays Clay Miner. 1982, 30, 1–10. [Google Scholar] [CrossRef]
- Ben-Hur, M.; Malik, M.; Letey, J.; Mingelgrin, U. Adsorption of polymers on clays as affected by clay charge and structure, polymers properties, and water quality. Soil Sci. 1992, 153, 349–356. [Google Scholar] [CrossRef]
- Greenland, D.J. Adsorption of polyvinyl alcohols by montmorillonite. J. Colloid Sci. 1963, 18, 647–664. [Google Scholar] [CrossRef]
- Letey, J. Adsorption and desorption of polymers on soil. Soil Sci. 1994, 158, 244–248. [Google Scholar] [CrossRef]
- Laird, D.A. Bonding between polyacrylamide and clay mineral surfaces. Soil Sci. 1997, 162, 826–832. [Google Scholar] [CrossRef]
- Luckham, P.F.; Rossi, S. The colloidal and rheological properties of bentonite suspensions. Adv. Colloid Interface Sci. 1999, 82, 43–92. [Google Scholar] [CrossRef] [Green Version]
Figure 1.
GR material at various magnification ratios: (a) 1× magnification; (b) 50× magnification (via optical microscopy); and (c) 250× magnification (via SEM).
Figure 1.
GR material at various magnification ratios: (a) 1× magnification; (b) 50× magnification (via optical microscopy); and (c) 250× magnification (via SEM).


Figure 3.
Flow curves for the natural soil (SP0R0) and the sample treated with 0.6 g/L PAM (SP0.6R0).
Figure 3.
Flow curves for the natural soil (SP0R0) and the sample treated with 0.6 g/L PAM (SP0.6R0).

Figure 4.
Standard Proctor compaction curves for the natural soil (SP0R0) and the sample treated with 0.6 g/L PAM (SP0.6R0).
Figure 4.
Standard Proctor compaction curves for the natural soil (SP0R0) and the sample treated with 0.6 g/L PAM (SP0.6R0).

Figure 5.
Stress–strain curves for the natural soil and various PAM-treated samples: (a) SPxR0, at Tc = 1 d, where x = {0, 0.1, 0.2, 0.4, 0.6}; and (b) SP0.2R0 at Tc = 1, 4, 7 and 14 d.
Figure 5.
Stress–strain curves for the natural soil and various PAM-treated samples: (a) SPxR0, at Tc = 1 d, where x = {0, 0.1, 0.2, 0.4, 0.6}; and (b) SP0.2R0 at Tc = 1, 4, 7 and 14 d.

Figure 6.
Standard Proctor compaction curves for the natural soil and various GR-blended samples: (a) Untreated—SP0Ry where y = {0, 5, 10, 20, 30}; and (b) Treated with 0.2 g/L PAM—SP0.2Ry where y = {0, 5, 10, 20, 30}.
Figure 6.
Standard Proctor compaction curves for the natural soil and various GR-blended samples: (a) Untreated—SP0Ry where y = {0, 5, 10, 20, 30}; and (b) Treated with 0.2 g/L PAM—SP0.2Ry where y = {0, 5, 10, 20, 30}.

Figure 7.
Stress–strain curves for the natural soil and various GR-blended samples: (a) Untreated—SP0Ry where y = {0, 5, 10, 20, 30}; and (b) Treated with 0.2 g/L PAM at Tc = 7 d—SP0.2Ry where y = {0, 5, 10, 20, 30}.
Figure 7.
Stress–strain curves for the natural soil and various GR-blended samples: (a) Untreated—SP0Ry where y = {0, 5, 10, 20, 30}; and (b) Treated with 0.2 g/L PAM at Tc = 7 d—SP0.2Ry where y = {0, 5, 10, 20, 30}.

Figure 8.
Variations of shrinkage and swelling potentials against GR content for the natural soil and various GR-blended samples—SPxRy where x = {0, 0.2}, and y = {0, 5, 10, 20, 30}.
Figure 8.
Variations of shrinkage and swelling potentials against GR content for the natural soil and various GR-blended samples—SPxRy where x = {0, 0.2}, and y = {0, 5, 10, 20, 30}.

Figure 9.
Variations of the shrink–swell index against GR content for the natural soil and various GR-blended samples—SPxRy where x = {0, 0.2}, and y = {0, 5, 10, 20, 30}: (a) Conventional approach Issc; and (b) Modified approach Issm.
Figure 9.
Variations of the shrink–swell index against GR content for the natural soil and various GR-blended samples—SPxRy where x = {0, 0.2}, and y = {0, 5, 10, 20, 30}: (a) Conventional approach Issc; and (b) Modified approach Issm.

Figure 10.
SEM micrographs for the tested samples: (a) SP0R0; and (b) SP0.2R0.

Table 1.
Physical and mechanical properties of the clay soil.
| Properties | Value/Description | Standard Designation |
|---|---|---|
| Specific gravity of solids, GsS | 2.76 | ASTM D854–14 |
| Clay fraction [<2 μm] (%) | 44 | ASTM D422–07 |
| Silt fraction [2–75 μm] (%) | 36 | ASTM D422–07 |
| Sand fraction [0.075–4.75 mm] (%) | 20 | ASTM D422–07 |
| Liquid limit, wL (%) | 78.04 | AS 1289.3.9.1–15 |
| Plastic limit, wP (%) | 22.41 | AS 1289.3.2.1–09 |
| Plasticity index, IP (%) | 55.63 | AS 1289.3.3.1–09 |
| Flow index, IF (%) 1 | 81.57 | Sridharan et al. [49] |
| USCS classification | CH | ASTM D2487–11 |
| Free swell ratio, FSR 2 | 2.27 | Prakash and Sridharan [50] |
| Dominant clay mineral | Montmorillonite | Prakash and Sridharan [50] |
| Degree of expansivity | High | Prakash and Sridharan [50] |
| Optimum moisture content, wopt (%) | 20.24 | ASTM D698–12 |
| Maximum dry density, ρdmax (Mg/m3) | 1.62 | ASTM D698–12 |
1IF = ∆w/∆log10δ (where w = moisture content, and δ = cone penetration depth); and 2 Ratio of equilibrium sediment volume of 10 g oven-dried soil, passing 425 μm sieve, in distilled water to that of kerosene.
Table 2.
Physical properties and chemical composition of GR.
| Properties | Value/Description | Standard Designation |
|---|---|---|
| Specific gravity of solids, GsGR | 1.09 | — |
| Particle diameter d10 (mm) | 0.182 | ASTM D422–07 |
| Particle diameter d30 (mm) | 0.334 | ASTM D422–07 |
| Particle diameter d50 (mm) | 0.478 | ASTM D422–07 |
| Particle diameter d60 (mm) | 0.513 | ASTM D422–07 |
| Particle diameter d90 (mm) | 0.864 | ASTM D422–07 |
| Coefficient of uniformity, Cu | 2.81 | ASTM D422–07 |
| Coefficient of curvature, Cc | 1.20 | ASTM D422–07 |
| USCS classification | SP 1 | ASTM D2487–11 |
| Water adsorption (%) | < 4 | — |
| Softening point (°C) | 170 | — |
| Styrene–butadiene copolymer (% by mass) | 55 | — |
| Carbon black (% by mass) | 25–35 | — |
| Acetone extract (% by mass) | 5–20 | — |
| Zinc oxide (% by mass) | 2–3 | — |
| Sulphur (% by mass) | 1–3 | — |
1 Equivalent to poorly-graded sand.
Table 3.
Soil–PAM–GR mix designs and their properties.
| Group | Sample | Pc (g/L) | Rc (%) | GsM 1 | Tc (d) 2 | Tests |
|---|---|---|---|---|---|---|
| Control | SP0R0 | 0 | 0 | 2.76 | — | CL 3, SV 4, SPC 5, UCS, SR 6, SEM |
| Phase I PAM-treated | SP0.1R0 | 0.1 | 0 | 2.76 | 1, 4, 7, 14 | CL, SV, SPC, UCS |
| SP0.2R0 | 0.2 7 | 0 | 2.76 | 1, 4, 7, 14 | CL, SV, SPC, UCS, SR, SEM | |
| SP0.4R0 | 0.4 | 0 | 2.76 | 1, 4, 7, 14 | CL, SV, SPC, UCS | |
| SP0.6R0 | 0.6 | 0 | 2.76 | 1, 4, 7, 14 | CL, SV, SPC, UCS | |
| Phase II GR-blended | SP0R5 | 0 | 5 | 2.57 | — | SPC, UCS, SR |
| SP0R10 | 0 | 10 | 2.42 | — | SPC, UCS, SR | |
| SP0R20 | 0 | 20 | 2.20 | — | SPC, UCS, SR | |
| SP0R30 | 0 | 30 | 2.04 | — | SPC, UCS, SR | |
| Phase II PAM + GR | SP0.2R5 | 0.2 | 5 | 2.57 | 7 8 | SPC, UCS, SR |
| SP0.2R10 | 0.2 | 10 | 2.42 | 7 | SPC, UCS, SR | |
| SP0.2R20 | 0.2 | 20 | 2.20 | 7 | SPC, UCS, SR | |
| SP0.2R30 | 0.2 | 30 | 2.04 | 7 | SPC, UCS, SR |
1 Mixture specific gravity, obtained by Equation (5); 2 Curing time for the UCS tests; 3 Consistency limits tests; 4 Sediment volume test; 5 Standard Proctor compaction test; 6 Soil reactivity test; 7 Optimum PAM concentration; and 8 Optimum curing time.
Table 4.
Summary of the consistency limits for the natural soil and various PAM-treated blends—SPxR0 where x = {0, 0.1, 0.2, 0.4, 0.6}.
Table 4.
Summary of the consistency limits for the natural soil and various PAM-treated blends—SPxR0 where x = {0, 0.1, 0.2, 0.4, 0.6}.
| Sample | wL (%) | wP (%) | IP (%) | USCS | IF (%) |
|---|---|---|---|---|---|
| SP0R0 | 78.04 | 22.41 | 55.63 | CH | 81.57 |
| SP0.1R0 | 82.82 | 23.73 | 59.09 | CH | 97.34 |
| SP0.2R0 | 87.61 | 24.85 | 62.76 | CH | 118.54 |
| SP0.4R0 | 87.22 | 25.86 | 61.36 | CH | 120.70 |
| SP0.6R0 | 85.80 | 24.87 | 60.93 | CH | 122.57 |
Table 5.
Summary of the sediment volume features for the natural soil and various PAM-treated blends—SPxR0 where x = {0, 0.1, 0.2, 0.4, 0.6}.
Table 5.
Summary of the sediment volume features for the natural soil and various PAM-treated blends—SPxR0 where x = {0, 0.1, 0.2, 0.4, 0.6}.
| Sample | VD (cm3) | VP (cm3) | VK (cm3) | FSR | Degree of Expansivity [50] |
|---|---|---|---|---|---|
| SP0R0 | 34.0 | — | 15.0 | 2.27 | High |
| SP0.1R0 | — | 28.5 | 15.0 | 1.90 | Moderate |
| SP0.2R0 | — | 25.0 | 15.0 | 1.67 | Moderate |
| SP0.4R0 | — | 24.5 | 15.0 | 1.63 | Moderate |
| SP0.6R0 | — | 23.0 | 15.0 | 1.53 | Moderate |
VD, VP and VK = equilibrium sediment volume of 10 g oven-dried soil, passing 425 μm sieve, in distilled water, PAM solution and kerosene, respectively; and FSR = VD/VK or VP/VK.
Table 6.
Summary of the compaction characteristics for the natural soil and various PAM-treated blends—SPxR0 where x = {0, 0.1, 0.2, 0.4, 0.6}.
Table 6.
Summary of the compaction characteristics for the natural soil and various PAM-treated blends—SPxR0 where x = {0, 0.1, 0.2, 0.4, 0.6}.
| Sample | wopt (%) | ρdmax (Mg/m3) | emin1 | SRopt (%) 2 |
|---|---|---|---|---|
| SP0R0 | 20.24 | 1.62 | 0.702 | 79.59 |
| SP0.1R0 | 20.28 | 1.64 | 0.682 | 82.05 |
| SP0.2R0 | 21.06 | 1.66 | 0.662 | 87.82 |
| SP0.4R0 | 20.20 | 1.67 | 0.650 | 85.72 |
| SP0.6R0 | 20.72 | 1.70 | 0.622 | 91.88 |
1 Minimum void ratio, obtained by emin = GsS ρw/ρdmax − 1; and 2 Optimum degree of saturation, obtained by SRopt = GsS wopt/emin.
Table 7.
Summary of the stress–strain features for the natural soil and various PAM-treated samples—SPxR0 where x = {0, 0.1, 0.2, 0.4, 0.6}—at Tc = 1, 4, 7 and 14 d.
Table 7.
Summary of the stress–strain features for the natural soil and various PAM-treated samples—SPxR0 where x = {0, 0.1, 0.2, 0.4, 0.6}—at Tc = 1, 4, 7 and 14 d.
| Sample | Tc (d) | qu (kPa) | η (%) 1 | εu (%) 2 | ID3 | E50 (MPa) 4 | EU (kJ/m3) 5 | ER (MPa) 6 |
|---|---|---|---|---|---|---|---|---|
| SP0R0 | 0 | 72.28 | — | 4.21 | 1.00 | 1.97 | 1.71 | 130.61 |
| SP0.1R0 | 1 | 96.87 | 34 | 4.62 | 1.10 | 2.83 | 2.76 | 151.63 |
| SP0.2R0 | 1 | 128.43 | 78 | 5.01 | 1.19 | 3.67 | 4.10 | 178.61 |
| SP0.4R0 | 1 | 83.18 | 15 | 6.81 | 1.62 | 1.39 | 3.17 | 139.92 |
| SP0.6R0 | 1 | 54.14 | −25 | 8.02 | 1.90 | 0.75 | 2.37 | 115.10 |
| SP0.1R0 | 4 | 107.51 | 49 | 4.75 | 1.13 | 3.32 | 3.31 | 160.73 |
| SP0.2R0 | 4 | 141.23 | 95 | 5.20 | 1.24 | 4.28 | 4.89 | 189.55 |
| SP0.4R0 | 4 | 88.11 | 22 | 6.94 | 1.65 | 1.51 | 3.79 | 144.14 |
| SP0.6R0 | 4 | 62.12 | −14 | 7.94 | 1.89 | 0.94 | 2.76 | 121.92 |
| SP0.1R0 | 7 | 117.16 | 62 | 4.67 | 1.11 | 3.76 | 3.65 | 168.98 |
| SP0.2R0 | 7 | 164.47 | 128 | 5.03 | 1.19 | 5.27 | 5.50 | 209.42 |
| SP0.4R0 | 7 | 109.43 | 51 | 6.88 | 1.63 | 2.03 | 4.29 | 162.37 |
| SP0.6R0 | 7 | 70.21 | −3 | 8.11 | 1.93 | 1.08 | 3.14 | 128.84 |
| SP0.1R0 | 14 | 119.84 | 66 | 4.56 | 1.08 | 3.79 | 3.74 | 171.27 |
| SP0.2R0 | 14 | 168.34 | 133 | 4.87 | 1.16 | 5.29 | 5.30 | 212.73 |
| SP0.4R0 | 14 | 107.21 | 48 | 6.92 | 1.64 | 1.96 | 4.11 | 160.47 |
| SP0.6R0 | 14 | 68.87 | −5 | 7.84 | 1.86 | 1.08 | 3.02 | 127.69 |
1 Percent change in the UCS (or qu); 2 Axial strain at failure; 3 ID = εuS/εuN where εuS = axial strain at failure for the stabilized sample, and εuN = axial strain at failure for the natural soil [63]; 4 E50 = secant modulus at 50% of the UCS (or qu) [66]; 5 EU = area under the stress–strain curve up to the failure point [65]; and 6 Computed from ER (psi) = 124 × qu (psi) + 9980, as suggested by Thompson [64].
Table 8.
Summary of the stress–strain features for the natural soil and various GR-blended samples—SPxRy where x = {0, 0.2}, and y = {0, 5, 10, 20, 30}.
Table 8.
Summary of the stress–strain features for the natural soil and various GR-blended samples—SPxRy where x = {0, 0.2}, and y = {0, 5, 10, 20, 30}.
| Sample | Tc (d) | qu (kPa) | η (%) 1 | εu (%) 2 | ID3 | E50 (MPa) 4 | EU (kJ/m3) 5 | ER (MPa) 6 |
|---|---|---|---|---|---|---|---|---|
| SP0R0 | 0 | 72.28 | — | 4.21 | 1.00 | 1.97 | 1.71 | 130.61 |
| SP0R5 | 0 | 91.21 | 26 | 5.59 | 1.33 | 1.96 | 2.86 | 146.79 |
| SP0R10 | 0 | 98.61 | 36 | 7.61 | 1.81 | 1.51 | 4.17 | 153.12 |
| SP0R20 | 0 | 62.28 | −14 | 8.78 | 2.09 | 0.72 | 2.83 | 122.06 |
| SP0R30 | 0 | 46.61 | −36 | 9.58 | 2.28 | 0.47 | 2.19 | 108.66 |
| SP0.2R0 | 7 | 164.47 | 128 | 5.03 | 1.19 | 5.27 | 5.50 | 209.42 |
| SP0.2R5 | 7 | 208.94 | 189 | 5.82 | 1.38 | 4.54 | 7.05 | 247.44 |
| SP0.2R10 | 7 | 211.09 | 192 | 7.98 | 1.90 | 3.26 | 9.80 | 249.28 |
| SP0.2R20 | 7 | 106.18 | 47 | 9.01 | 2.14 | 1.25 | 5.26 | 159.59 |
| SP0.2R30 | 7 | 65.15 | −10 | 9.22 | 2.19 | 0.66 | 3.14 | 124.51 |
1 Percent change in the UCS (or qu); 2 Axial strain at failure; 3 ID = εuS/εuN where εuS = axial strain at failure for the stabilized sample, and εuN = axial strain at failure for the natural soil [63]; 4 E50 = secant modulus at 50% of the UCS (or qu) [66]; 5 EU = area under the stress–strain curve up to the failure point [65]; and 6 Computed from ER (psi) = 124 × qu (psi) + 9980, as suggested by Thompson [64].
Table 9.
Summary of the soil reactivity features for the natural soil and various GR-blended samples—SPxRy where x = {0, 0.2}, and y = {0, 5, 10, 20, 30}.
Table 9.
Summary of the soil reactivity features for the natural soil and various GR-blended samples—SPxRy where x = {0, 0.2}, and y = {0, 5, 10, 20, 30}.
| Sample | εsh (%) | εsw (%) | ψo (pF) | ψsh (pF) 1 | ψsw (pF) 2 | ∆ψ (pF) | Issc (%pF−1) 3 | Issm (%pF−1) 4 |
|---|---|---|---|---|---|---|---|---|
| SP0R0 | 5.74 | 3.69 | 4.73 | 5.72 | 3.65 | 2.07 | 4.21 | 3.66 |
| SP0R5 | 5.34 | 3.03 | 4.75 | 5.69 | 3.60 | 2.09 | 3.81 | 3.28 |
| SP0R10 | 4.89 | 2.11 | 4.78 | 5.64 | 3.55 | 2.09 | 3.30 | 2.84 |
| SP0R20 | 2.93 | 1.77 | 4.77 | 5.61 | 3.33 | 2.28 | 2.12 | 1.67 |
| SP0R30 | 1.87 | 1.61 | 4.76 | 5.54 | 3.26 | 2.28 | 1.49 | 1.17 |
| SP0.2R0 | 3.52 | 1.98 | 4.74 | 5.74 | 3.63 | 2.11 | 2.51 | 2.14 |
| SP0.2R5 | 3.29 | 1.74 | 4.77 | 5.70 | 3.59 | 2.11 | 2.31 | 1.97 |
| SP0.2R10 | 2.62 | 1.54 | 4.81 | 5.67 | 3.53 | 2.14 | 1.88 | 1.58 |
| SP0.2R20 | 2.57 | 1.34 | 4.79 | 5.64 | 3.32 | 2.32 | 1.80 | 1.40 |
| SP0.2R30 | 1.31 | 1.14 | 4.77 | 5.55 | 3.25 | 2.30 | 1.04 | 0.82 |
1 Total suction upon completion of the core shrinkage test; 2 Total suction upon completion of the oedometer swell test; 3 Conventional shrink–swell index, obtained by ∆ψ = 1.8 pF; and 4 Modified shrink–swell index, obtained by actual ∆ψ measurements.
© 2019 by the authors. Licensee MDPI, Basel, Switzerland. This article is an open access article distributed under the terms and conditions of the Creative Commons Attribution (CC BY) license (http://creativecommons.org/licenses/by/4.0/).
Share and Cite
MDPI and ACS Style
Soltani, A.; Deng, A.; Taheri, A.; O’Kelly, B.C. Engineering Reactive Clay Systems by Ground Rubber Replacement and Polyacrylamide Treatment. Polymers 2019, 11, 1675. https://doi.org/10.3390/polym11101675
AMA Style
Soltani A, Deng A, Taheri A, O’Kelly BC. Engineering Reactive Clay Systems by Ground Rubber Replacement and Polyacrylamide Treatment. Polymers. 2019; 11(10):1675. https://doi.org/10.3390/polym11101675
Chicago/Turabian StyleSoltani, Amin, An Deng, Abbas Taheri, and Brendan C. O’Kelly. 2019. "Engineering Reactive Clay Systems by Ground Rubber Replacement and Polyacrylamide Treatment" Polymers 11, no. 10: 1675. https://doi.org/10.3390/polym11101675
Note that from the first issue of 2016, this journal uses article numbers instead of page numbers. See further details here.