Experimental, Numerical, and Analytical Study on The Effect of Graphene Oxide in The Mechanical Properties of a Solvent-Free Reinforced Epoxy Resin

 , , , and
Abstract
:
1. Introduction
2. Materials and Methods
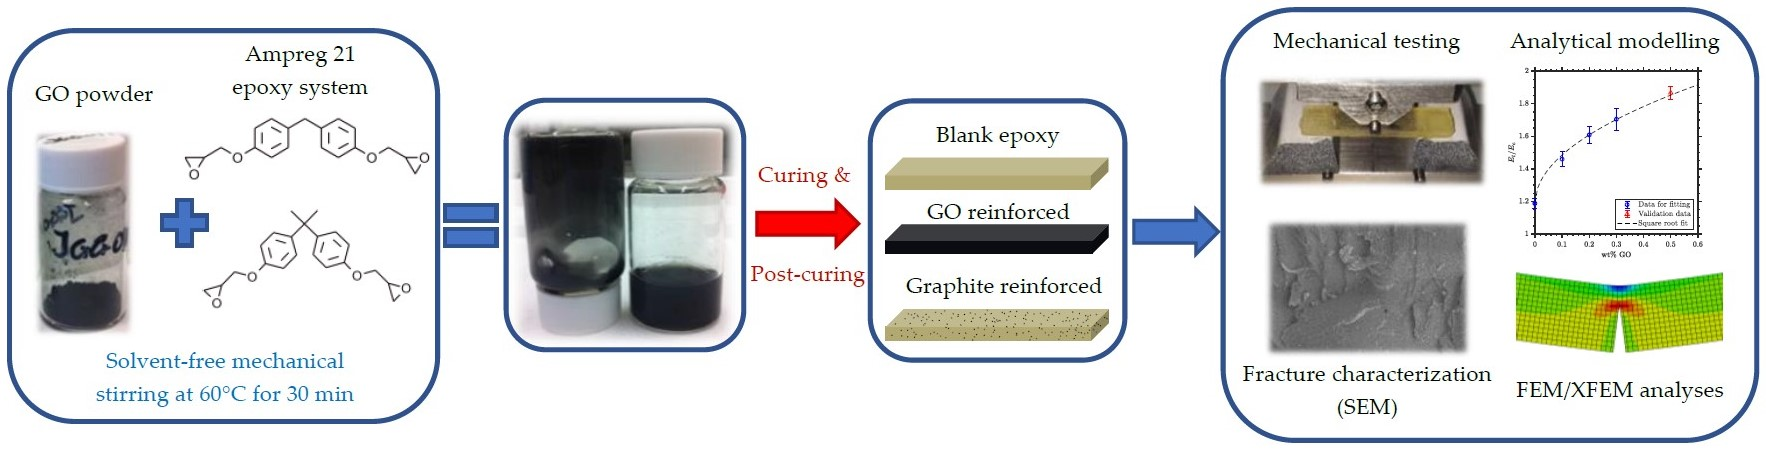
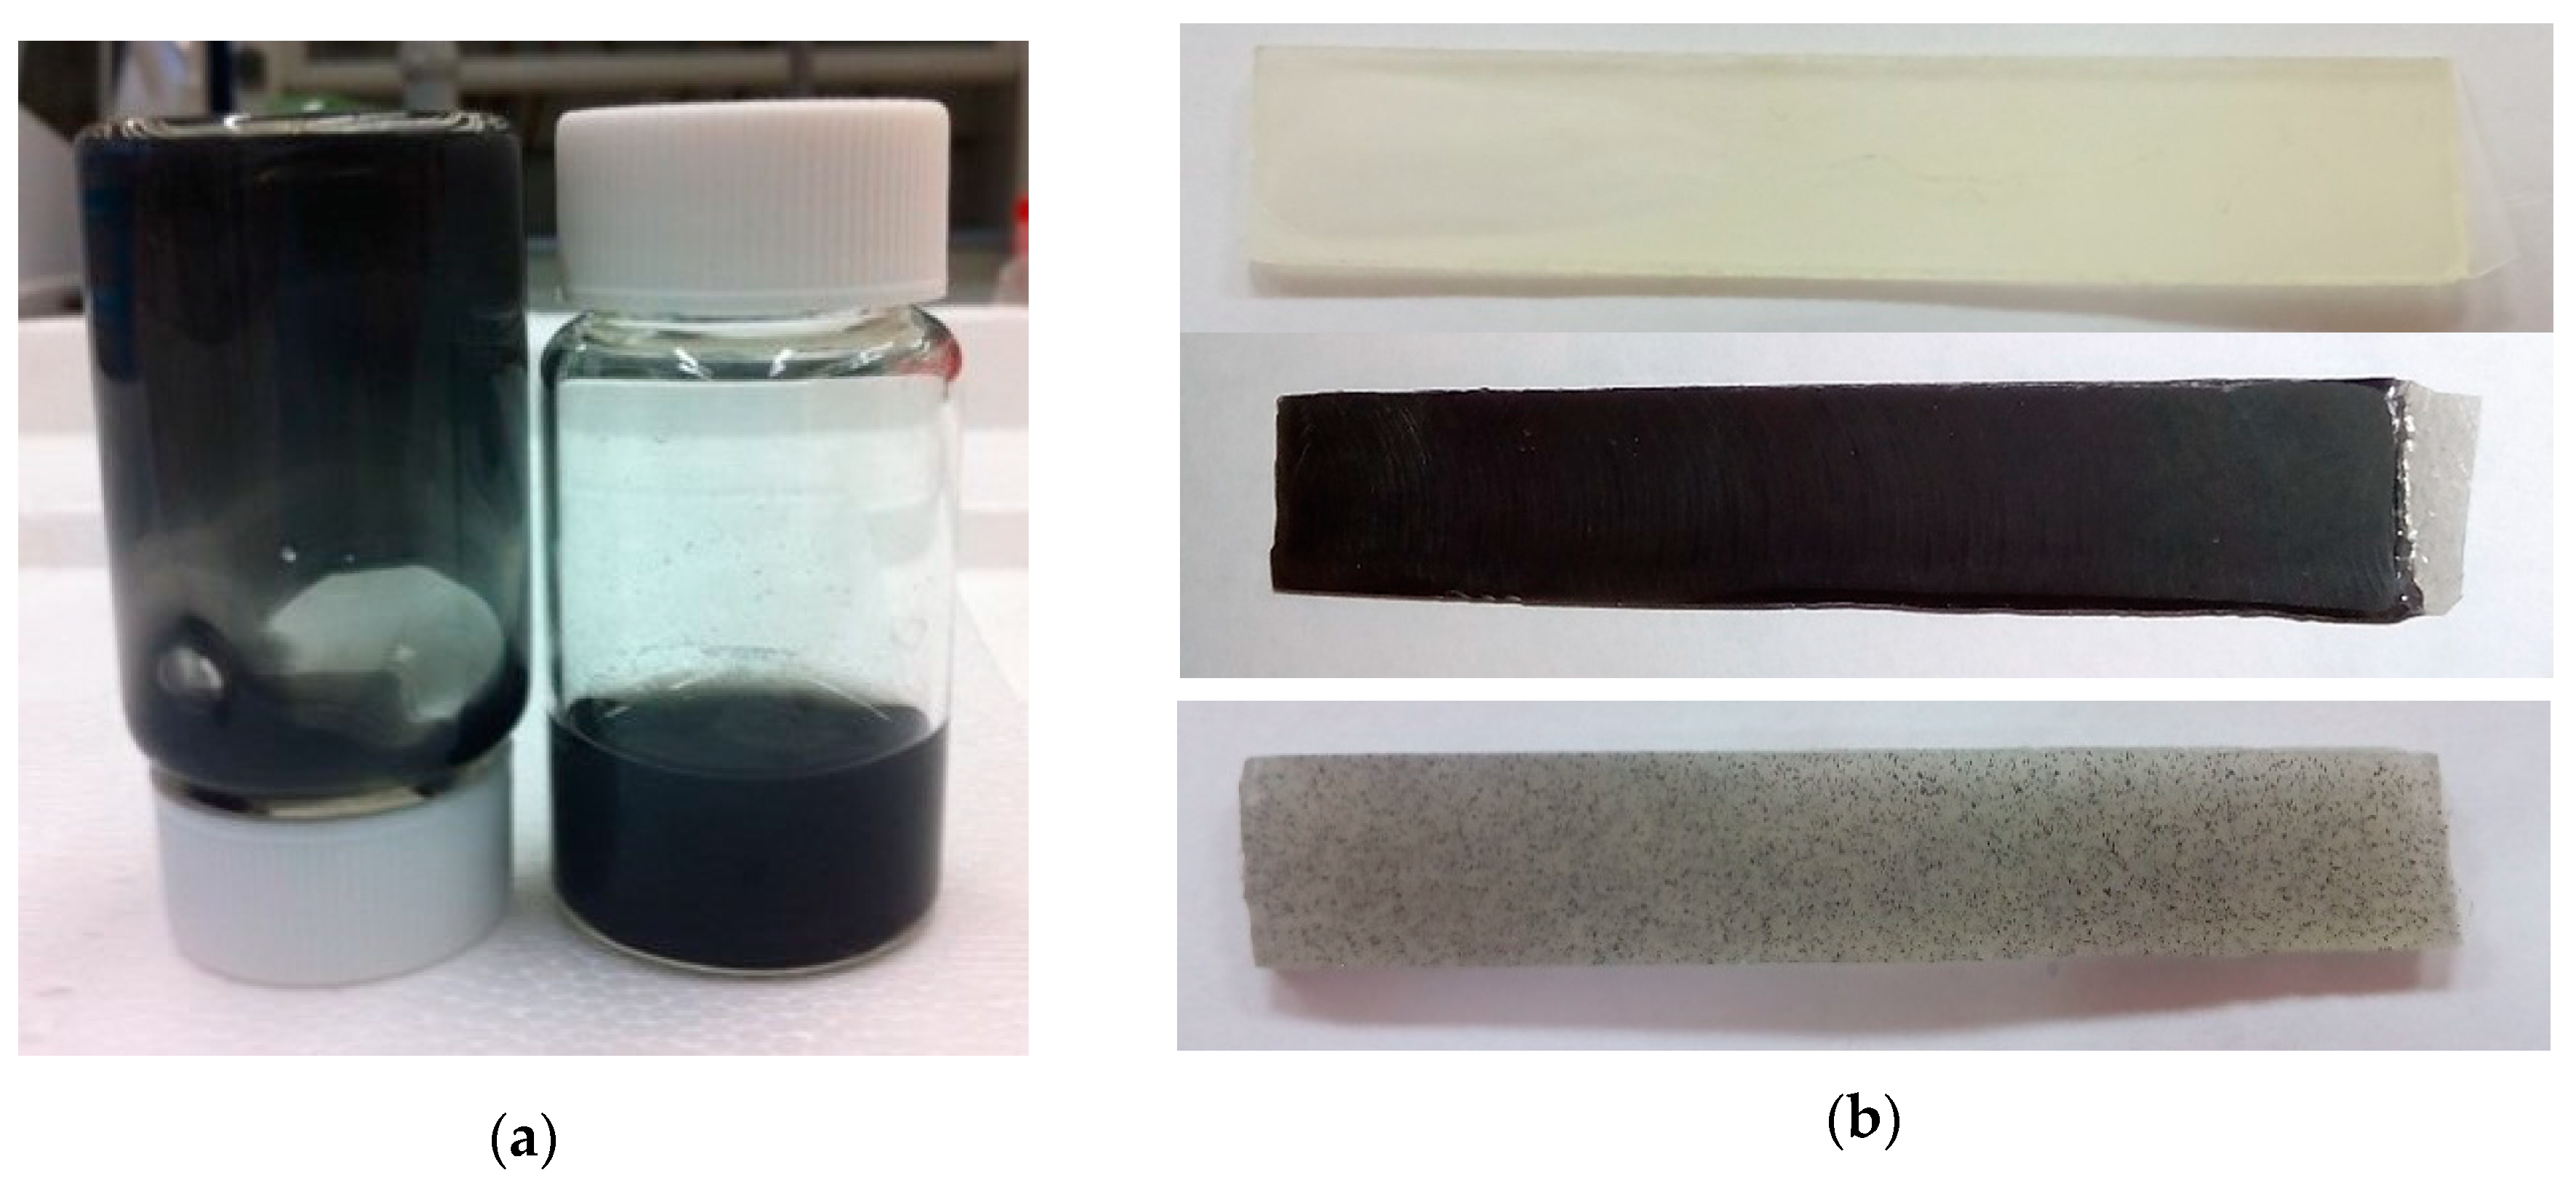
2.1. Materials and Specimen Preparation
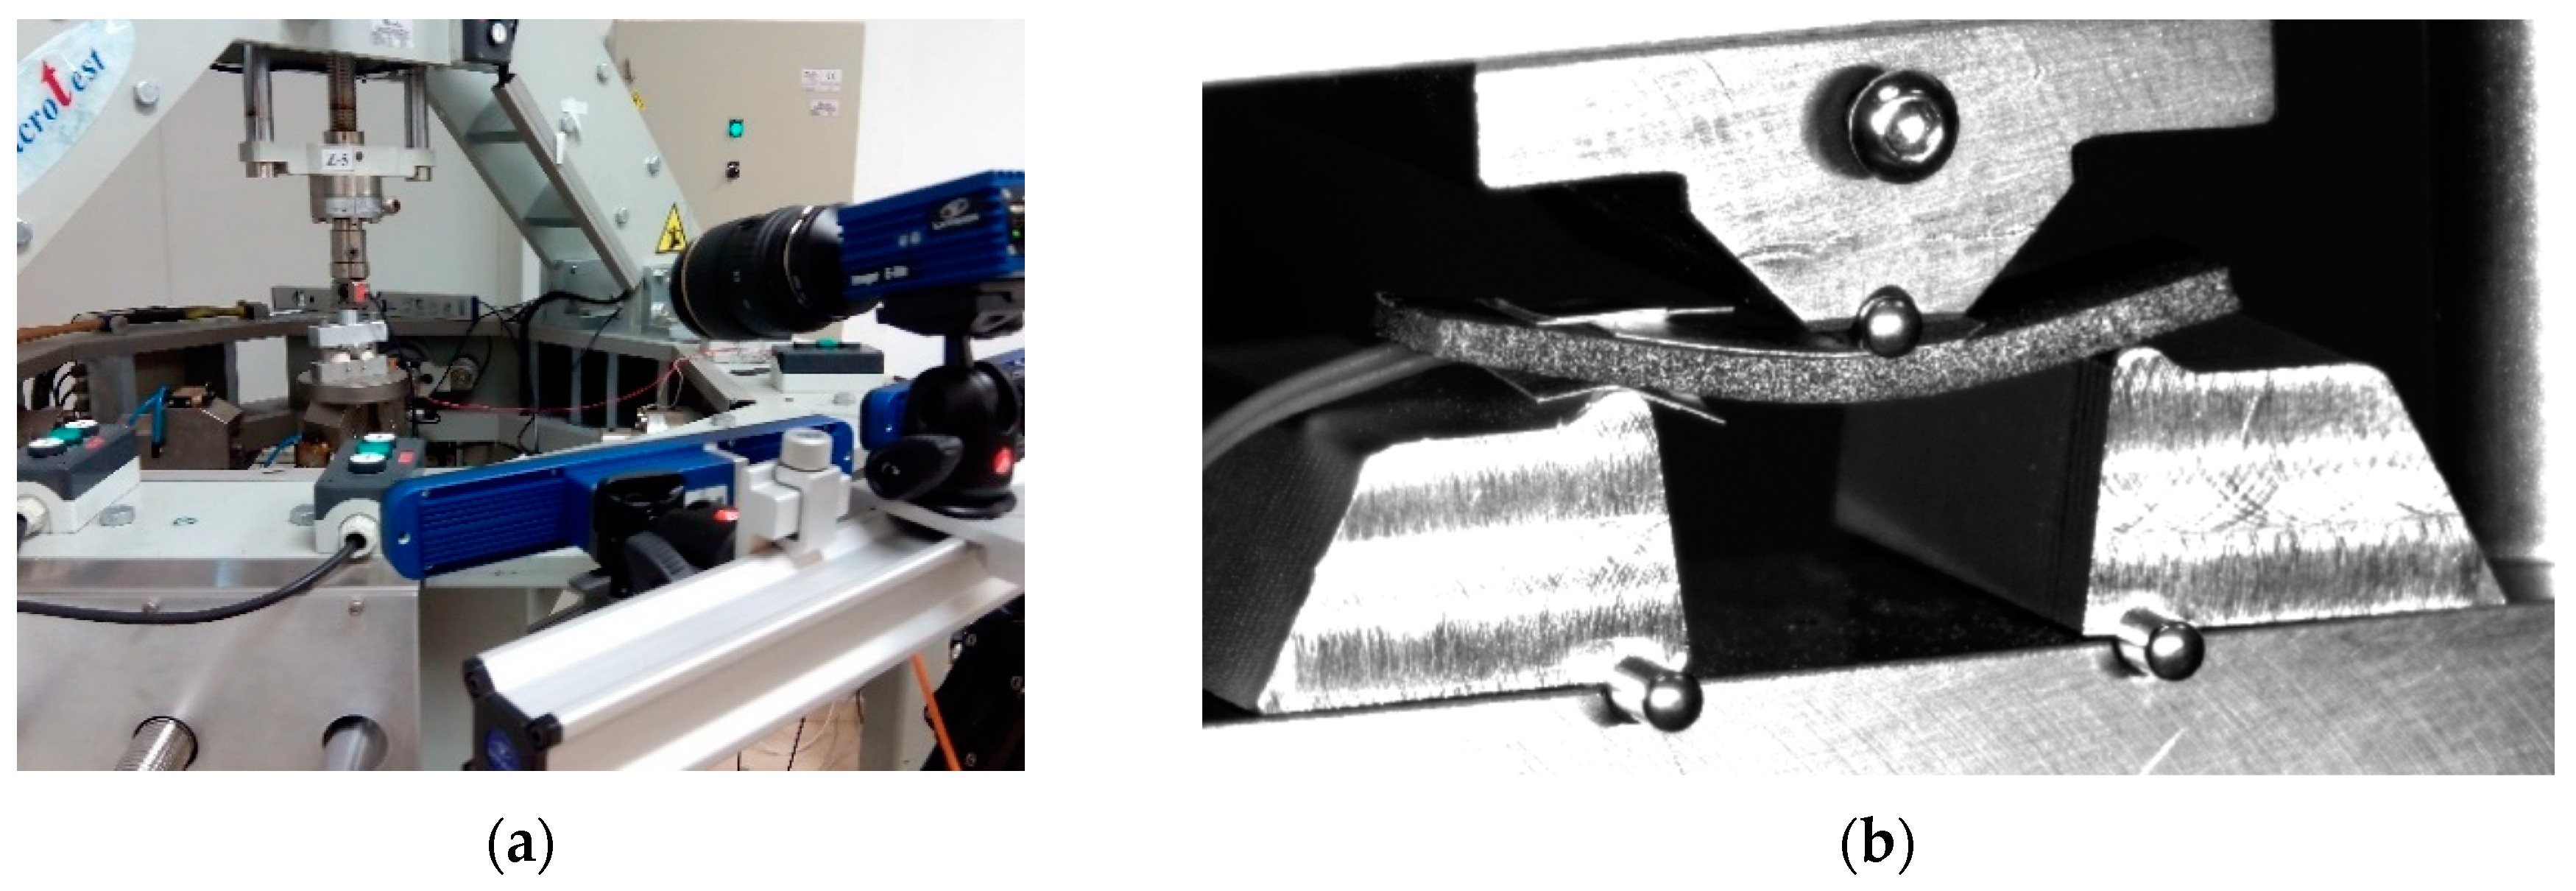
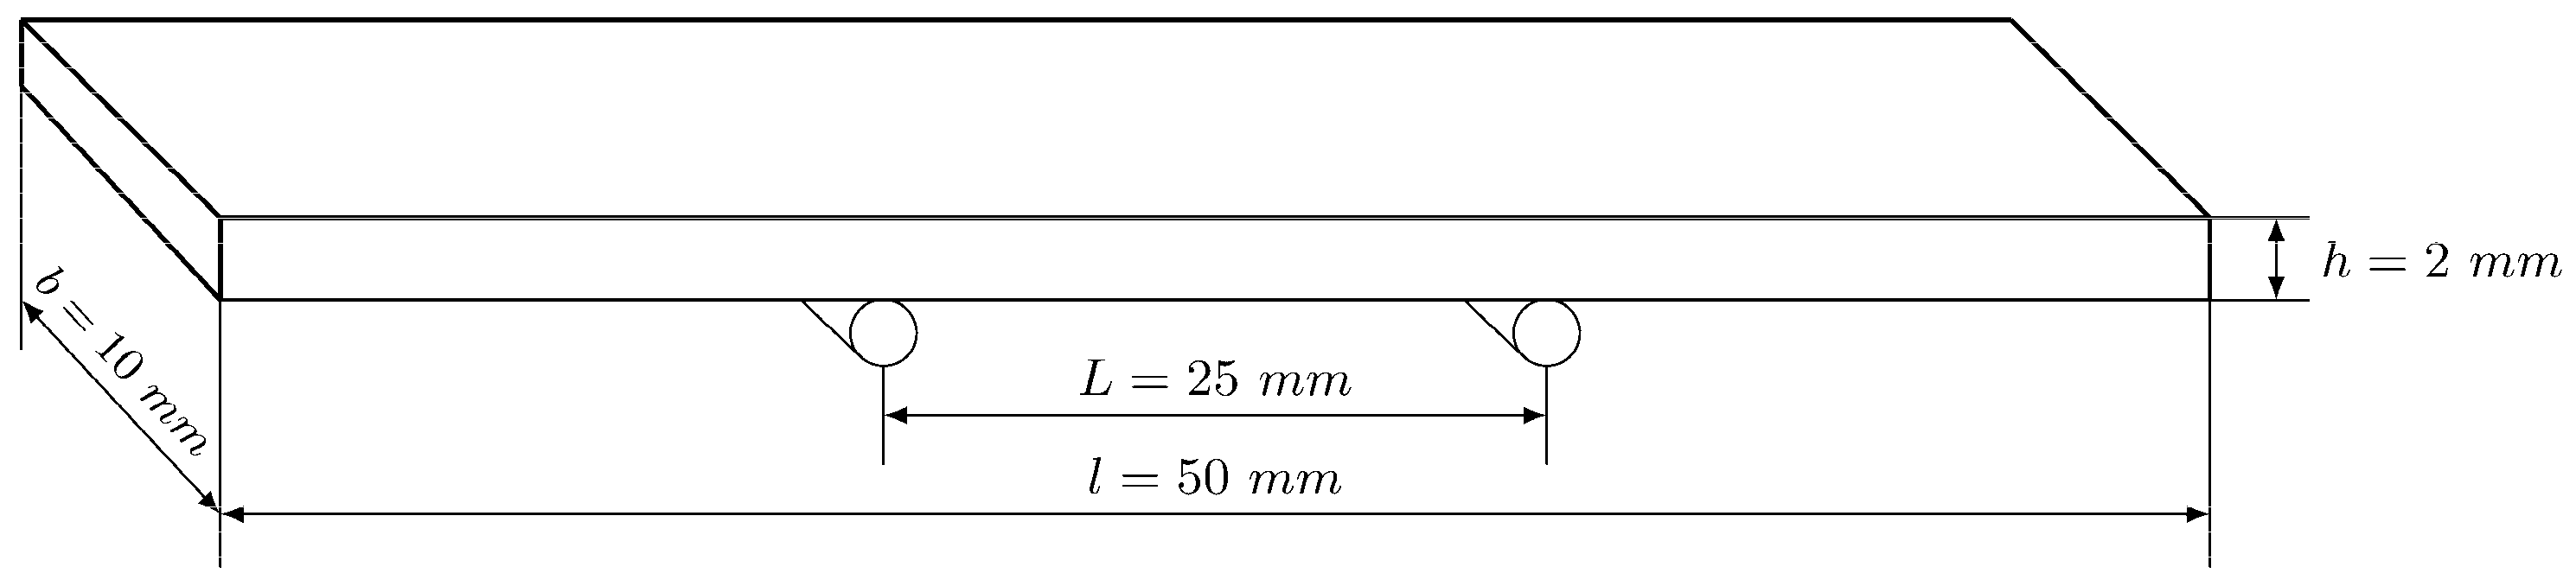
2.2. Three-Point Bending Test
Homogenized Section Technique
2.3. Compressive Testing
2.4. Numerical Simulations
3. Results and Discussion
3.1. Three-Point Bending Testing
3.2. Compressive Testing
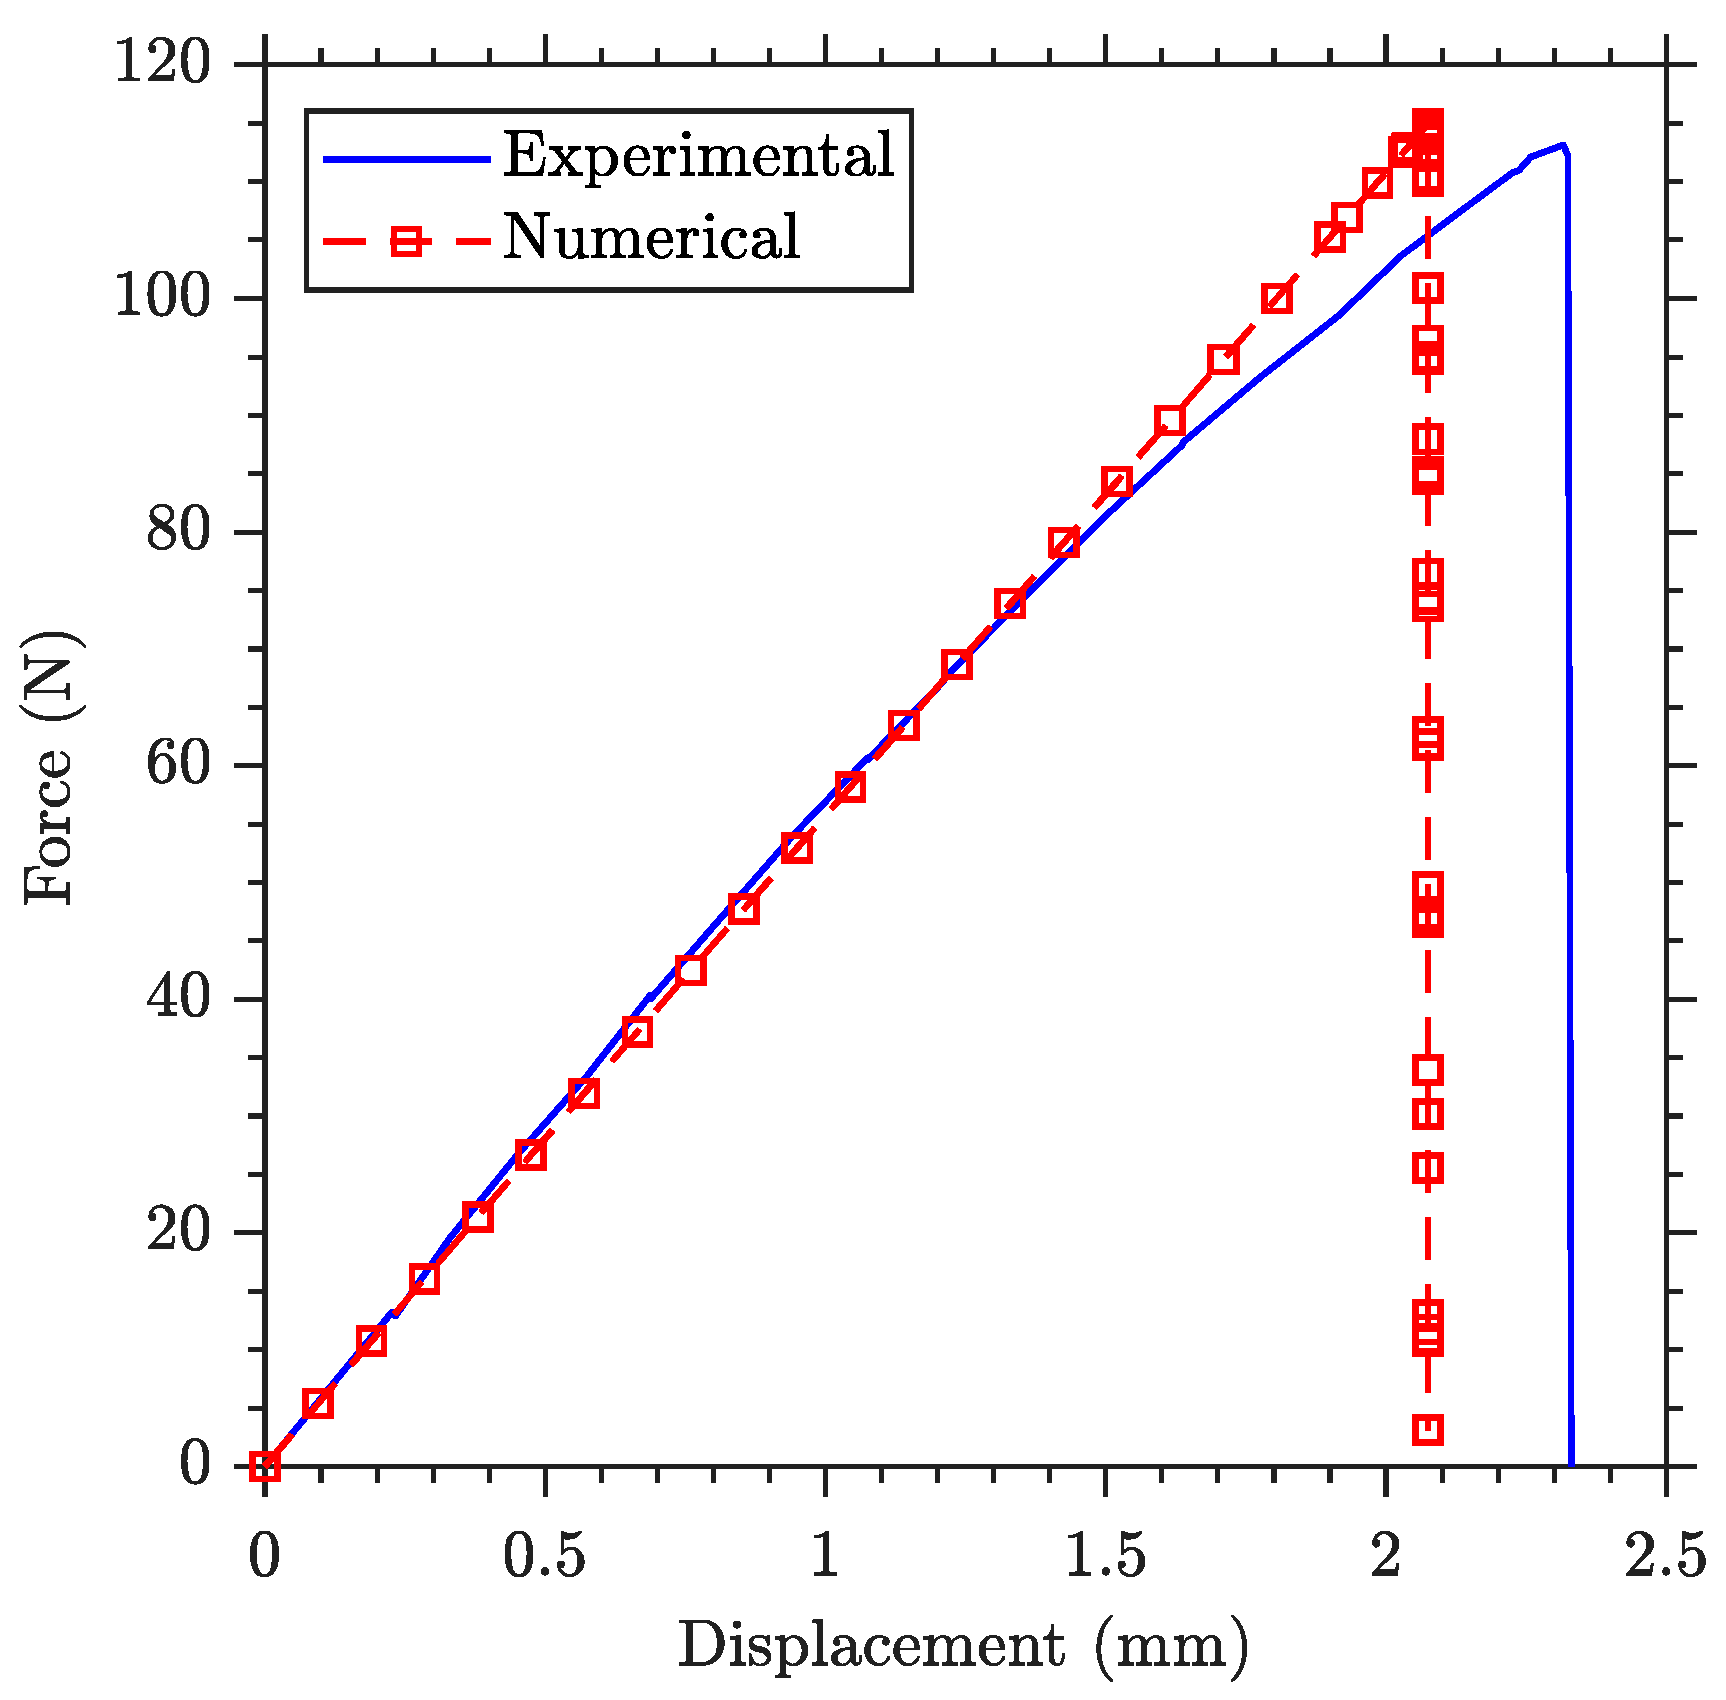
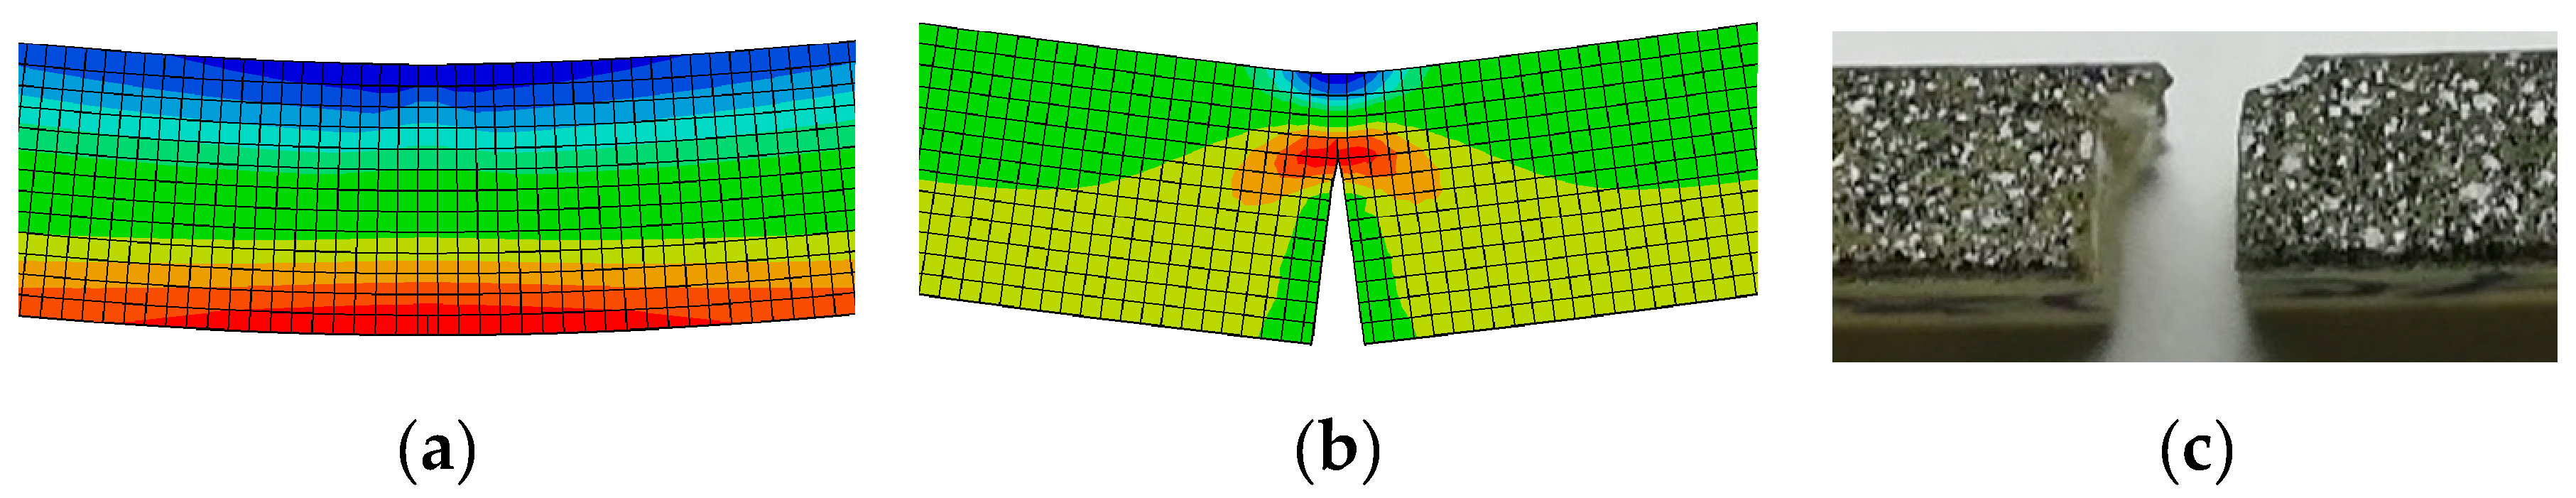
3.3. Numerical Results
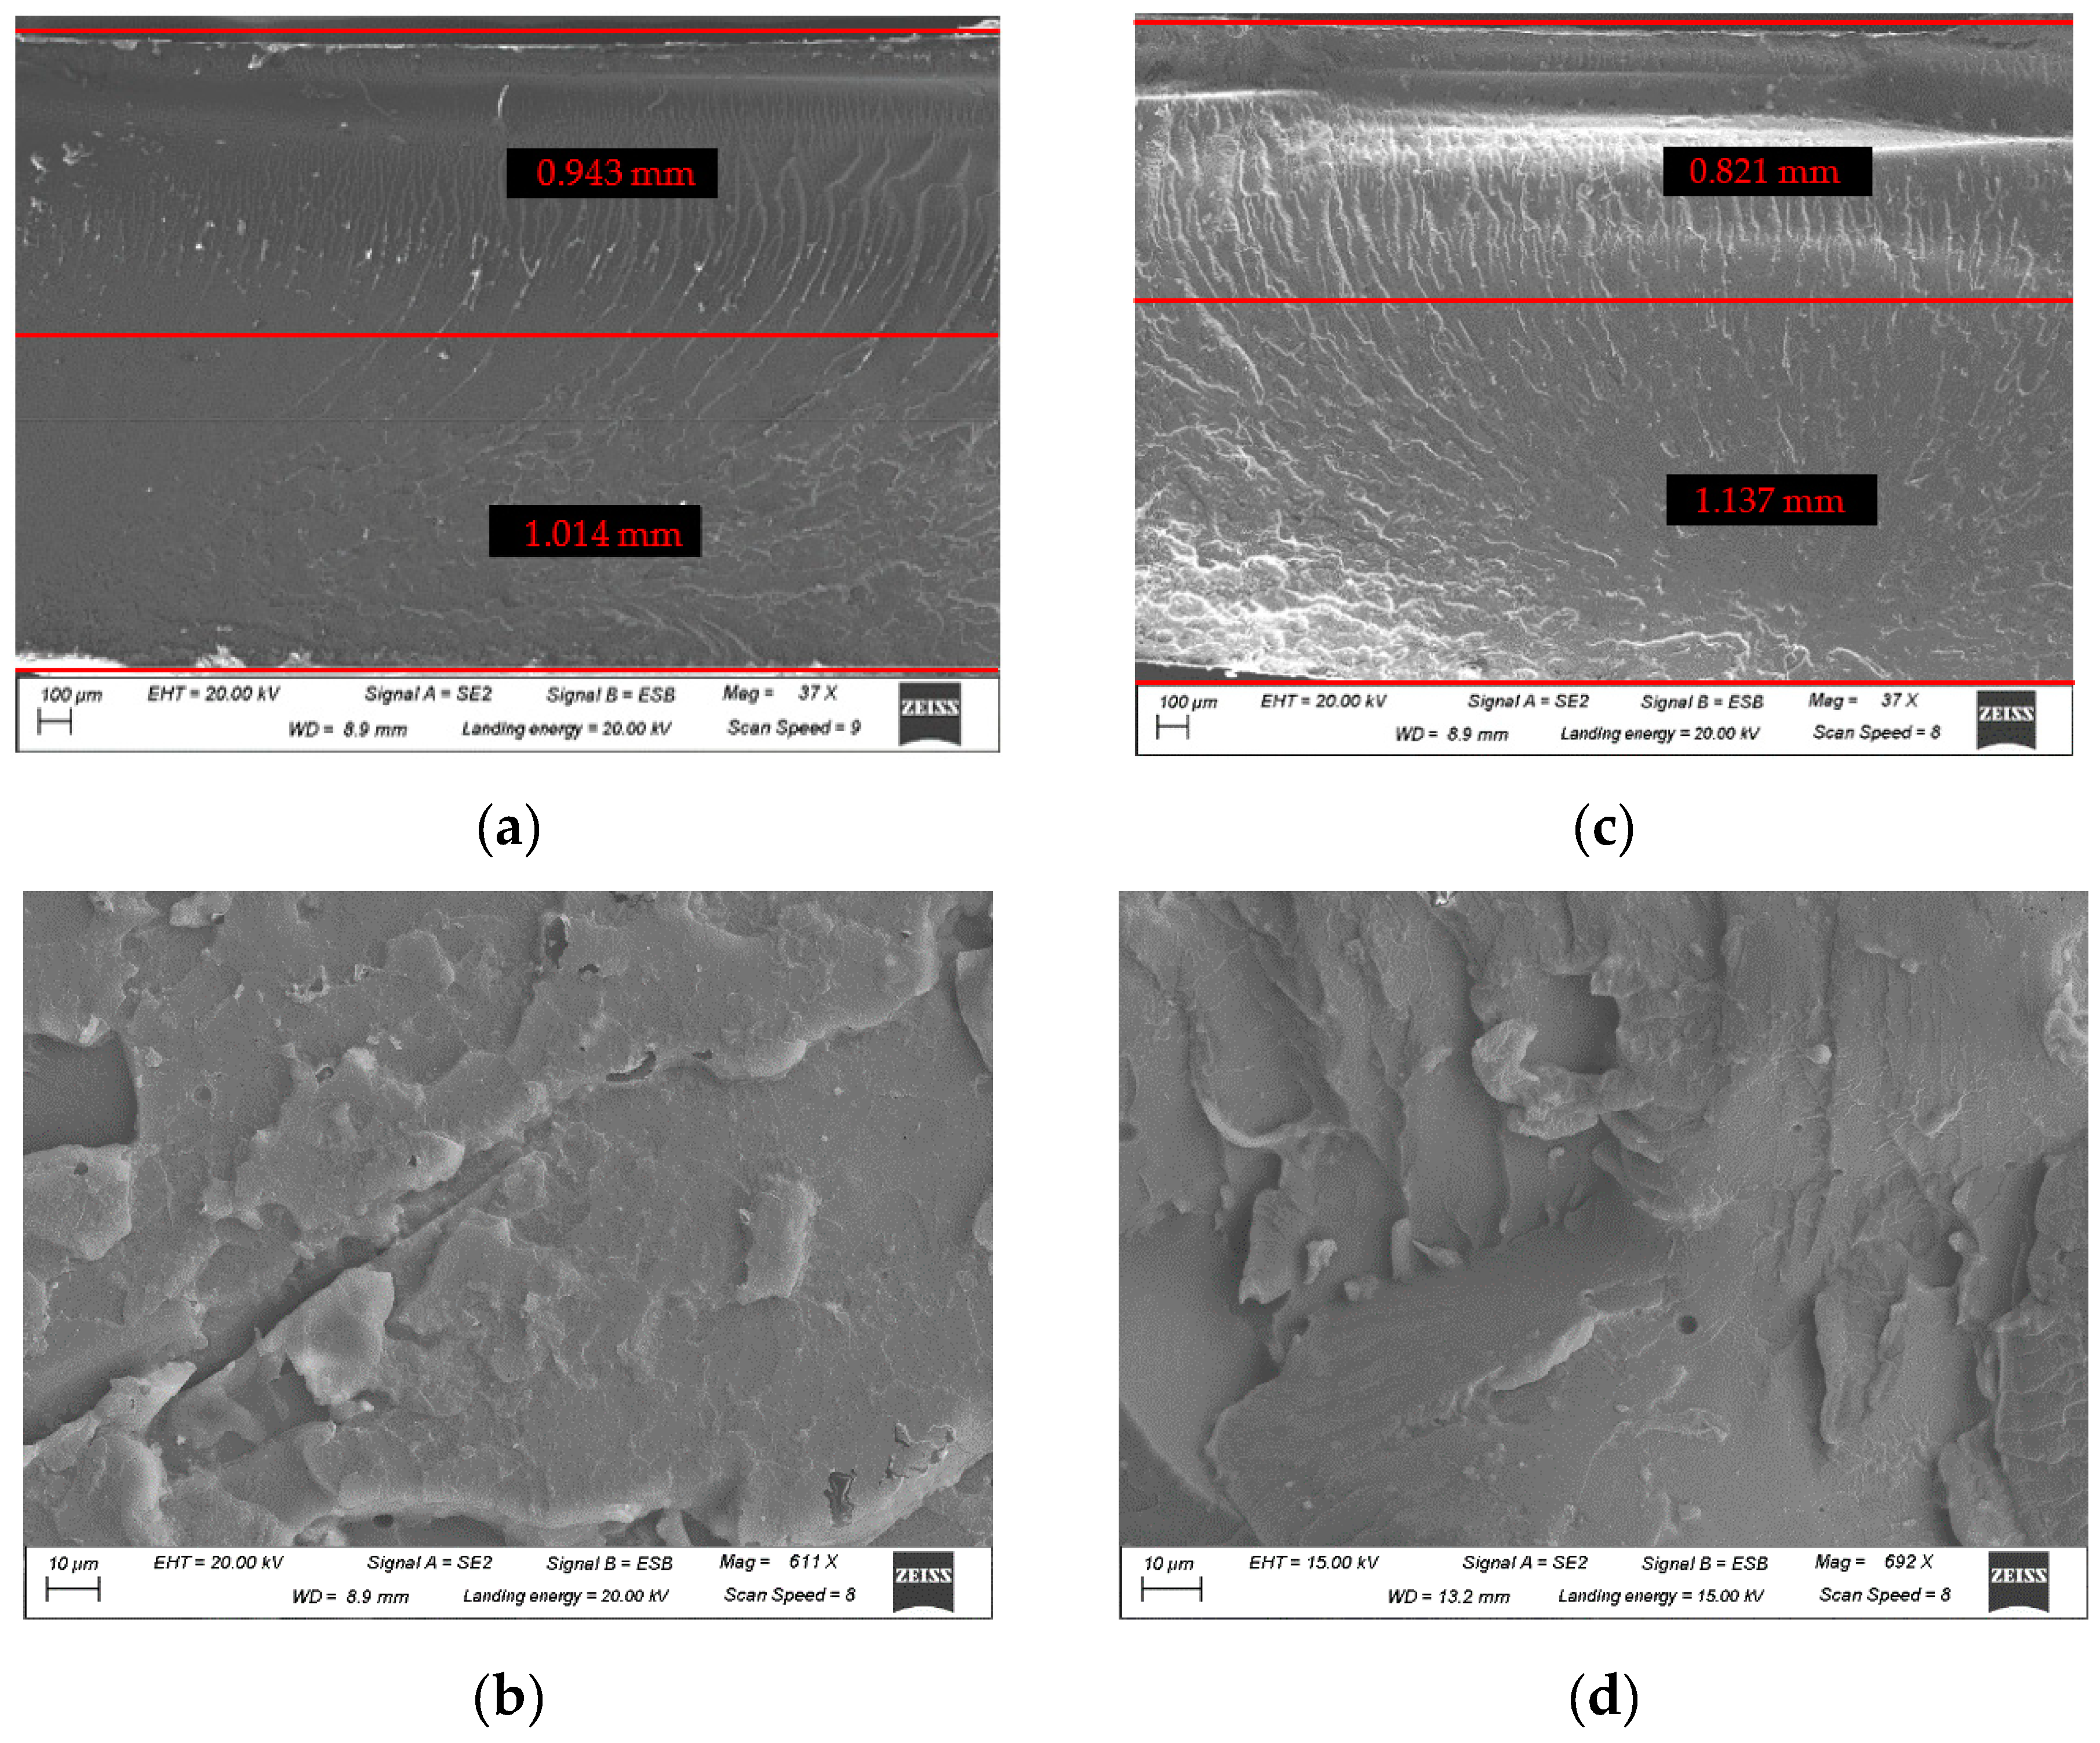
3.4. Microscopic Examination and Fracture Surface Analysis
4. Conclusions
Author Contributions
Funding
Acknowledgments
Conflicts of Interest
References
- Li, Z.; Wang, L.; Li, Y.; Feng, Y.; Feng, W. Carbon-based functional nanomaterials: Preparation, properties and applications. Compos. Sci. Technol. 2019, 179, 10–40. [Google Scholar] [CrossRef]
- Kuilla, T.; Bhadra, S.; Yao, D.; Kim, N.H.; Bose, S.; Lee, J.H. Recent advances in graphene based polymer composites. Prog. Polym. Sci. 2010, 35, 1350–1375. [Google Scholar] [CrossRef]
- Imani Yengejeh, S.; Kazemi, S.A.; Öchsner, A. Carbon nanotubes as reinforcement in composites: A review of the analytical, numerical and experimental approaches. Comp. Mater. Sci. 2017, 136, 85–101. [Google Scholar] [CrossRef]
- Atif, R.; Shyha, I.; Inam, F. Mechanical, Thermal, and Electrical Properties of Graphene-Epoxy Nanocomposites—A Review. Polymers 2016, 8, 281. [Google Scholar] [CrossRef] [PubMed]
- Palermo, V.; Kinloch, I.A.; Ligi, S.; Pugno, N.M. Nanoscale Mechanics of Graphene and Graphene Oxide in Composites: A Scientific and Technological Perspective. Adv. Mater. 2016, 28, 6232–6238. [Google Scholar] [CrossRef] [PubMed]
- Zhu, Y.; Murali, S.; Cai, W.; Li, X.; Suk, J.W.; Potts, J.R.; Ruoff, R.S. Graphene and Graphene Oxide: Synthesis, Properties, and Applications. Adv. Mater. 2010, 22, 3906–3924. [Google Scholar] [CrossRef]
- Cano, M.; Khan, U.; Sainsbury, T.; O’Neill, A.; Wang, Z.; McGovern, I.T.; Maser, W.K.; Benito, A.M.; Coleman, J.N. Improving the mechanical properties of graphene oxide based materials by covalent attachment of polymer chains. Carbon 2013, 52, 363–371. [Google Scholar] [CrossRef]
- Hu, K.; Kulkarni, D.D.; Choi, I.; Tsukruk, V.V. Graphene-polymer nanocomposites for structural and functional applications. Prog. Polym. Sci. 2014, 39, 1934–1972. [Google Scholar] [CrossRef]
- Chen, D.; Feng, H.; Li, J. Graphene Oxide: Preparation, Functionalization, and Electrochemical Applications. Chem. Rev. 2012, 112, 6027–6053. [Google Scholar] [CrossRef]
- González-Domínguez, J.M.; Díez-Pascual, A.M.; Ansón-Casaos, A.; Gómez-Fatou, M.A.; Martínez, M.T. Functionalization Strategies for Single-Walled Carbon Nanotubes Integration into Epoxy Matrices. In Polymer Nanotube Nanocomposites; Mittal, V., Ed.; John Wiley & Sons, Inc.: Hoboken, NJ, USA, 2014; pp. 45–116. ISBN 978-1-118-94596-4. [Google Scholar]
- Fang, F.; Ran, S.; Fang, Z.; Song, P.; Wang, H. Improved flame resistance and thermo-mechanical properties of epoxy resin nanocomposites from functionalized graphene oxide via self-assembly in water. Compos. Part B Eng. 2019, 165, 406–416. [Google Scholar] [CrossRef]
- Ferreira, F.V.; Brito, F.S.; Franceschi, W.; Simonetti, E.A.N.; Cividanes, L.S.; Chipara, M.; Lozano, K. Functionalized graphene oxide as reinforcement in epoxy based nanocomposites. Surf. Interfac. 2018, 10, 100–109. [Google Scholar] [CrossRef]
- Cai, D.; Song, M. Recent advance in functionalized graphene/polymer nanocomposites. J. Mater. Chem. 2010, 20, 7906. [Google Scholar] [CrossRef]
- Fang, M.; Wang, K.; Lu, H.; Yang, Y.; Nutt, S. Covalent polymer functionalization of graphene nanosheets and mechanical properties of composites. J. Mater. Chem. 2009, 19, 7098. [Google Scholar] [CrossRef]
- Li, S.; Yang, P.; Liu, X.; Zhang, J.; Xie, W.; Wang, C.; Liu, C.; Guo, Z. Graphene oxide based dopamine mussel-like crosslinked polyethylene imine nanocomposite coating with enhanced hexavalent uranium adsorption. J. Mater. Chem. A 2019, 7, 16902–16911. [Google Scholar] [CrossRef]
- Cao, C.; Daly, M.; Singh, C.V.; Sun, Y.; Filleter, T. High strength measurement of monolayer graphene oxide. Carbon 2015, 81, 497–504. [Google Scholar] [CrossRef]
- Poulin, P.; Jalili, R.; Neri, W.; Nallet, F.; Divoux, T.; Colin, A.; Aboutalebi, S.H.; Wallace, G.; Zakri, C. Superflexibility of graphene oxide. Proc. Natl. Acad. Sci. USA 2016, 113, 11088–11093. [Google Scholar] [CrossRef] [Green Version]
- Suk, J.W.; Piner, R.D.; An, J.; Ruoff, R.S. Mechanical Properties of Monolayer Graphene Oxide. ACS Nano 2010, 4, 6557–6564. [Google Scholar] [CrossRef]
- Wan, Y.-J.; Gong, L.-X.; Tang, L.-C.; Wu, L.-B.; Jiang, J.-X. Mechanical properties of epoxy composites filled with silane-functionalized graphene oxide. Compos. Part A Appl. Sci. Manuf. 2014, 64, 79–89. [Google Scholar] [CrossRef]
- Wan, Y.-J.; Tang, L.-C.; Gong, L.-X.; Yan, D.; Li, Y.-B.; Wu, L.-B.; Jiang, J.-X.; Lai, G.-Q. Grafting of epoxy chains onto graphene oxide for epoxy composites with improved mechanical and thermal properties. Carbon 2014, 69, 467–480. [Google Scholar] [CrossRef]
- Li, Z.; Young, R.J.; Wang, R.; Yang, F.; Hao, L.; Jiao, W.; Liu, W. The role of functional groups on graphene oxide in epoxy nanocomposites. Polymer 2013, 54, 5821–5829. [Google Scholar] [CrossRef]
- Li, W.; Shang, T.; Yang, W.; Yang, H.; Lin, S.; Jia, X.; Cai, Q.; Yang, X. Effectively Exerting the Reinforcement of Dopamine Reduced Graphene Oxide on Epoxy-Based Composites via Strengthened Interfacial Bonding. ACS Appl. Mater. Interfaces 2016, 8, 13037–13050. [Google Scholar] [CrossRef] [PubMed]
- Li, P.; Zheng, Y.; Shi, T.; Wang, Y.; Li, M.; Chen, C.; Zhang, J. A solvent-free graphene oxide nanoribbon colloid as filler phase for epoxy-matrix composites with enhanced mechanical, thermal and tribological performance. Carbon 2016, 96, 40–48. [Google Scholar] [CrossRef]
- Tang, L.-C.; Wan, Y.-J.; Yan, D.; Pei, Y.-B.; Zhao, L.; Li, Y.-B.; Wu, L.-B.; Jiang, J.-X.; Lai, G.-Q. The effect of graphene dispersion on the mechanical properties of graphene/epoxy composites. Carbon 2013, 60, 16–27. [Google Scholar] [CrossRef]
- Wang, X.; Liu, X.; Yuan, H.; Liu, H.; Liu, H.; Li, T.; Yan, C.; Yan, X.; Shen, C.; Guo, Z. Non-covalently functionalized graphene strengthened poly (vinyl alcohol). Mater. Des. 2018, 139, 372–379. [Google Scholar] [CrossRef]
- Kumar, S.K.; Benicewicz, B.C.; Vaia, R.A.; Winey, K.I. 50th Anniversary Perspective: Are Polymer Nanocomposites Practical for Applications? Macromolecules 2017, 50, 714–731. [Google Scholar] [CrossRef]
- Potts, J.R.; Dreyer, D.R.; Bielawski, C.W.; Ruoff, R.S. Graphene-based polymer nanocomposites. Polymer 2011, 52, 5–25. [Google Scholar] [CrossRef] [Green Version]
- Bortz, D.R.; Heras, E.G.; Martin-Gullon, I. Impressive Fatigue Life and Fracture Toughness Improvements in Graphene Oxide/Epoxy Composites. Macromolecules 2012, 45, 238–245. [Google Scholar] [CrossRef]
- Argüelles, A.; Viña, J.; Rubiera, S.; Viña, I.; Bonhomme, J.; Mollón, V. A study of the effects of the matrix epoxy resin and graphene oxide (GO) manufacturing process on the tensile behaviour of GO-epoxy nanocomposites. Plast. Rubber Compos. 2017, 46, 405–412. [Google Scholar] [CrossRef]
- Vallés, C.; Beckert, F.; Burk, L.; Mülhaupt, R.; Young, R.J.; Kinloch, I.A. Effect of the C/O Ratio in Graphene Oxide Materials on the Reinforcement of Epoxy-Based Nanocomposites. J. Polym. Sci. Part B Polym. Phys. 2016, 54, 281–291. [Google Scholar] [CrossRef]
- Bao, C.; Guo, Y.; Song, L.; Kan, Y.; Qian, X.; Hu, Y. In situ preparation of functionalized graphene oxide/epoxy nanocomposites with effective reinforcements. J. Mater. Chem. 2011, 21, 13290–13298. [Google Scholar] [CrossRef]
- Lau, K.-T.; Lu, M.; Lam, C.-K.; Cheung, H.-Y.; Sheng, F.-L.; Li, H.-L. Thermal and mechanical properties of single-walled carbon nanotube bundle-reinforced epoxy nanocomposites: The role of solvent for nanotube dispersion. Compos. Sci. Technol. 2005, 65, 719–725. [Google Scholar] [CrossRef]
- Ampreg 21 Fast Hardener Safety Datasheet; Gurit: Brampton, ON, Canada, 2017.
- Grupo Antolín. Available online: www.grupoantolin.com (accessed on 23 September 2019).
- Varela-Rizo, H.; Rodriguez-Pastor, I.; Merino, C.; Martin-Gullon, I. Highly crystalline graphene oxide nano-platelets produced from helical-ribbon carbon nanofibers. Carbon 2010, 48, 3640–3643. [Google Scholar] [CrossRef]
- Frontiñán-Rubio, J.; Gómez, M.V.; Martín, C.; González-Domínguez, J.M.; Durán-Prado, M.; Vázquez, E. Differential effects of graphene materials on the metabolism and function of human skin cells. Nanoscale 2018, 10, 11604–11615. [Google Scholar] [CrossRef] [PubMed] [Green Version]
- León, V.; González-Domínguez, J.M.; Fierro, J.L.G.; Prato, M.; Vázquez, E. Production and stability of mechanochemically exfoliated graphene in water and culture media. Nanoscale 2016, 8, 14548–14555. [Google Scholar] [CrossRef] [PubMed] [Green Version]
- Serna Moreno, M.C.; Romero Gutiérrez, A.; Martínez Vicente, J.L. Different response under tension and compression of unidirectional carbon fibre laminates in a three-point bending test. Compos. Struct. 2016, 136, 706–711. [Google Scholar] [CrossRef]
- Serna Moreno, M.C.; Romero Gutiérrez, A.; Martínez Vicente, J.L. First flexural and interlaminar shear failure in symmetric cross-ply carbon-fibre laminates with different response under tension and compression. Compos. Struct. 2016, 146, 62–68. [Google Scholar] [CrossRef]
- Serna Moreno, M.C.; Horta Muñoz, S.; Romero Gutiérrez, A.; Rappold, C.; Martínez Vicente, J.L.; Morales-Rodríguez, P.A.; López Cela, J.J. Pseudo-ductility in flexural testing of symmetric ±45° angle-ply CFRP laminates. Compos. Sci. Technol. 2018, 156, 8–18. [Google Scholar] [CrossRef]
- ASTM D695-15. In Standard Test Method for Compressive Properties of Rigid Plastics; ASTM International: West Conshohocken, PA, USA, 2015.
- Gilabert, F.A.; Garoz, D.; Van Paepegem, W. Macro- and micro-modeling of crack propagation in encapsulation-based self-healing materials: Application of XFEM and cohesive surface techniques. Mater. Des. 2017, 130, 459–478. [Google Scholar] [CrossRef] [Green Version]
- Serna Moreno, M.C.; Curiel-Sosa, J.L.; Navarro-Zafra, J.; Martínez Vicente, J.L.; López Cela, J.J. Crack propagation in a chopped glass-reinforced composite under biaxial testing by means of XFEM. Compos. Struct. 2015, 119, 264–271. [Google Scholar] [CrossRef]
- Abaqus 2018 Documentation; Dassault Systèmes: Vélizy-Villacoublay, France, 2018.
- Rafiee, M.A.; Lu, W.; Thomas, A.V.; Zandiatashbar, A.; Rafiee, J.; Tour, J.M.; Koratkar, N.A. Graphene Nanoribbon Composites. ACS Nano 2010, 4, 7415–7420. [Google Scholar] [CrossRef]
- Forati, T.; Atai, M.; Rashidi, A.M.; Imani, M.; Behnamghader, A. Physical and mechanical properties of graphene oxide/polyethersulfone nanocomposites. Polym. Adv. Technol. 2014, 25, 322–328. [Google Scholar] [CrossRef]
- Jones, R.M. Apparent Flexural Modulus and Strength of Multimodulus Materials. J. Compos. Mater. 1976, 10, 342–354. [Google Scholar] [CrossRef]
- Chen, J.; Kinloch, A.J.; Sprenger, S.; Taylor, A.C. The mechanical properties and toughening mechanisms of an epoxy polymer modified with polysiloxane-based core-shell particles. Polymer 2013, 54, 4276–4289. [Google Scholar] [CrossRef] [Green Version]
- Hsieh, T.H.; Kinloch, A.J.; Masania, K.; Sohn Lee, J.; Taylor, A.C.; Sprenger, S. The toughness of epoxy polymers and fibre composites modified with rubber microparticles and silica nanoparticles. J. Mater. Sci. 2010, 45, 1193–1210. [Google Scholar] [CrossRef]


| Material Denomination | Composition | |
|---|---|---|
| Blank | 100.0 wt % epoxy | - |
| 0.1 wt % GO | 99.9 wt % epoxy | 0.1 wt % GO |
| 0.2 wt % GO | 99.8 wt % epoxy | 0.2 wt % GO |
| 0.3 wt % GO | 99.7 wt % epoxy | 0.3 wt % GO |
| 0.5 wt % GO | 99.5 wt % epoxy | 0.5 wt % GO |
| 0.3 wt % Graphite | 99.7 wt % epoxy | 0.3 wt % Graphite |
| Et (GPa) | Ec (GPa) | ν | (kN/m) | ||
|---|---|---|---|---|---|
| 3.10 | 3.63 | 0.43 | 110.43 | 0.05 | 27.6 |
| Material | σt (MPa) | σc (MPa) 1 |
|---|---|---|
| Blank | 110.43 ± 5.68 | 119.45 ± 6.18 |
| 0.1 wt % GO | 100.52 ± 3.30 | 121.67 ± 4.37 |
| 0.2 wt % GO | 97.41 ± 3.66 | 122.78 ± 4.45 |
| 0.3 wt % GO | 94.50 ± 2.93 | 123.15 ± 4.28 |
| 0.5 wt % GO | 75.90 ± 5.44 | 103.70 ± 7.22 |
| 0.3% Graphite | 88.23 ± 4.92 | 103.83 ± 5.80 |
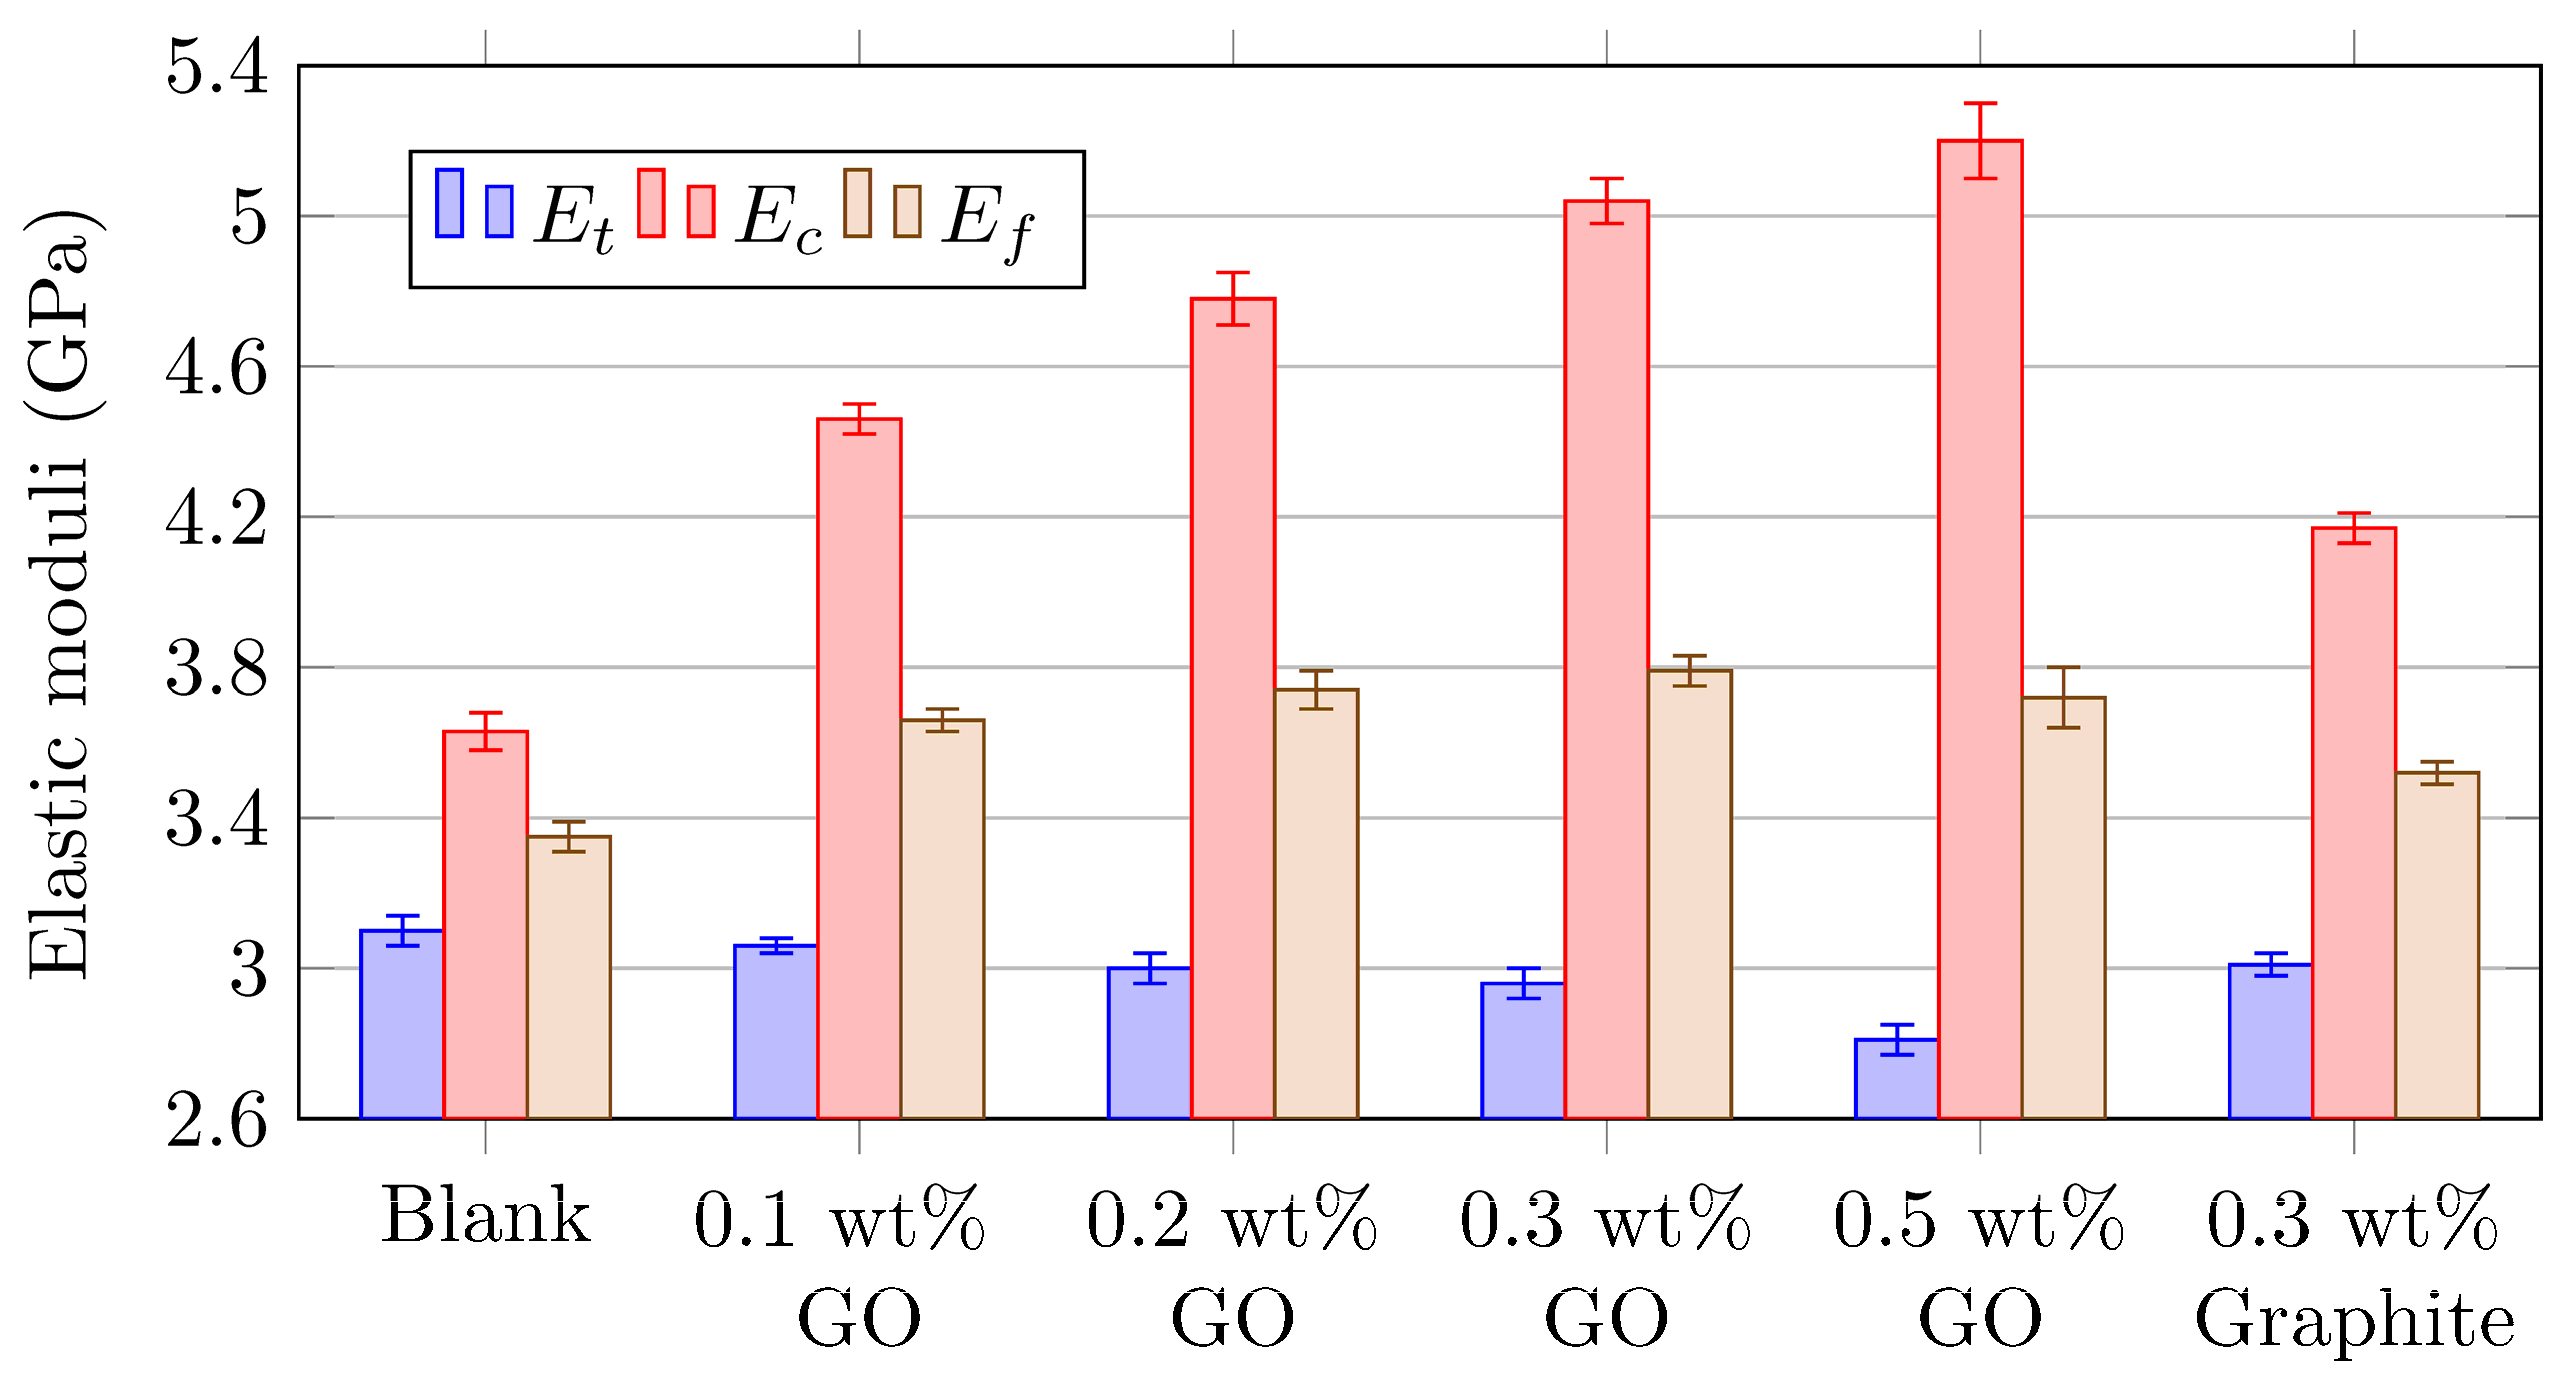
| Material | Et (GPa) | Ec (GPa) | Ef (GPa) |
|---|---|---|---|
| Blank | 3.10 ± 0.04 | 3.63 ± 0.05 | 3.35 ± 0.04 |
| 0.1 wt % GO | 3.06 ± 0.02 | 4.46 ± 0.04 | 3.66 ± 0.03 |
| 0.2 wt % GO | 3.00 ± 0.04 | 4.78 ± 0.07 | 3.74 ± 0.05 |
| 0.3 wt % GO | 2.96 ± 0.04 | 5.04 ± 0.06 | 3.79 ± 0.04 |
| 0.5 wt % GO | 2.81 ± 0.04 | 5.20 ± 0.10 | 3.72 ± 0.08 |
| 0.3% Graphite | 3.01 ± 0.03 | 4.17 ± 0.04 | 3.52 ± 0.03 |
© 2019 by the authors. Licensee MDPI, Basel, Switzerland. This article is an open access article distributed under the terms and conditions of the Creative Commons Attribution (CC BY) license (http://creativecommons.org/licenses/by/4.0/).
Share and Cite
Horta Muñoz, S.; Serna Moreno, M.d.C.; González-Domínguez, J.M.; Morales-Rodríguez, P.A.; Vázquez, E. Experimental, Numerical, and Analytical Study on The Effect of Graphene Oxide in The Mechanical Properties of a Solvent-Free Reinforced Epoxy Resin. Polymers 2019, 11, 2115. https://doi.org/10.3390/polym11122115
Horta Muñoz S, Serna Moreno MdC, González-Domínguez JM, Morales-Rodríguez PA, Vázquez E. Experimental, Numerical, and Analytical Study on The Effect of Graphene Oxide in The Mechanical Properties of a Solvent-Free Reinforced Epoxy Resin. Polymers. 2019; 11(12):2115. https://doi.org/10.3390/polym11122115
Chicago/Turabian StyleHorta Muñoz, Sergio, María del Carmen Serna Moreno, José Miguel González-Domínguez, Pablo Antonio Morales-Rodríguez, and Ester Vázquez. 2019. "Experimental, Numerical, and Analytical Study on The Effect of Graphene Oxide in The Mechanical Properties of a Solvent-Free Reinforced Epoxy Resin" Polymers 11, no. 12: 2115. https://doi.org/10.3390/polym11122115