
Data Mining of Polymer Phase Transitions upon Temperature Changes by Small and Wide-Angle X-ray Scattering Combined with Raman Spectroscopy

 ,
,  ,
,  and
and 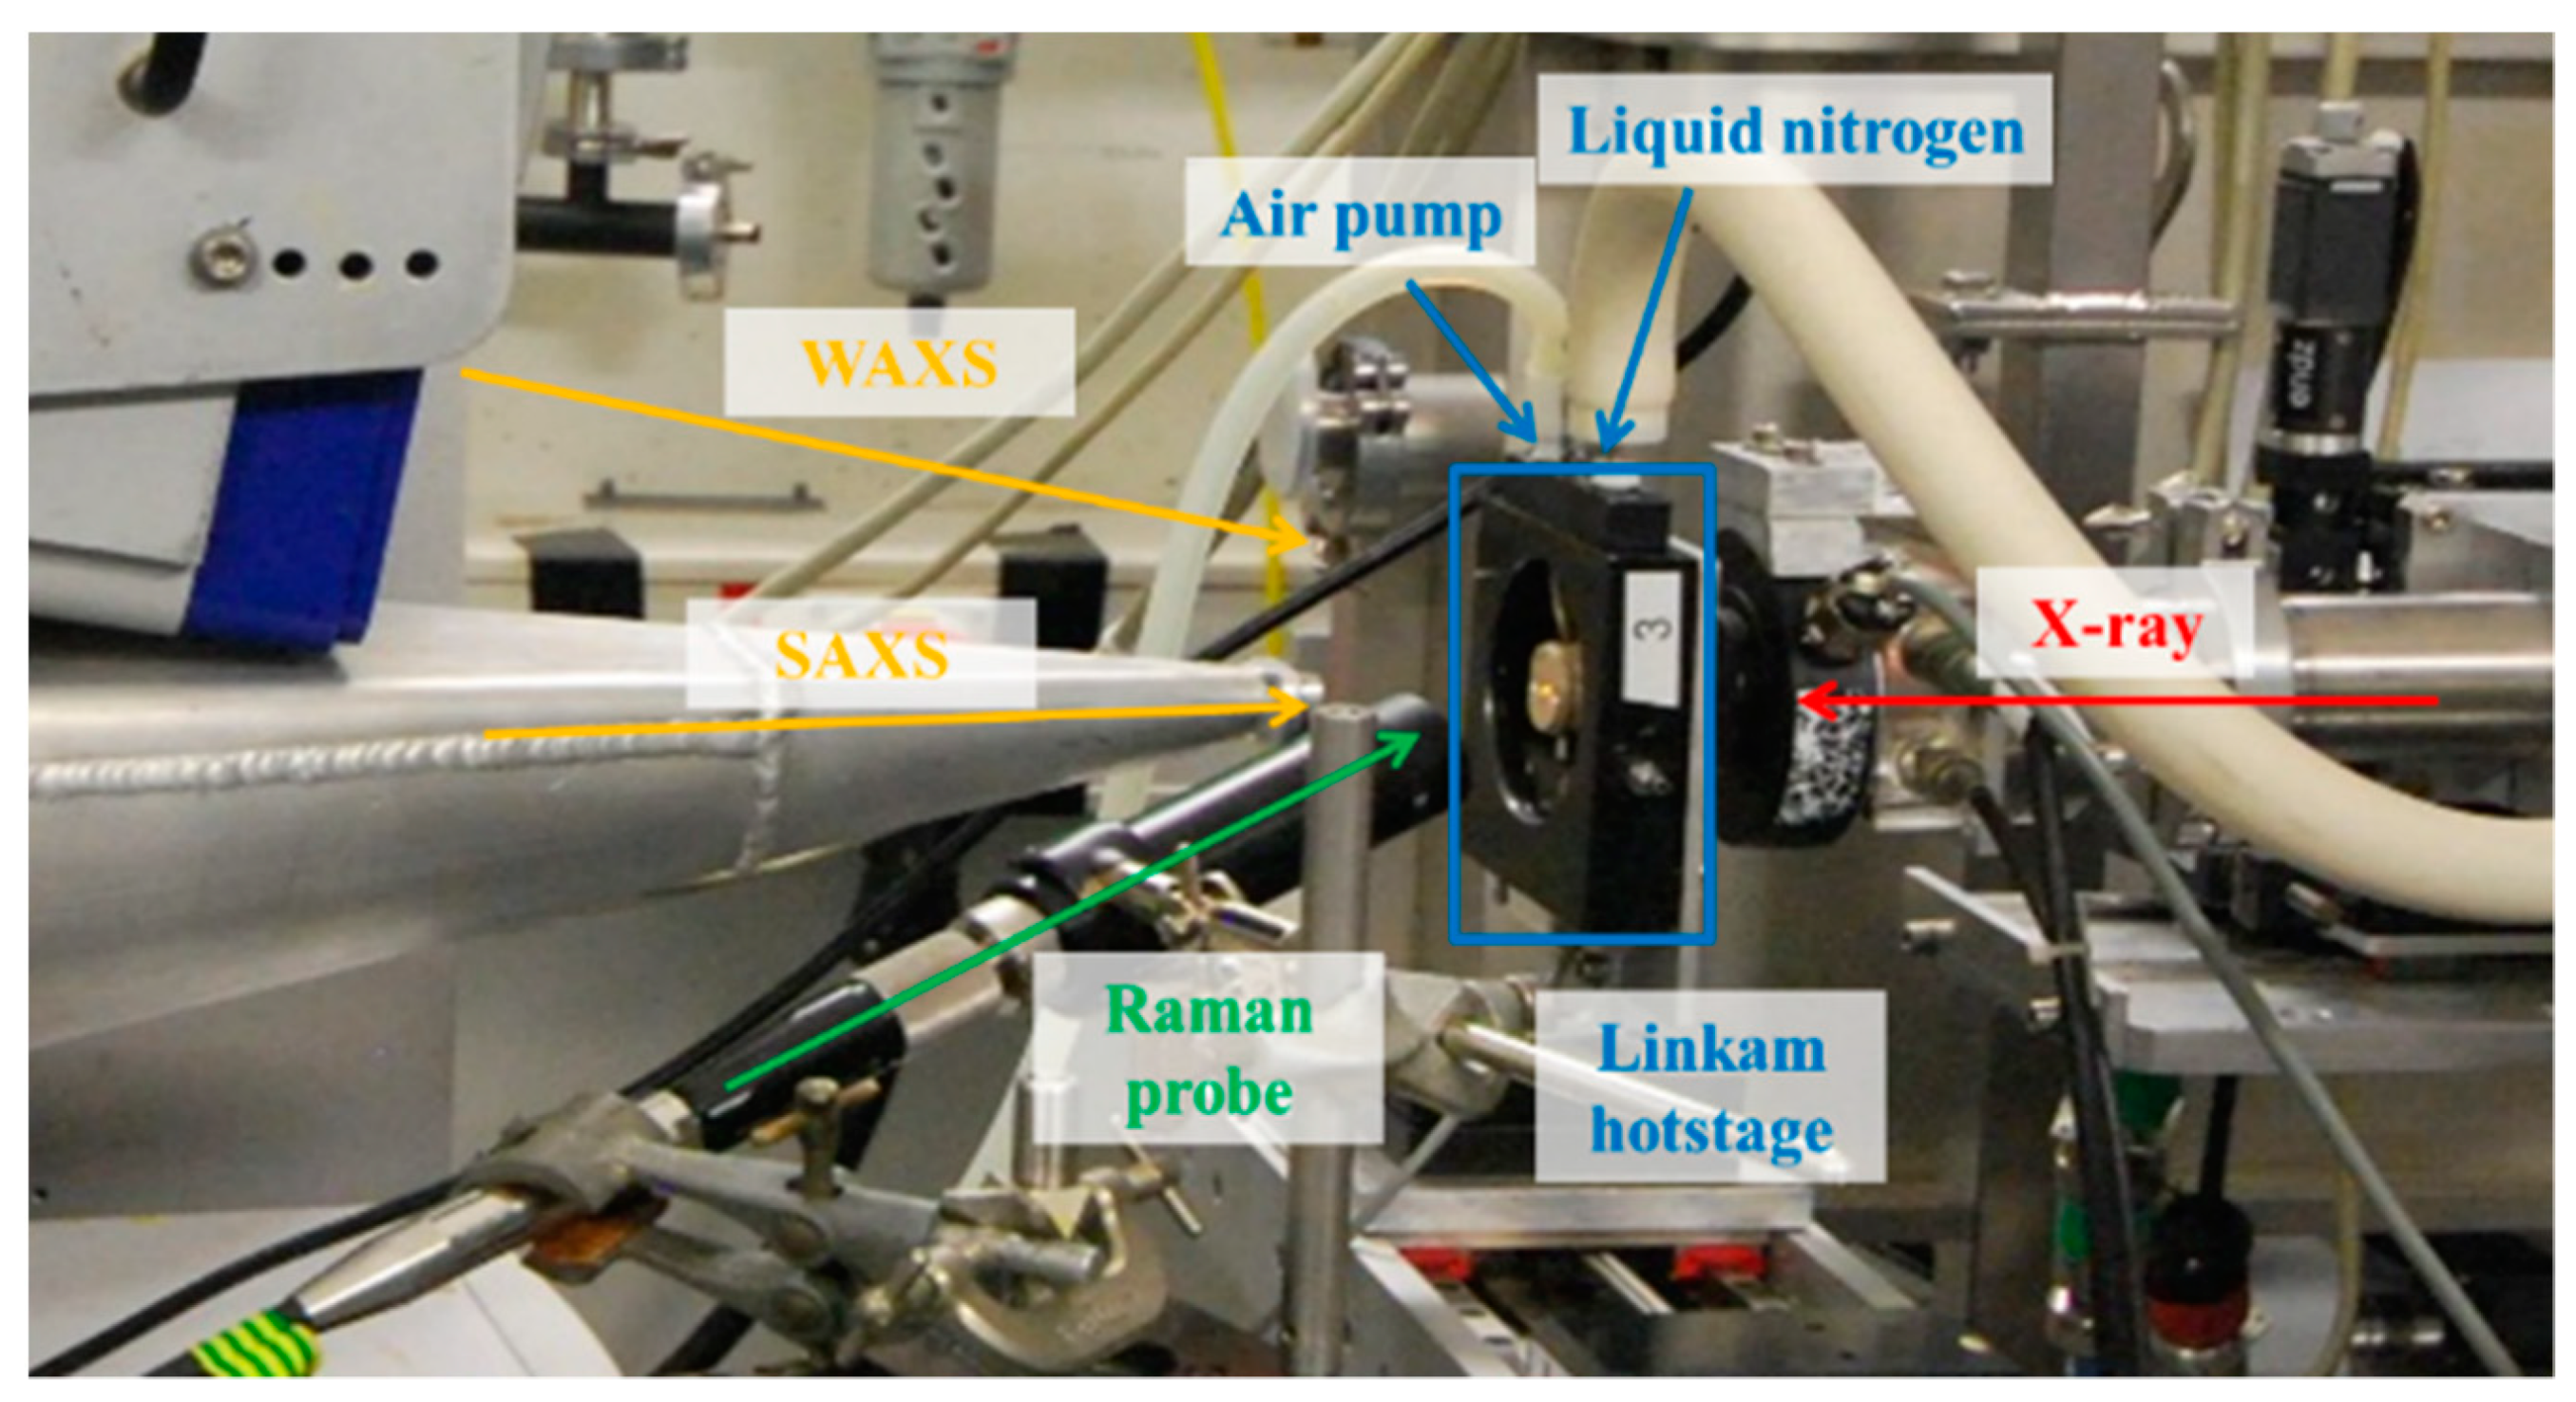
Abstract
:1. Introduction
2. Experimental Section
2.1. Materials
2.2. Raman Spectroscopy Combined with Simultaneous SAXS/WAXS Coupled to DSC
2.3. Multivariate Analysis
3. Results and Discussion
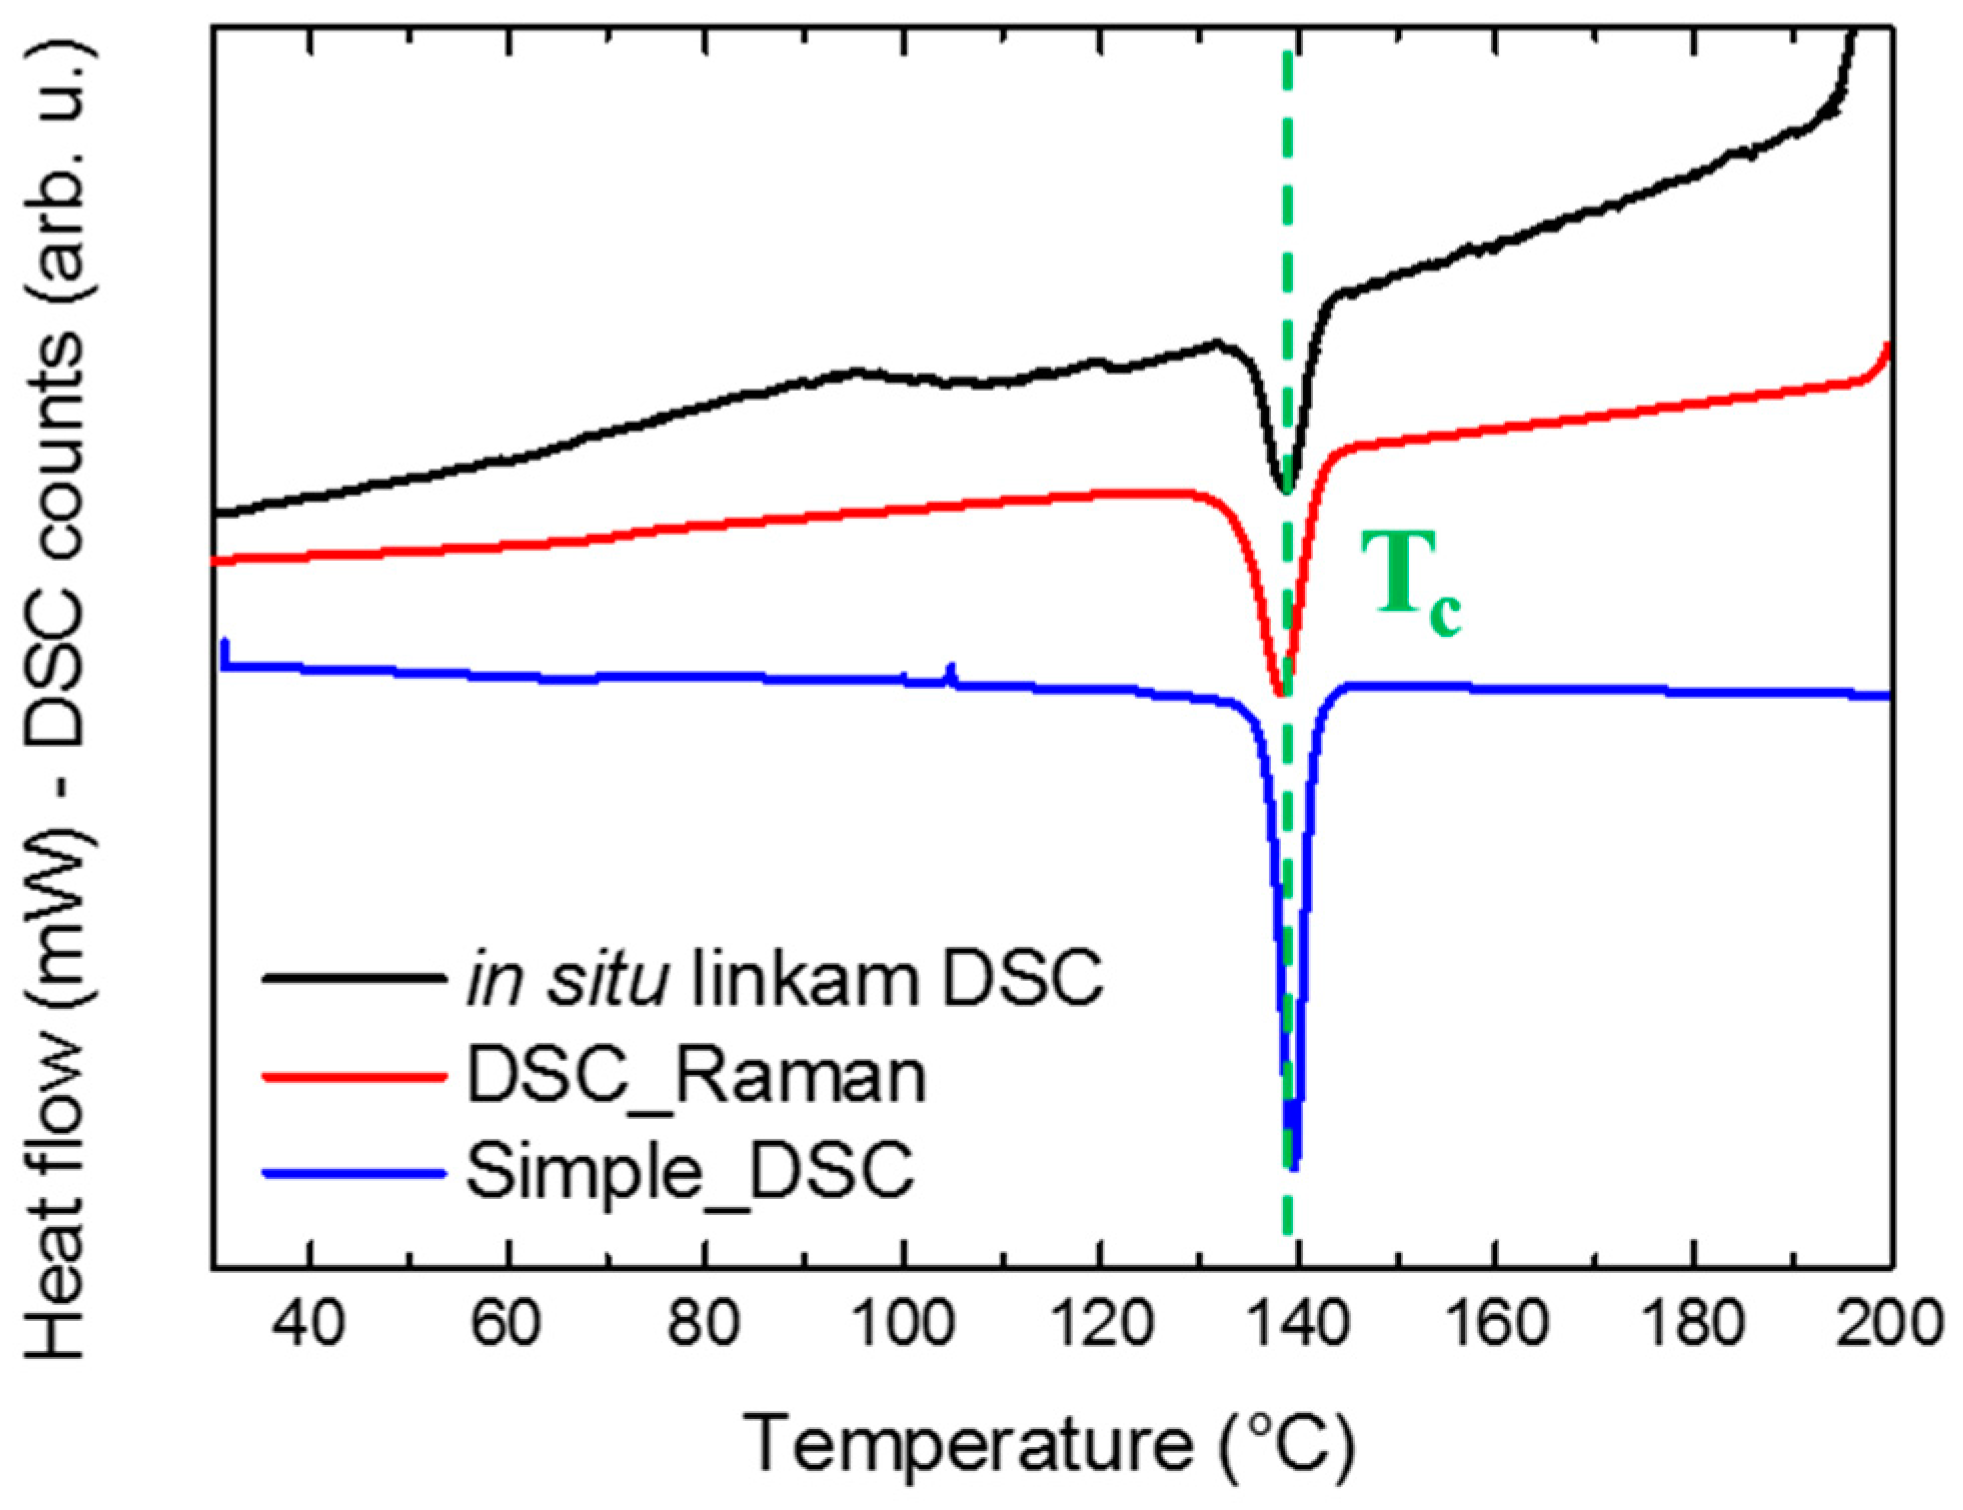
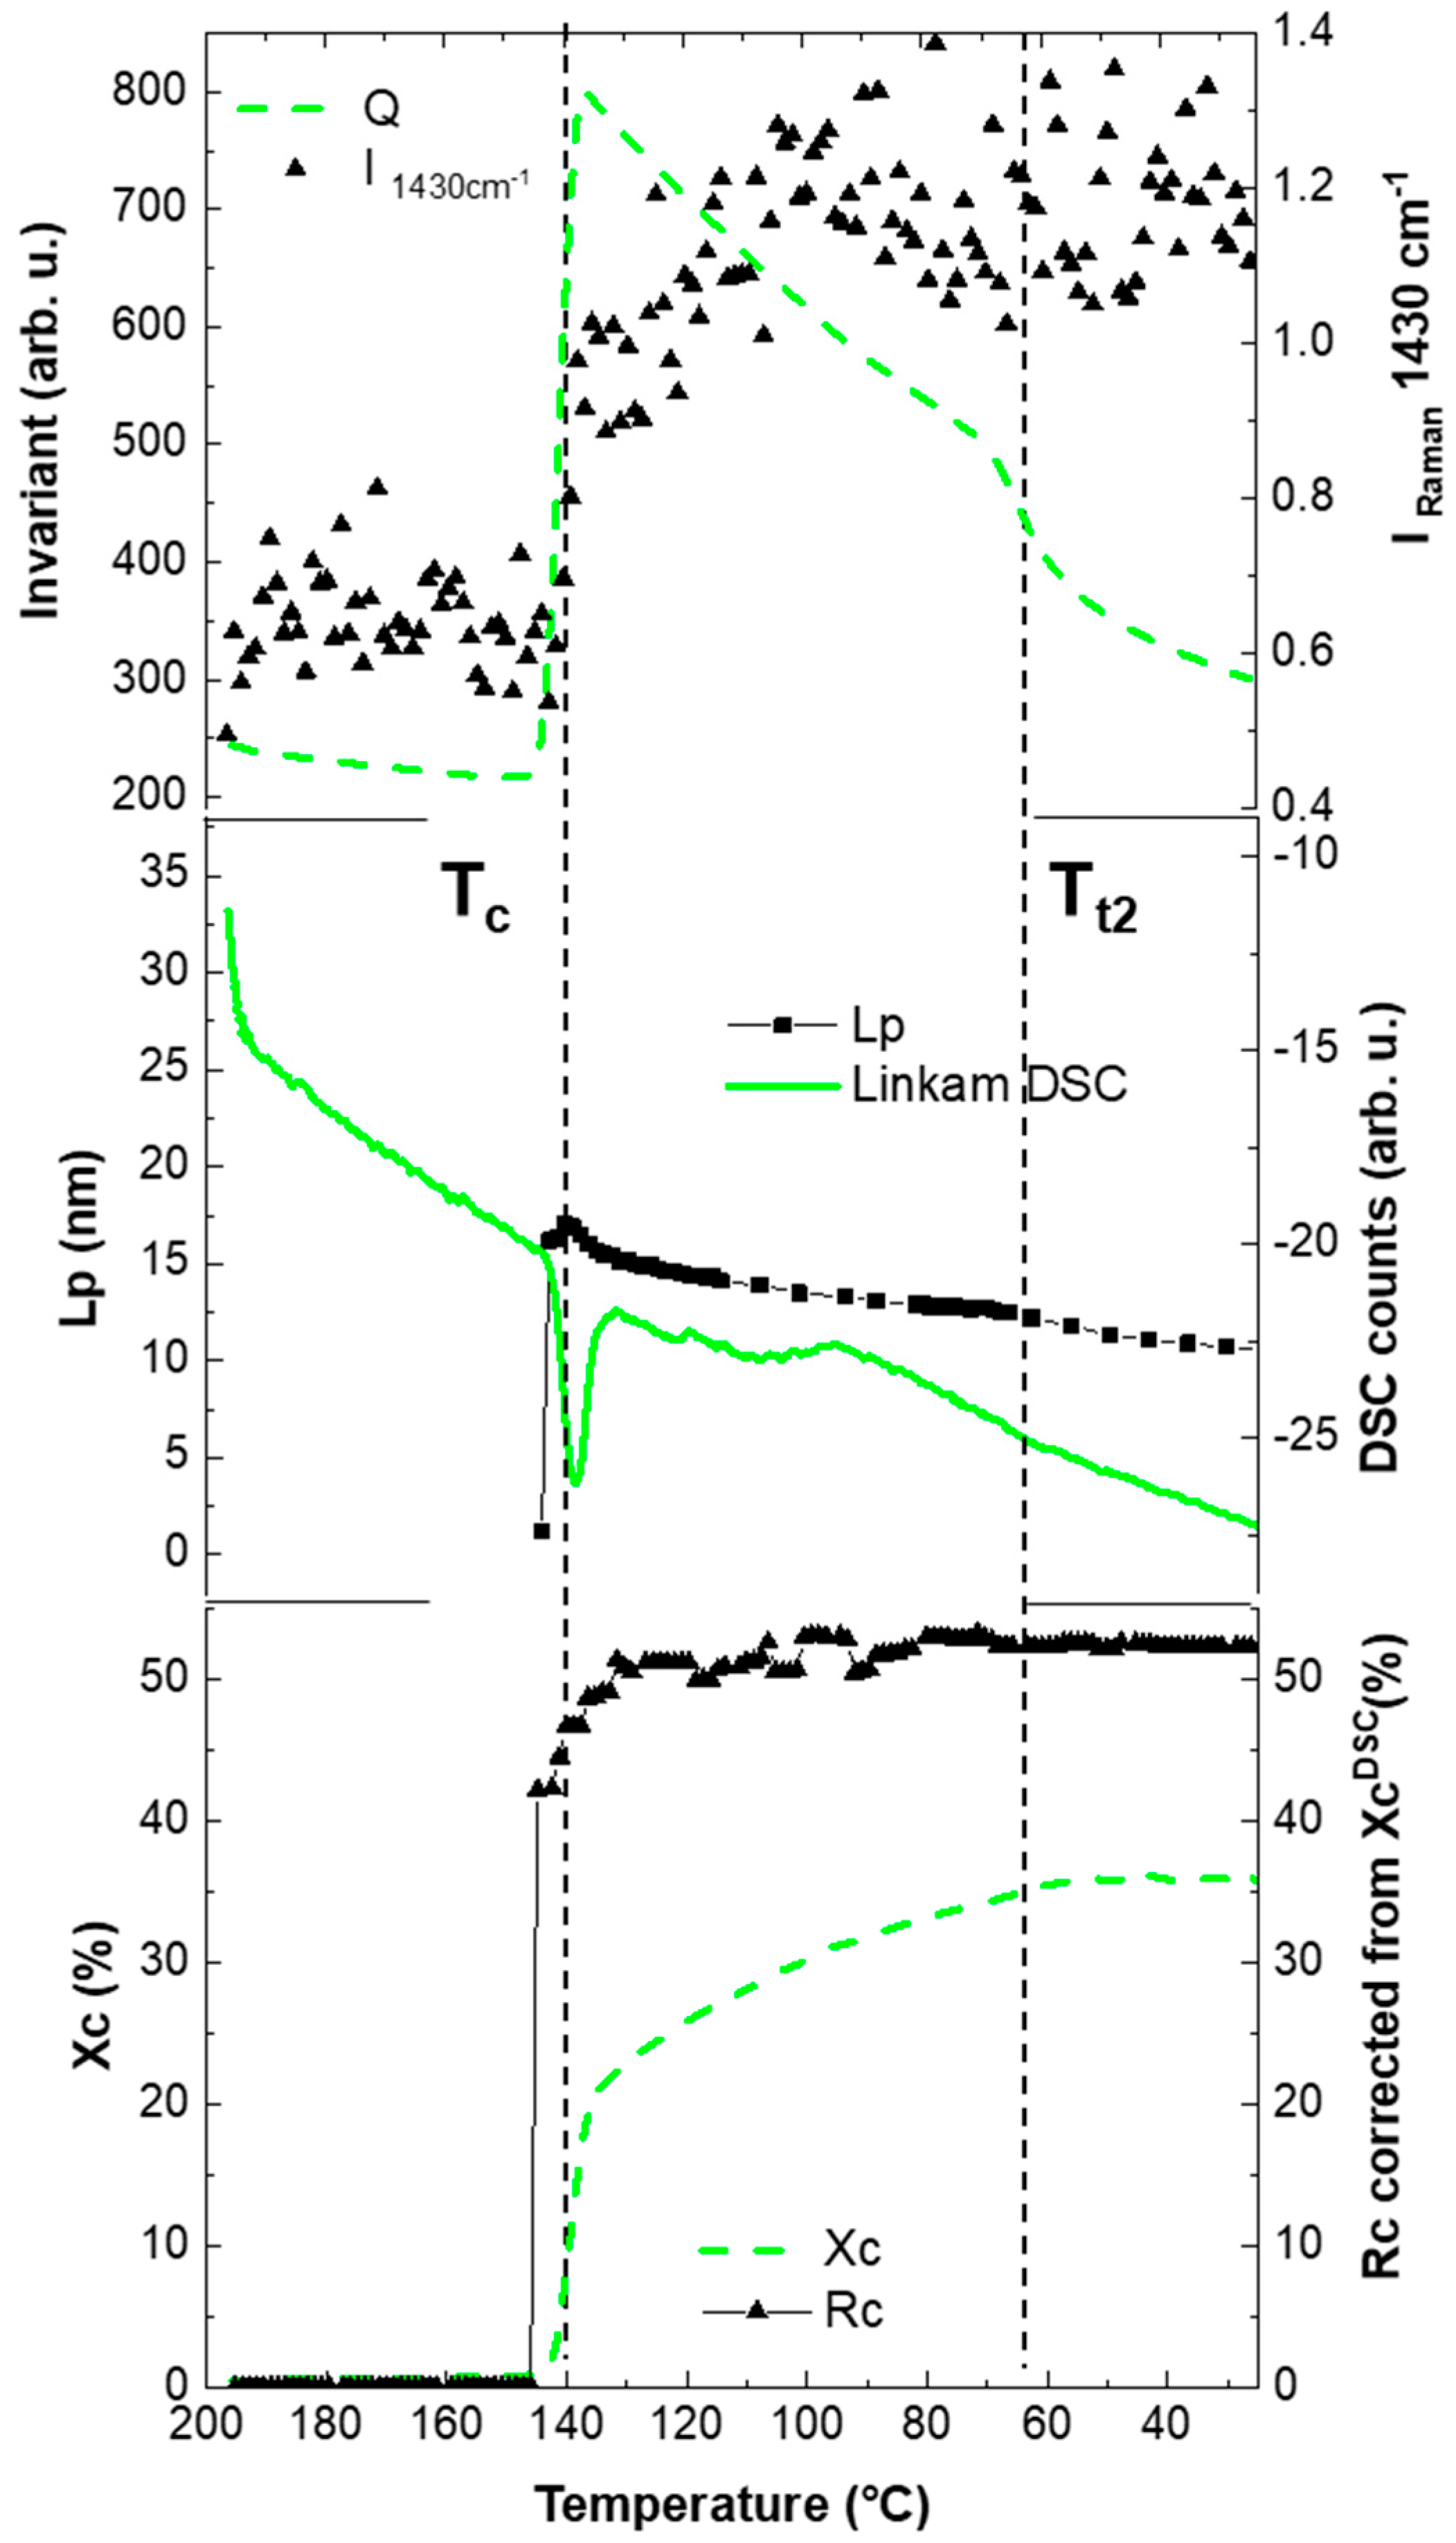
3.1. Combined Analysis
3.2. Correlation Data: Chemometrics
4. Conclusions
Supplementary Materials
Author Contributions
Funding
Acknowledgments
Conflicts of Interest
References
- Portale, G.; Hermida-Merino, D.; Bras, W. Polymer Research and Synchrotron Radiation Perspectives. Eur. Polym. J. 2016, 81, 415–432. [Google Scholar] [CrossRef]
- Hexemer, A.; Bras, W.; Glossinger, J.; Schaible, E.; Gann, E.; Kirian, R.; MacDowell, A.; Church, M.; Rude, B.; Padmore, H. A SAXS/WAXS/GISAXS Beamline with Multilayer Monochromator. J. Phys. Conf. Ser. 2010, 247, 012007. [Google Scholar] [CrossRef]
- Smith, A.J.; Alcock, S.G.; Davidson, L.S.; Emmins, J.H.; Hiller Bardsley, J.C.; Holloway, P.; Malfois, M.; Marshall, A.R.; Pizzey, C.L.; Rogers, S.E.; et al. I22: SAXS/WAXS Beamline at Diamond Light Source—An Overview of 10 Years Operation. J. Synchrotron Rad. 2021, 28, 939–947. [Google Scholar] [CrossRef]
- Amenitsch, H.; Bernstorff, S.; Kriechbaum, M.; Lombardo, D.; Mio, H.; Rappolt, M.; Laggner, P. Performance and First Results of the ELETTRA High-Flux Beamline for Small-Angle X-ray Scattering. J. Appl. Cryst. 1997, 30, 872–876. [Google Scholar] [CrossRef]
- Narayanan, T.; Wacklin, H.; Konovalov, O.; Lund, R. Recent Applications of Synchrotron Radiation and Neutrons in the Study of Soft Matter. Crystallogr. Rev. 2017, 23, 160–226. [Google Scholar] [CrossRef]
- Bras, W.; Dolbnya, I.P.; Detollenaere, D.; van Tol, R.; Malfois, M.; Greaves, G.N.; Ryan, A.J.; Heeley, E. Recent Experiments on a Small-Angle/Wide-Angle X-ray Scattering Beam Line at the ESRF. J. Appl. Crystallogr. 2003, 36, 791–794. [Google Scholar] [CrossRef] [Green Version]
- Portale, G.; Cavallo, D.; Alfonso, G.C.; Hermida-Merino, D.; van Drongelen, M.; Balzano, L.; Peters, G.; Goossens, J.; Bras, W. Polymer Crystallization Studies under Processing-Relevant Conditions at the SAXS/WAXS DUBBLE Beamline at the ESRF. J. Appl. Crystallogr. 2013, 46, 1681–1689. [Google Scholar] [CrossRef] [Green Version]
- Russell, T.P.; Koberstein, J.T. Simultaneous Differential Scanning Calorimetry and Small-Angle X-ray Scattering. J. Polym. Sci. Polym. Phys. Ed. 1985, 23, 1109–1115. [Google Scholar] [CrossRef]
- Bras, W.; Derbyshire, G.E.; Bogg, D.; Cooke, J.; Elwell, M.J.; Komanschek, B.U.; Naylor, S.; Ryan, A.J. Simultaneous Studies of Reaction Kinetics and Structure Development in Polymer Processing. Science 1995, 267, 996–999. [Google Scholar] [CrossRef]
- Ryan, A.J.; Bras, W.; Hermida-Merino, D.; Cavallo, D. The Interaction between Fundamental and Industrial Research and Experimental Developments in the Field of Polymer Crystallization. J. Non-Cryst. Solids 2016, 451, 168–178. [Google Scholar] [CrossRef]
- Van Franeker, J.J.; Hermida-Merino, D.; Gommes, C.; Arapov, K.; Michels, J.J.; Janssen, R.A.J.; Portale, G. Sub-Micrometer Structure Formation during Spin Coating Revealed by Time-Resolved In Situ Laser and X-ray Scattering. Adv. Funct. Mater. 2017, 27, 1702516. [Google Scholar] [CrossRef]
- Fleury, G.; Hermida-Merino, D.; Jingjin, D.; Aissou, K.; Bytchkov, A.; Portale, G. Micellar-Mediated Block Copolymer Ordering Dynamics Revealed by In Situ Grazing Incidence Small-Angle X-ray Scattering during Spin Coating. Adv. Funct. Mater. 2019, 29, 1806741. [Google Scholar] [CrossRef]
- Dong, J.; Shao, S.; Kahmann, S.; Rommens, A.J.; Hermida-Merino, D.; ten Brink, G.H.; Loi, M.A.; Portale, G. Mechanism of Crystal Formation in Ruddlesden–Popper Sn-Based Perovskites. Adv. Funct. Mater. 2020, 30, 2001294. [Google Scholar] [CrossRef]
- Hermida-Merino, D.; Portale, G.; Fields, P.; Wilson, R.; Bassett, S.P.; Jennings, J.; Dellar, M.; Gommes, C.; Howdle, S.M.; Vrolijk, B.C.M.; et al. A High Pressure Cell for Supercritical CO2 On-Line Chemical Reactions Studied with X-ray Techniques. Rev. Sci. Instrum. 2014, 85, 093905. [Google Scholar] [CrossRef]
- Alaimo, D.; Hermida Merino, D.; Grignard, B.; Bras, W.; Jérôme, C.; Debuigne, A.; Gommes, C.J. Small-Angle X-ray Scattering Insights into the Architecture-Dependent Emulsifying Properties of Amphiphilic Copolymers in Supercritical Carbon Dioxide. J. Phys. Chem. B 2015, 119, 1706–1716. [Google Scholar] [CrossRef] [PubMed]
- Alauhdin, M.; Bennett, T.M.; He, G.; Bassett, S.P.; Portale, G.; Bras, W.; Hermida-Merino, D.; Howdle, S.M. Monitoring Morphology Evolution within Block Copolymer Microparticles during Dispersion Polymerisation in Supercritical Carbon Dioxide: A High Pressure SAXS Study. Polym. Chem. 2019, 10, 860–871. [Google Scholar] [CrossRef]
- Jennings, J.; Bassett, S.P.; Hermida-Merino, D.; Portale, G.; Bras, W.; Knight, L.; Titman, J.J.; Higuchi, T.; Jinnai, H.; Howdle, S.M. How Does Dense Phase CO2 Influence the Phase Behaviour of Block Copolymers Synthesised by Dispersion Polymerisation? Polym. Chem. 2016, 7, 905–916. [Google Scholar] [CrossRef] [Green Version]
- Nogales, A.; Gutiérrez-Fernández, E.; García-Gutiérrez, M.-C.; Ezquerra, T.A.; Rebollar, E.; Šics, I.; Malfois, M.; Gaidukovs, S.; Gēcis, E.; Celms, K.; et al. Structure Development in Polymers during Fused Filament Fabrication (FFF): An in Situ Small- and Wide-Angle X-ray Scattering Study Using Synchrotron Radiation. Macromolecules 2019, 52, 9715–9723. [Google Scholar] [CrossRef]
- Shmueli, Y.; Lin, Y.-C.; Zuo, X.; Guo, Y.; Lee, S.; Freychet, G.; Zhernenkov, M.; Kim, T.; Tannenbaum, R.; Marom, G.; et al. In-Situ X-ray Scattering Study of Isotactic Polypropylene/Graphene Nanocomposites under Shear during Fused Deposition Modeling 3D Printing. Compos. Sci. Technol. 2020, 196, 108227. [Google Scholar] [CrossRef]
- Hejmady, P.; Cleven, L.C.; van Breemen, L.C.A.; Anderson, P.D.; Cardinaels, R. A Novel Experimental Setup for in Situ Optical and X-ray Imaging of Laser Sintering of Polymer Particles. Rev. Sci. Instrum. 2019, 90, 083905. [Google Scholar] [CrossRef]
- Balzano, L.; Cavallo, D.; Van Erp, T.B.; Ma, Z.; Housmans, J.-W.; Fernandez-Ballester, L.; Peters, G.W.M. Dynamics of Fibrillar Precursors of Shishes as a Function of Stress. IOP Conf. Ser. Mater. Sci. Eng. 2010, 14, 012005. [Google Scholar] [CrossRef] [Green Version]
- Ma, Z.; Balzano, L.; Peters, G.W.M. Pressure Quench of Flow-Induced Crystallization Precursors. Macromolecules 2012, 45, 4216–4224. [Google Scholar] [CrossRef] [Green Version]
- Troisi, E.; Portale, G.; Ma, Z.; van Drongelen, M.; Hermida-Merino, D.; Peters, G. Unusual Melting Behavior in Flow Induced Crystallization of LLDPE: Effect of Pressure. Macromolecules 2015, 48, 2551–2560. [Google Scholar] [CrossRef]
- Wilsens, C.H.; Hawke, L.G.; Troisi, E.M.; Hermida-Merino, D.; de Kort, G.; Leoné, N.; Saralidze, K.; Peters, G.W.; Rastogi, S. Effect of Self-Assembly of Oxalamide Based Organic Compounds on Melt Behavior, Nucleation, and Crystallization of Isotactic Polypropylene. Macromolecules 2018, 51, 4882–4895. [Google Scholar] [CrossRef] [PubMed]
- Wilsens, C.H.R.M.; Hawke, L.G.D.; de Kort, G.W.; Saidi, S.; Roy, M.; Leoné, N.; Hermida-Merino, D.; Peters, G.W.M.; Rastogi, S. Effect of Thermal History and Shear on the Viscoelastic Response of IPP Containing an Oxalamide-Based Organic Compound. Macromolecules 2019, 52, 2789–2802. [Google Scholar] [CrossRef] [PubMed] [Green Version]
- Pepe, J.; Cleven, L.C.; Suijkerbuijk, E.J.M.C.; Dekkers, E.C.A.; Hermida-Merino, D.; Cardinaels, R.; Peters, G.W.M.; Anderson, P.D. A Filament Stretching Rheometer for in Situ X-ray Experiments: Combining Rheology and Crystalline Morphology Characterization. Rev. Sci. Instrum. 2020, 91, 073903. [Google Scholar] [CrossRef]
- Liao, T.; Zhao, X.; Yang, X.; Coates, P.; Whiteside, B.; Barker, D.; Thompson, G.; Lai, Y.; Jiang, Z.; Men, Y. In Situ Synchrotron Small Angle X-ray Scattering Investigation of Structural Formation of Polyethylene upon Micro-Injection Molding. Polymer 2021, 215, 123390. [Google Scholar] [CrossRef]
- van Drongelen, M.; Cavallo, D.; Balzano, L.; Portale, G.; Vittorias, I.; Bras, W.; Alfonso, G.C.; Peters, G.W. Structure Development of Low-Density Polyethylenes during Film Blowing: A Real-Time Wide-Angle X-ray Diffraction Study. Macromol. Mater. Eng. 2014, 299, 1494–1512. [Google Scholar] [CrossRef] [Green Version]
- Troisi, E.M.; Formenti, S.; Briatico-Vangosa, F.; Cavallo, D.; Peters, G.W. Nucleation Induced by “Short-Term Pressurization” of an Undercooled Isotactic Polypropylene Melt. Eur. Polym. J. 2016, 85, 553–563. [Google Scholar] [CrossRef]
- Bras, W.; Koizumi, S.; Terrill, N.J. Beyond Simple Small-Angle X-ray Scattering: Developments in Online Complementary Techniques and Sample Environments. IUCrJ 2014, 1, 478–491. [Google Scholar] [CrossRef] [Green Version]
- Bryant, G.K.; Gleeson, H.F.; Ryan, A.J.; Fairclough, J.P.A.; Bogg, D.; Goossens, J.G.P.; Bras, W. Raman Spectroscopy Combined with Small Angle X-ray Scattering and Wide Angle X-ray Scattering as a Tool for the Study of Phase Transitions in Polymers. Rev. Sci. Instrum. 1998, 69, 2114–2117. [Google Scholar] [CrossRef] [Green Version]
- Chen, X.; Wang, J.; Pan, R.; Roth, S.; Förster, S. Insights into Growth Kinetics of Colloidal Gold Nanoparticles: In Situ SAXS and UV–Vis Evaluation. J. Phys. Chem. C 2021, 125, 1087–1095. [Google Scholar] [CrossRef]
- Haas, S.; Plivelic, T.S.; Dicko, C. Combined SAXS/UV–Vis/Raman as a Diagnostic and Structure Resolving Tool in Materials and Life Sciences Applications. J. Phys. Chem. B 2014, 118, 2264–2273. [Google Scholar] [CrossRef] [PubMed]
- Gerrard, D.L.; Maddam, W.F. Polymer Characterization by Raman Spectroscopy. Appl. Spectrosc. Rev. 1986, 22, 251–334. [Google Scholar] [CrossRef]
- Chapron, D.; Rault, F.; Talbourdet, A.; Lemort, G.; Cochrane, C.; Bourson, P.; Devaux, E.; Campagne, C. In-Situ Raman Monitoring of the Poly(Vinylidene Fluoride) Crystalline Structure during a Melt-Spinning Process. J. Raman Spectrosc. 2021, 52, 1073–1079. [Google Scholar] [CrossRef]
- Dropsit, E.; Hoppe, S.; Chapron, D.; Durand, A.; Bourson, P. In Situ Conversion Monitoring of Styrene Emulsion Polymerization by Deconvolution of a Single Reference Band near 1000 cm−1. J. Raman Spectrosc. 2019, 50, 1938–1948. [Google Scholar] [CrossRef]
- Kohlmann, D.; Chevrel, M.-C.; Hoppe, S.; Meimaroglou, D.; Chapron, D.; Bourson, P.; Schwede, C.; Loth, W.; Stammer, A.; Wilson, J.; et al. Modular, Flexible, and Continuous Plant for Radical Polymerization in Aqueous Solution. Macromol. React. Eng. 2016, 10, 339–353. [Google Scholar] [CrossRef]
- Chevrel, M.-C.; Hoppe, S.; Meimaroglou, D.; Chapron, D.; Bourson, P.; Wilson, J.; Ferlin, P.; Falk, L.; Durand, A. Application of Raman Spectroscopy to Characterization of Residence Time Distribution and Online Monitoring of a Pilot-Scale Tubular Reactor for Acrylic Acid Solution Polymerization. Macromol. React. Eng. 2016, 10, 406–414. [Google Scholar] [CrossRef]
- Brun, N.; Youssef, I.; Chevrel, M.-C.; Chapron, D.; Schrauwen, C.; Hoppe, S.; Bourson, P.; Durand, A. In Situ Monitoring of Styrene Polymerization Using Raman Spectroscopy. Multi-Scale Approach of Homogeneous and Heterogeneous Polymerization Processes. J. Raman Spectrosc. 2013, 44, 909–915. [Google Scholar] [CrossRef]
- Harju, M.E.E.; Valkonen, J.; Jayasooriya, U.A.; Wolverson, D. Simulataneous Application of Charge Coupled Device Array-Detected Raman Spectroscopy and Differential Scanning Calorimetry to in Situ Investigation of Phase Transitions in Condensed Matter. J. Chem. Soc. Faraday Trans. 1992, 88, 2717–2720. [Google Scholar] [CrossRef]
- Ferraro, J.R.; Nakamoto, K.; Brown, C.W. Introductory Raman Spectroscopy, 2nd ed.; Academic Press: Boston, MA, USA; Amsterdam, The Netherlands, 2003. [Google Scholar]
- Weber, W.H.; Merlin, R. Raman Scattering in Materials Science; Springer Science & Business Media: Berlin, Germany, 2013; ISBN 978-3-662-04221-2. [Google Scholar]
- Edwards, H.G.M.; Johnson, A.F.; Lewis, I.R. Applications of Raman Spectroscopy to the Study of Polymers and Polymerization Processes. J. Raman Spectrosc. 1993, 24, 475–483. [Google Scholar] [CrossRef]
- Davies, R.J.; Burghammer, M.; Riekel, C. Simultaneous MicroRaman and Synchrotron Radiation Microdiffraction: Tools for Materials Characterization. Appl. Phys. Lett. 2005, 87, 264105. [Google Scholar] [CrossRef]
- Boccaleri, E.; Carniato, F.; Croce, G.; Viterbo, D.; van Beek, W.; Emerich, H.; Milanesio, M. In Situ Simultaneous Raman/High-Resolution X-ray Powder Diffraction Study of Transformations Occurring in Materials at Non-Ambient Conditions. J. Appl. Crystallogr. 2007, 40, 684–693. [Google Scholar] [CrossRef]
- Beale, A.M.; van der Eerden, A.M.; Kervinen, K.; Newton, M.A.; Weckhuysen, B.M. Adding a Third Dimension to Operando Spectroscopy: A Combined UV-Vis, Raman and XAFS Setup to Study Heterogeneous Catalysts under Working Conditions. Chem. Commun. 2005, 3015–3017. [Google Scholar] [CrossRef]
- Kongmark, C.; Martis, V.; Rubbens, A.; Pirovano, C.; Löfberg, A.; Sankar, G.; Bordes-Richard, E.; Vannier, R.-N.; Beek, W.V. Elucidating the Genesis of Bi2MoO6catalyst by Combination of Synchrotron Radiation Experiments and Raman Scattering. Chem. Commun. 2009, 4850–4852. [Google Scholar] [CrossRef]
- McGeehan, J.E.; Carpentier, P.; Royant, A.; Bourgeois, D.; Ravelli, R.B. X-ray Radiation-Induced Damage in DNA Monitored by Online Raman. J. Synchrotron Radiat. 2007, 14, 99–108. [Google Scholar] [CrossRef] [Green Version]
- Stanley, H.B.; Banerjee, D.; van Breemen, L.; Ciston, J.; Liebscher, C.H.; Martis, V.; Merino, D.H.; Longo, A.; Pattison, P.; Peters, G.W. X-ray Irradiation Induced Reduction and Nanoclustering of Lead in Borosilicate Glass. CrystEngComm 2014, 16, 9331–9339. [Google Scholar] [CrossRef] [Green Version]
- Kenway, P.B.; Duke, P.J. X-ray Optics and Microanalysis 1992, Proceedings of the 13th INT Conference, Manchester, UK, 31 August–4 September 1992; CRC Press: Abingdon, UK, 2020; ISBN 978-1-00-011227-6. [Google Scholar]
- Hirose, R.; Yoshioka, T.; Yamamoto, H.; Reddy, K.R.; Tahara, D.; Hamada, K.; Tashiro, K. In-House Simultaneous Collection of Small-Angle X-ray Scattering, Wide-Angle X-ray Diffraction and Raman Scattering Data from Polymeric Materials. J. Appl. Crystallogr. 2014, 47, 922–930. [Google Scholar] [CrossRef]
- Di Sacco, F.; Saidi, S.; Hermida-Merino, D.; Portale, G. Revisiting the Mechanism of the Meso-to-α Transition of Isotactic Polypropylene and Ethylene–Propylene Random Copolymers. Macromolecules 2021, 54, 9681–9691. [Google Scholar] [CrossRef]
- Amigo, J.M. Data Mining, Machine Learning, Deep Learning, Chemometrics. Definitions, Common Points and Trends (Spoiler Alert: VALIDATE Your Models!). Braz. J. Anal. Chem. 2021, 8, 45–61. [Google Scholar] [CrossRef]
- Chapron, D.; Cordero, F.; Fontana, M.D. Characterization of Oxygen Vacancies in SrTiO3 by Means of Anelastic and Raman Spectroscopy. J. Appl. Phys. 2019, 126, 154101. [Google Scholar] [CrossRef]
- Voelkel, A.; Milczewska, K.; Héberger, K. Inverse Gas Chromatographic and Chemometric Tools for Determination of Interactions between the Components of Polymeric Composition. Anal. Chim. Acta 2006, 559, 221–226. [Google Scholar] [CrossRef]
- Caetano, B.L.; Briois, V.; Pulcinelli, S.H.; Meneau, F.; Santilli, C.V. Revisiting the ZnO Q-Dot Formation Toward an Integrated Growth Model: From Coupled Time Resolved UV–Vis/SAXS/XAS Data to Multivariate Analysis. J. Phys. Chem. C 2017, 121, 886–895. [Google Scholar] [CrossRef]
- Sanderson, J.S.; Daniels, R.D.; Donald, A.M.; Blennow, A.; Engelsen, S.B. Exploratory SAXS and HPAEC-PAD Studies of Starches from Diverse Plant Genotypes. Carbohydr. Polym. 2006, 64, 433–443. [Google Scholar] [CrossRef]
- Smirnova, D.S.; Kornfield, J.A.; Lohse, D.J. Morphology Development in Model Polyethylene via Two-Dimensional Correlation Analysis. Macromolecules 2011, 44, 6836–6848. [Google Scholar] [CrossRef]
- Witschnigg, A.; Laske, S.; Kracalik, M.; Feuchter, M.; Pinter, G.; Maier, G.; Märzinger, W.; Haberkorn, M.; Langecker, G.R.; Holzer, C. In-Line Characterization of Polypropylene Nanocomposites Using FT-NIR. J. Appl. Polym. Sci. 2010, 117, 3047–3053. [Google Scholar] [CrossRef]
- Guo, L.; Spegazzini, N.; Sato, H.; Hashimoto, T.; Masunaga, H.; Sasaki, S.; Takata, M.; Ozaki, Y. Multistep Crystallization Process Involving Sequential Formations of Density Fluctuations, “Intermediate Structures”, and Lamellar Crystallites: Poly(3-Hydroxybutyrate) As Investigated by Time-Resolved Synchrotron SAXS and WAXD. Macromolecules 2012, 45, 313–328. [Google Scholar] [CrossRef]
- MUSST. Available online: https://www.esrf.fr/Instrumentation/DetectorsAndElectronics/musst (accessed on 26 July 2021).
- Long, D.A. Raman Spectroscopy; McGraw Hill Higher Education: New York, NY, USA, 1977. [Google Scholar]
- Chaudemanche, S. Caractéristion In Situ de l’endomagement Volumique Par Spectroscopie Raman et Rayons X de Différents Polypropylènes Déformés En Traction Uniaxiale; Université de Lorraine: Metz, France, 2013. [Google Scholar]
- Kimura, S.; Munakata, C. Method for Measuring the Spot Size of a Laser Beam Using a Boundary-Diffraction Wave. Opt. Lett. 1987, 12, 552. [Google Scholar] [CrossRef] [PubMed]
- Brown, M.S.; Arnold, C.B. Fundamentals of Laser-Material Interaction and Application to Multiscale Surface Modification. In Laser Precision Microfabrication; Sugioka, K., Meunier, M., Piqué, A., Eds.; Springer Series in Materials Science; Springer: Berlin/Heidelberg, Germany, 2010; Volume 135, pp. 91–120. ISBN 978-3-642-10522-7. [Google Scholar]
- Bras, W.; Stanley, H. Unexpected Effects in Non Crystalline Materials Exposed to X-ray Radiation. J. Non-Cryst. Solids 2016, 451, 153–160. [Google Scholar] [CrossRef]
- Bras, W.; Myles, D.A.A.; Felici, R. When X-rays Alter the Course of Your Experiments. J. Phys. Condens. Matter 2021, 33, 423002. [Google Scholar] [CrossRef]
- Veitmann, M.; Chapron, D.; Bizet, S.; Devisme, S.; Guilment, J.; Royaud, I.; Poncot, M.; Bourson, P. Thermal Behavior of PVDF/PMMA Blends by Differential Scanning Calorimetry and Vibrational Spectroscopies (Raman and Fourier-Transform Infrared). Polym. Test. 2015, 48, 120–124. [Google Scholar] [CrossRef]
- Smilde, A.K.; Westerhuis, J.A.; de Jong, S. A Framework for Sequential Multiblock Component Methods. J. Chemom. 2003, 17, 323–337. [Google Scholar] [CrossRef]
- Jaumot, J.; Gargallo, R.; de Juan, A.; Tauler, R. A Graphical User-Friendly Interface for MCR-ALS: A New Tool for Multivariate Curve Resolution in MATLAB. Chemom. Intell. Lab. Syst. 2005, 76, 101–110. [Google Scholar] [CrossRef]
- Aid, S.; Eddhahak, A.; Khelladi, S.; Ortega, Z.; Chaabani, S.; Tcharkhtchi, A. On the Miscibility of PVDF/PMMA Polymer Blends: Thermodynamics, Experimental and Numerical Investigations. Polym. Test. 2019, 73, 222–231. [Google Scholar] [CrossRef] [Green Version]
- Zhou, Y.; Liu, W.; Tan, B.; Zhu, C.; Ni, Y.; Fang, L.; Lu, C.; Xu, Z. Crystallinity and β Phase Fraction of PVDF in Biaxially Stretched PVDF/PMMA Films. Polymers 2021, 13, 998. [Google Scholar] [CrossRef] [PubMed]
- Chen, N.; Yao, X.; Zheng, C.; Tang, Y.; Ren, M.; Ren, Y.; Guo, M.; Zhang, S.; Liu, L.-Z. Study on the Miscibility, Crystallization and Crystalline Morphology of Polyamide-6/Polyvinylidene Fluoride Blends. Polymer 2017, 124, 30–40. [Google Scholar] [CrossRef]
- Zhang, H.; Shi, W.; Cheng, H.; Chen, S.; Wang, L. Effect of Ionic Liquid on Crystallization Kinetics and Crystal Form Transition of Poly(Vinylidene Fluoride) Blends. J. Ther. Anal. Calorim. 2018, 132, 1153–1165. [Google Scholar] [CrossRef]
- Chu, Z.; Liu, L.; Lou, Y.; Zhao, R.; Ma, Z.; Li, Y. Flow-Induced Crystallization of Crosslinked Poly(Vinylidene Fluoride) at Elevated Temperatures: Formation and Evolution of the Electroactive β-Phase. Ind. Eng. Chem. Res. 2020, 59, 4459–4471. [Google Scholar] [CrossRef]
- Ameduri, B. From Vinylidene Fluoride (VDF) to the Applications of VDF-Containing Polymers and Copolymers: Recent Developments and Future Trends †. Chem. Rev. 2009, 109, 6632–6686. [Google Scholar] [CrossRef] [Green Version]
- Leonard, C.; Halary, J.L.; Monnerie, L.; Micheron, F. DSC Studies on the Transitions in Poly(Vinylidenefluoride) and Some Related Copolymers. Polym. Bull. 1984, 11, 195–202. [Google Scholar] [CrossRef]
- Loufakis, K.; Wunderlich, B. Thermal Analysis of the Conformational Disorder in Semicrystalline Poly(Vinylidene Fluoride) and Poly(Trifluoroethylene). Macromolecules 1987, 20, 2474–2478. [Google Scholar] [CrossRef]
- Nabata, Y. Molecular Motion in Form II Poly(Vinylidene Fluoride). Jpn. J. Appl. Phys. 1990, 29, 2782. [Google Scholar] [CrossRef]
- Teyssedre, G.; Bernes, A.; Lacabanne, C. Influence of the Crystalline Phase on the Molecular Mobility of PVDF. J. Polym. Sci. B Polym. Phys. 1993, 31, 2027–2034. [Google Scholar] [CrossRef]
- Lovinger, A.J. Ferroelectric Polymers. Science 1983, 220, 1115–1121. [Google Scholar] [CrossRef]
- Wang, Z.-G.; Hsiao, B.S.; Sirota, E.B.; Srinivas, S. A Simultaneous Small- and Wide-Angle X-ray Scattering Study of the Early Stages of Melt Crystallization in Polyethylene. Polymer 2000, 41, 8825–8832. [Google Scholar] [CrossRef]
- Kobayashi, M.; Tashiro, K.; Tadokoro, H. Molecular Vibrations of Three Crystal Forms of Poly(Vinylidene Fluoride). Macromolecules 1975, 8, 158–171. [Google Scholar] [CrossRef]
- Nallasamy, P.; Mohan, S. Vibrational Spectroscopic Characterization of Form II Poly(Vinylidene Fluoride). IJPAP 2005, 43, 821–827. [Google Scholar]
- Boerio, F.J.; Koenig, J.L. Vibrational Analysis of Poly(Vinylidene Fluoride). J. Polym. Sci. Part A-2 Polym. Phys. 1971, 9, 1517–1523. [Google Scholar] [CrossRef]
- Yang, C.-C.; Lian, Z.-Y.; Lin, S.J.; Shih, J.-Y.; Chen, W.-H. Preparation and Application of PVDF-HFP Composite Polymer Electrolytes in LiNi0.5Co0.2Mn0.3O2 Lithium-Polymer Batteries. Electrochim. Acta 2014, 134, 258–265. [Google Scholar] [CrossRef]
- Ryan, A.J.; Bras, W.; Mant, G.R.; Derbyshire, G.E. A Direct Method to Determine the Degree of Crystallinity and Lamellar Thickness of Polymers: Application to Polyethylene. Polymer 1994, 35, 4537–4544. [Google Scholar] [CrossRef]
- Baltá-Calleja, F.J.; Vonk, C.G. X-ray Scattering of Synthetic Polymers; Elsevier: Amsterdam, The Netherlands, 1989; ISBN 0-444-41832-6. [Google Scholar]
- Padermshoke, A.; Katsumoto, Y.; Sato, H.; Ekgasit, S.; Noda, I.; Ozaki, Y. Melting Behavior of Poly(3-Hydroxybutyrate) Investigated by Two-Dimensional Infrared Correlation Spectroscopy. Spectrochim. Acta Part A Mol. Biomol. Spectrosc. 2005, 61, 541–550. [Google Scholar] [CrossRef] [PubMed]
- de Juan, A.; Jaumot, J.; Tauler, R. Multivariate Curve Resolution (MCR). Solving the Mixture Analysis Problem. Anal. Methods 2014, 6, 4964–4976. [Google Scholar] [CrossRef]


Publisher’s Note: MDPI stays neutral with regard to jurisdictional claims in published maps and institutional affiliations. |
© 2021 by the authors. Licensee MDPI, Basel, Switzerland. This article is an open access article distributed under the terms and conditions of the Creative Commons Attribution (CC BY) license (https://creativecommons.org/licenses/by/4.0/).
Share and Cite
Saidi, S.; Portale, G.; Bras, W.; Longo, A.; Amigo, J.M.; Chapron, D.; Bourson, P.; Hermida-Merino, D. Data Mining of Polymer Phase Transitions upon Temperature Changes by Small and Wide-Angle X-ray Scattering Combined with Raman Spectroscopy. Polymers 2021, 13, 4203. https://doi.org/10.3390/polym13234203
Saidi S, Portale G, Bras W, Longo A, Amigo JM, Chapron D, Bourson P, Hermida-Merino D. Data Mining of Polymer Phase Transitions upon Temperature Changes by Small and Wide-Angle X-ray Scattering Combined with Raman Spectroscopy. Polymers. 2021; 13(23):4203. https://doi.org/10.3390/polym13234203
Chicago/Turabian StyleSaidi, Sarah, Giuseppe Portale, Wim Bras, Alessandro Longo, José Manuel Amigo, David Chapron, Patrice Bourson, and Daniel Hermida-Merino. 2021. "Data Mining of Polymer Phase Transitions upon Temperature Changes by Small and Wide-Angle X-ray Scattering Combined with Raman Spectroscopy" Polymers 13, no. 23: 4203. https://doi.org/10.3390/polym13234203