
Physical Properties of Fast-Growing Wood-Polymer Nano Composite Synthesized through TiO2 Nanoparticle Impregnation
 , , and
Abstract
:
1. Introduction
2. Materials and Methods
2.1. Sample Preparation
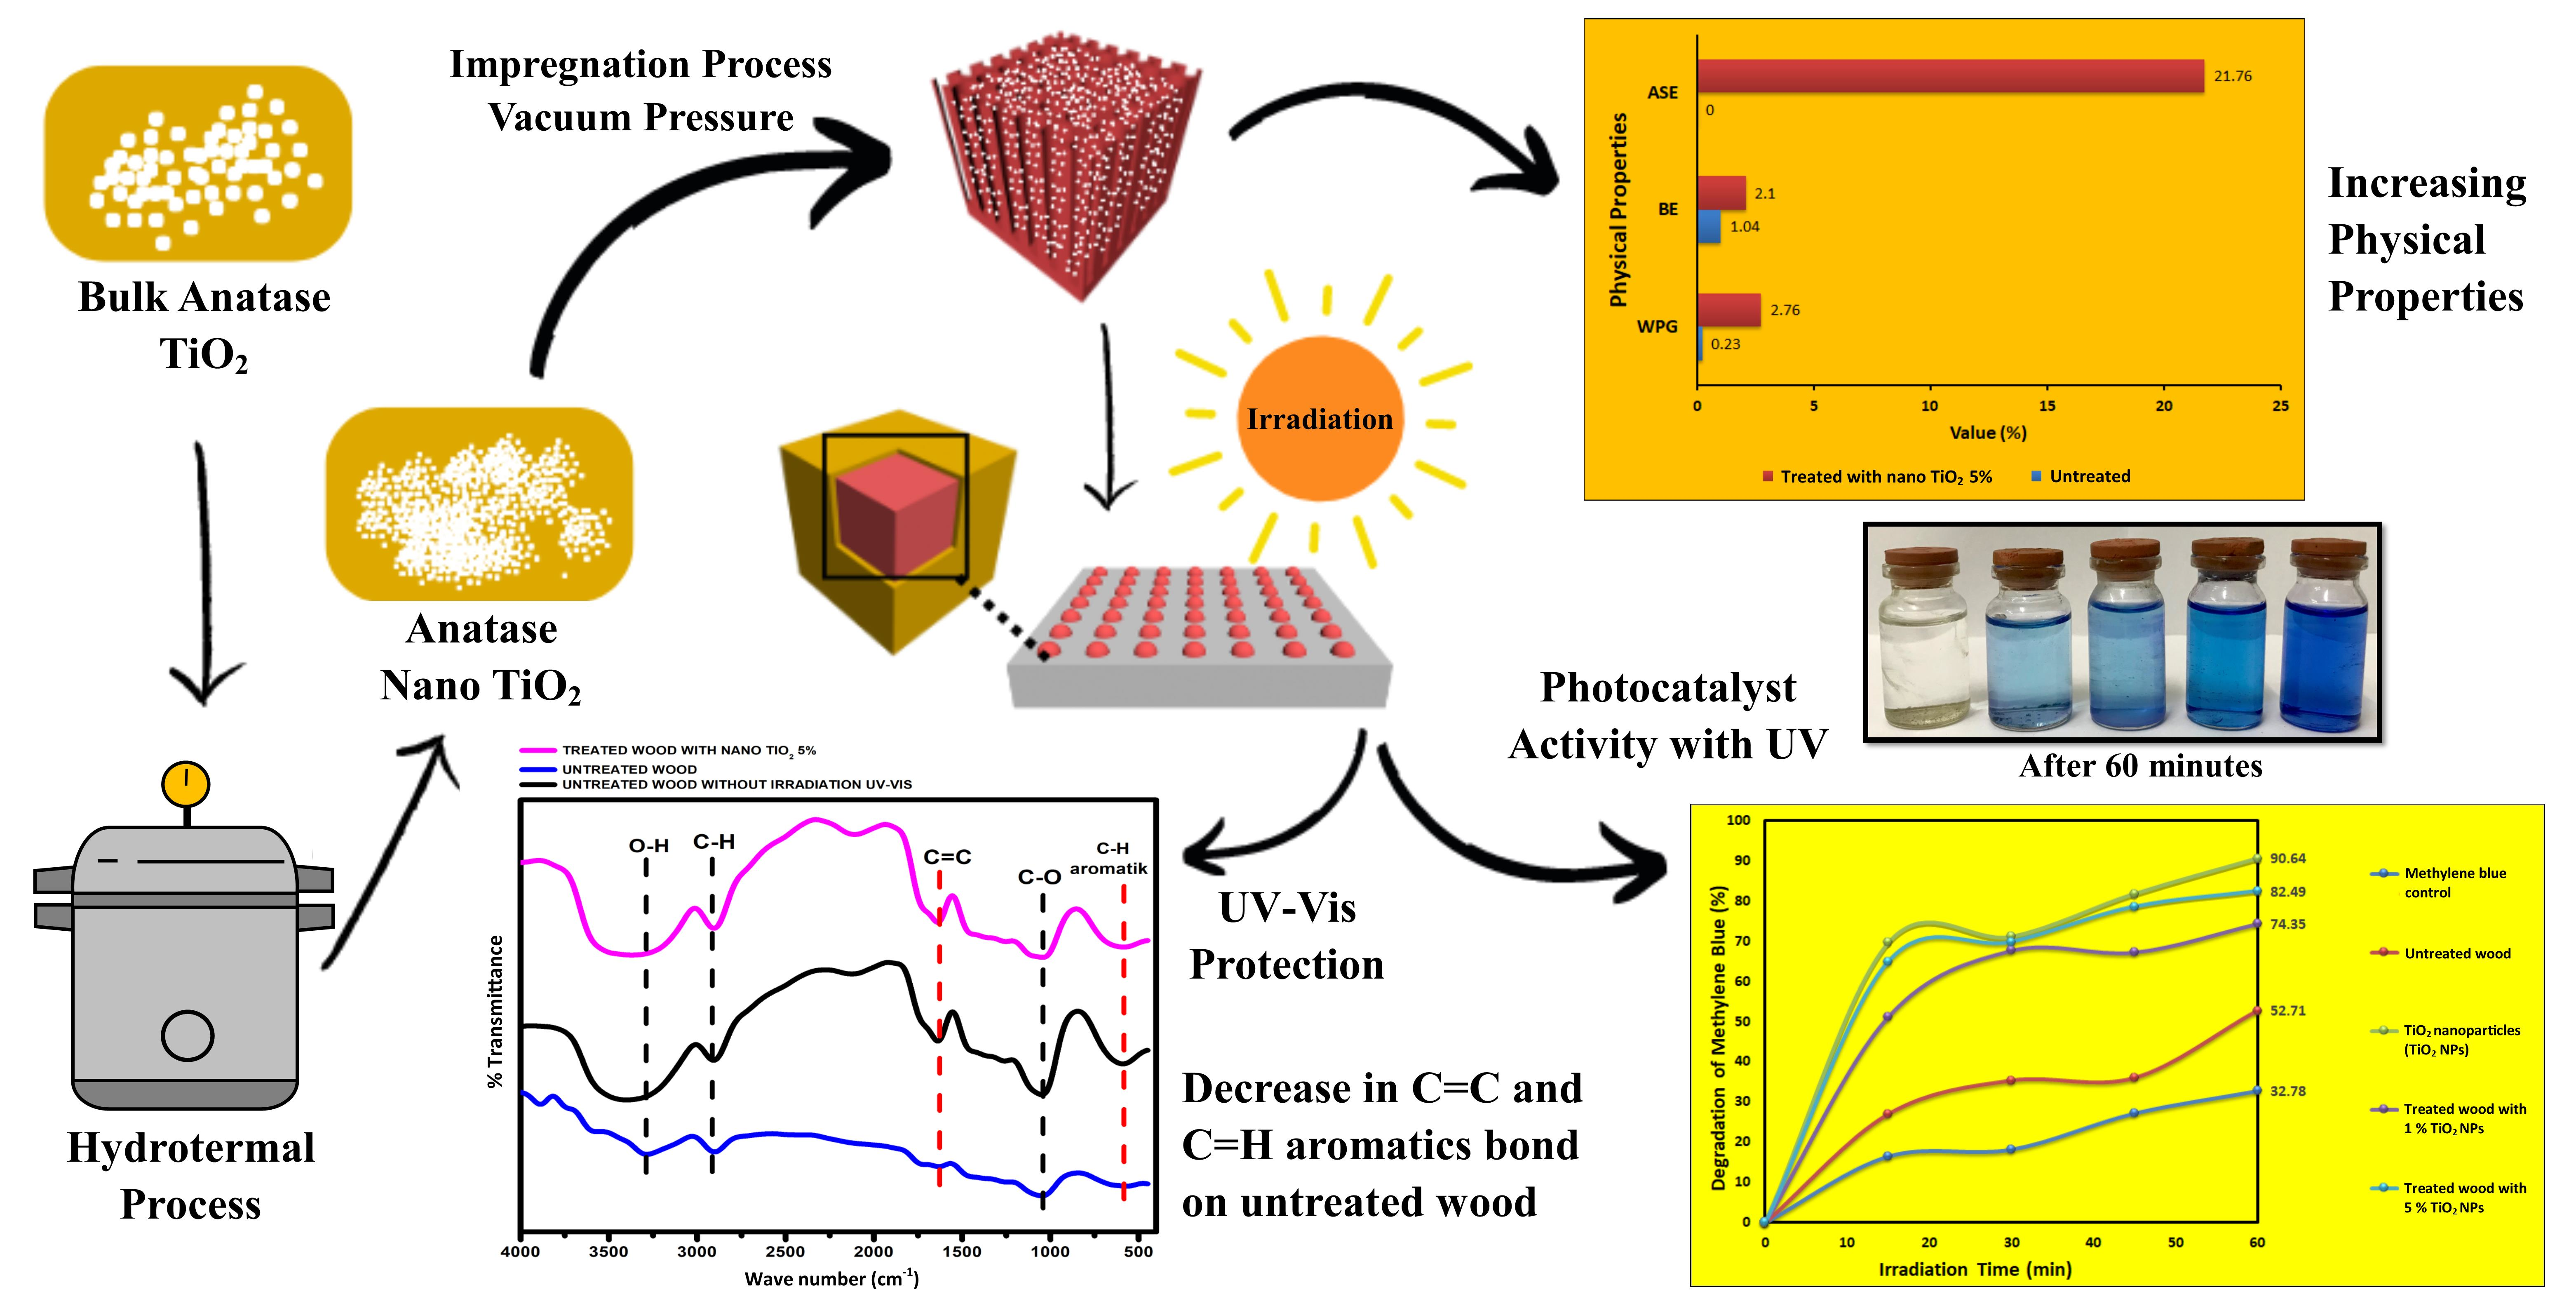
2.2. Synthesis of TiO2 Anatase Nanoparticle Using the Hydrothermal Method
2.3. Impregnation Method
2.4. Physical Properties
2.5. Photocatalyst Activity Test
2.6. Testing the Effect of UV-Vis Radiation
2.7. Characterization of Synthesized TiO2 Nanoparticle
2.8. Characterization of Impregnated Mangium Wood
2.8.1. Scanning Electron Microscopy and Energy-Dispersive X-Ray Spectroscopy
2.8.2. Fourier Transform Infrared Spectrometry
2.8.3. X-ray Diffraction Analysis
2.9. Data Analysis
3. Results
3.1. Synthesized TiO2 Nanoparticle
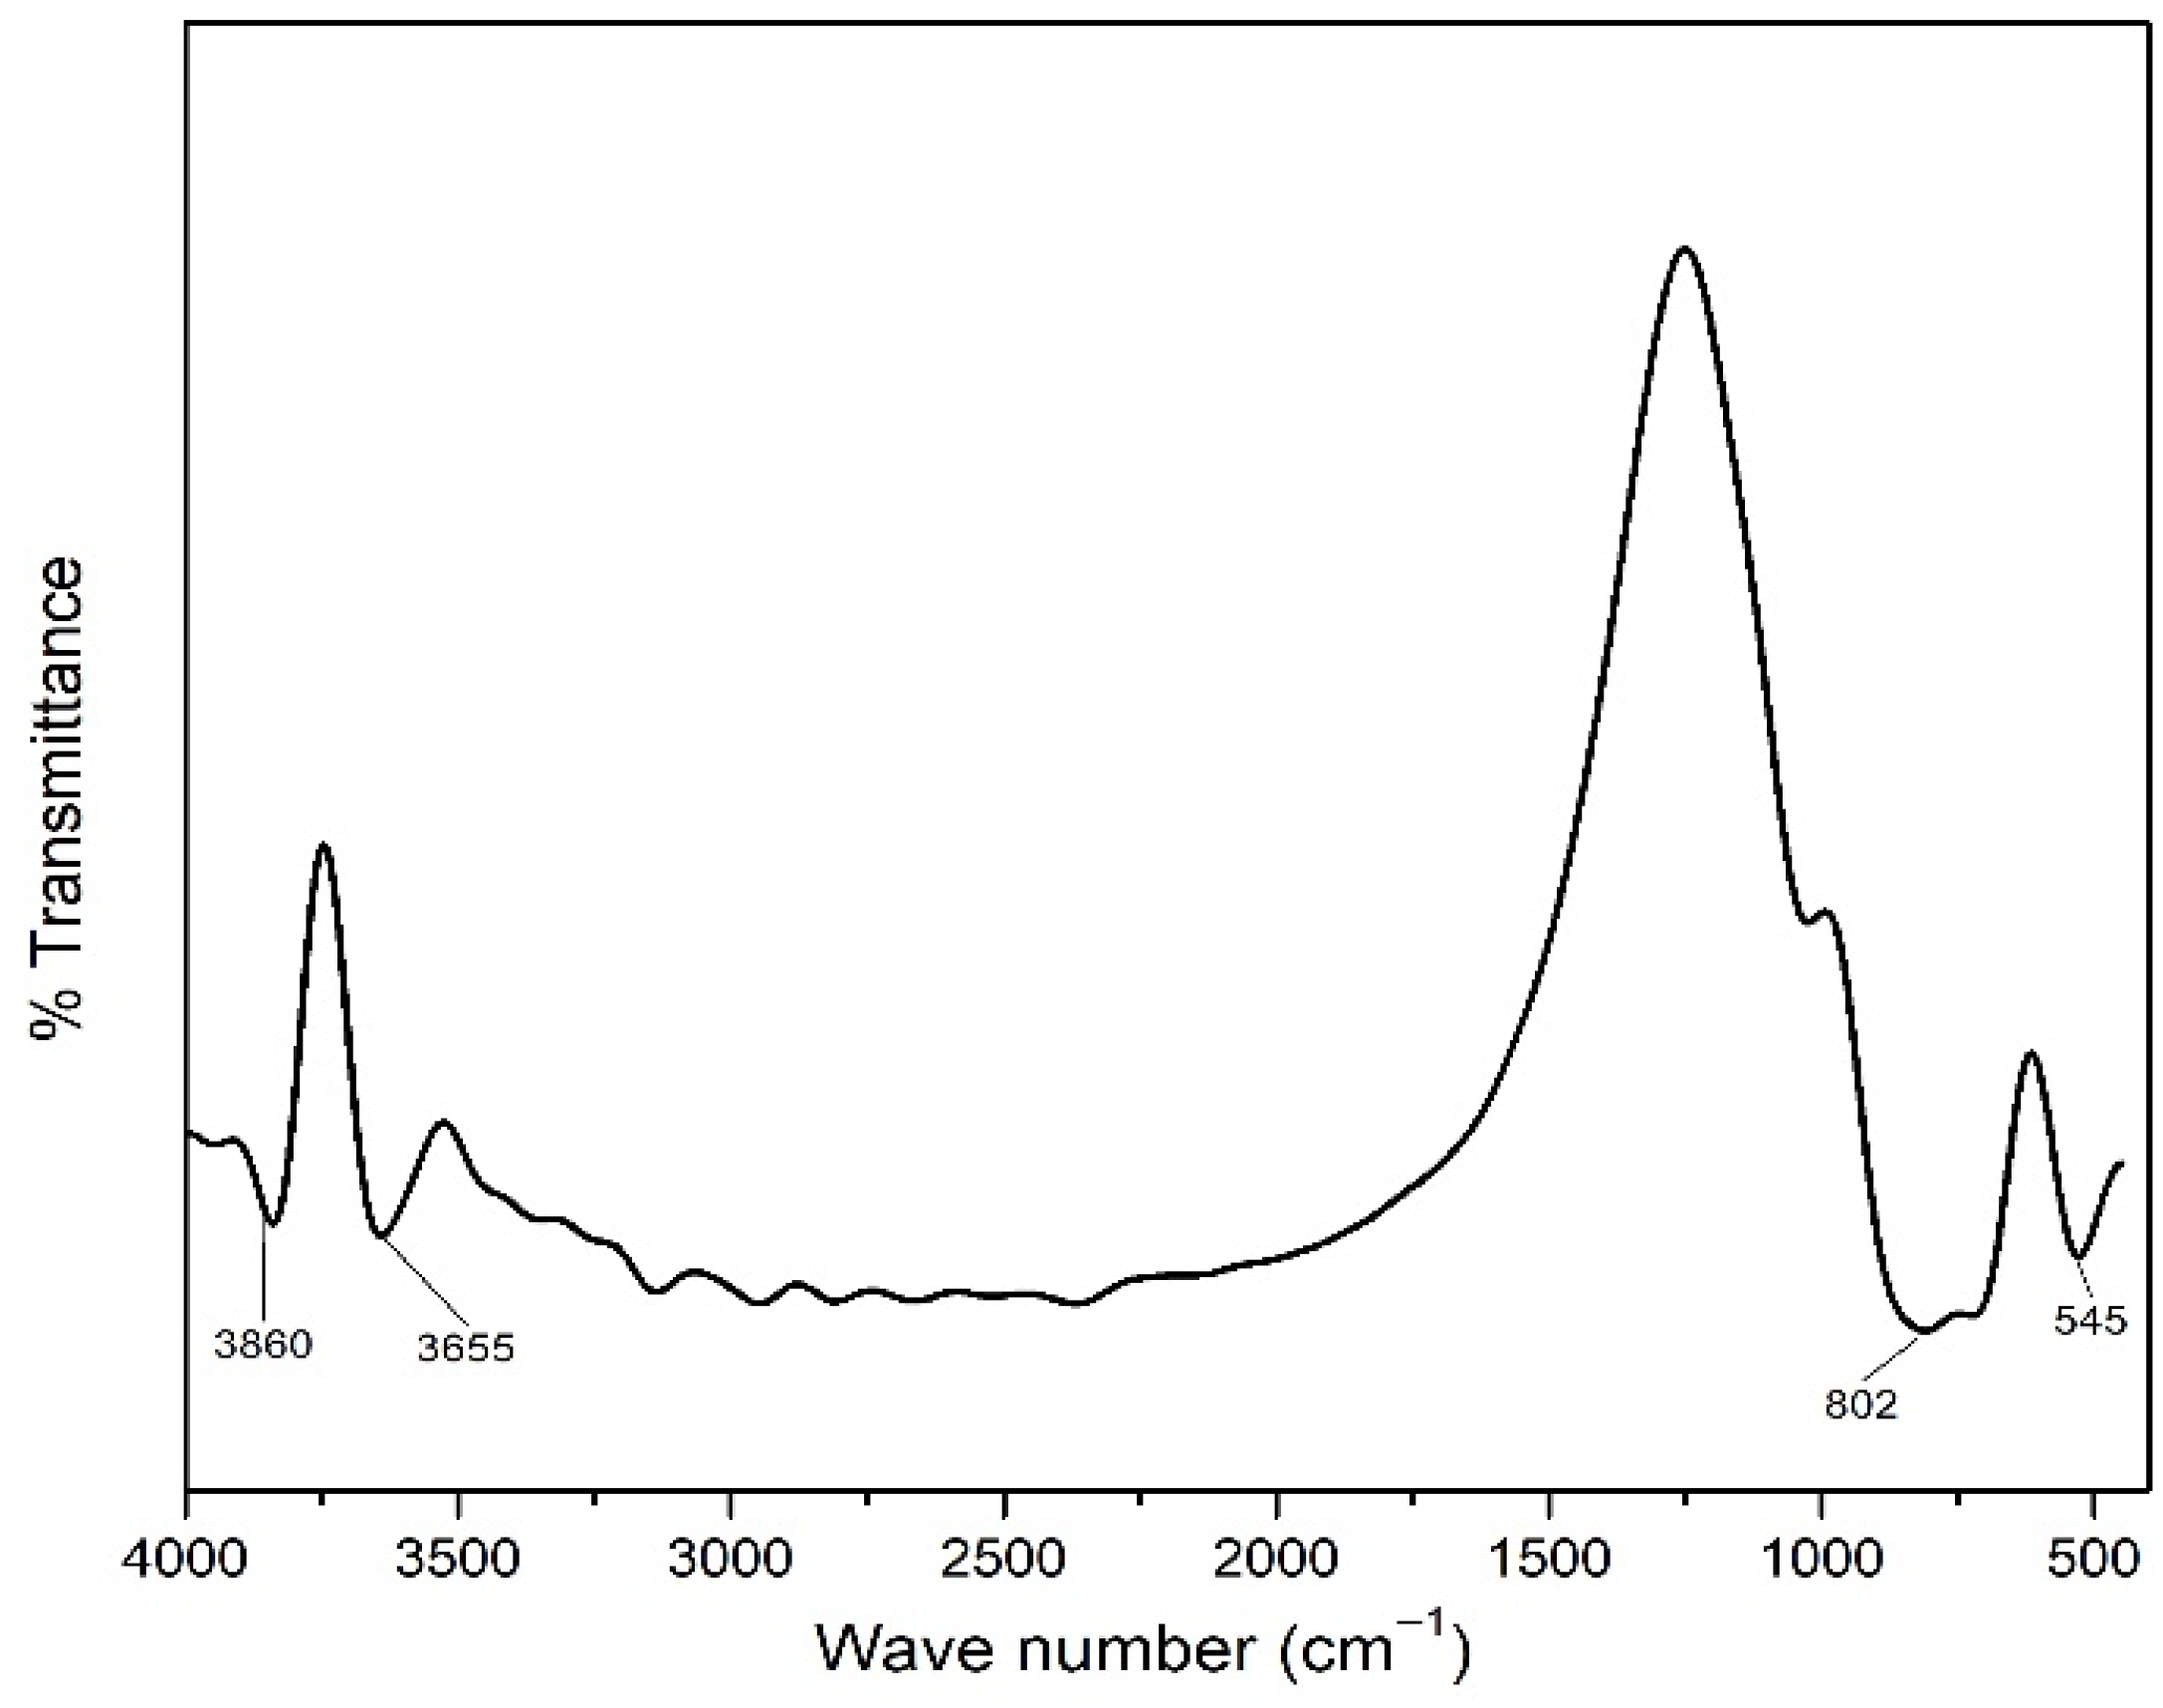
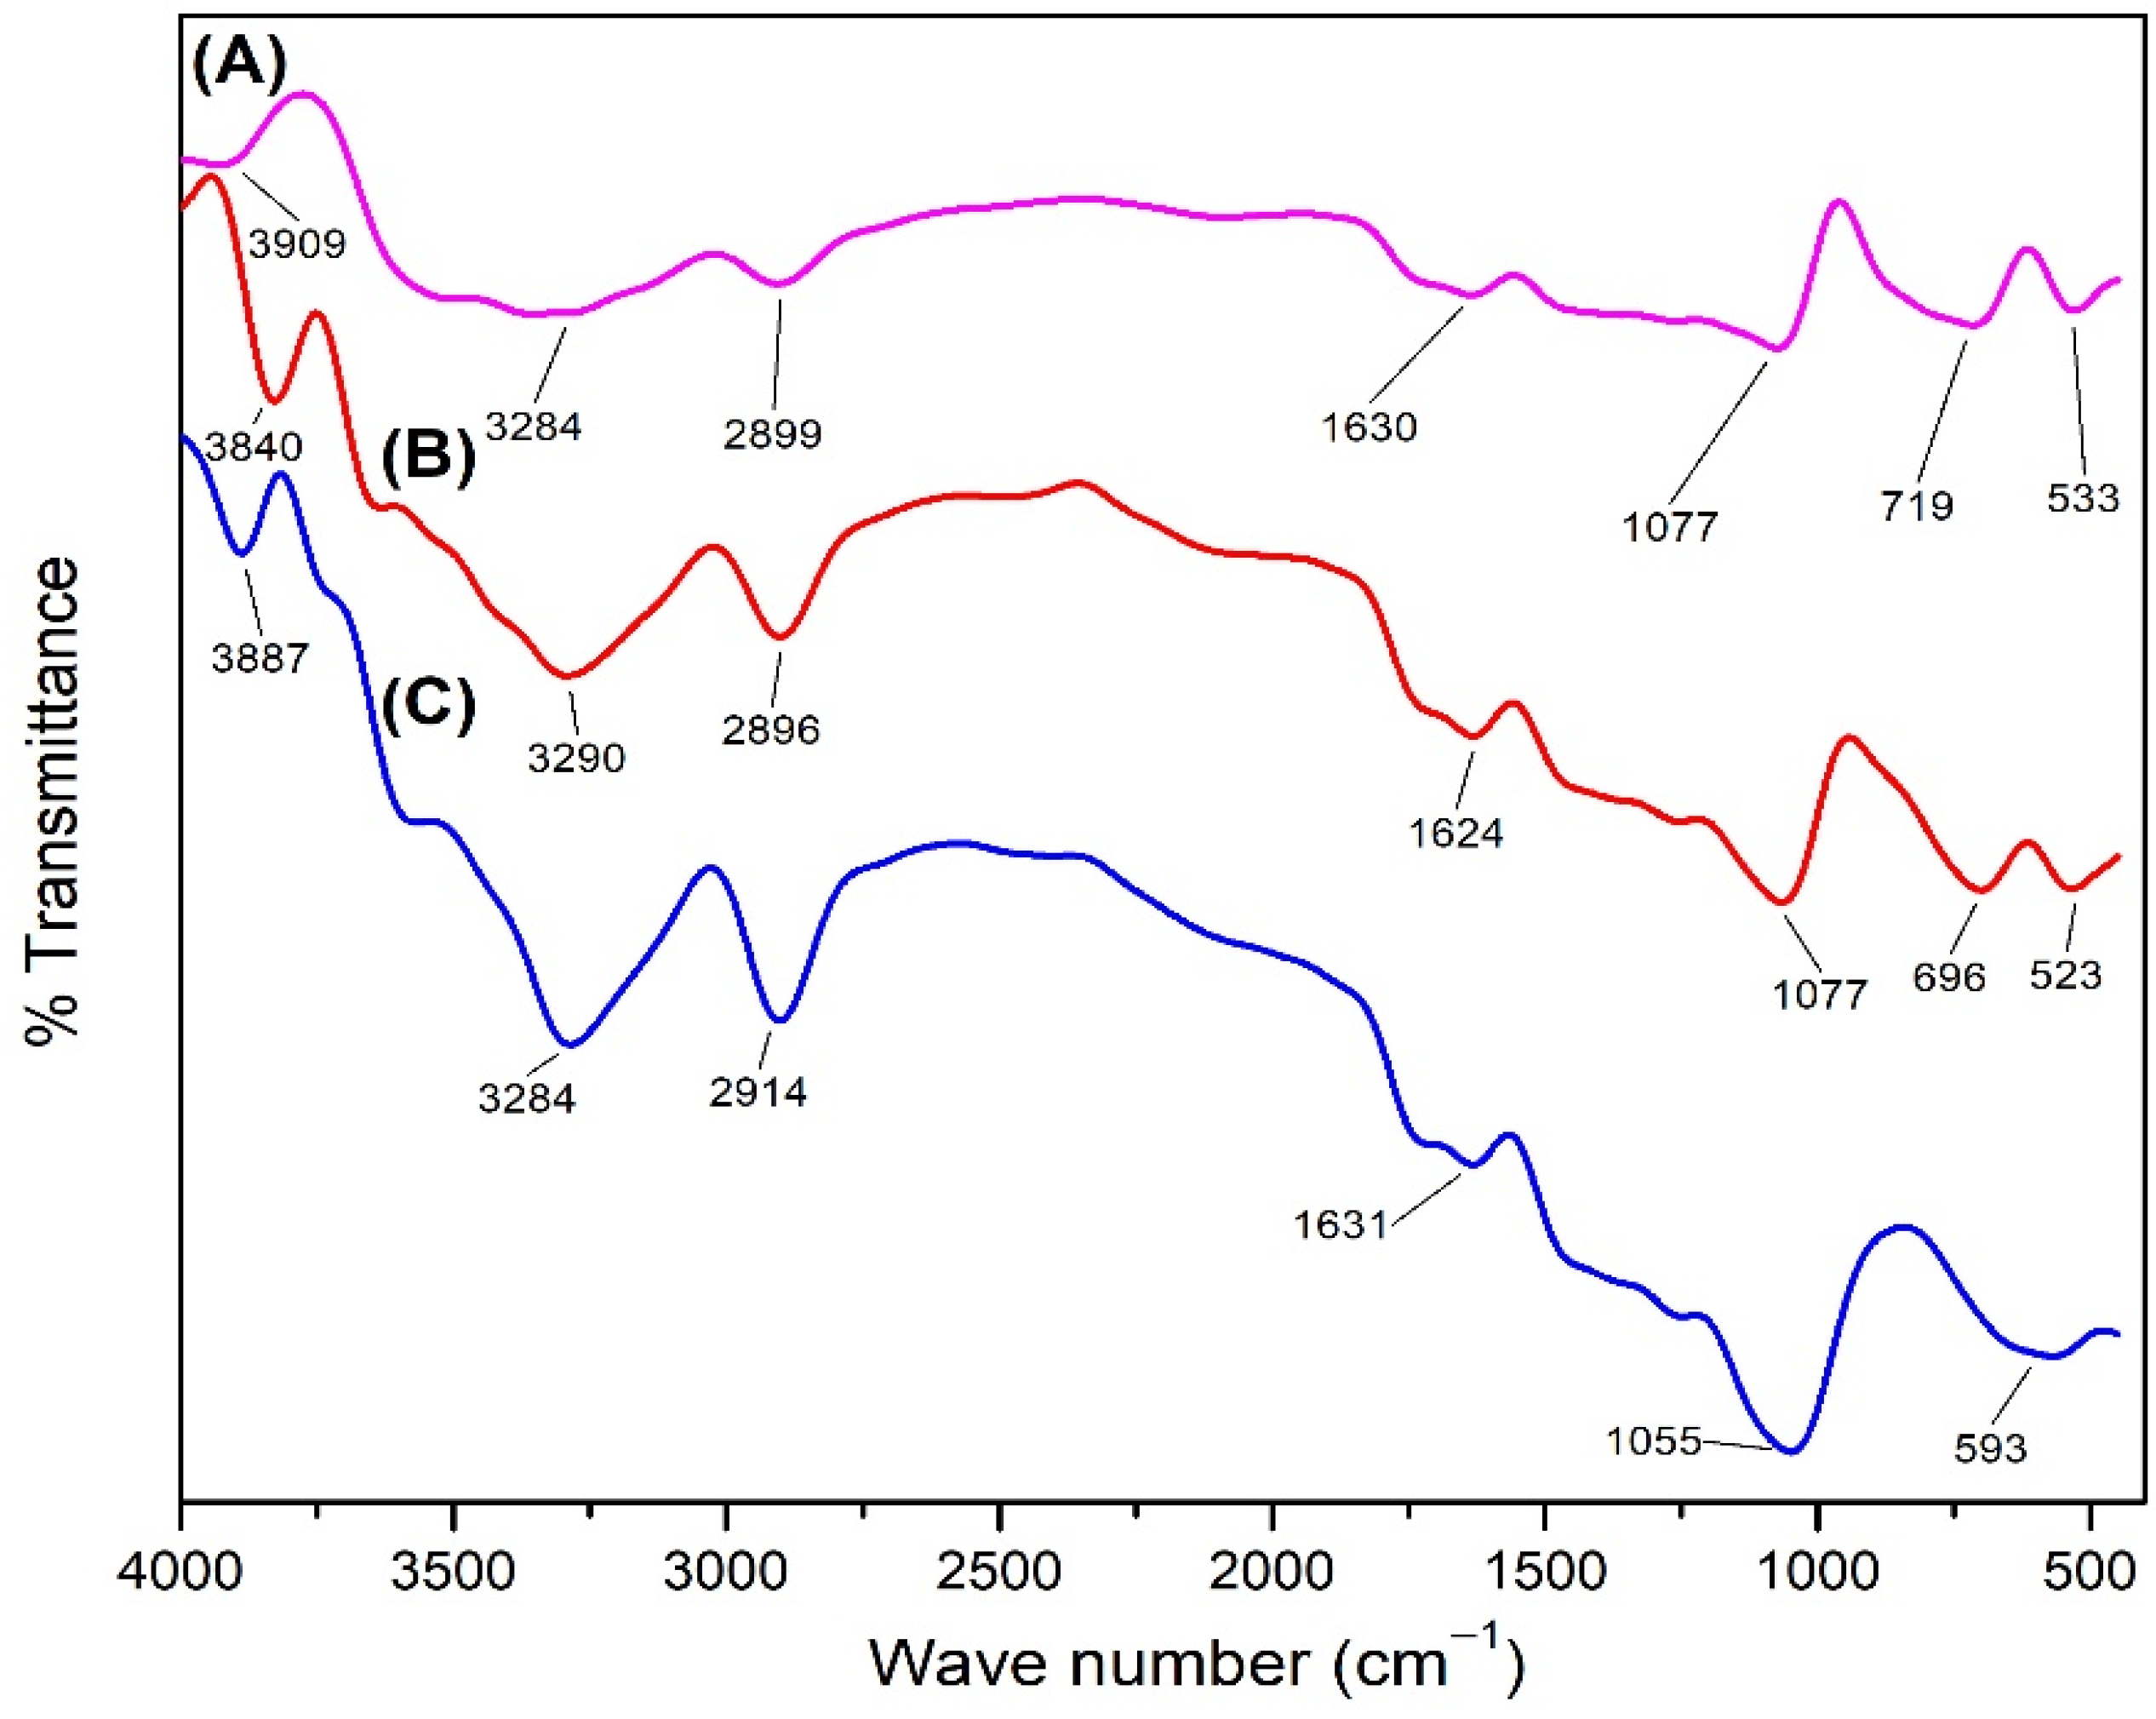
3.1.1. FTIR Result
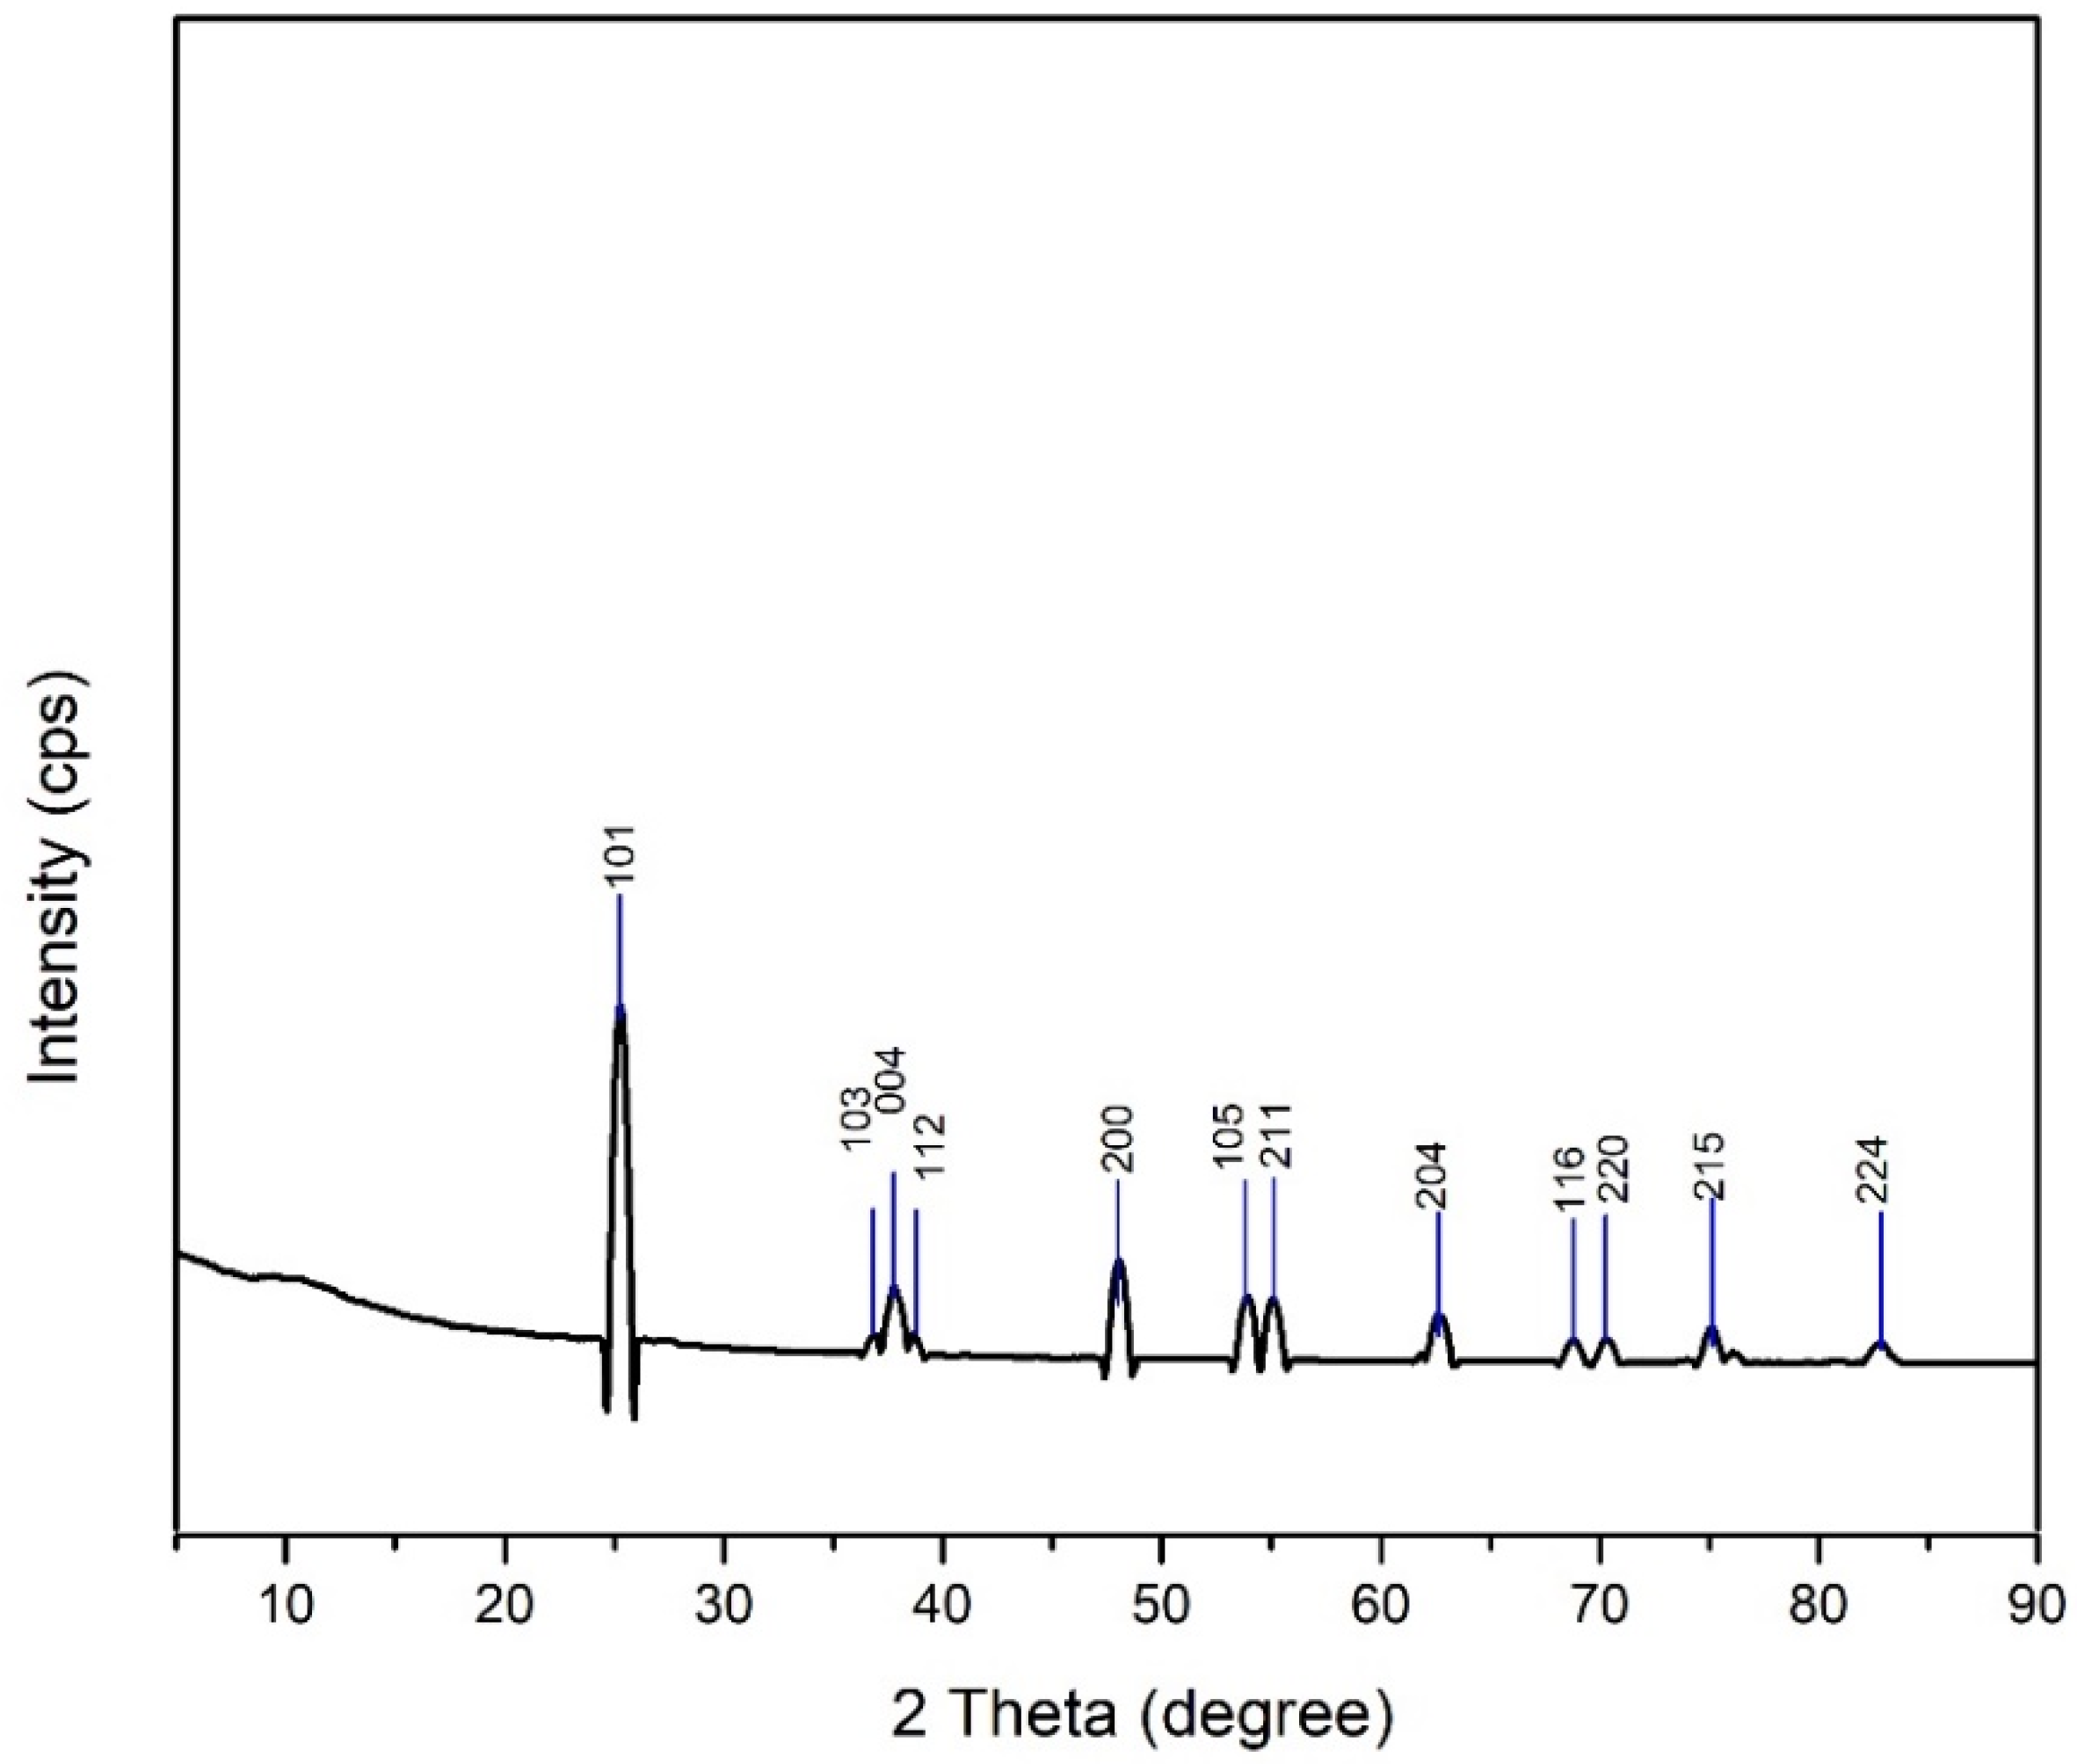
3.1.2. XRD Result
3.2. Physical Properties of Mangium Wood
3.3. Characteristics of Mangium Wood Impregnated with TiO2 Nanoparticle
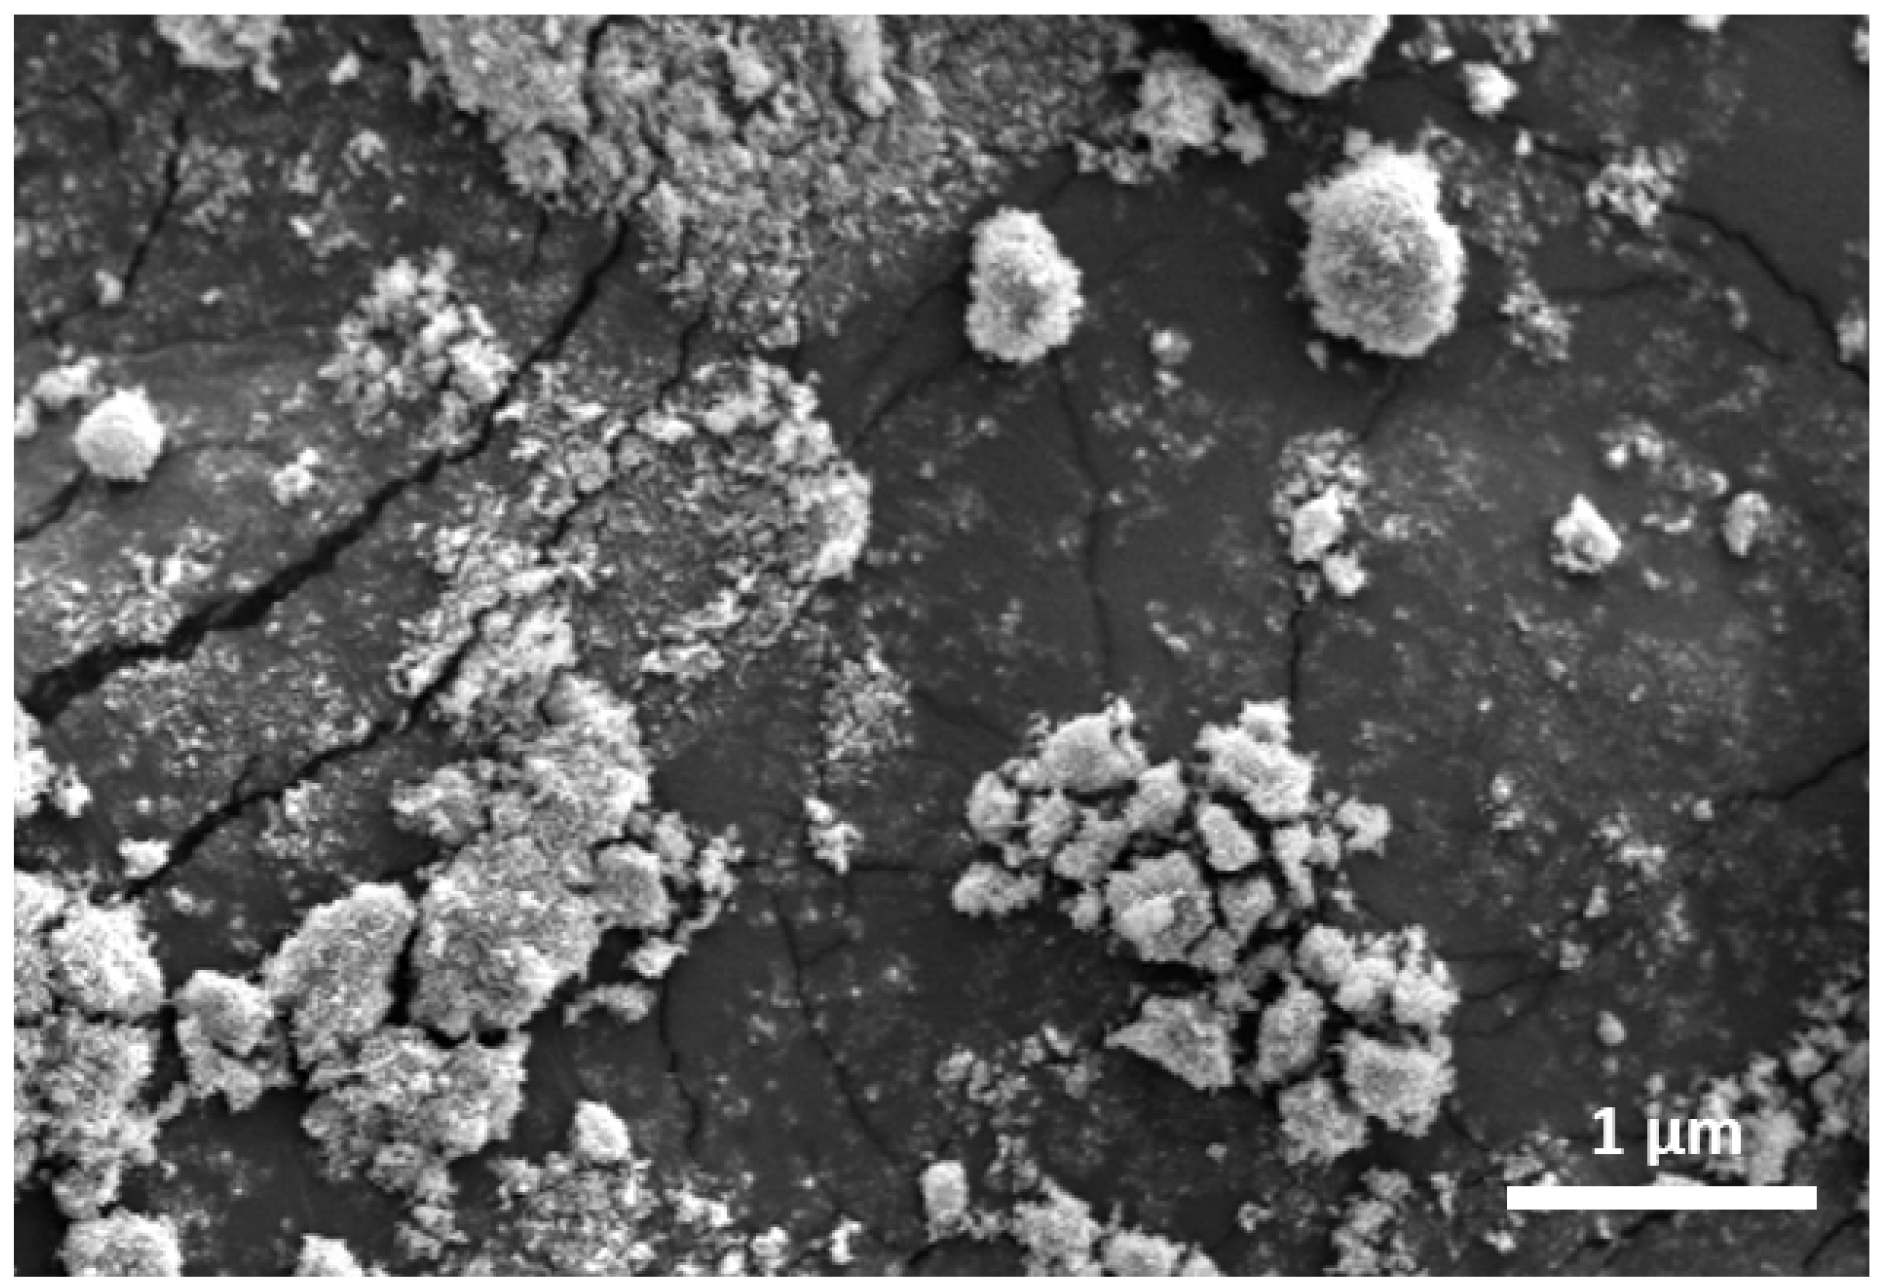
3.3.1. SEM-EDX Analysis
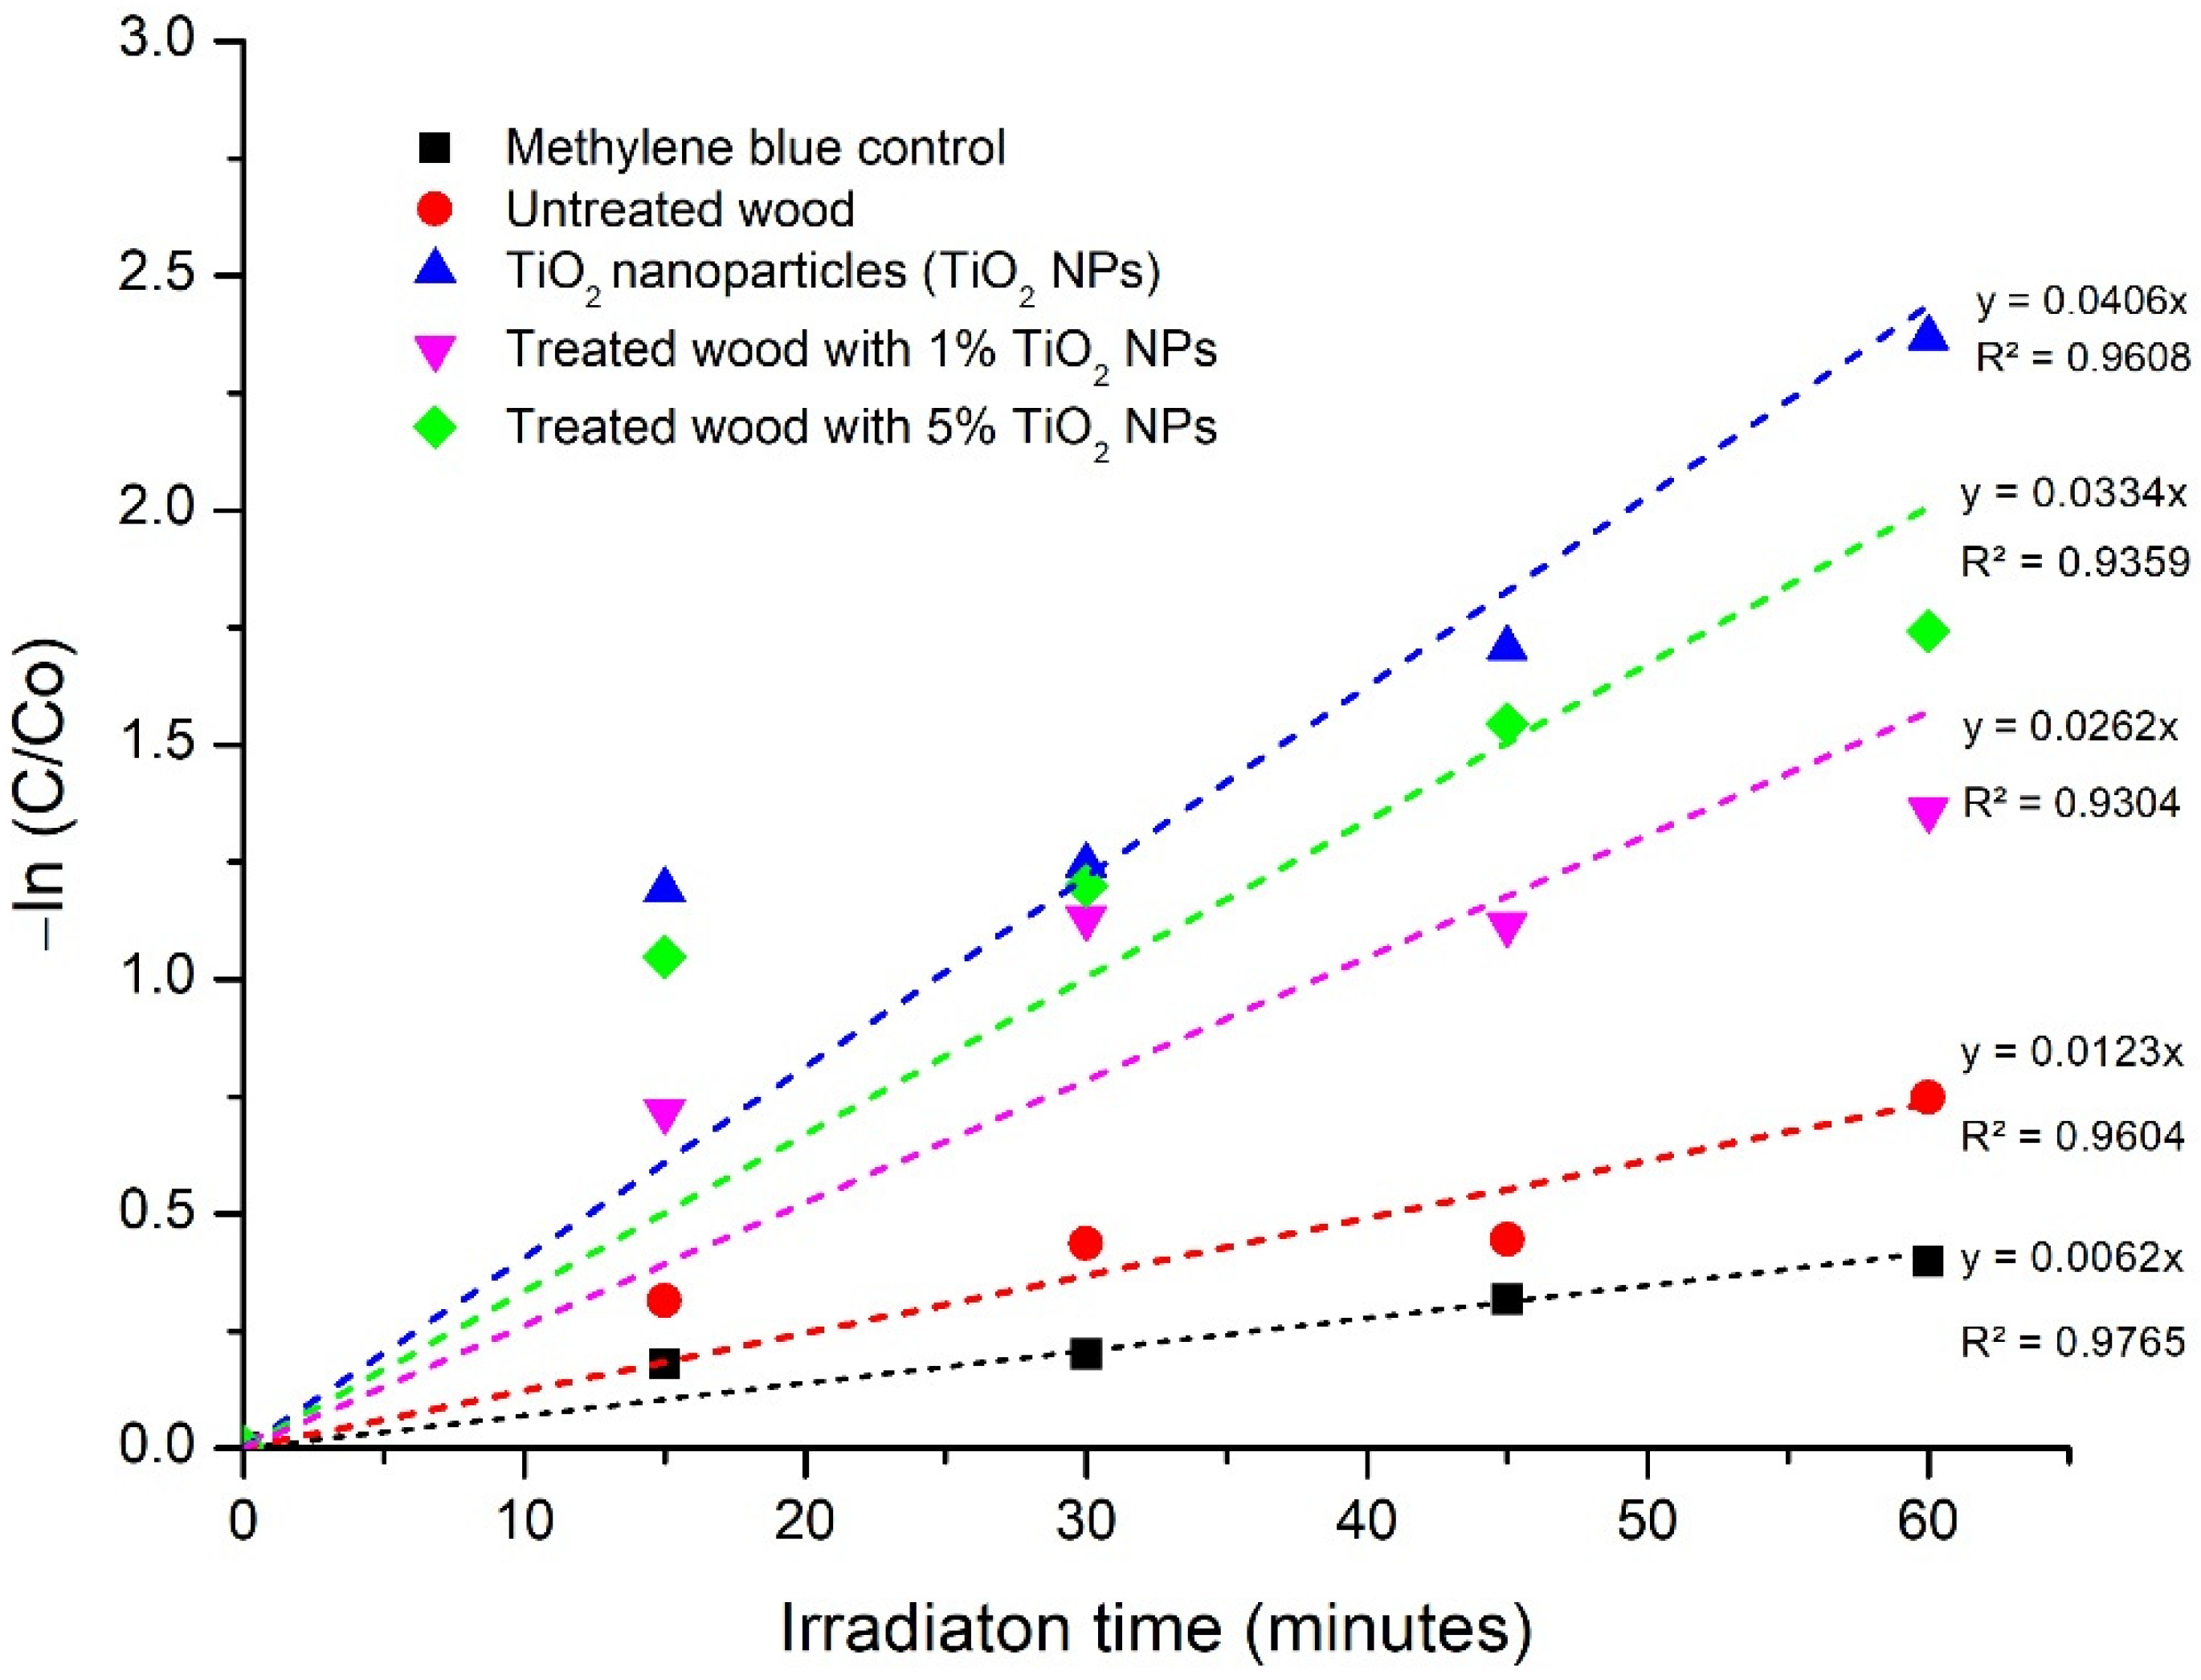
3.3.2. Photocatalyst Activity Test
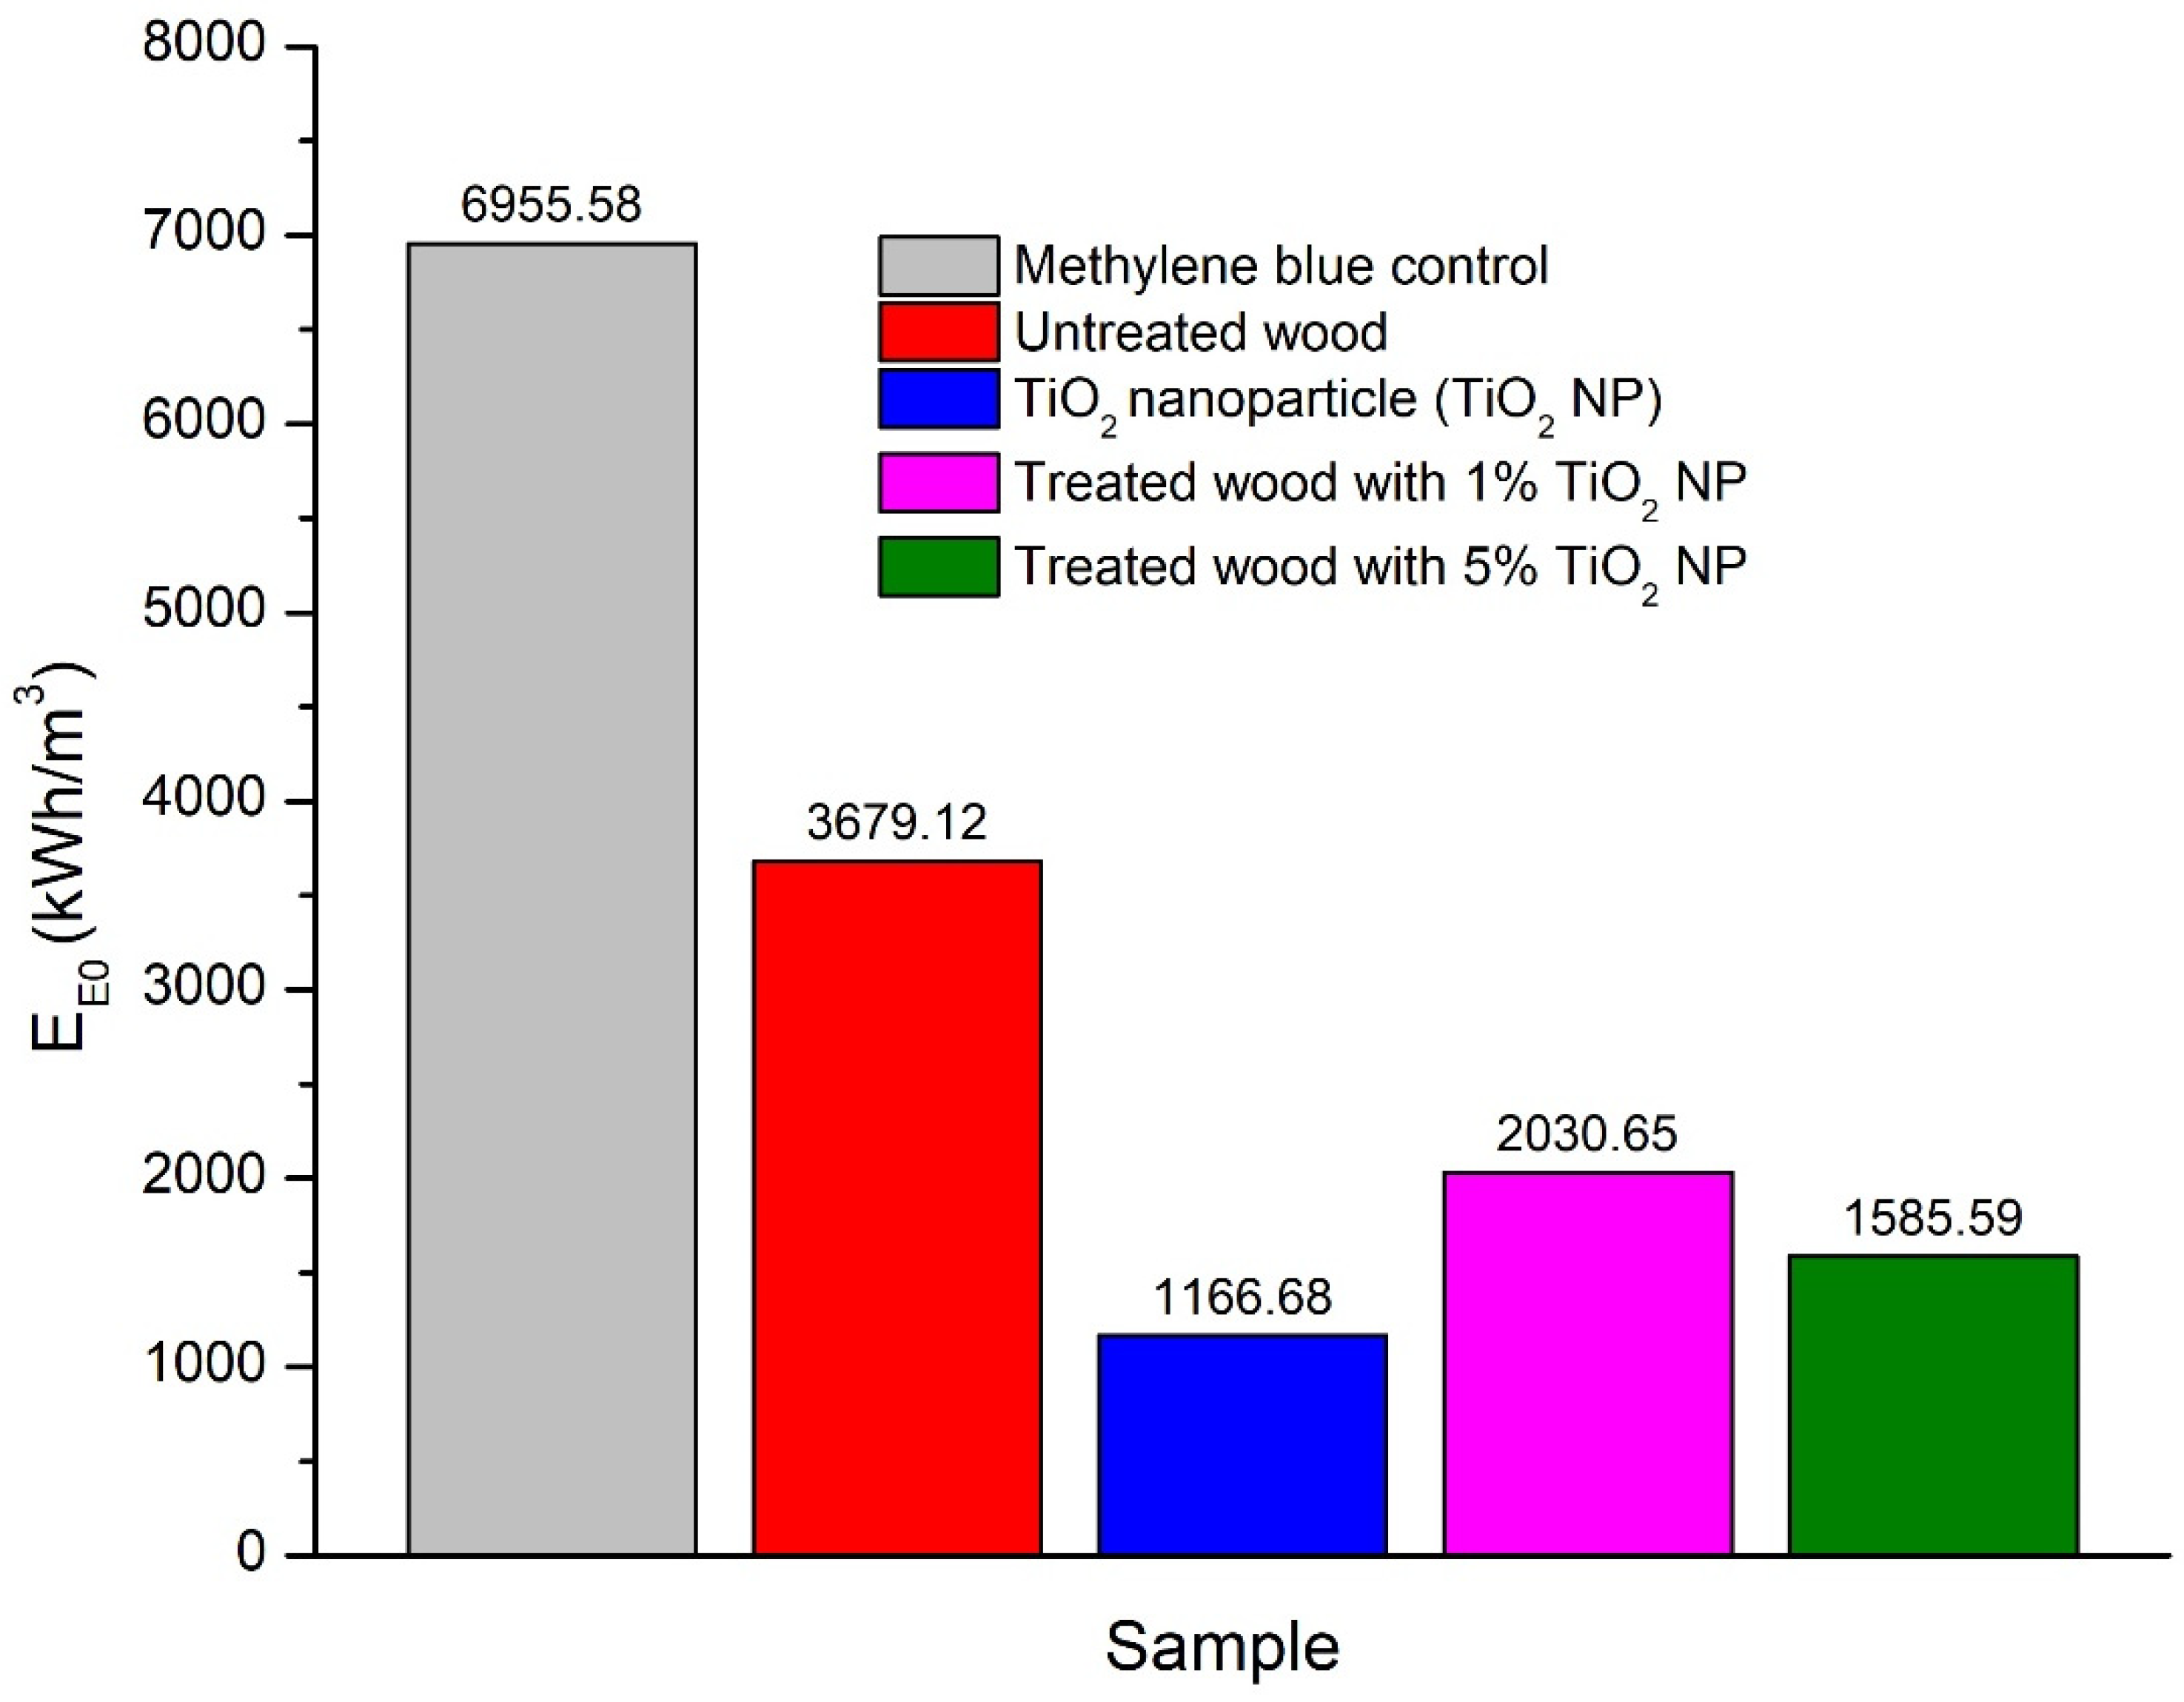
3.3.3. Evaluation of TiO2 Nanoparticle Anatase Efficiency on the Degradation of Methylene Blue
3.3.4. UV-Vis Radiation Analysis
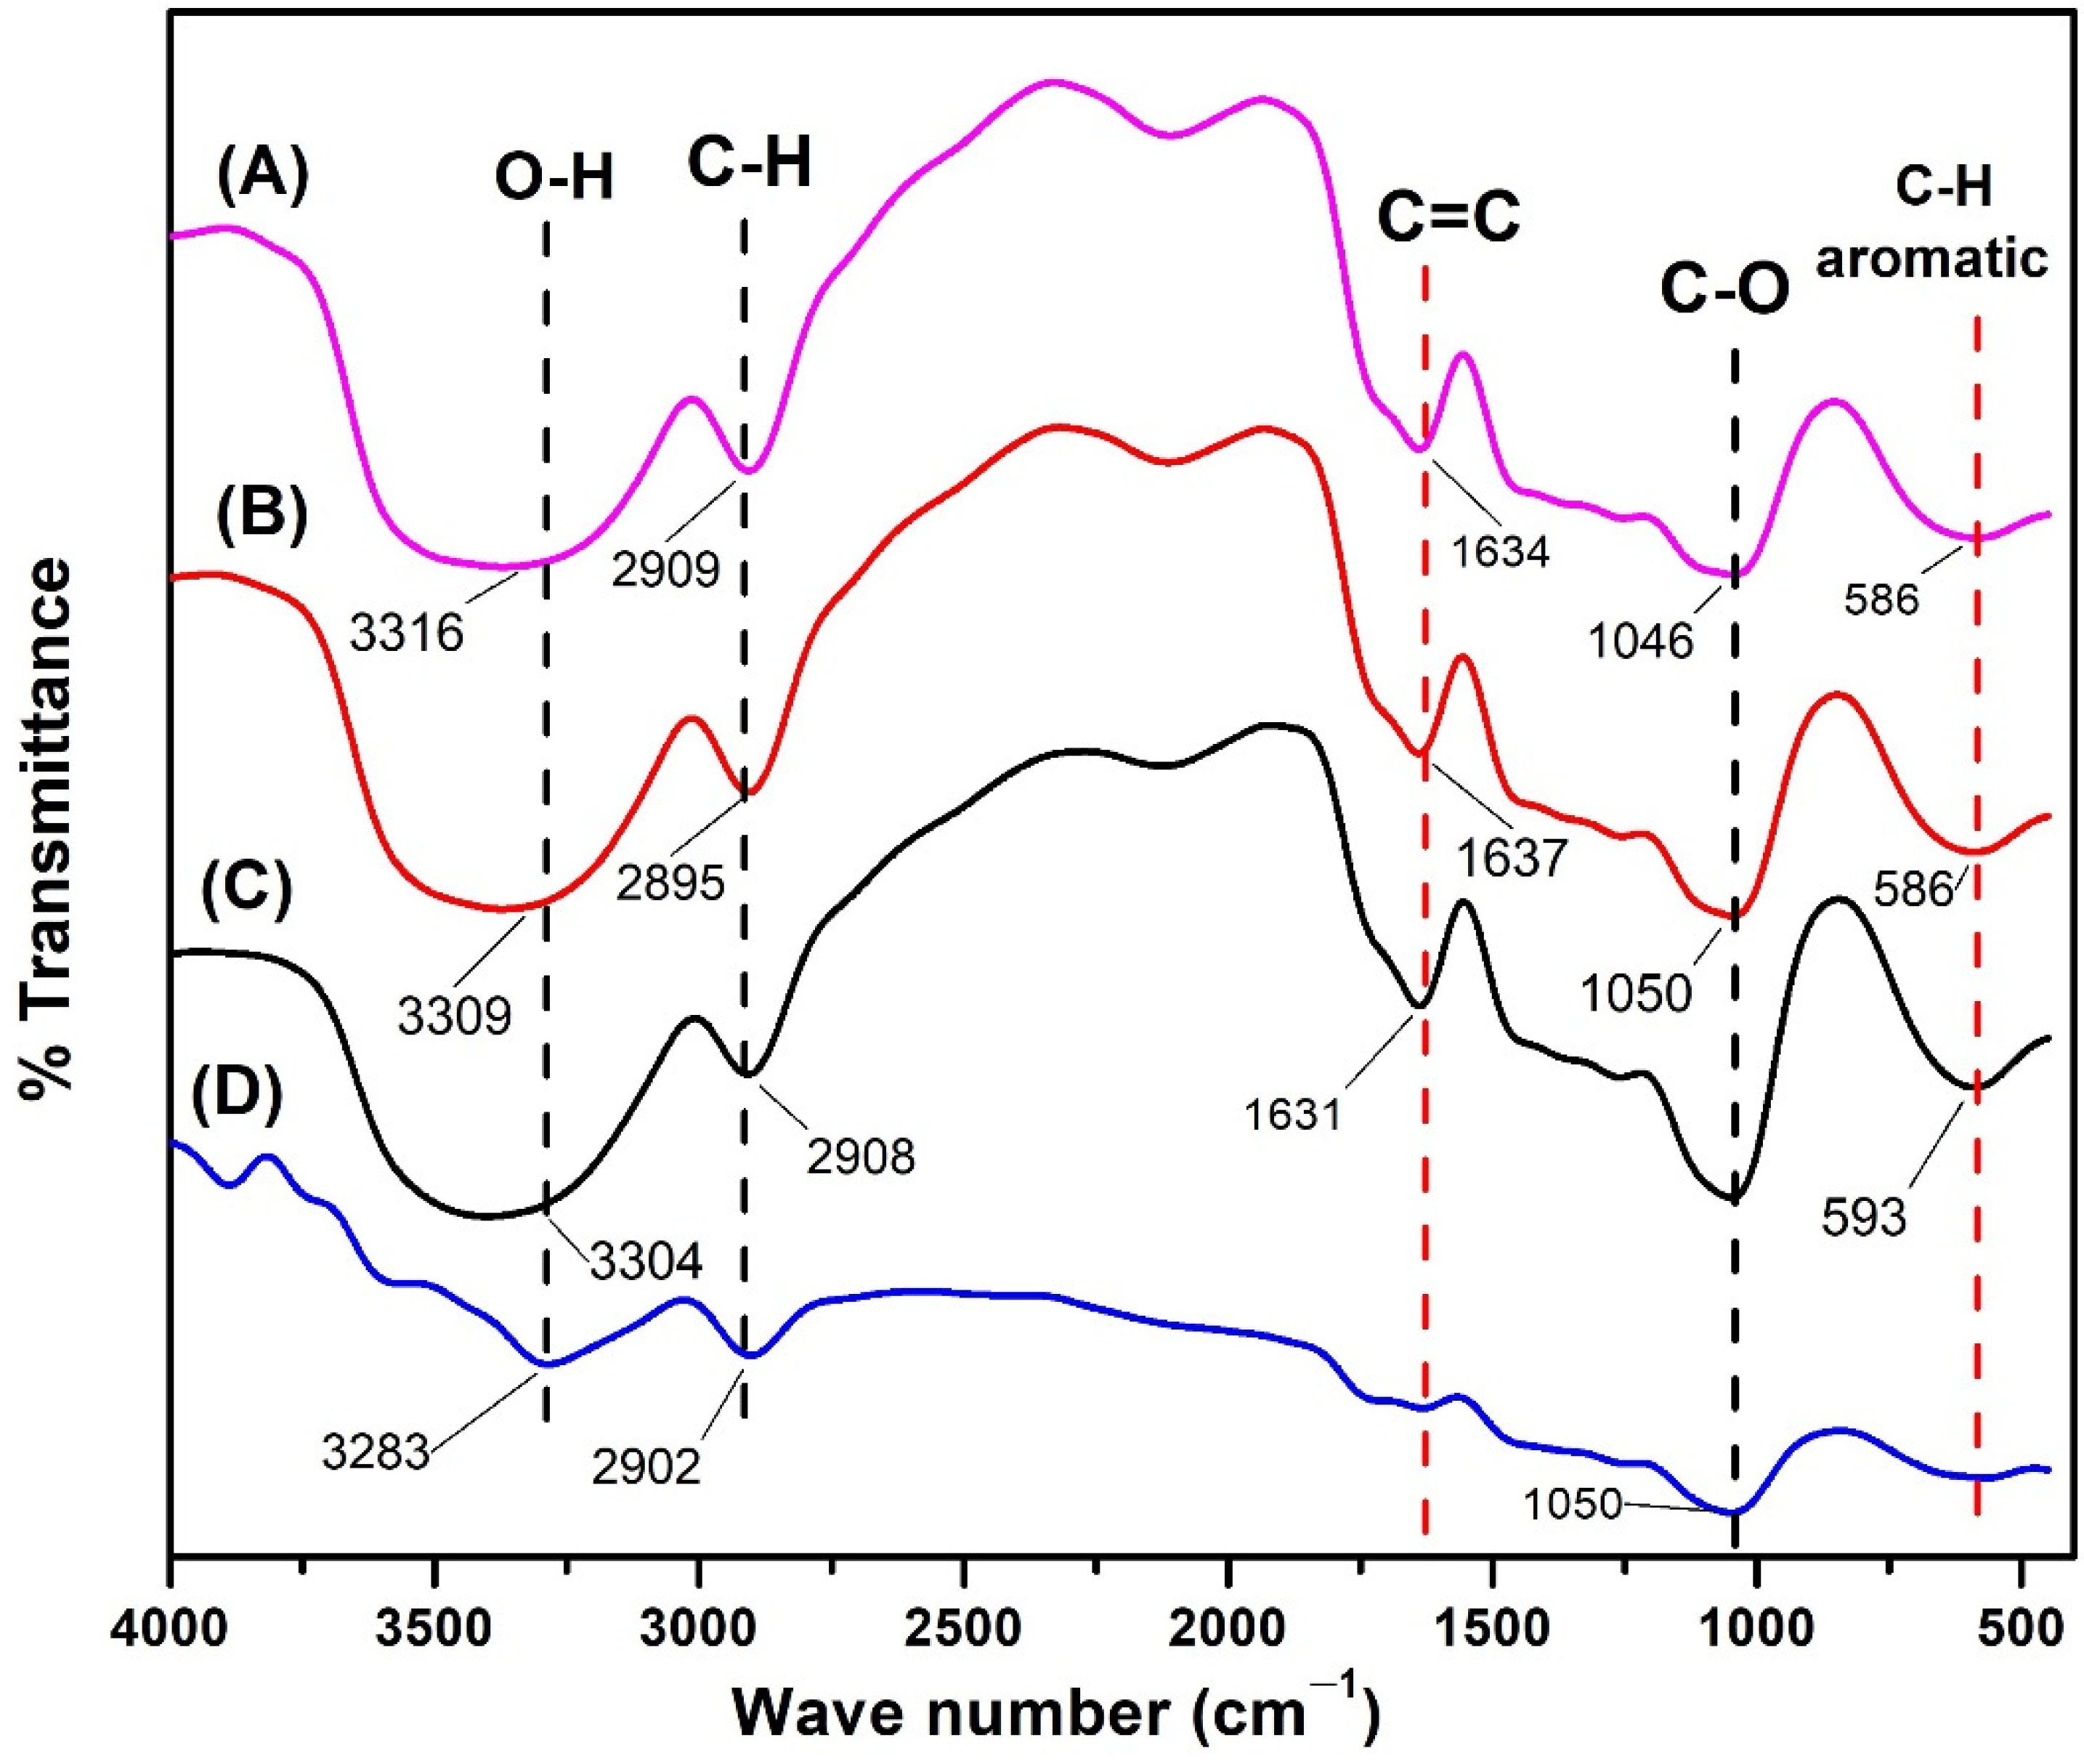
3.3.5. FTIR
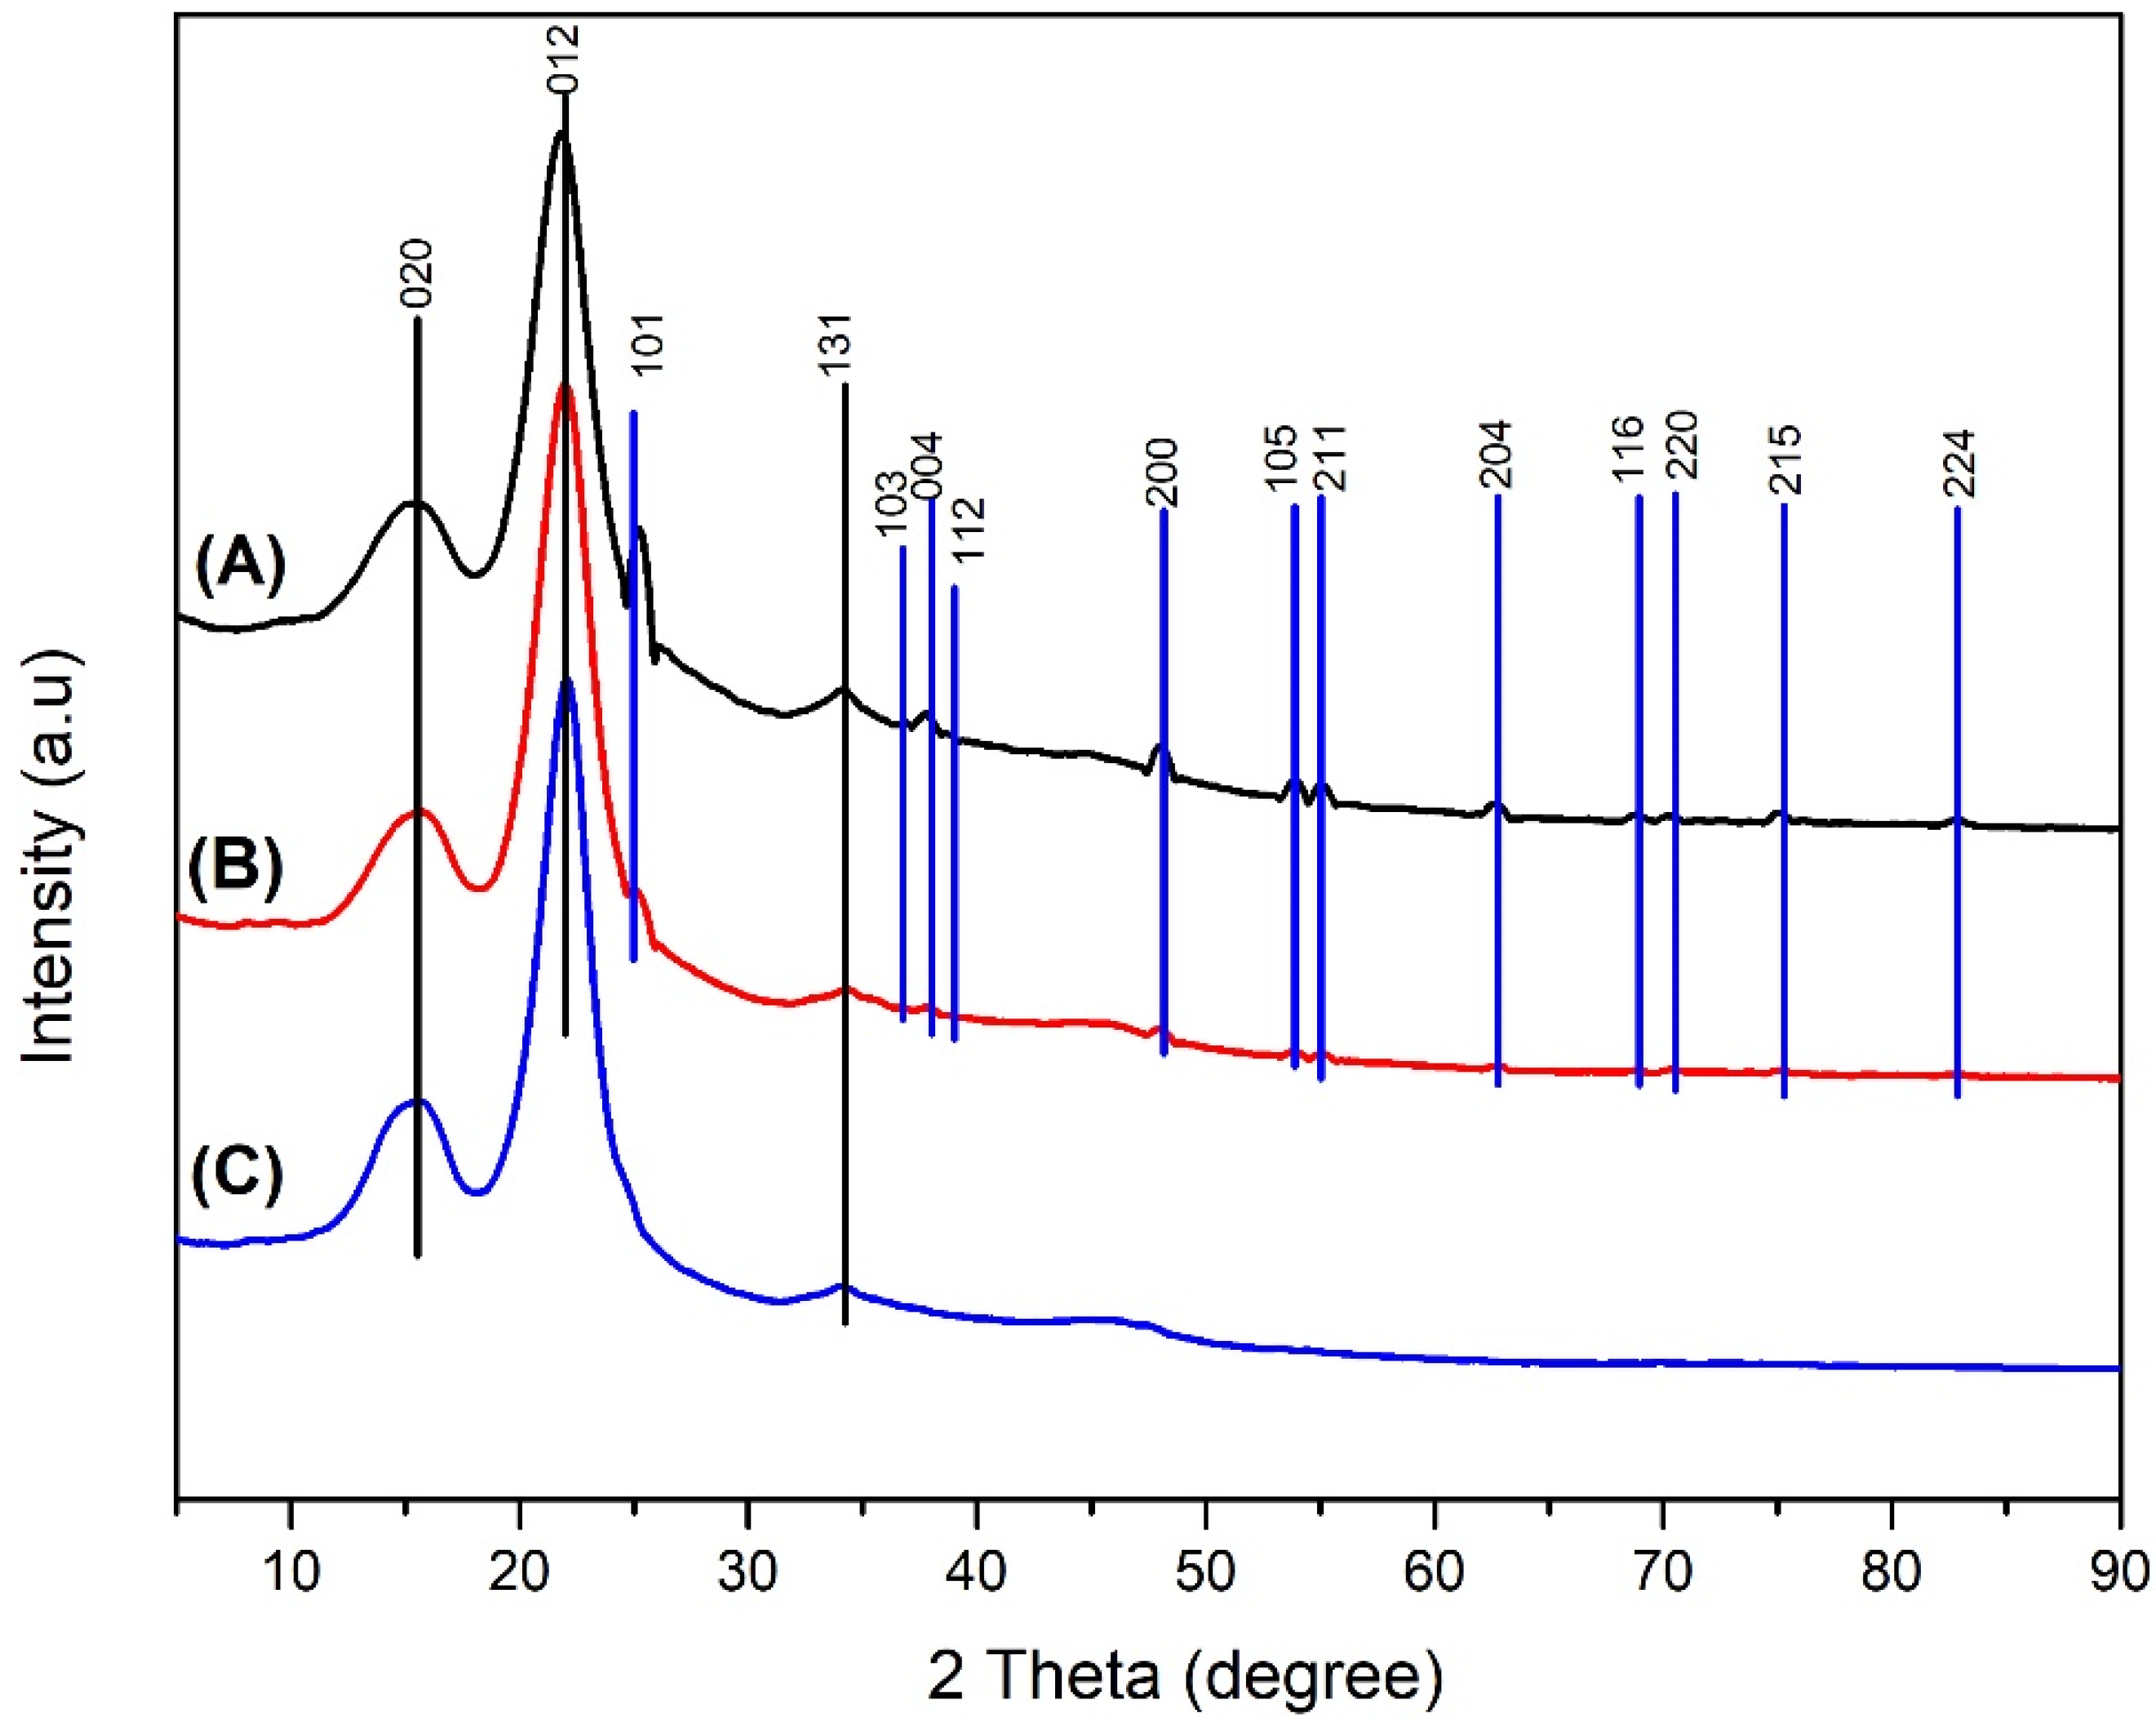
3.3.6. XRD
4. Discussion
4.1. Synthesized TiO2 Nanoparticle
XRD Analysis
4.2. Physical Properties of Mangium Wood
4.3. Characteristics of Mangium Wood Impregnated with TiO2 Nanoparticle
4.3.1. SEM-EDX Analysis
4.3.2. Photocatalyst Activity Test
4.3.3. Evaluation of TiO2 Anatase Nanoparticle Efficiency on The Degradation of Methylene Blue
4.3.4. UV-Vis Radiation Analysis
4.3.5. FTIR
4.3.6. XRD
5. Conclusions
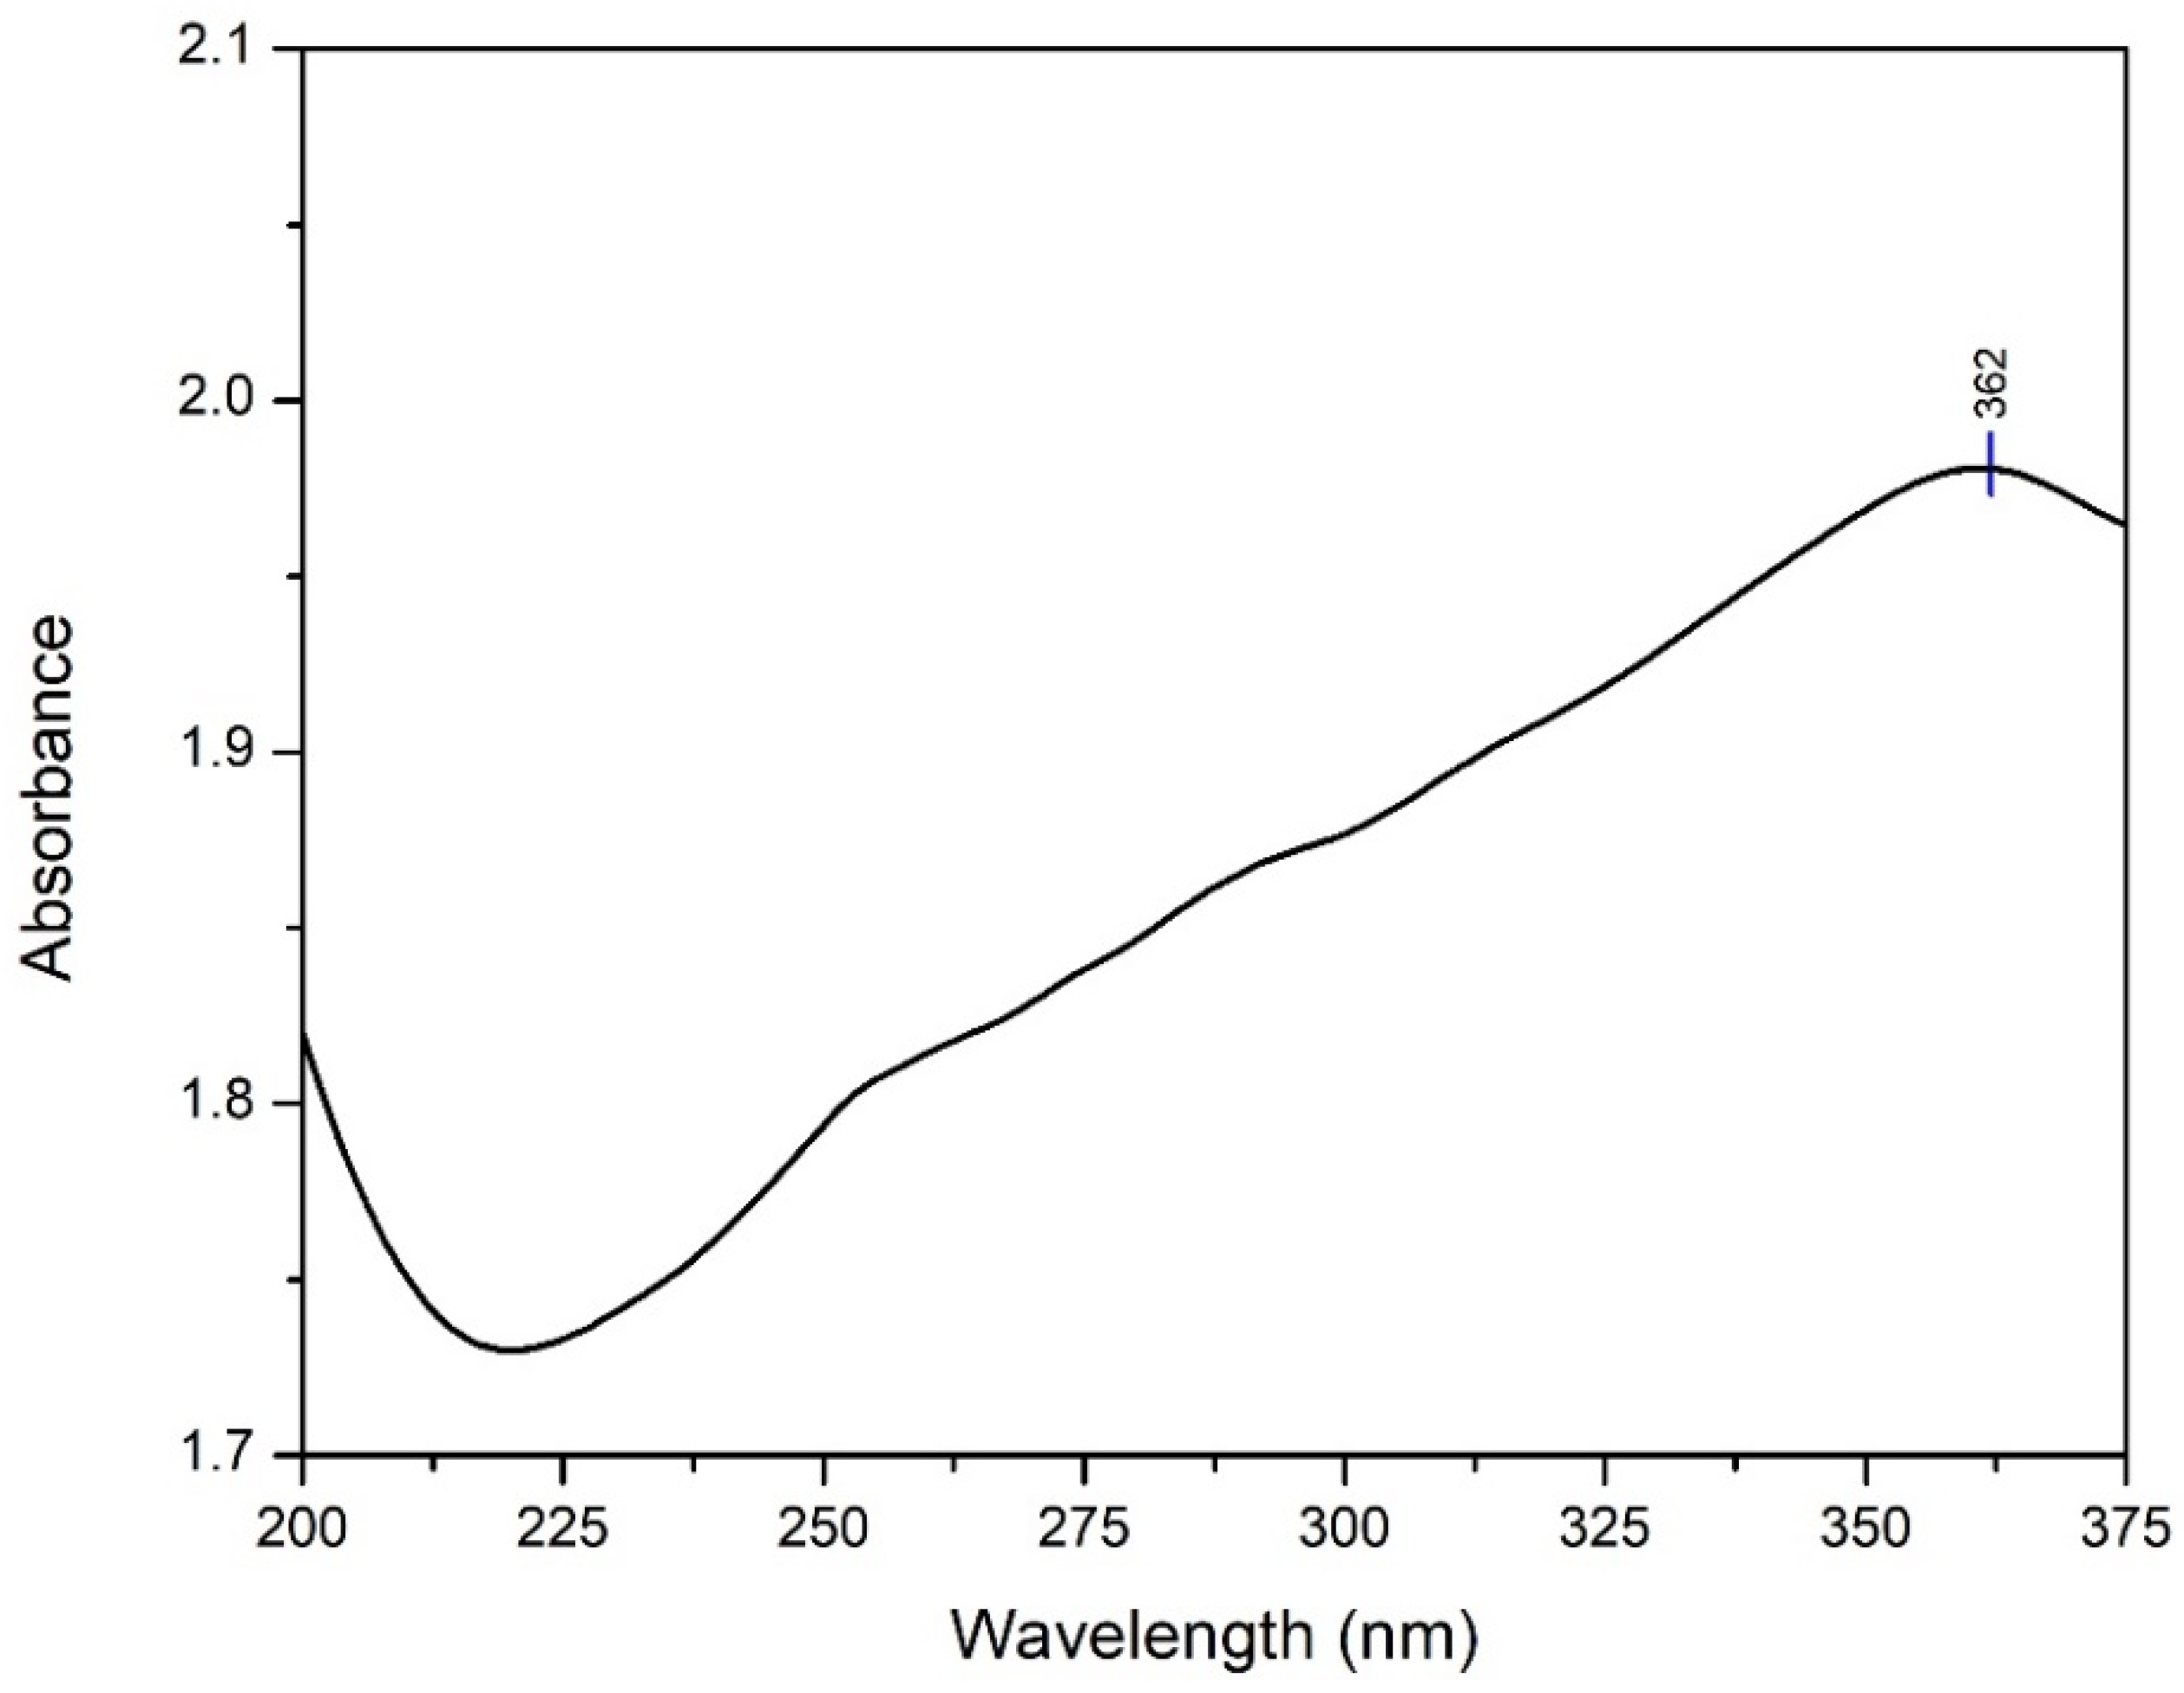
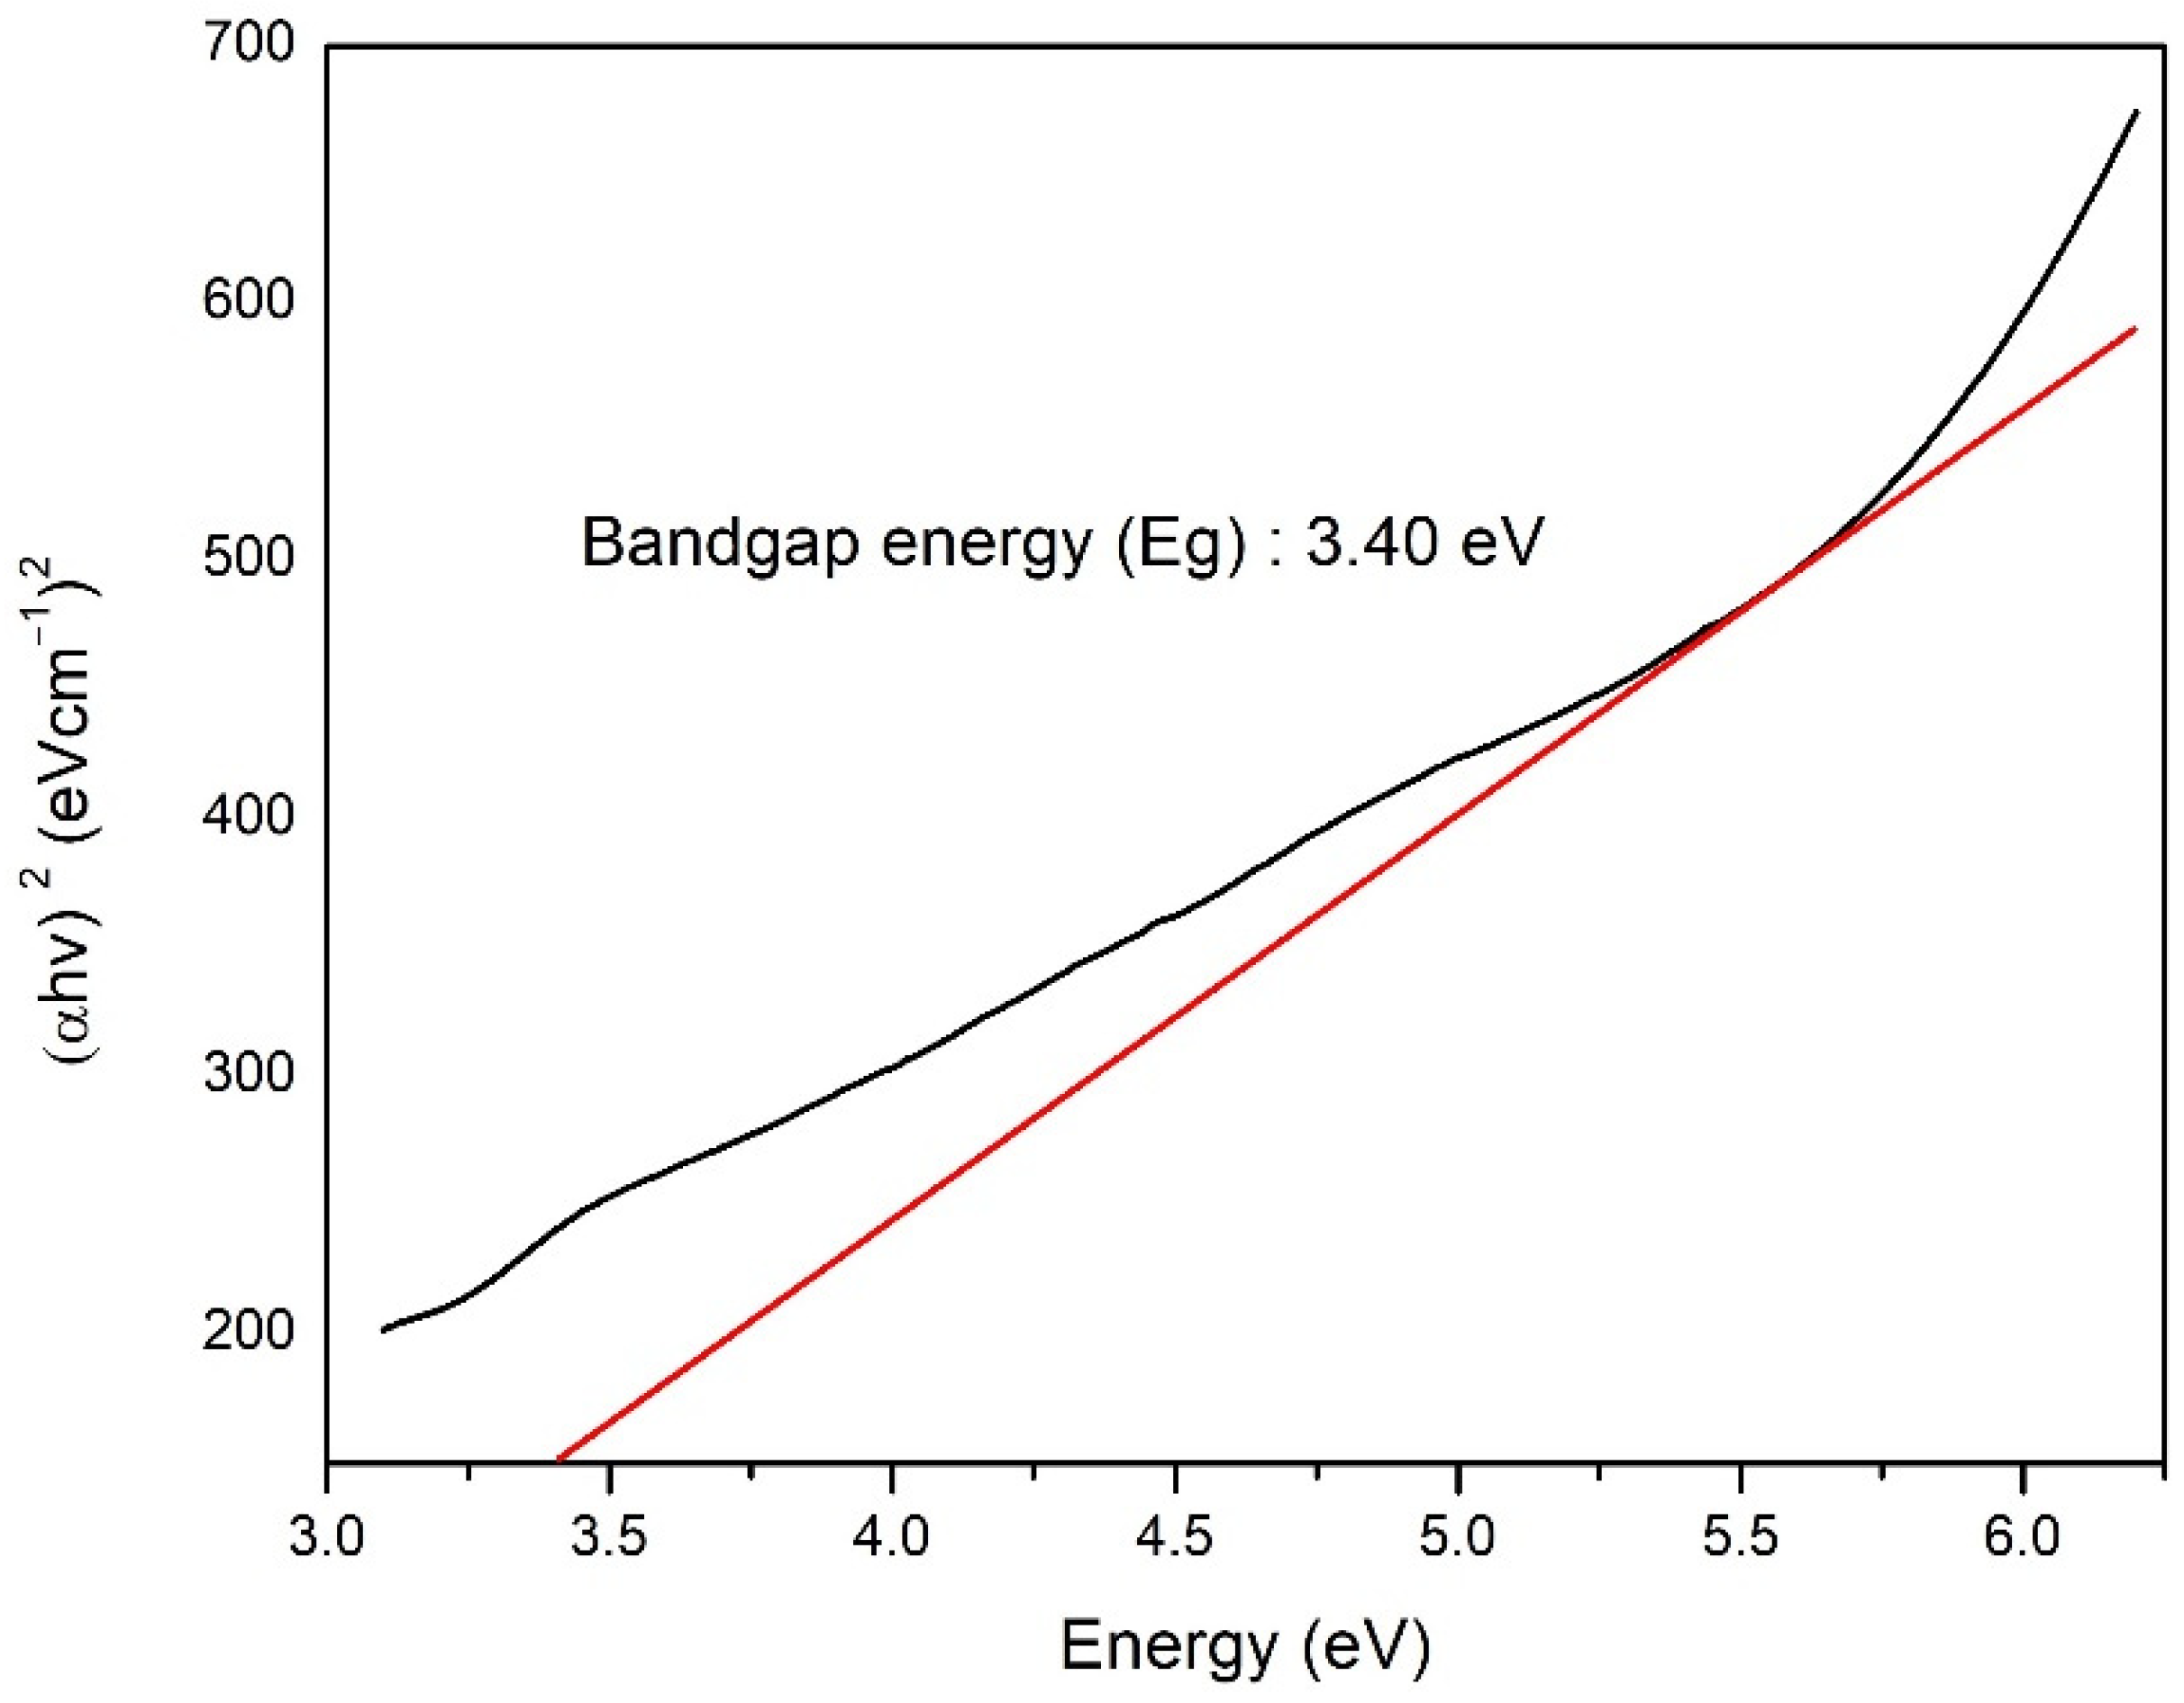
- Anatase TiO2 nanoparticle has been successfully synthesized by hydrothermal method at low temperatures based on the results of characterization with spectrophotometer Uv-Vis, XRD, and FTIR. Anatase TiO2 nanoparticle has maximum wavelength of 362 nm and band gap energy of 3.40 eV.
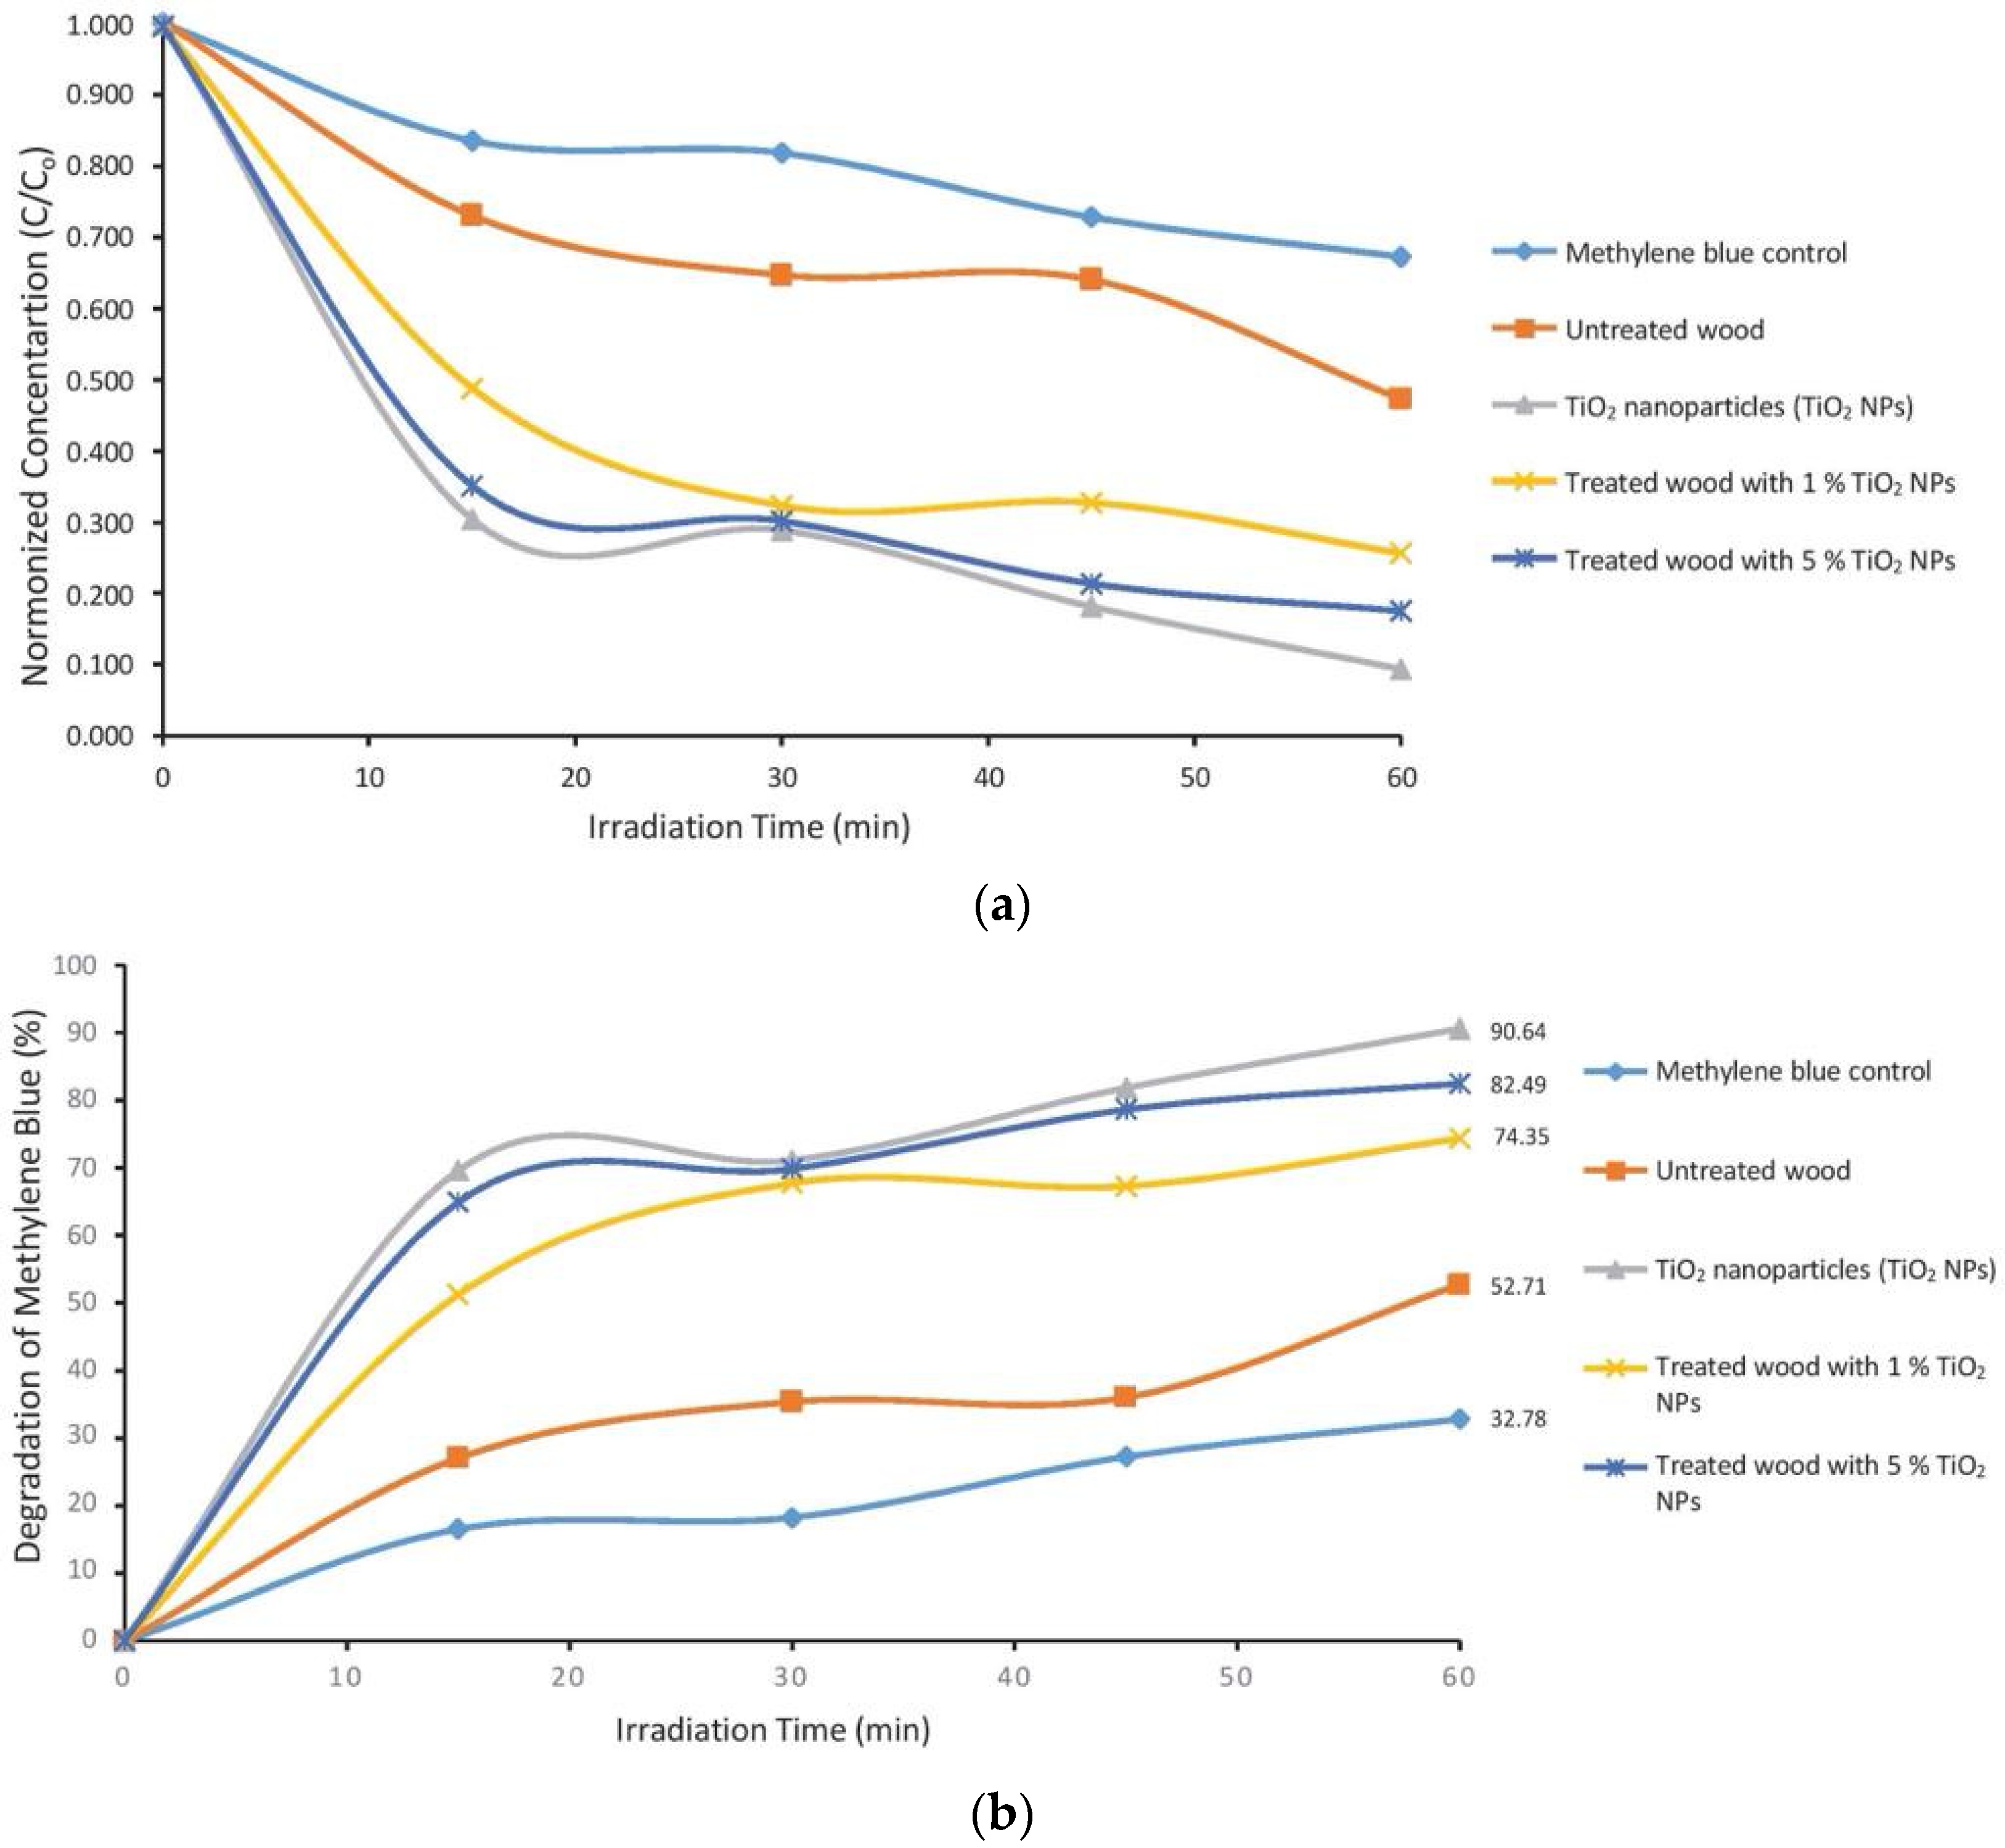
- The values of EEo and kinetic profile proved that mangium wood impregnated with TiO2 nanoparticle has the ability to degrade methylene blue as the organic pollutant.
- Density and dimensional stability of treated mangium wood increased compared with untreated. Five percent TiO2 nanoparticle treatment obtained higher WPG, BE, ASE, and leachability values; however, lower WU values than that of untreated and 1% TiO2 nanoparticle.
- Based on XRD and FTIR analysis, TiO2 nanoparticle was successfully impregnated into mangium wood. Scanning electron microscopy–energy-dispersive X-ray spectroscopy analysis indicated that TiO2 nanoparticle covered the surface of the wood cells. The TiO2-impregnated mangium wood has a higher photocatalyst activity than untreated, indicating better protection from UV radiation and pollutants.
Author Contributions
Funding
Institutional Review Board Statement
Informed Consent Statement
Data Availability Statement
Acknowledgments
Conflicts of Interest
References
- Central Bureau of Statistics [BPS]. Central Bureau of Statistics. Available online: http://www.bps.go.id (accessed on 2 February 2022).
- Indonesian Information Portal. Available online: https://www.indonesia.go.id/narasi/indonesia-dalam-angka/ekonomi/usaha-berbasis-kayu-tetap-jalan-hutan-pun-tetap-lestari (accessed on 2 February 2022).
- Pandit, I.K.N.; Kurniawan, D. Wood Anatomy: Wood Structure, Wood as Raw Material and Diagnostic Characteristics of Indonesian Trade Timber; Bogor Agricultural University: Bogor, Indonesia, 2008. [Google Scholar]
- Rowell, R.M.; Ellis, W.D. Determination of dimensional stabilization of wood using the water-soak method. Wood Fiber Sci. 1978, 10, 104–111. [Google Scholar]
- Van Chu, T.; Van Chuong, P.; Tuong, V.M. Wettability of Wood Pressure-treated with TiO2 Gel under Hydrothermal Conditions. BioResources 2014, 9, 2396–2404. [Google Scholar] [CrossRef] [Green Version]
- Hill, C.A.S. Wood Modification: Chemical, Thermal and Other Processes; John Wiley and Sons: Hoboken, NJ, USA, 2006; ISBN 9780470021729. [Google Scholar]
- Bryne, L.E.; Wålinder, M.E.P. Ageing of modified wood. Part 1: Wetting properties of acetylated, furfurylated, and thermally modified wood. Holzforschung 2010, 64, 295–304. [Google Scholar] [CrossRef]
- Wardani, L.; Risnasari, I.; Yasni, H.Y. Resistance of jabon timber modified with styrene and methyl methacrylate against drywood termites and subterranean termites. In Proceedings of the 9th Pacific Rim Termite Research Group Conference, Hanoi, Vietnam, 27–28 February 2012; Science and Technics Publishing House: Hanoi, Vietnam, 2012; pp. 73–78. [Google Scholar]
- Hadi, Y.S.; Rahayu, I.S.; Danu, S. Physical and mechanical properties of methyl methacrylate impregnated jabon wood. J. Indian Acad. Wood Sci. 2013, 10, 77–80. [Google Scholar] [CrossRef]
- Hadi, Y.S.; Rahayu, I.S.; Danu, S. Termite resistance of jabon wood impregnated with methyl methacrylate. J. Trop. For. Sci. 2015, 27, 25–29. [Google Scholar]
- Gabrielli, C.P.; Kamke, F.A. Phenol-formaldehyde impregnation of densified wood for improved dimensional stability. Wood Sci. Technol. 2010, 44, 95–104. [Google Scholar] [CrossRef]
- Fukuta, S.; Watanabe, A.; Akahori, Y.; Makita, A.; Imamura, Y.; Sasaki, Y. Bending properties of compressed wood impregnated with phenolic resin through drilled holes. Eur. J. Wood Wood Prod. 2011, 69, 633–639. [Google Scholar] [CrossRef]
- Rahayu, I.; Darmawan, W.; Zaini, L.H.; Prihatini, E. Characteristics of fast-growing wood impregnated with nanoparticles. J. For. Res. 2020, 31, 677–685. [Google Scholar] [CrossRef]
- Prihatini, E.; Maddu, A.; Rahayu, I.S.; Kurniati, M.; Darmawan, W. Improvement of physical properties of jabon (Anthocephalus cadamba) through the impregnation of nano-SiO2 and melamin formaldehyde furfuril alcohol copolymer. In IOP Conference Series: Materials Science and Engineering; IOP Publishing: Bristol, UK, 2020; Volume 935. [Google Scholar] [CrossRef]
- Rahayu, I.; Prihatini, E.; Ismail, R.; Darmawan, W.; Karlinasari, L.; Laksono, G.D. Fast-Growing Magnetic Wood Synthesis by an In-Situ Method. Polymers 2022, 14, 2137. [Google Scholar] [CrossRef]
- Fuva, S.M.; Hovde, P.J. Nano-based modifications of wood and their environmental impact: A review. In Proceedings of the World Conference on Timber Engineering, River Del Garda Trentino, Italy, 20–24 June 2010. [Google Scholar]
- Wang, B.; Feng, M.; Zhan, H. Improvement of wood properties by impregnation with TiO2 via ultrasonic-assisted sol-gel process. RSC Adv. 2014, 4, 56355–56360. [Google Scholar] [CrossRef]
- Kim, T.K.; Lee, M.N.; Lee, S.H.; Park, Y.C.; Jung, C.K.; Boo, J.H. Development of surface coating technology of TiO2 powder and improvement of photocatalytic activity by surface modification. Thin Solid Films 2005, 475, 171–177. [Google Scholar] [CrossRef]
- Chen, X.D.; Wang, Z.; Liao, Z.F.; Mai, Y.L.; Zhang, M.Q. Roles of anatase and rutile TiO2 nanoparticles in photooxidation of polyurethane. Polym. Test. 2007, 26, 202–208. [Google Scholar] [CrossRef]
- Sun, Q.; Yu, H.; Liu, Y.; Li, J.; Lu, Y.; Hunt, J.F. Improvement of water resistance and dimensional stability of wood through titanium dioxide coating. Holzforschung 2010, 64, 757–761. [Google Scholar] [CrossRef]
- Sun, Q.; Yu, H.; Liu, Y.; Li, J.; Cui, Y.; Lu, Y. Prolonging the combustion duration of wood by TiO2 coating synthesized using cosolvent-controlled hydrothermal method. J. Mater. Sci. 2010, 45, 6661–6667. [Google Scholar] [CrossRef]
- Shabir Mahr, M.; Hübert, T.; Stephan, I.; Militz, H. Decay protection of wood against brown-rot fungi by titanium alkoxide impregnations. Int. Biodeterior. Biodegrad. 2013, 77, 56–62. [Google Scholar] [CrossRef]
- Mahltig, B.; Swaboda, C.; Roessler, A.; Böttcher, H. Functionalising wood by nanosol application. J. Mater. Chem. 2008, 18, 3180–3192. [Google Scholar] [CrossRef]
- Rassam, G.; Abdi, Y.; Abdi, A. Deposition of TiO2 nano-particles on wood surfaces for UV and moisture protection. J. Exp. Nanosci. 2012, 7, 468–476. [Google Scholar] [CrossRef] [Green Version]
- Schmalzl, K.J.; Evans, P.D. Wood surface protection with some titanium, zirconium and manganese compounds. Polym. Degrad. Stab. 2003, 82, 409–419. [Google Scholar] [CrossRef]
- Sun, Q.; Lu, Y.; Zhang, H.; Zhao, H.; Yu, H.; Xu, J.; Fu, Y.; Yang, D.; Liu, Y. Hydrothermal fabrication of rutile TiO2 submicrospheres on wood surface: An efficient method to prepare UV-protective wood. Mater. Chem. Phys. 2012, 133, 253–258. [Google Scholar] [CrossRef]
- Tshabalala, M.A.; Libert, R.; Schaller, C.M. Photostability and moisture uptake properties of wood veneers coated with a combination of thin sol-gel films and light stabilizers. Holzforschung 2011, 65, 215–220. [Google Scholar] [CrossRef]
- Meng, L.Y.; Wang, B.; Ma, M.G.; Lin, K.L. The progress of microwave-assisted hydrothermal method in the synthesis of functional nanomaterials. Mater. Today Chem. 2016, 1–2, 63–83. [Google Scholar] [CrossRef]
- Liu, S.X.; Chen, X.Y.; Chen, X. A TiO2/AC composite photocatalyst with high activity and easy separation prepared by a hydrothermal method. J. Hazard. Mater. 2007, 143, 257–263. [Google Scholar] [CrossRef]
- Kontos, A.I.; Arabatzis, I.M.; Tsoukleris, D.S.; Kontos, A.G.; Bernard, M.C.; Petrakis, D.E.; Falaras, P. Efficient photocatalysts by hydrothermal treatment of TiO2. Catal. Today 2005, 101, 275–281. [Google Scholar] [CrossRef]
- Zhu, J.; Zheng, W.; He, B.; Zhang, J.; Anpo, M. Characterization of Fe-TiO2 photocatalysts synthesized by hydrothermal method and their photocatalytic reactivity for photodegradation of XRG dye diluted in water. J. Mol. Catal. A Chem. 2004, 216, 35–43. [Google Scholar] [CrossRef]
- Aneesh, P.M.; Vanaja, K.A.; Jayaraj, M.K. Synthesis of ZnO nanoparticles by hydrothermal method. In Proceedings of the Nanophotonic Materials IV, San Diego, CA, USA, 26–30 August 2007; SPIE: Bellingham, WC, USA, 2007; Volume 6639, p. 66390J. [Google Scholar] [CrossRef]
- Yang, Y.; Zhao, S.; Bi, F.; Chen, J.; Wang, Y.; Cui, L.; Xu, J.; Zhang, X. Highly efficient photothermal catalysis of toluene over Co3O4/TiO2 p-n heterojunction: The crucial roles of interface defects and band structure. Appl. Catal. B Environ. 2022, 315, 121550. [Google Scholar] [CrossRef]
- Yang, Y.; Zhao, S.; Bi, F.; Chen, J.; Li, Y.; Cui, L.; Xu, J.; Zhang, X. Oxygen-vacancy-induced O2 activation and electron-hole migration enhance photothermal catalytic toluene oxidation. Cell Rep. Phys. Sci. 2022, 3, 101011. [Google Scholar] [CrossRef]
- Morais, E.; O’Modhrain, C.; Thampi, K.R.; Sullivan, J.A. RuO2/TiO2 photocatalysts prepared via a hydrothermal route: Influence of the presence of TiO2 on the reactivity of RuO2 in the artificial photosynthesis reaction. J. Catal. 2021, 401, 288–296. [Google Scholar] [CrossRef]
- Yin, Z.; Song, T.; Zhou, W.; Wang, Z.; Ma, Y. Highly isolated Pt NPs embedded in porous TiO2 derived from MIL-125 with enhanced photocatalytic hydrogen production activity. J. Catal. 2021, 402, 289–299. [Google Scholar] [CrossRef]
- BS-373; Methods of Testing Small Clear Specimens of Timber. British Standard: London, UK, 1957.
- Shahat, A.M.; El-Hossary, F.M.; Ghitas, A.; Abd El-Rahman, A.M.; Ebnalwaled, A.A. Low-temperature Hydrothermal Synthesis of Titanium Dioxide Nanoparticles for Photocatalytic Applications. In IOP Conference Series: Materials Science and Engineering; IOP Publishing: Bristol, UK, 2021; Volume 1171, p. 012008. [Google Scholar] [CrossRef]
- Krishnan, T. Photocatalytic Degradation of Dyes by TiO2 Process in Batch Photoreactor. Lett. Appl. NanoBioSci. 2020, 9, 1502–1512. [Google Scholar]
- Bagheri, S.; Shameli, K.; Abd Hamid, S.B. Synthesis and characterization of anatase titanium dioxide nanoparticles using egg white solution via Sol-Gel method. J. Chem. 2013, 2013, 6–11. [Google Scholar] [CrossRef]
- Hong, S.; Lee, S.; Jung, H.J.; Yu, Y.; Shin, J.; Kwon, K.-Y.; Choi, M. Simple Preparation of Anatase TiO2 Nanoparticles via Pulsed Laser Ablation in Liquid. Bull. Korean Chem. Soc. 2013, 34, 279–282. [Google Scholar] [CrossRef] [Green Version]
- Zanatta, P.; Lazarotto, M.; de Cademartori, P.H.G.; da Silva Cava, S.; Moreira, M.L.; Gatto, D.A. The effect of titanium dioxide nanoparticles obtained by microwave-assisted hydrothermal method on the color and decay resistance of pinewood. Maderas: Cienc. Tecnol. 2017, 19, 495–506. [Google Scholar] [CrossRef] [Green Version]
- Sharfudeen, B.F.J.M.; Latheef, A.F.A.; Ambrose, R.V. Synthesis and characterization of TiO2 nanoparticles and investigation of antimicrobial activities against human pathogens. J. Pharm. Sci. Res. 2017, 9, 1604–1608. [Google Scholar]
- Hargreaves, J.S.J. Some considerations related to the use of the Scherrer equation in powder X-ray diffraction as applied to heterogeneous catalysts. Catal. Struct. React. 2016, 2, 33–37. [Google Scholar] [CrossRef] [Green Version]
- Khan, I.; Saeed, K.; Khan, I. Nanoparticles: Properties, applications and toxicities. Arab. J. Chem. 2019, 12, 908–931. [Google Scholar] [CrossRef]
- Rathod, P.B.; Waghuley, S.A. Synthesis and UV-Vis spectroscopic study of TiO2 nanoparticles. Int. J. Nanomanufacturing 2015, 11, 185–193. [Google Scholar] [CrossRef]
- Makuła, P.; Pacia, M.; Macyk, W. How to Correctly Determine the Band Gap Energy of Modified Semiconductor Photocatalysts Based on UV-Vis Spectra. J. Phys. Chem. Lett. 2018, 9, 6814–6817. [Google Scholar] [CrossRef] [Green Version]
- Altomare, A.; Corriero, N.; Cuocci, C.; Falcicchio, A.; Moliterni, A.; Rizzi, R. QUALX2.0: A qualitative phase analysis software using the freely available database POW-COD. J. Appl. Crystallogr. 2015, 48, 598–603. [Google Scholar] [CrossRef]
- Dong, Y.; Yan, Y.; Zhang, Y.; Zhang, S.; Li, J. Combined treatment for conversion of fast-growing poplar wood to magnetic wood with high dimensional stability. Wood Sci. Technol. 2016, 50, 503–517. [Google Scholar] [CrossRef]
- Le, S.T.T.; Khanitchaidecha, W.; Nakaruk, A. Photocatalytic reactor for organic compound removal using photocatalytic mechanism. Bull. Mater. Sci. 2016, 39, 569–572. [Google Scholar] [CrossRef] [Green Version]
- Ghavi, A.; Bagherian, G.; Vahidian, H. Degradation of paraquat herbicide using hybrid AOP process: Statistical optimization, kinetic study, and estimation of electrical energy consumption. Environ. Sci. Eur. 2021, 33, 177. [Google Scholar] [CrossRef]
- Makhatova, A.; Ulykbanova, G.; Sadyk, S.; Sarsenbay, K.; Atabaev, T.S.; Inglezakis, V.J.; Poulopoulos, S.G. Degradation and mineralization of 4-tert-butylphenol in water using Fe-doped TiO2 catalysts. Sci. Rep. 2019, 9, 1–15. [Google Scholar] [CrossRef] [Green Version]
- Salehi, M.; Hashemipour, H.; Mirzaee, M. Experimental Study of Influencing Factors and Kinetics in Catalytic Removal of Methylene Blue with TiO2 Nanopowder. Am. J. Environ. Engin. 2012, 2, 1–7. [Google Scholar] [CrossRef] [Green Version]
- Sescu, A.M.; Favier, L.; Lutic, D.; Soto-Donoso, N.; Ciobanu, G.; Harja, M. TiO2 Doped with Noble Metals as an Efficient Solution for the Photodegradation of Hazardous Organic Water Pollutants at Ambient Conditions. Water 2021, 13, 19. [Google Scholar] [CrossRef]
- Coates, J. Interpretation of Infrared Spectra, A Practical Approach; Encyclopedia of Analytical Chemistry, John Wiley & Sons, Ltd.: Chichester, UK, 2006. [Google Scholar] [CrossRef]
- Hartland, G.V. Nanoparticle crystallinity: Is perfect better? Nat. Mater. 2007, 6, 716–718. [Google Scholar] [CrossRef] [PubMed]
- Li, Z.; Shen, W.; He, W.; Zu, X. Effect of Fe-doped TiO2 nanoparticle derived from modified hydrothermal process on the photocatalytic degradation performance on methylene blue. J. Hazard. Mater. 2008, 155, 590–594. [Google Scholar] [CrossRef] [PubMed]
- Zanatta, A.R. Revisiting the optical bandgap of semiconductors and the proposal of a unified methodology to its determination. Sci. Rep. 2019, 9, 1–12. [Google Scholar] [CrossRef] [Green Version]
- Opoku, F.; Govender, K.K.; van Sittert, C.G.C.E.; Govender, P.P. Understanding the synergistic effects, optical and electronic properties of ternary Fe/C/S-doped TiO2 anatase within the DFT + U approach. Int. J. Quantum Chem. 2018, 118, e25505. [Google Scholar] [CrossRef]
- Bowyer, J.L.; Schmulsky, R.; Haygreen, J.G. Forest Products and Wood Science: An Introduction, 5th ed.; Iowa State Press: Ames, IA, USA, 2007. [Google Scholar]
- Devi, R.R.; Maji, T.K. Effect of nanofillers on flame retardancy, chemical resistance, antibacterial properties and biodegradation of wood/styrene acrylonitrile co-polymer composites. Wood Sci. Technol. 2013, 47, 1135–1152. [Google Scholar] [CrossRef]
- Rathnam, V.; Kichu, A.; Dutta, N.; Maji, T.K.; Devi, N. Influence of organically modified nanoclay and TiO2 nanopowder on the properties of Azadirachta indica wood flour-reinforced high-density polyethylene, low-density polyethylene, polypropylene, and polyvinyl chloride nanocomposite. J. Thermoplast. Compos. Mater. 2020, 35, 1–20. [Google Scholar] [CrossRef]
- Marzbani, P.; Mohammadnia-Afrouzi, Y. Investigation on leaching and decay resistance of wood treated with nano- titanium dioxide. Adv. Environ. Biol. 2014, 8, 974–978. [Google Scholar]
- Liu, Y.; Zhu, X.; Yuan, D.; Wang, W.; Gao, L. Preparation and characterization of TiO2 based on wood templates. Sci. Rep. 2020, 10, 1–10. [Google Scholar] [CrossRef]
- Pori, P.; Vilčnik, A.; Petrič, M.; Sever Škapin, A.; Mihelčič, M.; Šurca Vuk, A.; Novak, U.; Orel, B. Structural studies of TiO2 /wood coatings prepared by hydrothermal deposition of rutile particles from TiCl4 aqueous solutions on spruce (Picea Abies) wood. Appl. Surf. Sci. 2016, 372, 125–138. [Google Scholar] [CrossRef]
- Tsang, C.H.A.; Li, K.; Zeng, Y.; Zhao, W.; Zhang, T.; Zhan, Y.; Xie, R.; Leung, D.Y.C.; Huang, H. Titanium oxide based photocatalytic materials development and their role of in the air pollutants degradation: Overview and forecast. Environ. Int. 2019, 125, 200–228. [Google Scholar] [CrossRef]
- Kermani, M.; Jonidi Jafari, A.; Gholami, M.; Shahsavani, A.; Goodarzi, B.; Fanaei, F. Extraction and determination of organic/inorganic pollutants in the ambient air of two cities located in metropolis of Tehran. Environ. Monitor. Assess. 2022, 194, 1–20. [Google Scholar] [CrossRef]
- Guo, H.; Klose, D.; Hou, Y.; Jeschke, G.; Burgert, I. Highly Efficient UV Protection of the Biomaterial Wood by A Transparent TiO2/Ce Xerogel. ACS App. Mater. Inter. 2017, 9, 39040–39047. [Google Scholar] [CrossRef]
- Han, L.; Gao, Y.; Gao, X.; Gong, W.; Wang, H. Degradation of Organic Pollutants by Titanium Dioxide Matrix Composites. In E3S Web of Conferences; EDP Sciences: Ulis, France, 2021; Volume 245, p. 2039. [Google Scholar] [CrossRef]
- Jain, A.; Vaya, D. Photocatalytic Activity of Titanium Dioxide Nanomaterial. J. Chil. Chem. Soc. 2017, 4, 3683–3690. [Google Scholar] [CrossRef] [Green Version]
- Baeissa, E. Photocatalytic degradation of methylene blue dye under visible light irradiation using In/ZnO nanocomposite. Front. Nanosci. Nanotechnol. 2016, 2, 1–5. [Google Scholar] [CrossRef]
- Luminita Udrea, M.; Ion, R.-M. Modelling of Methylene Blue Dye Adsorption on Beech and Fir Wood Sawdust As Adsorbent Support Materials. J. Sci. Arts Year 2019, 19, 675–686. [Google Scholar]
- Raheb, I.; Manlla, M.S. Kinetic and thermodynamic studies of the degradation of methylene blue by photo-Fenton reaction. Heliyon 2021, 7, e07427. [Google Scholar] [CrossRef]
- Varma, K.S.; Tayade, R.J.; Shah, K.J.; Joshi, P.A.; Shukla, A.D.; Gandhi, V.G. Photocatalytic degradation of pharmaceutical and pesticide compounds (PPCs) using doped TiO2 nanomaterials: A review. Water-Energy Nexus 2020, 3, 46–61. [Google Scholar] [CrossRef]
- Azeez, F.; Al-Hetlani, E.; Arafa, M.; Abdelmonem, Y.; Abdel Nazeer, A.; Amin, M.; Madkour, M. The effect of surface charge on photocatalytic degradation of methylene blue dye using chargeable titania nanoparticles. Sci. Rep. 2018, 8, 1–9. [Google Scholar] [CrossRef] [Green Version]
- Pandey, K.K.; Ramakantha, V.; Chauhan, S.S.; Arun Kumar, A.N. Wood is good: Current trends and future prospects in wood utilization. In Wood is Good; Springer: New York, NY, USA, 2017; pp. 1–480. [Google Scholar] [CrossRef]
- Hazarika, A.; Maji, T.K. Synergistic effect of nano-TiO2 and nanoclay on the ultraviolet degradation and physical properties of wood polymer nanocomposites. Ind. Eng. Chem. Res. 2013, 52, 13536–13546. [Google Scholar] [CrossRef]
- Mayerhöfer, T.G.; Popp, J. The electric field standing wave effect in infrared transflection spectroscopy. Spectrochim. Acta-Part A Mol. Biomol. Spectrosc. 2018, 191, 283–289. [Google Scholar] [CrossRef]
- Pereira, H.; Graça, J.; Rodrigues, J. Wood Chemistry in Relation to Quality. Cheminform 2004, 35, 53–86. [Google Scholar] [CrossRef]
- Bi, W.; Li, H.; Hui, D.; Gaff, M.; Lorenzo, R.; Corbi, I.; Corbi, O.; Ashraf, M. Effects of chemical modification and nanotechnology on wood properties. Nanotechnol. Rev. 2021, 10, 978–1008. [Google Scholar] [CrossRef]
- Osman, A.I.; Blewitt, J.; Abu-Dahrieh, J.K.; Farrell, C.; Al-Muhtaseb, A.H.; Harrison, J.; Rooney, D.W. Production and characterisation of activated carbon and carbon nanotubes from potato peel waste and their application in heavy metal removal. Environ. Sci. Pollut. Res. 2019, 26, 37228–37241. [Google Scholar] [CrossRef] [Green Version]
- Dong, Y.; Yan, Y.; Zhang, S.; Li, J. Wood/polymer nanocomposites prepared by impregnation with furfuryl alcohol and Nano-SiO2. BioResources 2014, 9, 6028–6040. [Google Scholar] [CrossRef] [Green Version]
- Wang, M.; Wang, W.; He, B.L.; Sun, M.L.; Bao, Y.S.; Yin, Y.S.; Liu, L.; Zou, W.Y.; Xu, X.F. Corrosion behavior of hydrophobic titanium oxide film pre-treated in hydrogen peroxide solution. Mater. Corros. 2011, 62, 320–325. [Google Scholar] [CrossRef]
- Sompech, S.; Srion, A.; Nuntiya, A. The effect of ultrasonic treatment on the particle size and specific surface area of LaCoO3. Procedia Eng. 2012, 32, 1012–1018. [Google Scholar] [CrossRef]


| Sample | Density | WPG | BE | WU | ASE | L |
|---|---|---|---|---|---|---|
| Untreated | 0.54 ± 0.02 a | 0.21 ± 0.14 a | 1.04 ± 0.69 a | 50.29 ± 4.45 a | 0.00 a | 0.44 ± 0.19 a |
| 1% TiO2 nanoparticle | 0.55 ± 0.02 ab | 0.53 ± 0.22 a | 1.14 ± 0.47 a | 49.08 ± 7.80 a | 15.46 ± 9.52 b | 0.57 ± 0.21 a |
| 5% TiO2 nanoparticle | 0.57± 0.03 b | 2.76 ± 0.72 b | 2.10 ± 1.03 b | 46.66 ± 6.67 a | 21.76 ± 7.97 b | 0.43 ± 0.15 a |
| Sample | Ti (%Wt) |
|---|---|
| Untreated | - |
| 1% TiO2 nanoparticle | 0.35 |
| 5% TiO2 nanoparticle | 4.69 |
| Sample | Degree of Crystallinity (%) |
|---|---|
| Untreated | 71.98 |
| 1% TiO2 nanoparticle | 74.17 |
| 5% TiO2 nanoparticle | 65.13 |
Publisher’s Note: MDPI stays neutral with regard to jurisdictional claims in published maps and institutional affiliations. |
© 2022 by the authors. Licensee MDPI, Basel, Switzerland. This article is an open access article distributed under the terms and conditions of the Creative Commons Attribution (CC BY) license (https://creativecommons.org/licenses/by/4.0/).
Share and Cite
Rahayu, I.; Darmawan, W.; Nawawi, D.S.; Prihatini, E.; Ismail, R.; Laksono, G.D. Physical Properties of Fast-Growing Wood-Polymer Nano Composite Synthesized through TiO2 Nanoparticle Impregnation. Polymers 2022, 14, 4463. https://doi.org/10.3390/polym14204463
Rahayu I, Darmawan W, Nawawi DS, Prihatini E, Ismail R, Laksono GD. Physical Properties of Fast-Growing Wood-Polymer Nano Composite Synthesized through TiO2 Nanoparticle Impregnation. Polymers. 2022; 14(20):4463. https://doi.org/10.3390/polym14204463
Chicago/Turabian StyleRahayu, Istie, Wayan Darmawan, Deded Sarip Nawawi, Esti Prihatini, Rohmat Ismail, and Gilang Dwi Laksono. 2022. "Physical Properties of Fast-Growing Wood-Polymer Nano Composite Synthesized through TiO2 Nanoparticle Impregnation" Polymers 14, no. 20: 4463. https://doi.org/10.3390/polym14204463