
Whey Protein Films for Sustainable Food Packaging: Effect of Incorporated Ascorbic Acid and Environmental Assessment

 and
and 
Abstract
: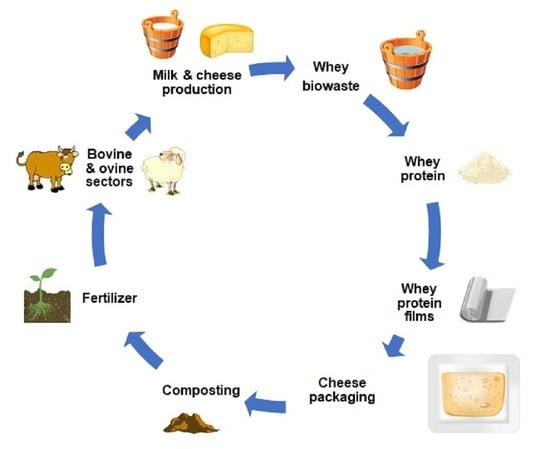
1. Introduction
2. Materials and Methods
2.1. Materials
2.2. Film Preparation
2.3. Film Characterisation
2.3.1. Film Thickness
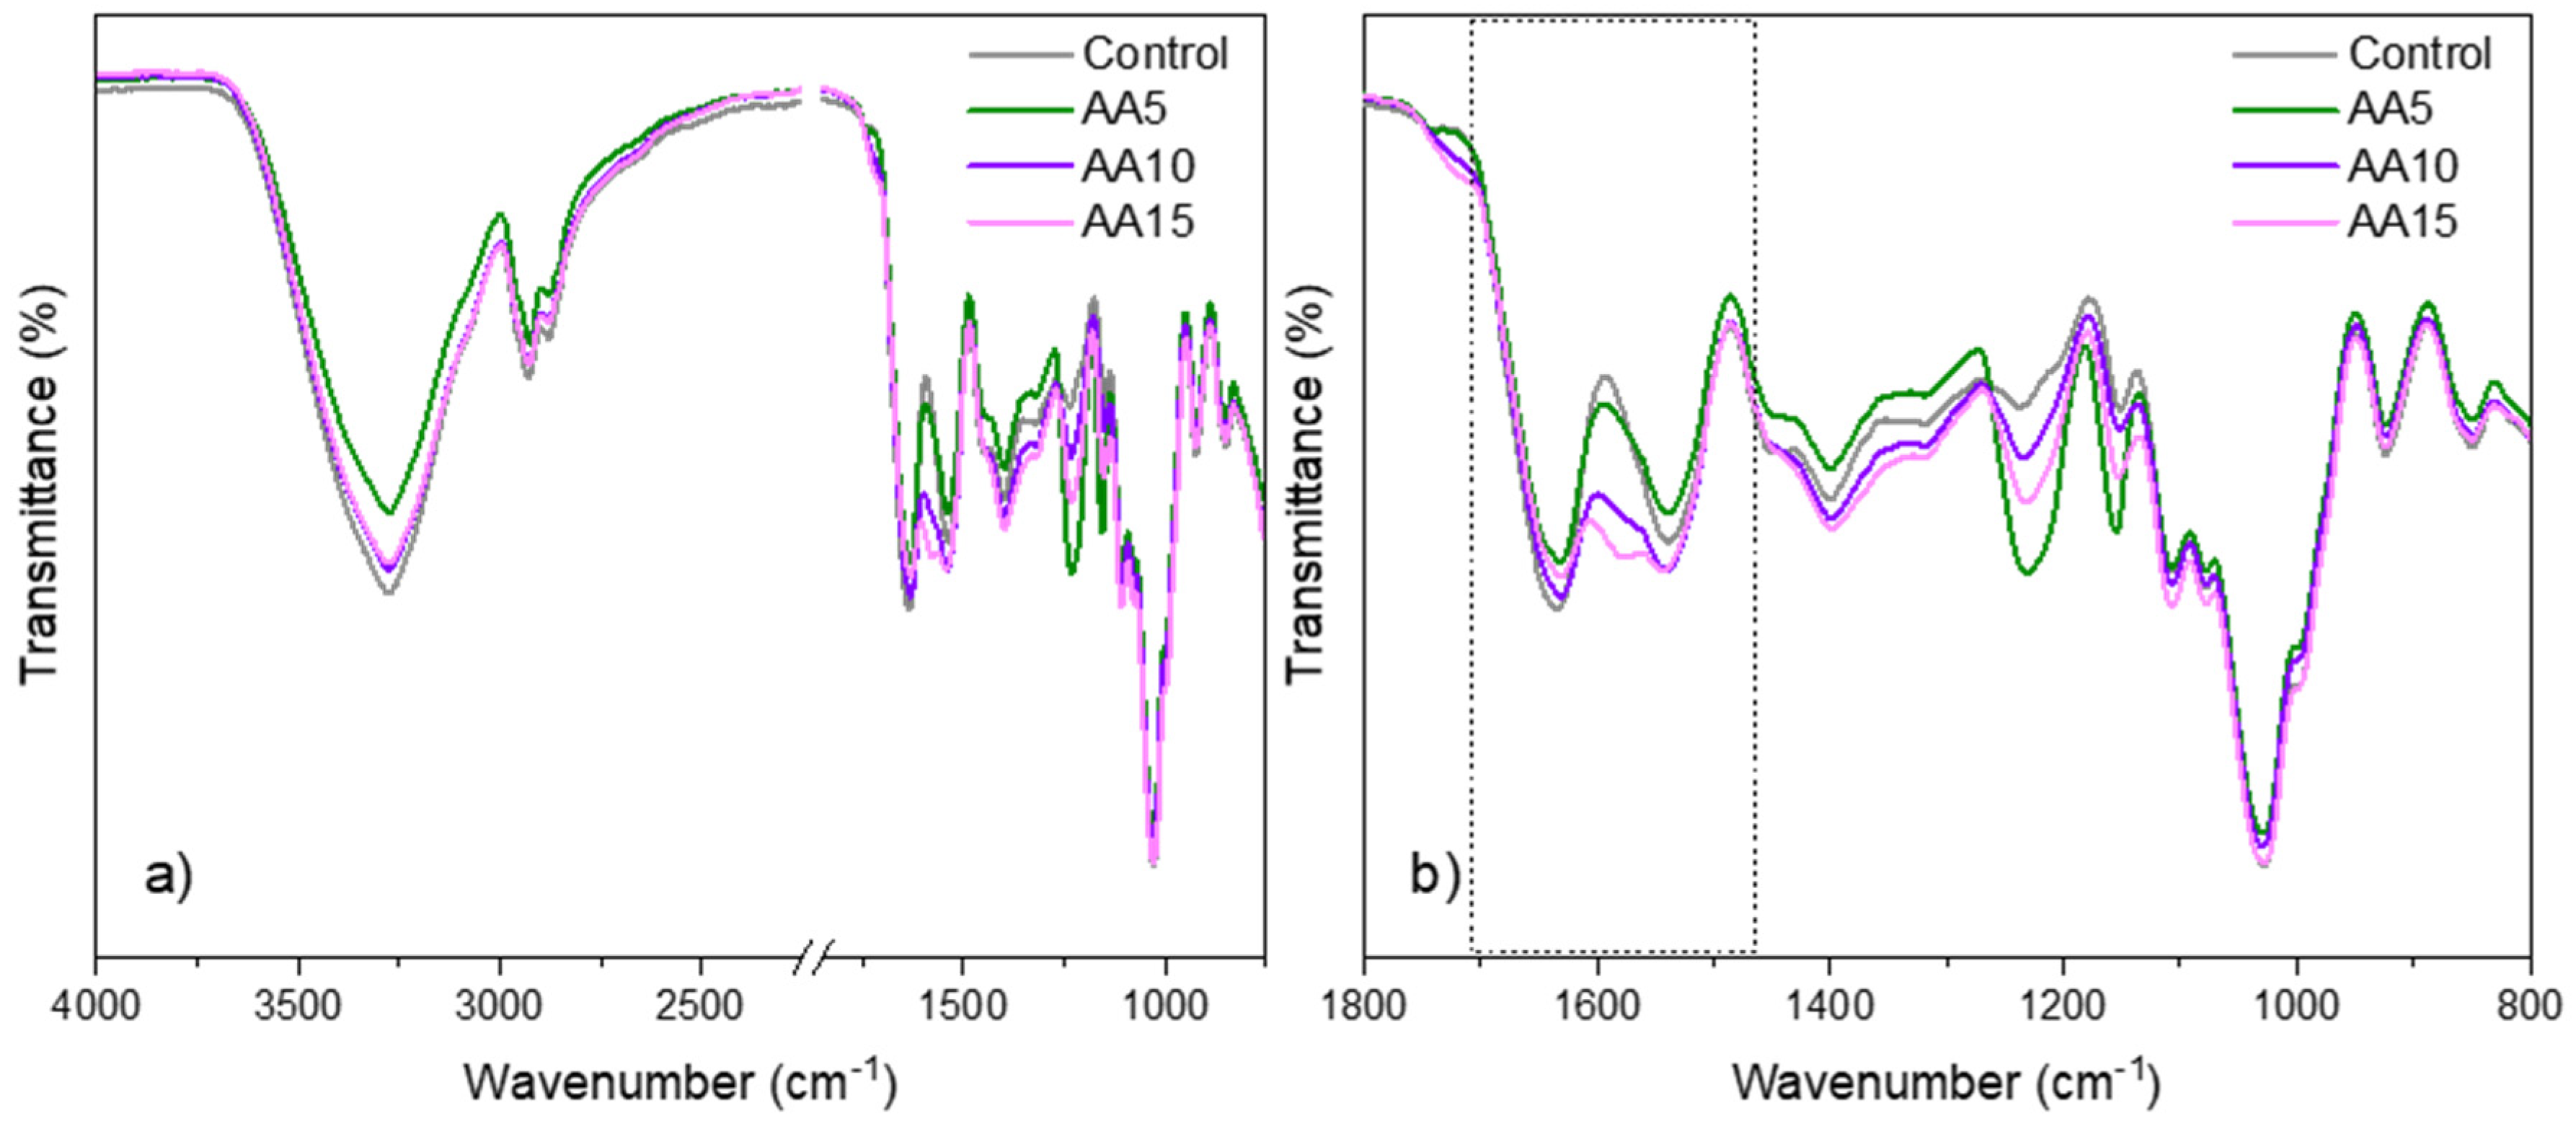
2.3.2. Attenuated Total Reflectance Fourier Transform Infrared (ATR-FTIR) Spectroscopy
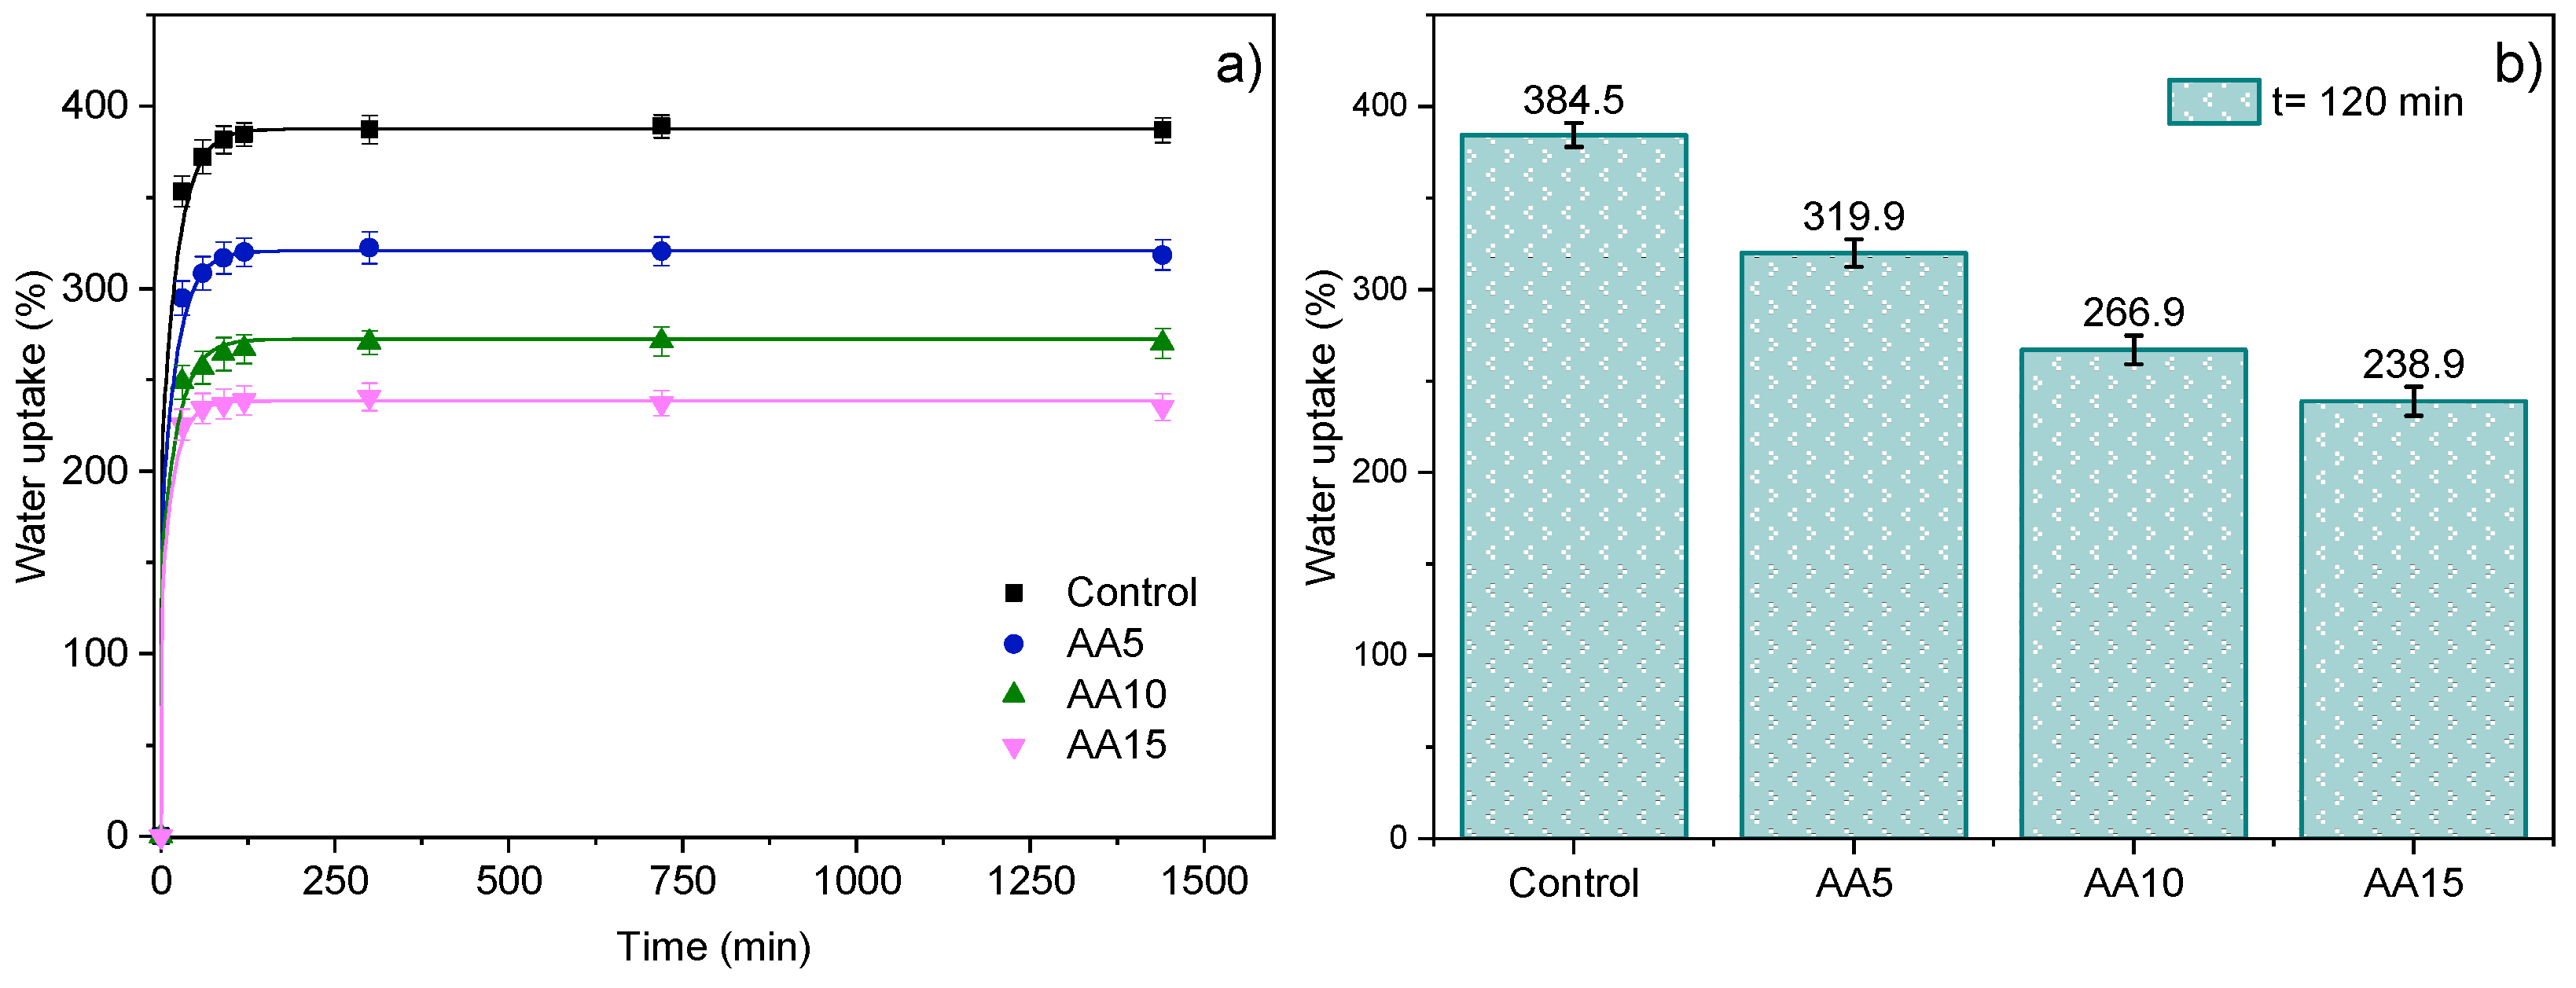
2.3.3. Water Uptake (WU)
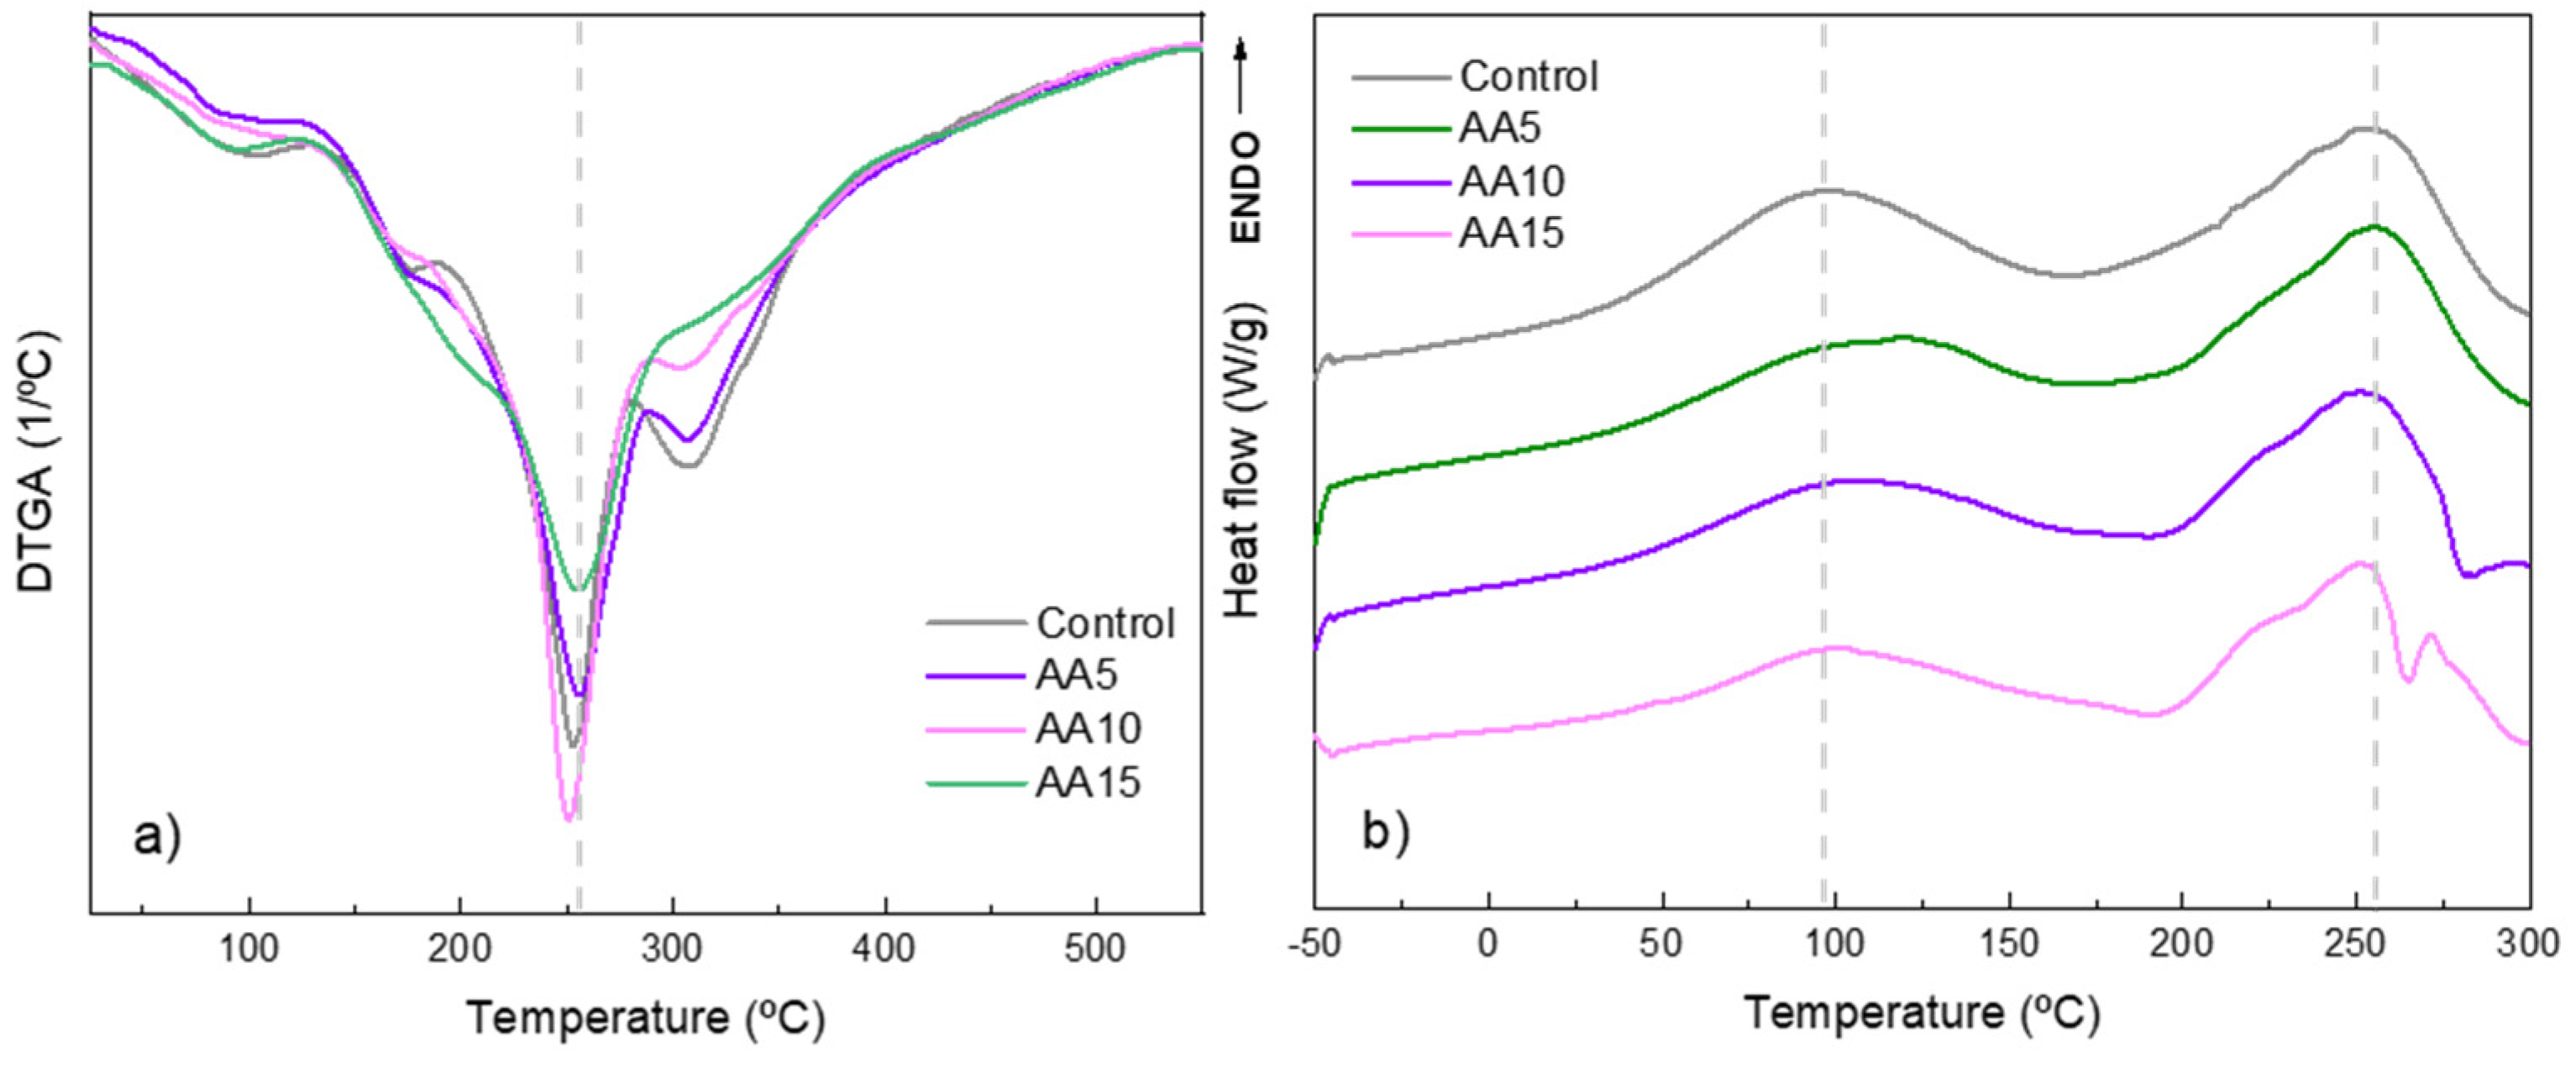
2.3.4. Thermo-Gravimetric Analysis (TGA) and Differential Scanning Calorimetry (DSC)
2.3.5. Colour and Gloss
2.3.6. Light Absorbance
2.3.7. Water Contact Angle (WCA)
2.3.8. Water Vapour Permeability (WVP)
2.3.9. Scanning Electron Microscopy (SEM)
2.3.10. X-ray Diffraction (XRD)
2.3.11. Tensile Tests
2.3.12. Environmental Assessment
2.4. Statistical Analysis
3. Results and Discussion
3.1. Amino Acid Content in WPI
3.2. Physicochemical Properties of Films
3.3. Thermal Properties
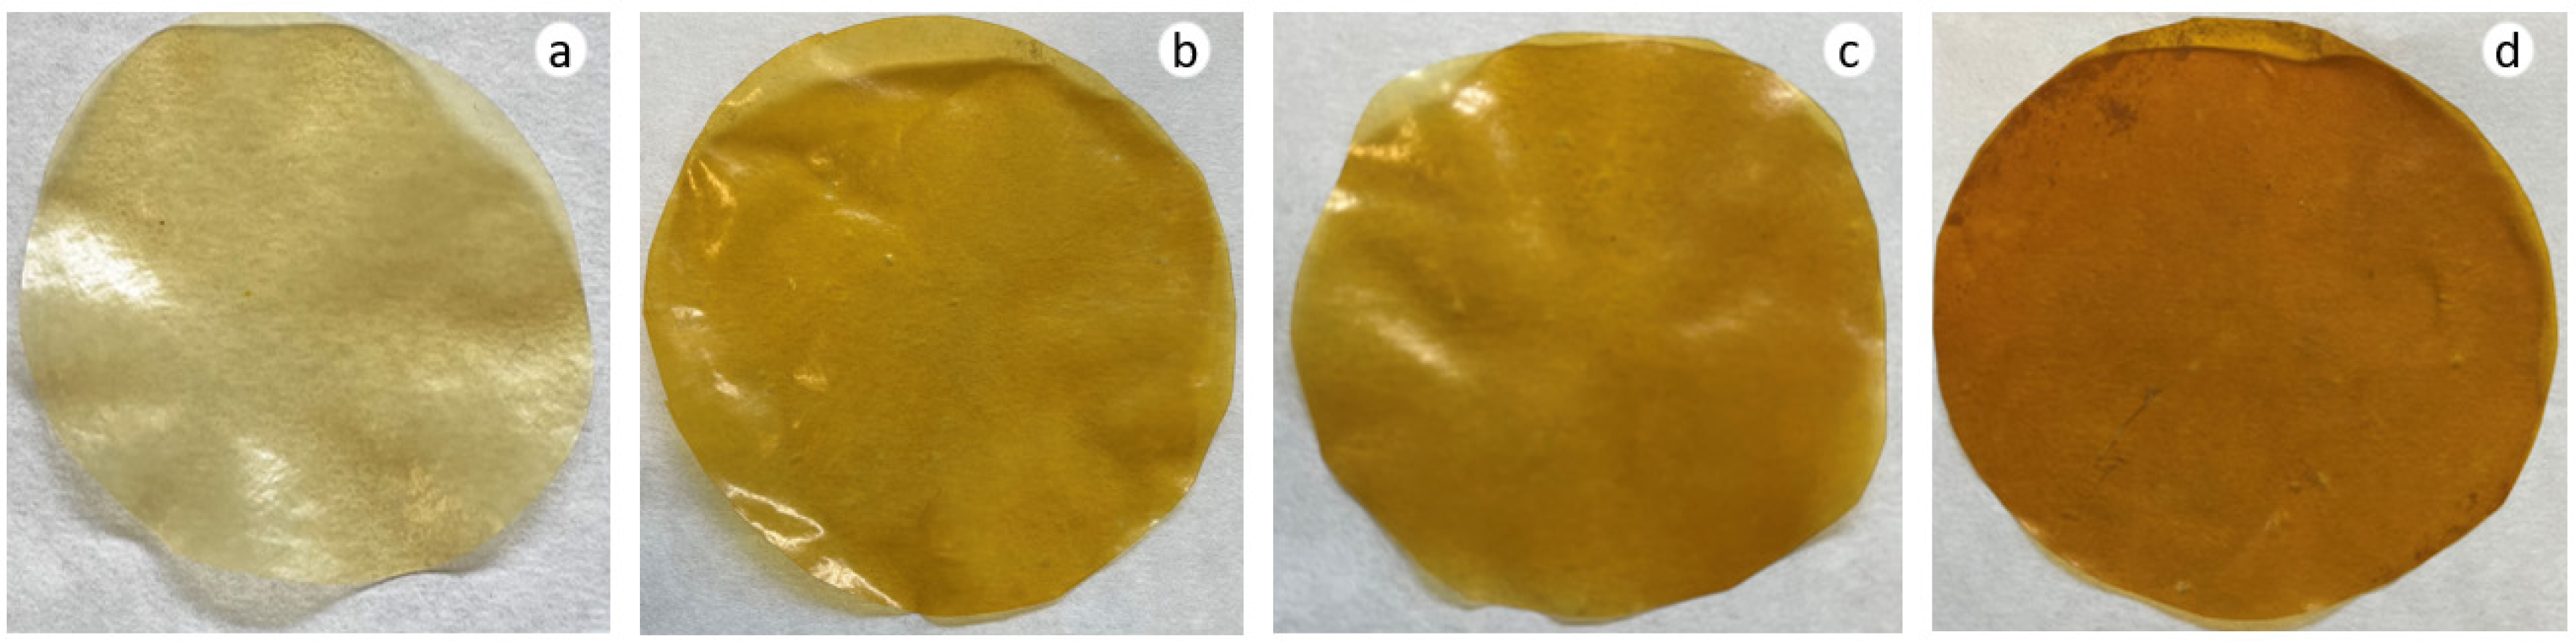
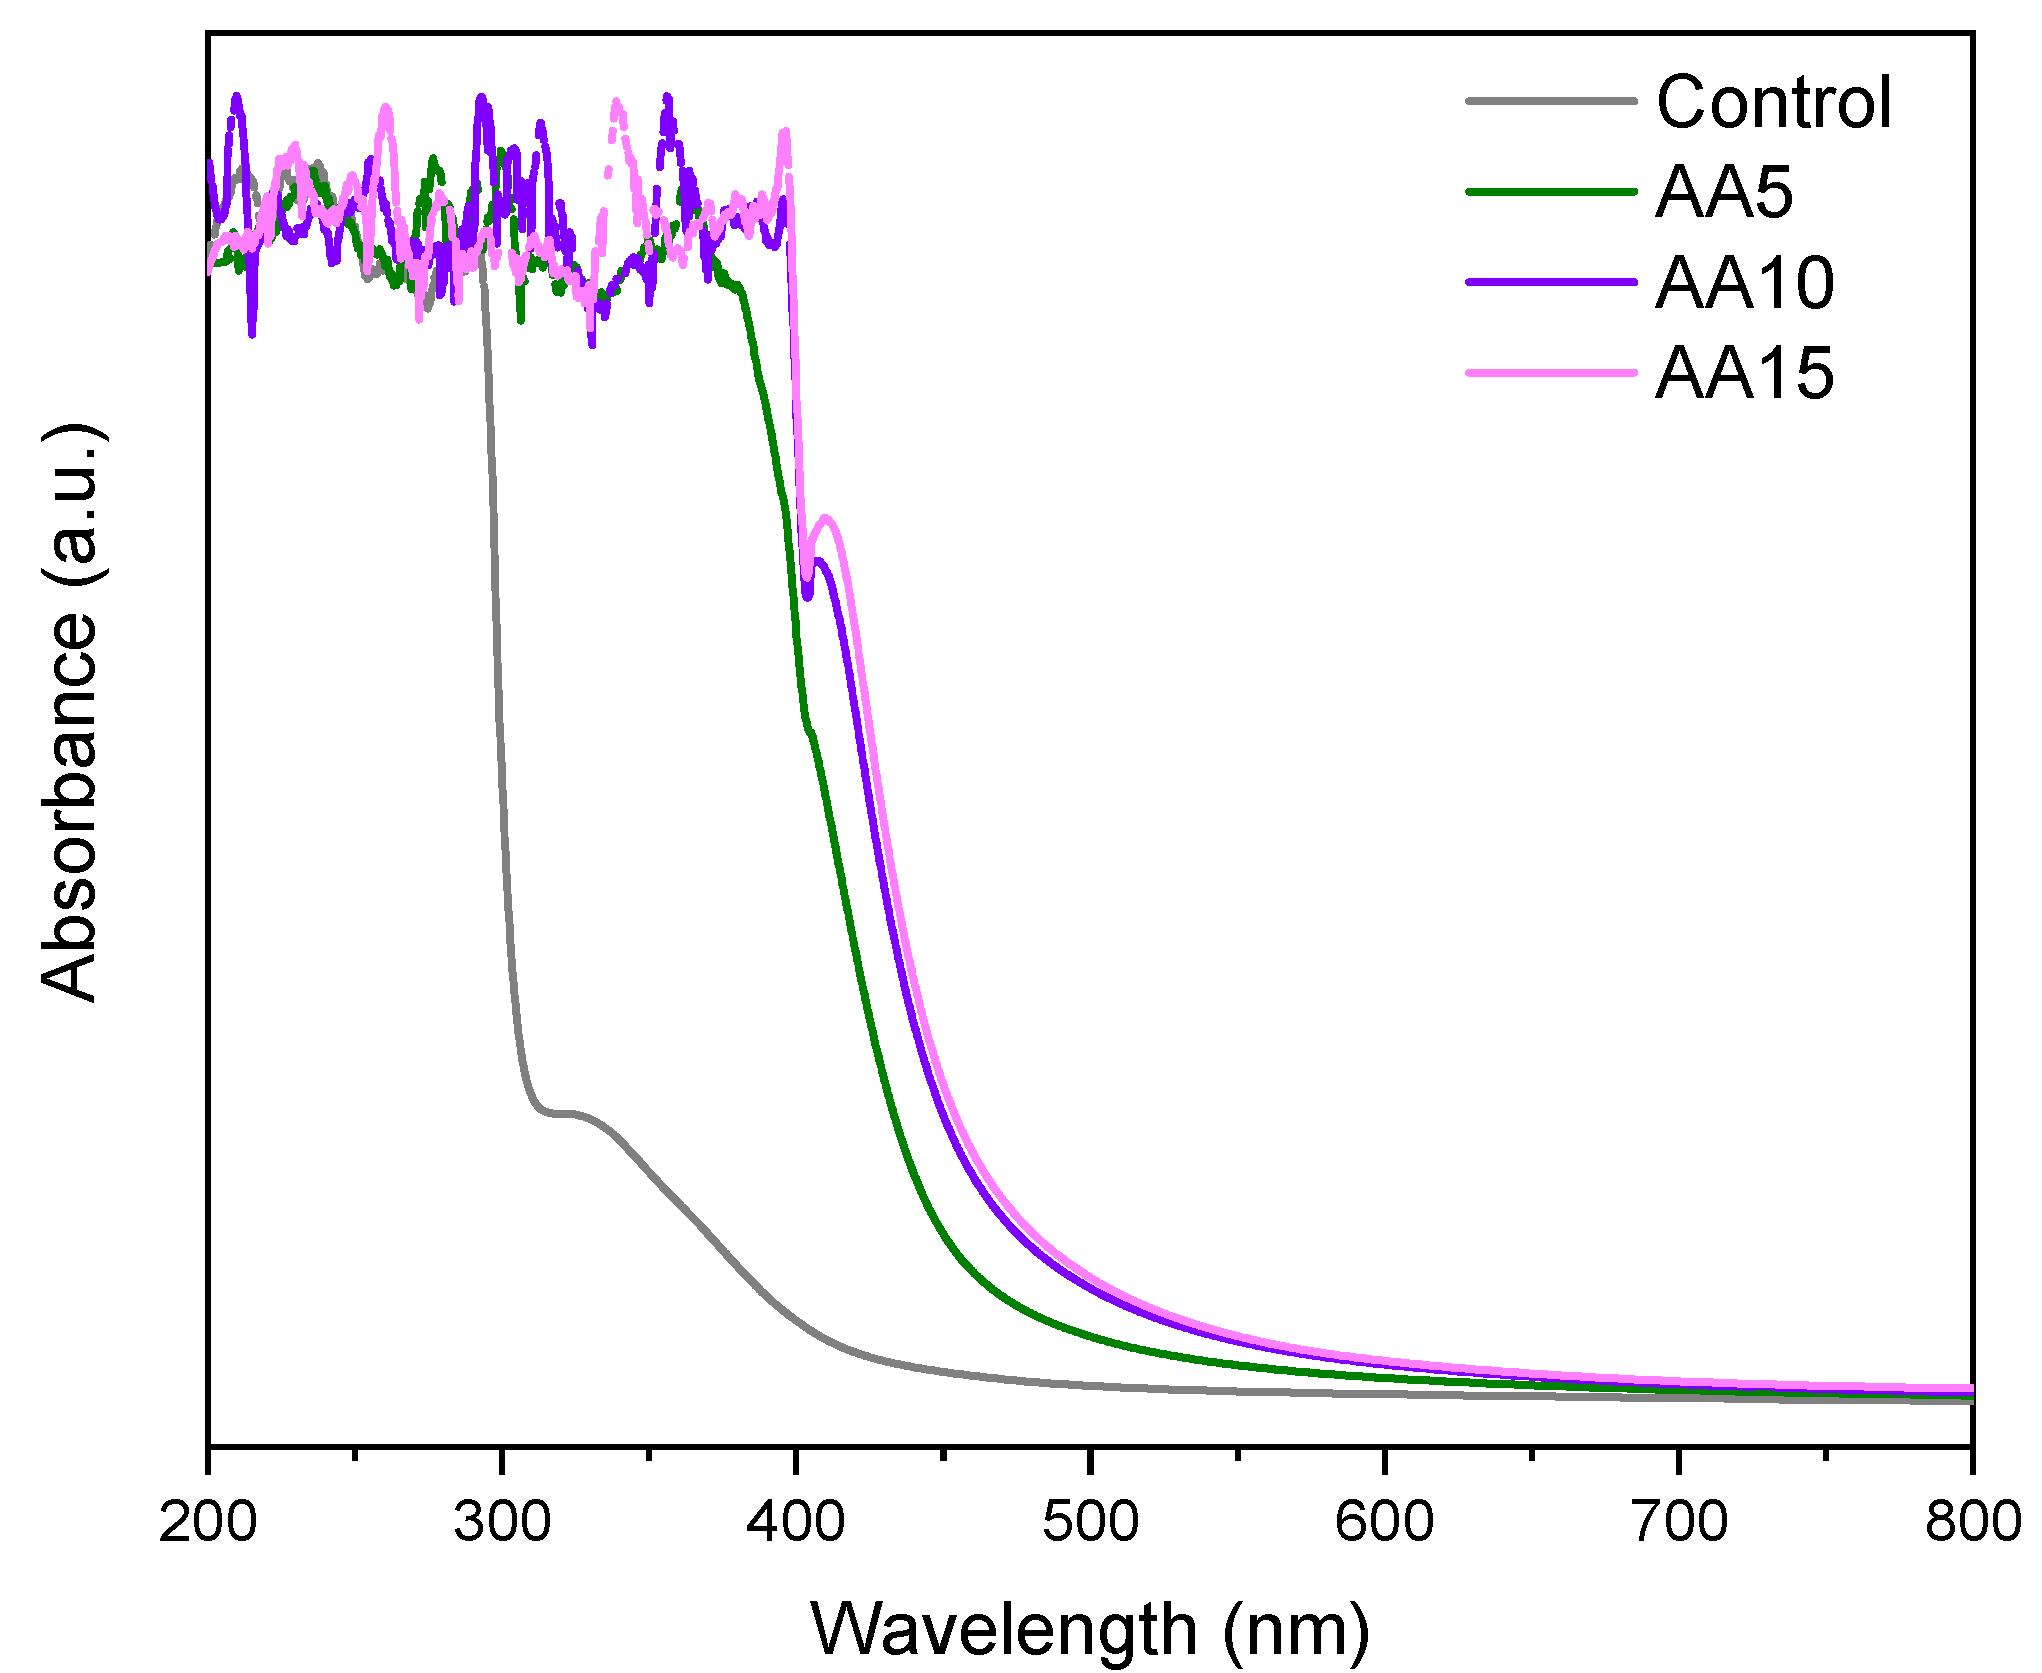
3.4. Optical Properties
3.5. Barrier Properties
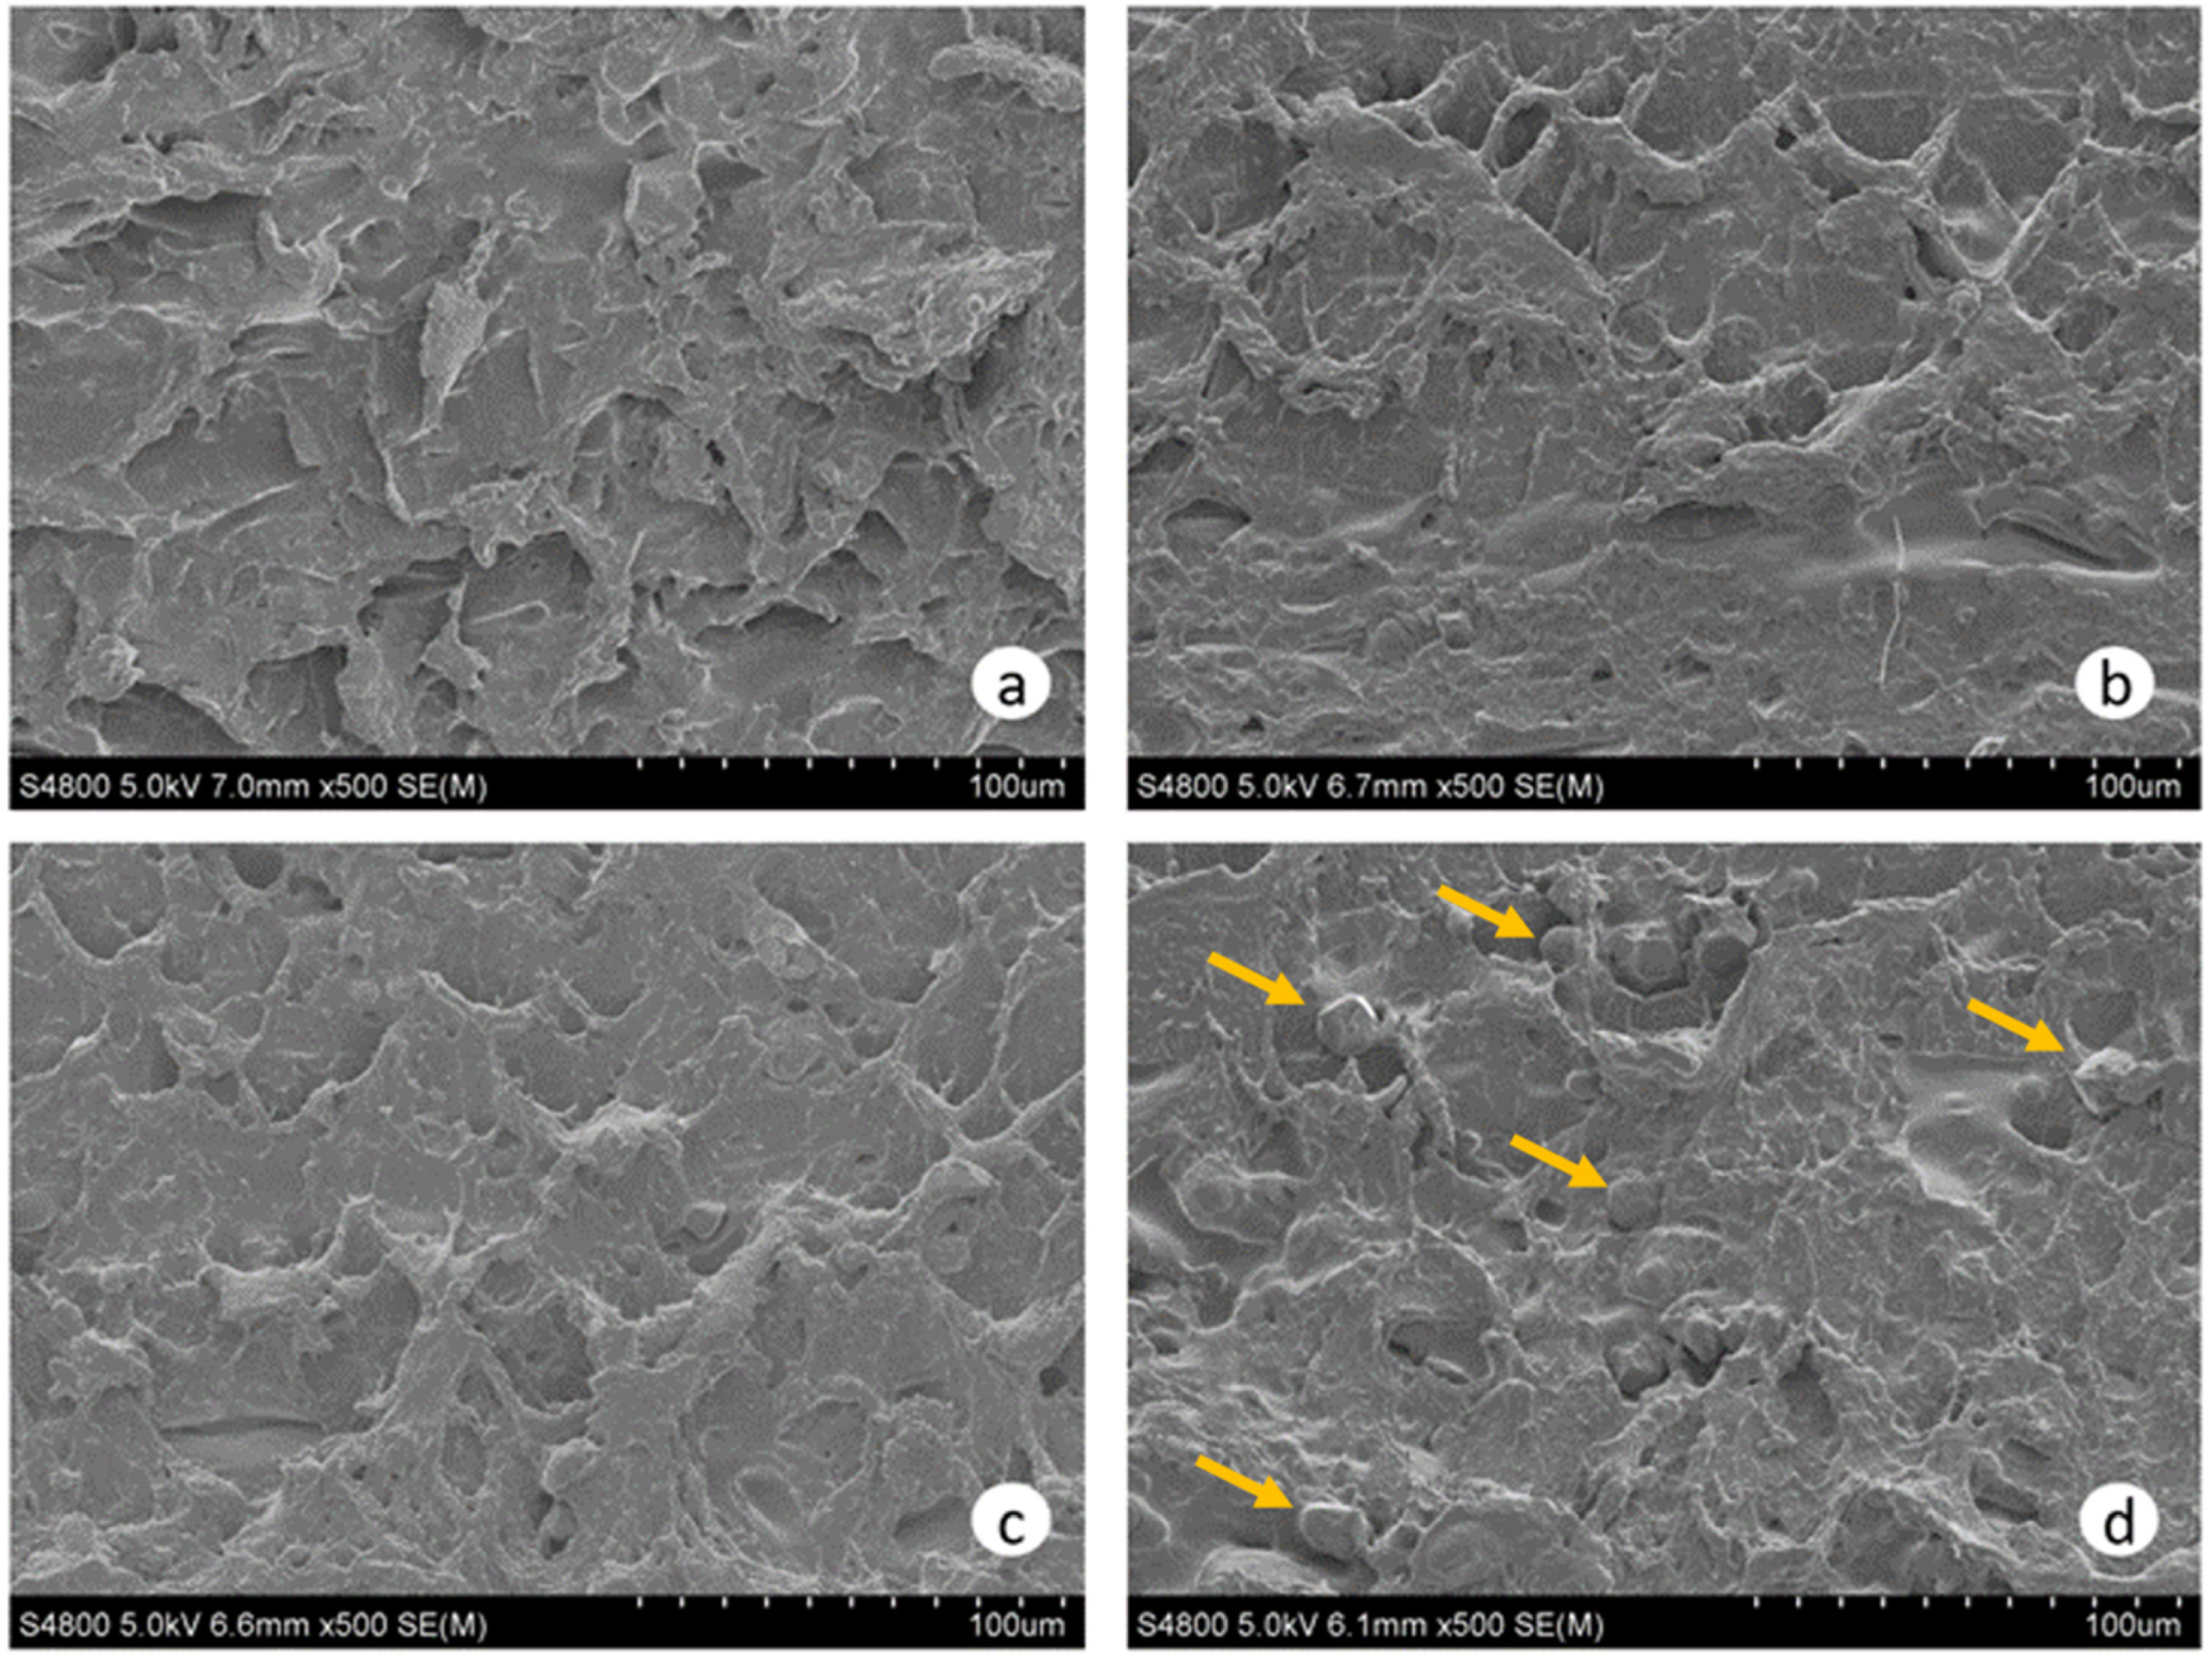
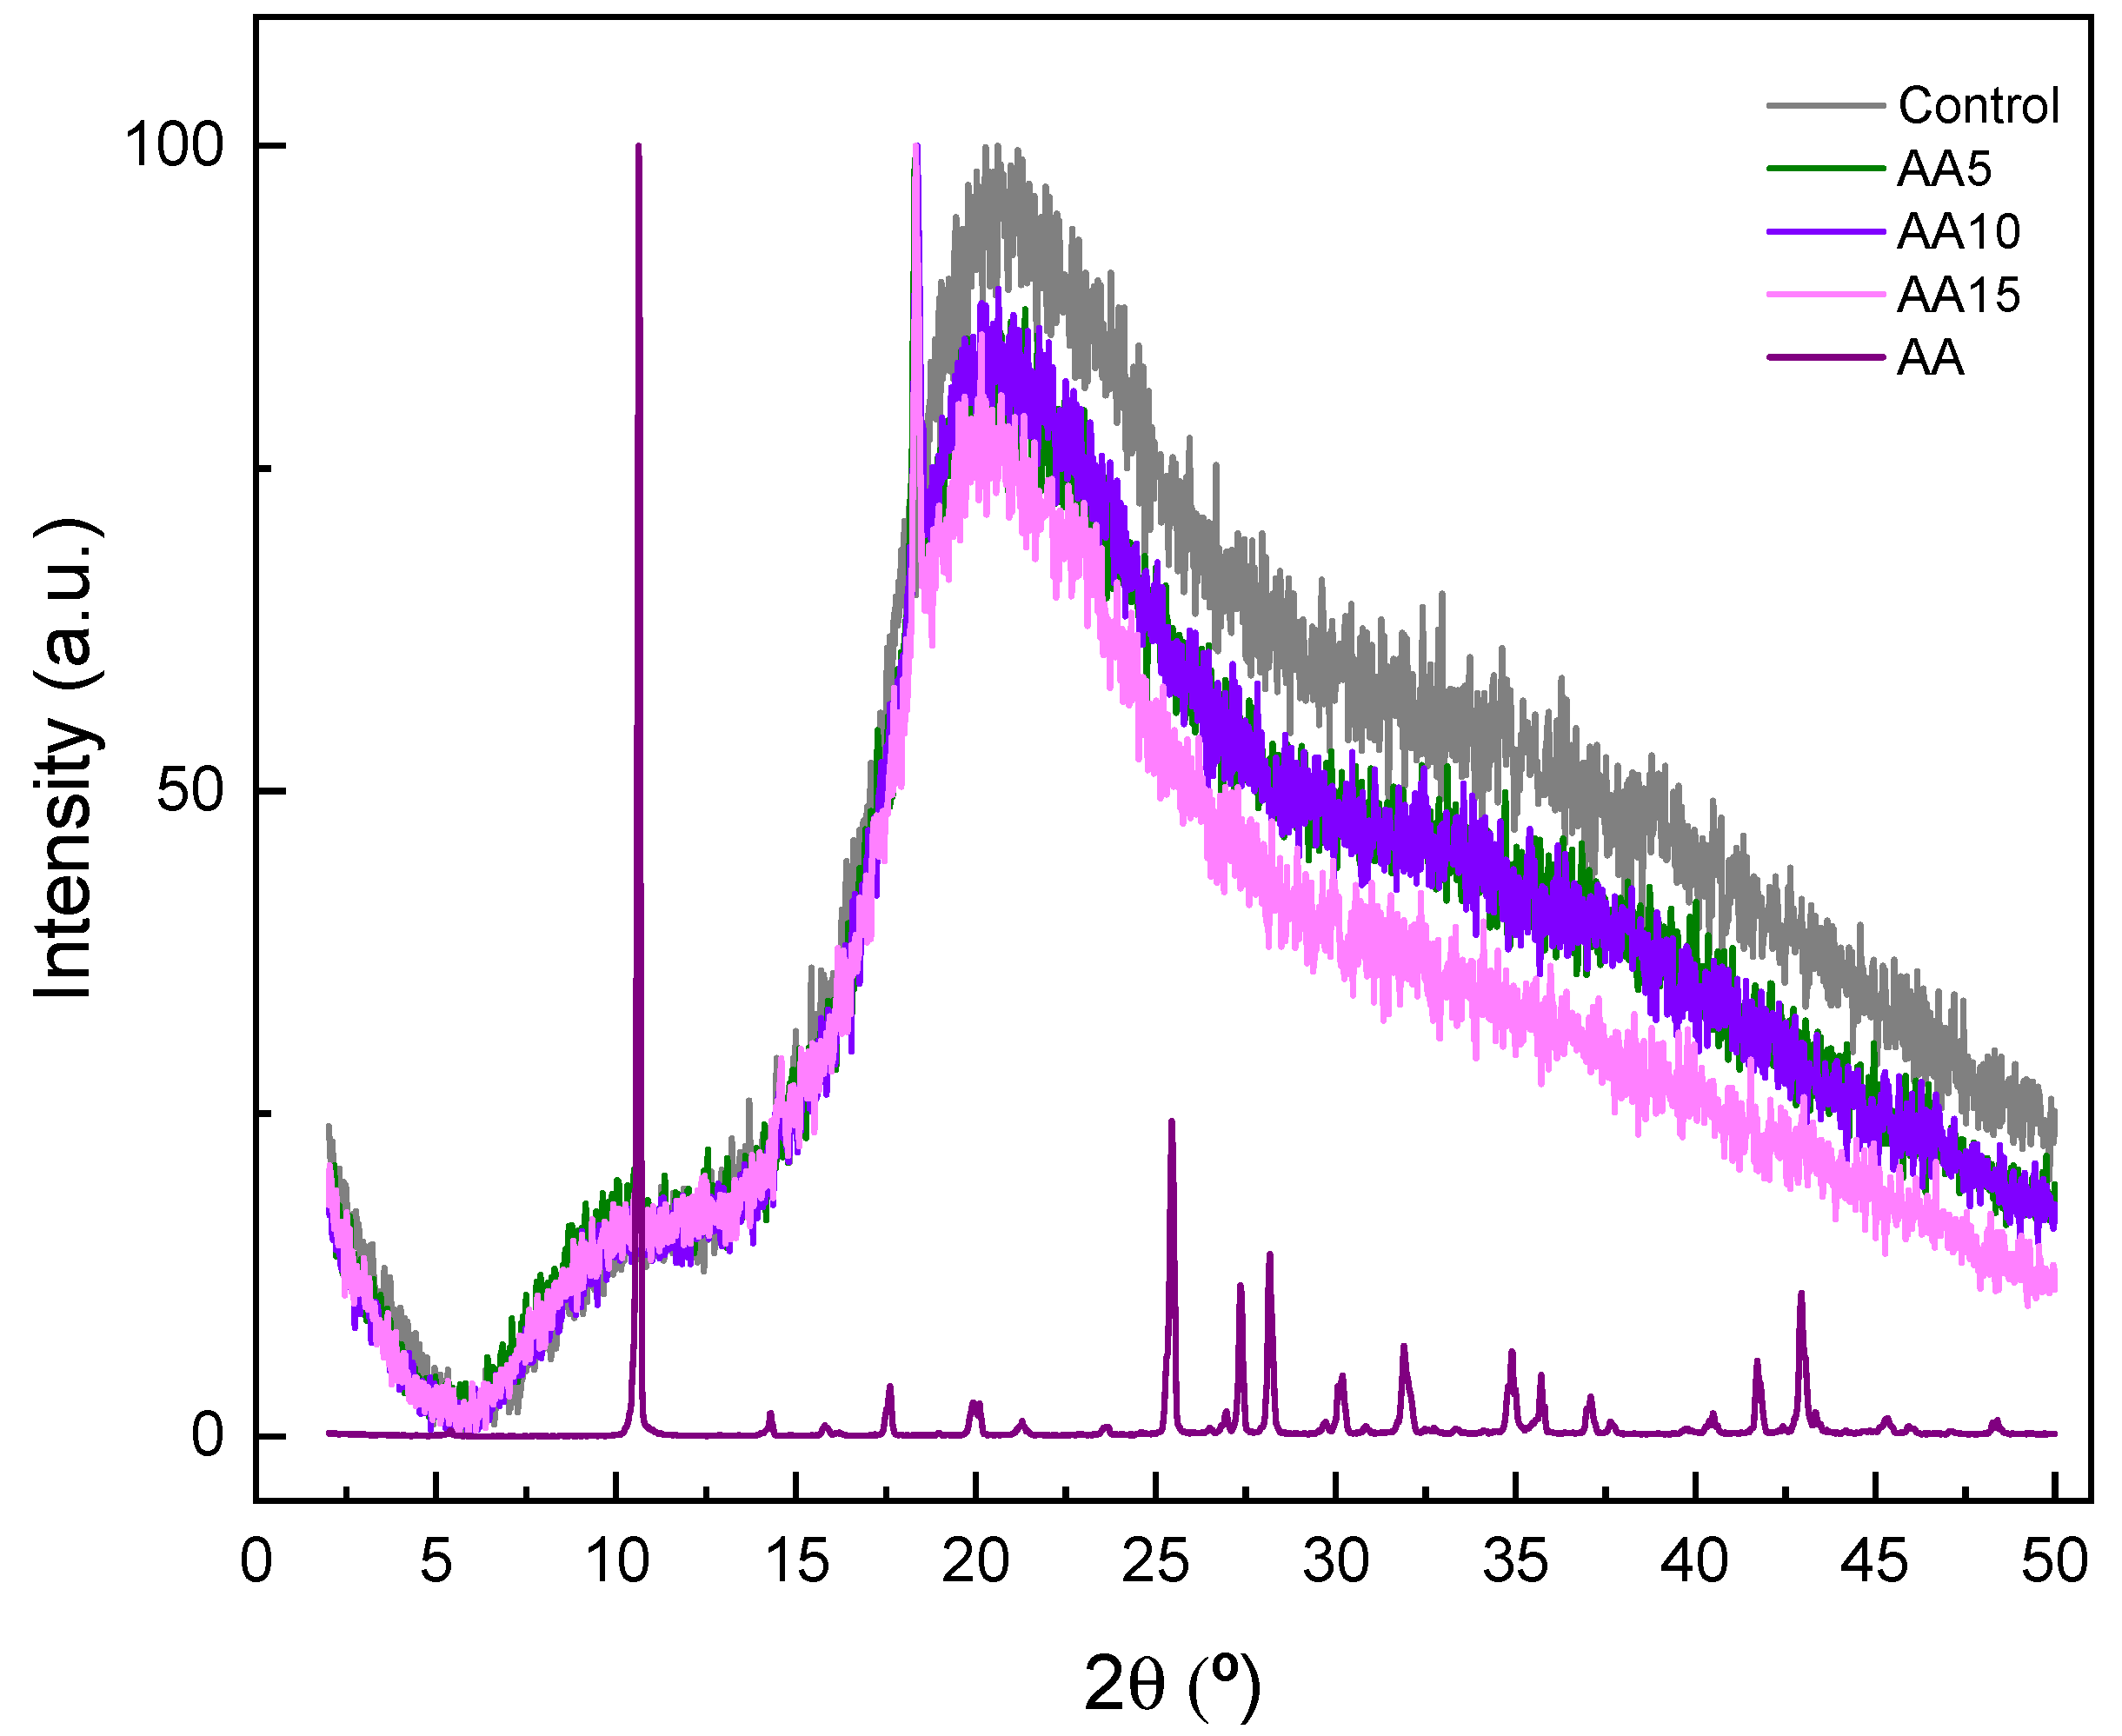
3.6. Film Structure
3.7. Mechanical Properties
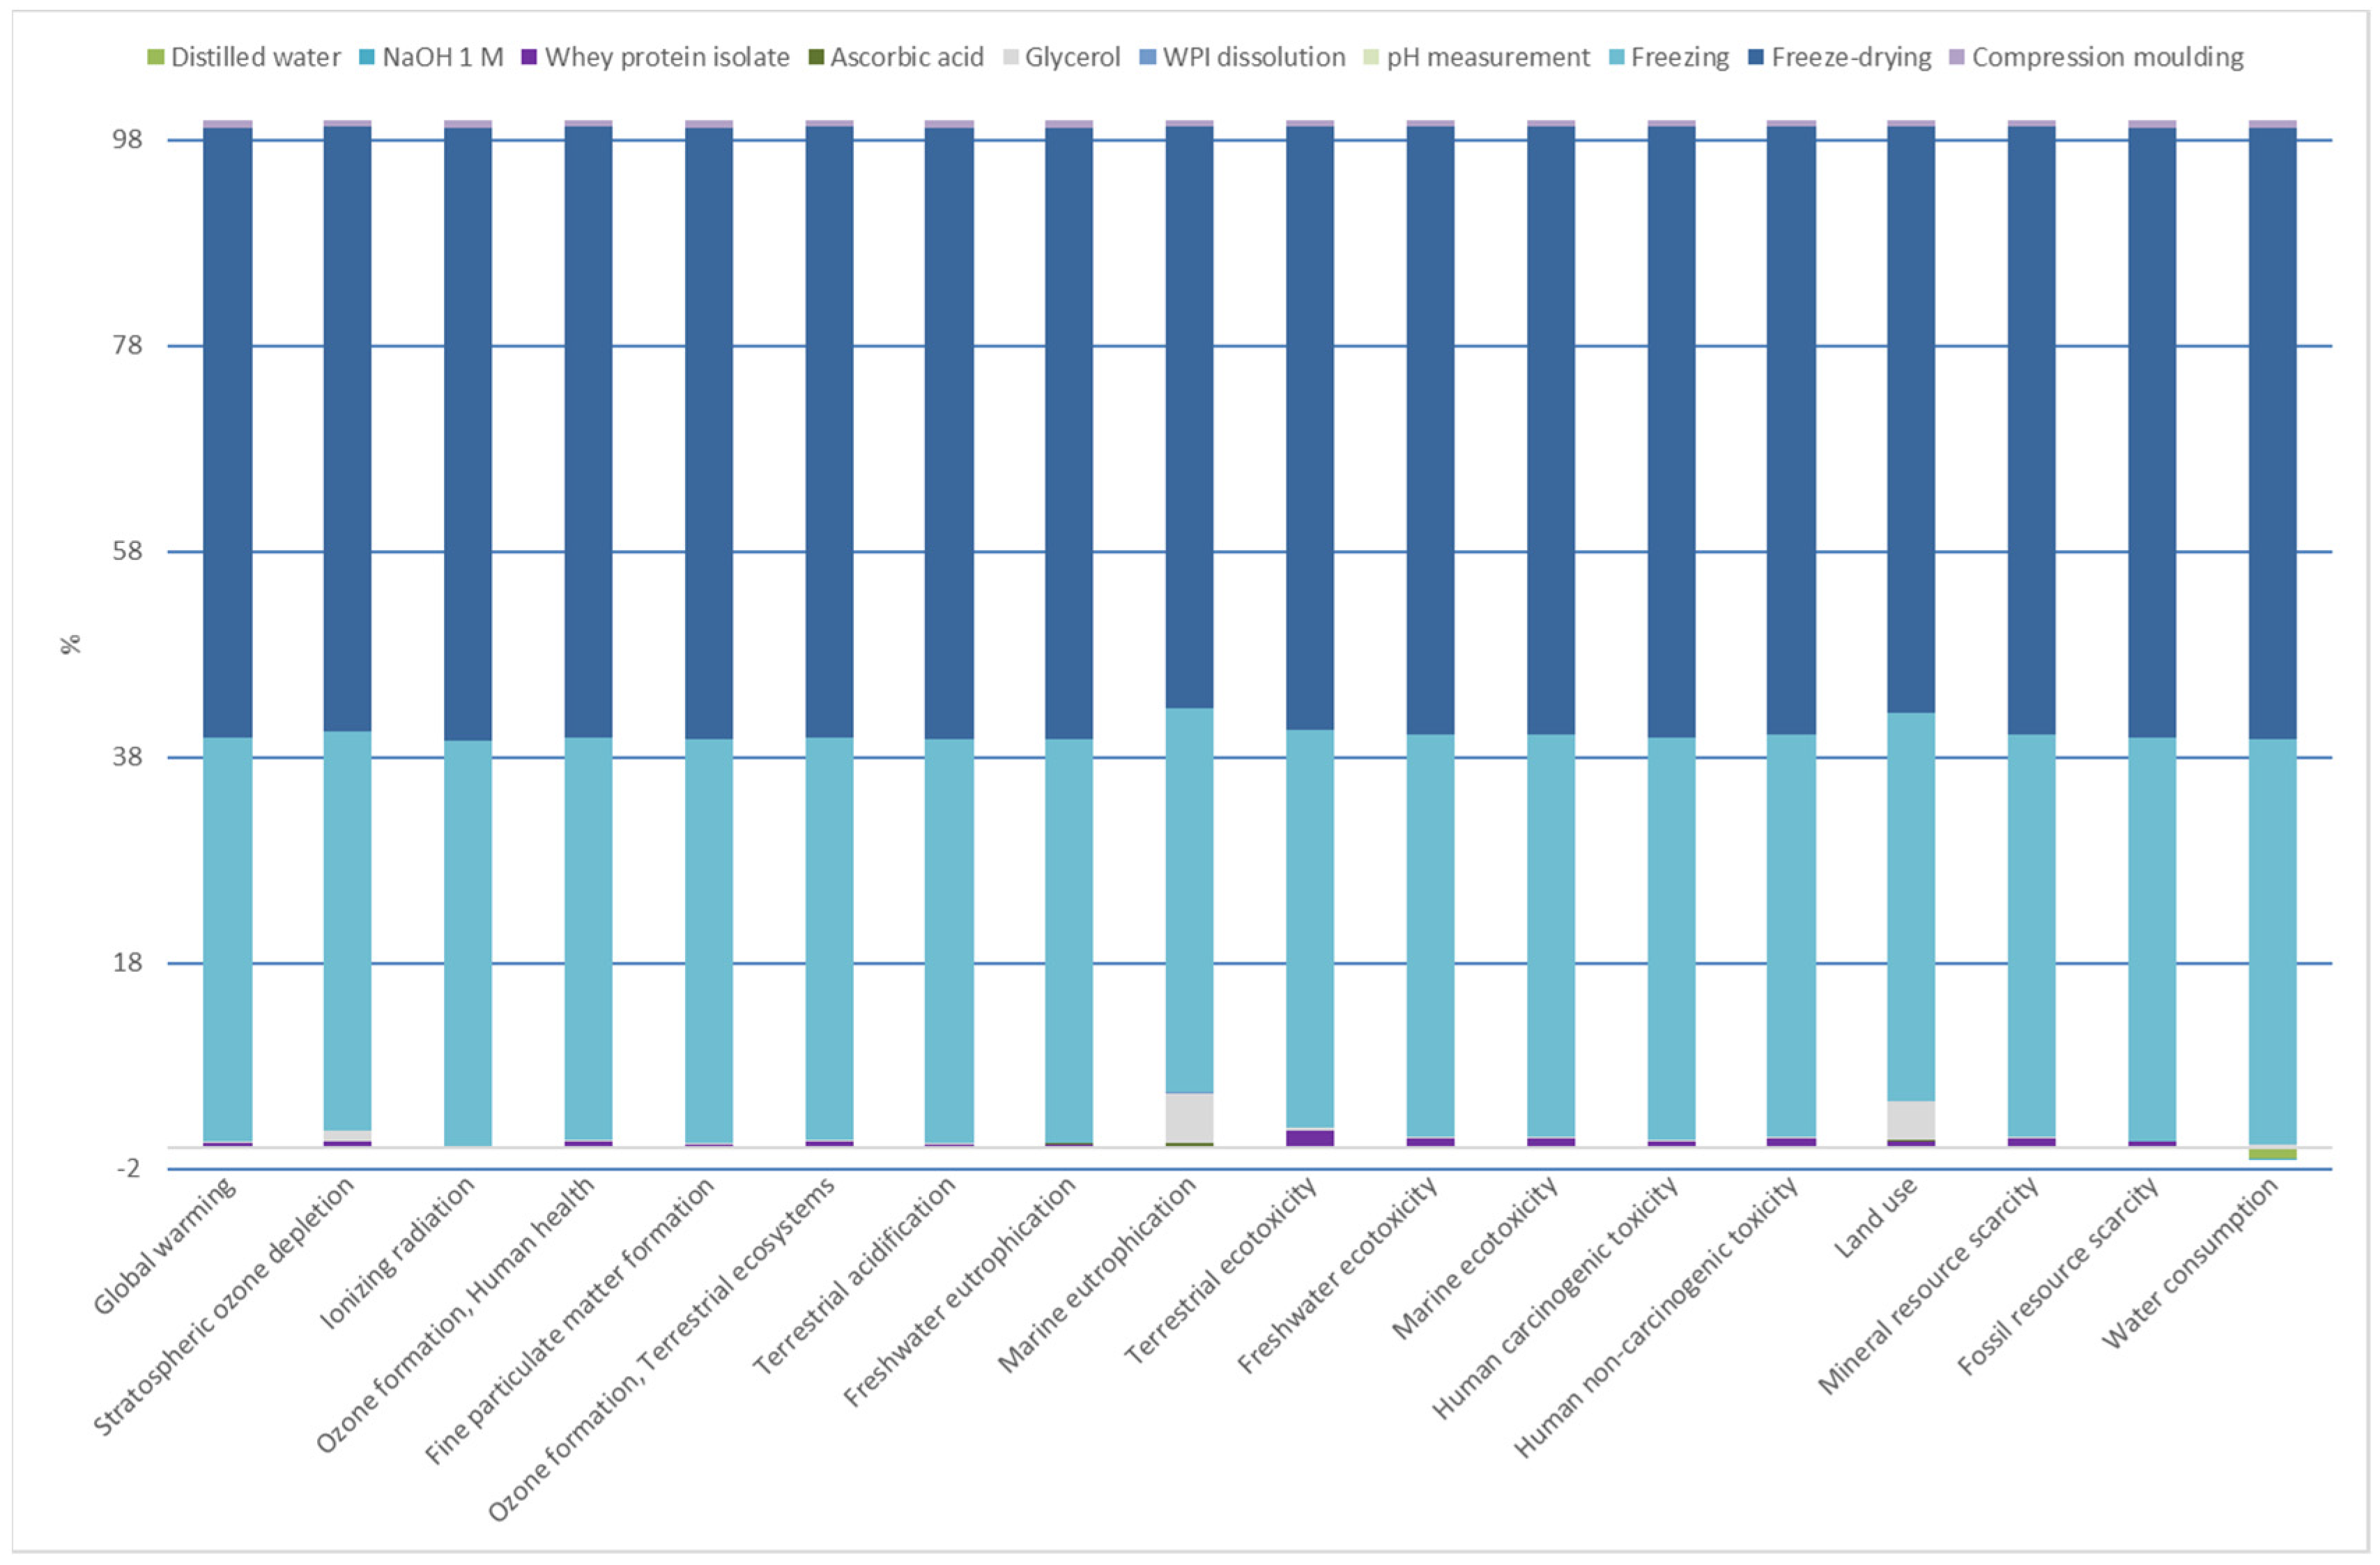
3.8. Environmental Assessment
4. Conclusions
Author Contributions
Funding
Institutional Review Board Statement
Informed Consent Statement
Data Availability Statement
Acknowledgments
Conflicts of Interest
References
- Barba, F.J. An Integrated Approach for the Valorization of Cheese Whey. Foods 2021, 10, 564. [Google Scholar] [CrossRef] [PubMed]
- Pires, A.F.; Marnotes, N.G.; Rubio, O.D.; Garcia, A.C.; Pereira, C.D. Dairy by-products: A review on the valorization of whey and second cheese whey. Foods 2021, 10, 1067. [Google Scholar] [CrossRef] [PubMed]
- Prazeres, A.R.; Carvalho, F.; Rivas, J. Cheese whey management: A review. J. Environ. Manag. 2012, 110, 48–68. [Google Scholar] [CrossRef] [PubMed]
- Carvalho, F.; Prazeres, A.R.; Rivas, J. Cheese whey wastewater: Characterization and treatment. Sci. Total Environ. 2013, 445, 385–396. [Google Scholar] [CrossRef] [PubMed]
- Addai, F.P.; Lin, F.; Wang, T.; Kosiba, A.A.; Sheng, P.; Yu, F.; Gu, J.; Zhou, Y.; Shi, H. Technical integrative approaches to cheese whey valorization towards sustainable environment. Food Funct. 2020, 11, 8407–8423. [Google Scholar] [CrossRef]
- Ramos, G.L.; Guimarães, J.T.; Pimentel, T.C.; da Cruz, A.G.; de Souza, S.L.; Vendramel, S.M. Chapter 19—Whey: Generation, recovery, and use of a relevant by-product. In Valorization of Agri-Food Wastes and by-Products; Bhat, R., Ed.; Academic Press: Cambridge, MA, USA, 2021; pp. 391–414. [Google Scholar] [CrossRef]
- Shaw, N.B.; Monahan, F.J.; O’Riordan, E.D.; O’Sullivan, M. Physical properties of WPI films plasticized with glycerol, xylitol, or sorbitol. J. Food Sci. 2002, 67, 164–167. [Google Scholar] [CrossRef]
- Tarique, J.; Sapuan, S.M.; Khalina, A. Effect of glycerol plasticizer loading on the physical, mechanical, thermal, and barrier properties of arrowroot (maranta arundinacea) starch biopolymers. Sci. Rep. 2021, 11, 13900. [Google Scholar] [CrossRef]
- Janjarasskul, T.; Tananuwong, K.; Krochta, J.M. Whey protein film with oxygen scavenging function by incorporation of ascorbic acid. J. Food Sci. 2011, 76, E561–E568. [Google Scholar] [CrossRef]
- Min, S.; Krochta, J.M. Ascorbic acid-containing whey protein film coatings for control of oxidation. J. Agric. Food Chem. 2007, 55, 2964–2969. [Google Scholar] [CrossRef]
- Papadaki, A.; Kachrimanidou, V.; Lappa, I.; Andriotis, H.; Eriotou, E.; Mandala, I.; Kopsahelis, N. Tuning the physical and functional properties of whey protein edible films: Effect of pH and inclusion of antioxidants from spent coffee grounds. Sustain. Chem. Pharm. 2022, 27, 100700. [Google Scholar] [CrossRef]
- Gorissen, S.H.M.; Crombag, J.J.R.; Senden, J.M.G.; Waterval, W.A.H.; Bierau, J.; Verdijk, L.B.; van Loon Luc, J.C. Protein content and amino acid composition of commercially available plant-based protein isolates. Amino Acids 2018, 50, 1685–1695. [Google Scholar] [CrossRef] [Green Version]
- Kalman, D.S. Amino acid composition of an organic brown rice protein concentrate and isolate compared to soy and whey concentrates and isolates. Foods 2014, 3, 394–402. [Google Scholar] [CrossRef]
- Nadeesha Dilrukshi, H.N.; Torrico, D.D.; Brennan, M.A.; Brennan, C.S. Effects of extrusion processing on the bioactive constituents, in vitro digestibility, amino acid composition, and antioxidant potential of novel gluten-free extruded snacks fortified with cowpea and whey protein concentrate. Food Chem. 2022, 389, 133107. [Google Scholar] [CrossRef]
- Lentz, S.; Trossmann, V.T.; Borkner, C.B.; Beyersdorfer, V.; Rottmar, M.; Scheibel, T. Structure–Property relationship based on the amino acid composition of recombinant spider silk proteins for potential biomedical applications. ACS Appl. Mater. Interfaces 2022, 14, 31751–31766. [Google Scholar] [CrossRef]
- Fernandes, L.M.; Guimarães, J.T.; Silva, R.; Rocha, R.S.; Coutinho, N.M.; Balthazar, C.F.; Calvalcanti, R.N.; Piler, C.W.; Pimentel, T.C.; Neto, R.P.; et al. Whey protein films added with galactooligosaccharide and xylooligosaccharide. Food Hydrocoll. 2020, 104, 105755. [Google Scholar] [CrossRef]
- Chollakup, R.; Pongburoos, S.; Boonsong, W.; Khanoonkon, N.; Kongsin, K.; Sothornvit, R.; Sukyai, P.; Sukatta, U.; Harnkarnsujarit, N. Antioxidant and antibacterial activities of cassava starch and whey protein blend films containing rambutan peel extract and cinnamon oil for active packaging. LWT 2020, 130, 109573. [Google Scholar] [CrossRef]
- Gökkaya Erdem, B.; Kaya, S. Edible film fabrication modified by freeze drying from whey protein isolate and sunflower oil: Functional property evaluation. Food Packag. Shelf Life 2022, 33, 100887. [Google Scholar] [CrossRef]
- Andrade, J.; Pereira, C.G.; de Almeida Junior, J.C.; Viana, C.C.; de Oliveira Neves, L.N.; da Silva, P.H.; Bell, M.J.; dos Anjos, V.D. FTIR-ATR determination of protein content to evaluate whey protein concentrate adulteration. LWT 2019, 99, 166–172. [Google Scholar] [CrossRef]
- Pandalaneni, K.; Amamcharla, J.K. Evaluating the crystallization of lactose at different cooling rates from milk and whey permeates in terms of crystal yield and purity. J. Dairy Sci. 2018, 101, 8805–8821. [Google Scholar] [CrossRef]
- Liu, F.; Chiou, B.; Avena-Bustillos, R.J.; Zhang, Y.; Li, Y.; McHugh, T.H.; Zhong, F. Study of combined effects of glycerol and transglutaminase on properties of gelatin films. Food Hydrocoll. 2017, 65, 1–9. [Google Scholar] [CrossRef]
- Yohannan Panicker, C.; Tresa Varghese, H.; Philip, D. FT-IR, FT-raman and SERS spectra of vitamin C. Spectrochim. Acta Part A: Mol. Biomol. Spectrosc. 2006, 65, 802–804. [Google Scholar] [CrossRef] [PubMed]
- Kong, F.; Kang, S.; Zhang, J.; Jiang, L.; Liu, Y.; Yang, M.; Cao, X.; Zheng, Y.; Shao, J.; Yue, X. The non-covalent interactions between whey protein and various food functional ingredients. Food Chem. 2022, 394, 133455. [Google Scholar] [CrossRef] [PubMed]
- Di Pierro, P.; Chico, B.; Villalonga, R.; Mariniello, L.; Damiao, A.E.; Masi, P.; Porta, R. Chitosan−Whey protein edible films produced in the absence or presence of transglutaminase: Analysis of their mechanical and barrier properties. Biomacromolecules 2006, 7, 744–749. [Google Scholar] [CrossRef] [PubMed] [Green Version]
- Fematt-Flores, G.E.; Aguiló-Aguayo, I.; Marcos, B.; Camargo-Olivas, B.A.; Sánchez-Vega, R.; Soto-Caballero, M.C.; Salas-Salazar, N.A.; Flores-Córdova, M.A.; Rodríguez-Roque, M.J. Milk Protein-Based Edible Films: Influence on Mechanical, Hydrodynamic, Optical and Antioxidant Properties. Coatings 2022, 12, 196. [Google Scholar] [CrossRef]
- Hammann, F.; Schmid, M. Determination and quantification of molecular interactions in protein films: A review. Materials 2014, 7, 7975–7996. [Google Scholar] [CrossRef] [Green Version]
- Minj, S.; Anand, S. Whey proteins and its derivatives: Bioactivity, functionality, and current applications. Dairy 2020, 1, 233–258. [Google Scholar] [CrossRef]
- Papadaki, A.; Manikas, A.C.; Papazoglou, E.; Kachrimanidou, V.; Lappa, I.; Galiotis, C.; Mandala, I.; Kopsahelis, N. Whey protein films reinforced with bacterial cellulose nanowhiskers: Improving edible film properties via a circular economy approach. Food Chem. 2022, 385, 132604. [Google Scholar] [CrossRef]
- Ramos, Ó.L.; Reinas, I.; Silva, S.I.; Fernandes, J.C.; Cerqueira, M.A.; Pereira, R.N.; Vicente, A.A.; Poças, M.F.; Pintado, M.E.; Malcata, F.X. Effect of whey protein purity and glycerol content upon physical properties of edible films manufactured therefrom. Food Hydrocoll. 2013, 30, 110–122. [Google Scholar] [CrossRef] [Green Version]
- Seiwert, K.; Kamdem, D.; Kocabaş, D.S.; Ustunol, Z. Development and characterization of whey protein isolate and xylan composite films with and without enzymatic crosslinking. Food Hydrocoll. 2021, 120, 106847. [Google Scholar] [CrossRef]
- Sartori, T.; Menegalli, F.C. Development and characterization of unripe banana starch films incorporated with solid lipid microparticles containing ascorbic acid. Food Hydrocoll. 2016, 55, 210–219. [Google Scholar] [CrossRef]
- Matta, E.; Tavera-Quiroz, M.; Bertola, N. Isomalt-plasticized methylcellulose-based films as carriers of ascorbic acid. Food Bioprocess Technol. 2020, 13, 2186–2199. [Google Scholar] [CrossRef]
- Agudelo-Cuartas, C.; Granda-Restrepo, D.; Sobral, P.J.A.; Hernandez, H.; Castro, W. Characterization of whey protein-based films incorporated with natamycin and nanoemulsion of α-tocopherol. Heliyon 2020, 6, e03809. [Google Scholar] [CrossRef]
- Etxabide, A.; Uranga, J.; Guerrero, P.; de la Caba, K. Improvement of barrier properties of fish gelatin films promoted by gelatin glycation with lactose at high temperatures. LWT Food Sci. Technol. 2015, 63, 315–321. [Google Scholar] [CrossRef]
- Bell, M.S.; Shahraz, A.; Fichthorn, K.A.; Borhan, A. Effects of hierarchical surface roughness on droplet contact angle. Langmuir 2015, 31, 6752–6762. [Google Scholar] [CrossRef]
- Oymaci, P.; Altinkaya, S.A. Improvement of barrier and mechanical properties of whey protein isolate based food packaging films by incorporation of zein nanoparticles as a novel bionanocomposite. Food Hydrocoll. 2016, 54, 1–9. [Google Scholar] [CrossRef] [Green Version]
- Bajer, D.; Burkowska-But, A. Innovative and environmentally safe composites based on starch modified with dialdehyde starch, caffeine, or ascorbic acid for applications in the food packaging industry. Food Chem. 2022, 374, 131639. [Google Scholar] [CrossRef]
- Kokoszka, S.; Debeaufort, F.; Lenart, A.; Voilley, A. Water vapour permeability, thermal and wetting properties of whey protein isolate based edible films. Int. Dairy J. 2010, 20, 53–60. [Google Scholar] [CrossRef]
- Kamali, S.; Yavarmanesh, M.; Habibi Najafi, M.B.; Koocheki, A. Development of whey protein concentrate/pullulan composite films containing bacteriophage A511: Functional properties and anti-listerial effects during storage. Food Packag. Shelf Life 2022, 33, 100902. [Google Scholar] [CrossRef]
- Li, T.; Xia, N.; Xu, L.; Zhang, H.; Zhang, H.; Chi, Y.; Zhang, Y.; Li, L.; Li, H. Preparation, characterization and application of SPI-based blend film with antioxidant activity. Food Packag. Shelf Life 2021, 27, 100614. [Google Scholar] [CrossRef]
- Zhang, X.; Ma, L.; Yu, Y.; Zhou, H.; Guo, T.; Dai, H.; Zhang, Y. Physico-mechanical and antioxidant properties of gelatin film from rabbit skin incorporated with rosemary acid. Food Packag. Shelf Life 2019, 19, 121–130. [Google Scholar] [CrossRef]
- Farrokhi, F.; Ehsani, M.R.; Badii, F.; Hashemi, M. Structural and thermal properties of nanofibrillated whey protein isolate in the glassy state. LWT 2018, 95, 274–281. [Google Scholar] [CrossRef]
- Kowalczyk, D.; Kazimierczak, W.; Zięba, E.; Mężyńska, M.; Basiura-Cembala, M.; Lisiecki, S.; Karaś, M.; Baraniak, B. Ascorbic acid- and sodium ascorbate-loaded oxidized potato starch films: Comparative evaluation of physicochemical and antioxidant properties. Carbohydr. Polym. 2018, 181, 317–326. [Google Scholar] [CrossRef] [PubMed]
- Piccinno, F.; Hischier, R.; Seeger, S.; Som, C. From laboratory to industrial scale: A scale-up framework for chemical processes in life cycle assessment studies. J. Clean. Prod. 2016, 135, 1085–1097. [Google Scholar] [CrossRef]


| Amino Acids | % |
|---|---|
| Aspartic acid | 11.578 |
| Threonine | 6.715 |
| Serine | 7.165 |
| Glutamic acid | 16.588 |
| Proline | 7.497 |
| Glycine | 3.412 |
| Alanine | 9.514 |
| Cysteine | 1.435 |
| Valine | 5.618 |
| Methionine | 1.705 |
| Isoleucine | 4.754 |
| Leucine | 9.075 |
| Tyrosine | 2.461 |
| Phenylalanine | 2.636 |
| Histidine | 1.390 |
| Lysine | 7.536 |
| Arginine | 0.923 |
| Films | Thickness (µm) |
|---|---|
| Control | 119.86 ± 3.47 a |
| AA5 | 120.75 ± 6.68 a |
| AA10 | 122.62 ± 3.96 a |
| AA15 | 123.52 ± 3.52 a |
| Films | L* | a* | b* | ΔE* | Gloss (G.U.) |
|---|---|---|---|---|---|
| Control | 91.27 ± 1.00 a | −4.24 ± 0.19 a | 35.97 ± 2.92 a | 22.95 ± 6.43 a | |
| AA5 | 78.35 ± 1.02 b | 10.01 ± 1.08 b | 53.72 ± 0.83 b | 26.17 ± 1.64 a | 25.11 ± 2.76 a |
| AA10 | 74.24 ± 1.16 c | 15.24 ± 1.53 c | 62.63 ± 1.26 c | 37.15 ± 2.21 b | 22.16 ± 1.32 a |
| AA15 | 76.05 ± 1.02 d | 13.49 ± 1.02 d | 64.07 ± 0.69 c | 36.56 ± 1.26 b | 22.73 ± 1.79 a |
| Films | WCA (°) t = 0 min | WCA (°) t = 5 min | WVP·1012 (g·cm−1·s−1·Pa−1) |
|---|---|---|---|
| Control | 105.6 ± 4.9 a | 88.2 ± 4.1 a | 4.57 ± 1.26 a |
| AA5 | 91.7 ± 4.2 b | 71.7 ± 3.5 b | 5.98 ± 1.29 a |
| AA10 | 88.8 ± 4.2 b | 69.4 ± 3.7 b | 5.89 ± 1.58 a |
| AA15 | 88.4 ± 3.2 b | 68.8 ± 2.8 b | 7.12 ± 0.94 a |
| Films | EM (MPa) | TS (MPa) | EB (%) |
|---|---|---|---|
| Control | 24.71 ± 1.65 a | 1.49 ± 0.08 a | 18.83 ± 1.25 a |
| AA5 | 20.82 ± 1.07 b | 1.43 ± 0.07 a | 23.54 ± 0.75 b |
| AA10 | 19.59 ± 0. 92 b | 1.12 ± 0.08 b | 23.14 ± 0.92 b |
| AA15 | 16.98 ± 1.23 c | 1.09 ± 0.06 b | 23.00 ± 0.81 b |
Disclaimer/Publisher’s Note: The statements, opinions and data contained in all publications are solely those of the individual author(s) and contributor(s) and not of MDPI and/or the editor(s). MDPI and/or the editor(s) disclaim responsibility for any injury to people or property resulting from any ideas, methods, instructions or products referred to in the content. |
© 2023 by the authors. Licensee MDPI, Basel, Switzerland. This article is an open access article distributed under the terms and conditions of the Creative Commons Attribution (CC BY) license (https://creativecommons.org/licenses/by/4.0/).
Share and Cite
Etxabide, A.; Arregi, M.; Cabezudo, S.; Guerrero, P.; de la Caba, K. Whey Protein Films for Sustainable Food Packaging: Effect of Incorporated Ascorbic Acid and Environmental Assessment. Polymers 2023, 15, 387. https://doi.org/10.3390/polym15020387
Etxabide A, Arregi M, Cabezudo S, Guerrero P, de la Caba K. Whey Protein Films for Sustainable Food Packaging: Effect of Incorporated Ascorbic Acid and Environmental Assessment. Polymers. 2023; 15(2):387. https://doi.org/10.3390/polym15020387
Chicago/Turabian StyleEtxabide, Alaitz, Maite Arregi, Sara Cabezudo, Pedro Guerrero, and Koro de la Caba. 2023. "Whey Protein Films for Sustainable Food Packaging: Effect of Incorporated Ascorbic Acid and Environmental Assessment" Polymers 15, no. 2: 387. https://doi.org/10.3390/polym15020387