Article

Construction of Recombinant Magnetospirillum Strains for Nitrate Removal from Wastewater Based on Magnetic Adsorption

State Key Laboratory of Agrobiotechnology, College of Biological Sciences, China Agricultural University, Beijing 100193, China
*
Author to whom correspondence should be addressed.
Processes 2022, 10(3), 591; https://doi.org/10.3390/pr10030591
Submission received: 18 February 2022 / Revised: 2 March 2022 / Accepted: 5 March 2022 / Published: 18 March 2022

Abstract

:
Nitrate ion (NO3) in wastewater is a major cause of pollution in aquatic environments worldwide. Magnetospirillum gryphiswaldense (MSR-1) has a complete dissimilatory denitrification pathway, converts NO3 in water into nitrogen (N2) and simultaneously removes ammonium ions (NH4+). We investigated and confirmed direct effects of regulatory protein factors Mg2046 and MgFnr on MSR-1 denitrification pathway by EMSAs and ChIP-qPCR assays. Corresponding mutant strains were constructed. Denitrification efficiency in synthetic wastewater medium during a 12-h cell growth period was significantly higher for mutant strain Δmgfnr (0.456 mmol·L−1·h−1) than for wild-type (0.362 mmol·L−1·h−1). Presence of magnetic particles (magnetosomes) in MSR-1 greatly facilitates collection and isolation of bacterial cells (and activated sludge) by addition of a magnetic field. The easy separation of magnetotactic bacteria, such as MSR-1 and Δmgfnr, from wastewater using magnetic fields is a unique feature that makes them promising candidates for practical application in wastewater treatment and sludge pretreatment.

1. Introduction

Nitrate (NO3) pollution in water and wastewater is a major environmental problem worldwide. The primary sources of NO3 contamination are anthropogenic activities such as excessive fertilization in agriculture [1]. In numerous lakes and rivers in Europe and the U.S., NO3 concentration has doubled in less than a decade [2]. In certain coastal zones (e.g., Gulf of Mexico, Yellow Sea, Baltic Sea, Chesapeake Bay) increasing NO3 levels cause severe algal blooms that lead to “dead zones”. NO3 can infiltrate drinking water sources, posing a threat to human health. A 2020 report from the Ireland Environmental Protection Agency [3] concludes that “urgent” action is needed to reduce water NO3 levels.
Among various approaches for NO3 removal, biological denitrification is more cost-effective than physicochemical methods, such as adsorption, ion exchange, and reverse osmosis [4,5]. Biological denitrification has been applied widely for treatment of municipal, industrial, and agriculture wastewater and NO3-contaminated groundwater. During this process, NO3 functions as an electron acceptor and is converted to harmless nitrogen gas by denitrifying microorganisms [6,7,8,9,10]. An electron donor is necessary as a source of electrons and energy during denitrification processes [11].
Denitrification is classified as heterotrophic or autotrophic, depending on the electron donor. In heterotrophic denitrification, the electron donor is a low-molecular-weight (e.g., acetate, methanol, glucose, benzene, methane) or high-molecular-weight (e.g., cellulose, polylactic acid, polycaprolactone) organic compound [11]. In autotrophic denitrification, the electron donor is an inorganic compound such as hydrogen gas (H2), reduced sulfur compound (e.g., sulfide, elemental sulfur, thiosulfate), ferrous iron (Fe2+), iron sulfide (e.g., FeS, Fe1xS, FeS2), arsenite (AsIII), or manganese (MnII) [12]. The nitrate removal rate is generally higher for heterotrophic denitrification than for autotrophic denitrification because heterotrophic bacteria have a faster growth rate [4].
Many studies during the past decade have focused on denitrification processes involving Fe2+ as an electron donor. Most FeII-oxidizing denitrifiers isolated to date are heterotrophic and can grow only in the presence of organic carbon [13,14]. Effective follow-up treatments for excess sludge from heterotrophic denitrification are needed [15]. Following long-term operations, accumulated Fe2+ may form an iron crust that inhibits subsequent activity of denitrifiers.
Magnetotactic bacteria (MTB) produce intracellular magnetic nanoparticles composed of magnetite (Fe3O4) or greigite (Fe3S4) and enclosed by a lipid bilayer, termed “magnetosomes” [16]. These nanosized organelles enable MTB to orient and migrate along magnetic lines of force. MTB have been applied in cancer therapy and in heavy metal biosorption from wastewater or polluted water [17,18]. They are useful for nitrate removal from wastewater because MTB biomass is easily removed from sewage treatment systems by magnetic separation. Li et al. [19] described a complete denitrification pathway, including functional genes for reduction of nitrate (nap), nitrite (nir), nitric oxide (nor), and nitrous oxide (nos), in the extensively studied MTB strain Magnetospirillum gryphiswaldense MSR-1. The present study is focused on regulation of the denitrification pathway in MSR-1, and construction of a recombinant MTB strain with enhanced nitrate removal capability.

2. Materials and Methods

2.1. Bacterial Strains and Culture Conditions

Bacterial strains and plasmids used in this study are listed in Table 1. MSR-1 was autoclaved and cultured at 30 °C in sodium lactate medium (SLM), which contained (per L) 2.25 g of sodium lactate solution (55–65%), 0.4 g of NH4Cl, 0.1 g yeast extract, 0.5 g of K2HPO4, 0.1 g of MgSO4, and 0.5 mL of trace element mixture; ferric citrate was added to obtain a final concentration of 60 µM. To make nitrate medium or ammonium/nitrate medium, 0.4 g of NH4Cl in the above recipe was replaced respectively with 1 g of NaNO3 or 0.2 g of NH4Cl + 0.5 g NaNO3. Synthetic wastewater medium was made as described previously [20] and sterilized at 121 °C for 30 min. MSR-1 cultures were incubated on a shaker (100 rpm, 30 °C) with MSR-1 antibiotics: nalidixic acid (Nx) 5 µg·mL−1, ampicillin 5 µg·mL−1, kanamycin sulfate (Km) 5 µg·mL−1, and gentamicin (Gm) 5 µg·mL−1. Escherichia coli cultures were incubated (shaking: 200 rpm, 37 °C) with E. coli antibiotics: ampicillin 100 µg·mL−1, Km 100 µg·mL−1, and Gm 20 µg·mL−1.

2.2. Cell Growth and Magnetic Response

Optical density at a wavelength of 565 nm (OD565) was measured every 2 h using a UV-visible spectrophotometer (model UNICO2100; Unico Instrument Co.; Shanghai, China). Magnetic response (Cmag) was determined as described previously [21]. Residual iron concentration was measured by ferrozine method in broth supernatant aspirated after centrifugation [22].

2.3. Construction of mgfnr Mutant Strain Δmgfnr

To construct mgfnr deletion mutant, an upstream fragment (1054 bp) was amplified using primer pair mgfnrS-F/mgfnrS-R (Table 1), and a downstream fragment (1207 bp) was amplified using primer pair mgfnrX-F/mgfnrX-R. These fragments were ligated into pMD18-T simple vector (TaKaRa Biotechnology; Dalian, China) for sequencing. Amplified upstream fragment was digested with EcoRI and SacI, and amplified downstream fragment was digested with SacI and XbaI. Gm cassette was digested from pUC-Gm vector with SacI. The above fragments were fused together into XbaI and BamHI sites of pUX19 vector to yield pUX-mgfnr. pUX- mgfnr was transformed into wild-type (WT).
MSR-1 by biparental conjugation using E. coli S17-1 as donor strain (Table 2). Colonies were screened and selected using Gm and Nx. Successful knockout of mgfnr, without deletion of magnetosome island-related genes, was confirmed by PCR.

2.4. Transmission Electron Microscopic (TEM) Observation

Bacterial strains with 60 µM of ferric citrate were placed in SLM and incubated for 24 h at 30 °C. Cells were collected by centrifugation, washed twice with ddH2O, resuspended, dropped onto a copper net, air-dried, and observed by TEM (model JEM-1230; JEOL; Tokyo, Japan). Number and size of magnetosomes were measured using ImageJ software program (NIH; Bethesda, MD, USA).

2.5. Quantitative Real-Time Reverse Transcription PCR (qRT-PCR)

WT and Δmg2046mgfnr strains were cultured for periods of 6, 12, 18, and 24 h. RNA was extracted with TRIzol reagent (Tiangen; Beijing, China), and DNA was digested with DNase I (Takara; Shiga, Japan). RNA was reverse transcribed into cDNA using Moloney murine leukemia virus (M-MLV) reverse transcriptase (Promega; Madison, WI, USA). qRT-PCR was performed as per manufacturer’s instructions, using an optical circulator 480 RT-PCR system and 480 SYBR Green I Master Kit (Roche; Mannheim, Germany). Reaction volume (20 µL total) contained 50 ng of template cDNA, 10 µL of SYBR Green I mix, and 0.5 mM of the particular primer. The housekeeping gene rpoc was used as the internal reference. Calculations were made using the 2-ΔΔCt method, with triplicate samples.

2.6. Electrophoretic Mobility Shift Assays (EMSAs)

EMSAs were performed using digoxigenin gel shift kit (DIG) (2nd generation; Roche). Target DNA sequence was amplified and DIG-labeled in 20-µL reaction volume consisting of 0.4 nM of DIG-labeled probe, various concentrations of His6-Mgfnr/His6-Mg2046, 4 µL of bonding buffer, 1 µL of poly[d(I-C)], and ddH2O. Specificity of Rok7B7/probe interaction was confirmed by adding 300x unlabeled rpoc (nonspecific probe) and specific probe to the reaction system. The sample was incubated for 30 min at 25 °C, PAGE was performed to separate protein-bound DNA from free DNA, gel transferred to positively-charged nylon membrane (Roche), and chemiluminescence signal detected using an imaging system.

2.7. Iron Absorption Capability

Iron concentration in medium was assayed using ferrozine [3-(pyridyl-2-yl)-5,6-bis(4-sulfophenyl)-1,2,4-triazine disodium salt]. Standard curves for the three strains were constructed based on various concentrations (0, 20, 40, 60, 80, 100 µM) of ferric citrate. One hundred microliters of ferric citrate was added with hydroxylammonium chloride (250 µL; 10% [w/v]), incubated for 5 min at room temperature, added with 20 µL of ferrozine (25 g·L−1) and 630 µL of ddH2O, and incubated for another 15 min. OD565 was measured by spectrophotometry. At 6-h intervals, supernatants were obtained by centrifuging 1 mL of cell suspension (relative centrifugal force 8000; 3 min). Iron concentrations in supernatants were measured using the standard curves.

2.8. Protein Expression Vector Construction and Anaerobic Purification

Expression plasmids pET-28a-mg2046 and pET-28a-mgfnr were constructed by PCR amplification using MSR-1 genome as template. mg2046 (723 bp) and mgfnr (762 bp) gene fragments (upstream and downstream; containing EcoR I and Xho I restriction site sequences, respectively) were amplified, ligated into pMD18-T simple vector, and transformed into E. coli DH5α. Correctly sequenced strains were selected, strains containing pET-28a(+) plasmids were cultured, and plasmids were extracted and double digested with EcoR I and Xho I to recover target fragments and linear pET-28a(+) plasmids. Target fragments were combined with pET-28a(+), ligated, and transformed into E. coli BL21.
Constructed strains as above were cultured at 37 °C in 200 mL of LB broth added with 50 µg·mL−1 of Km until OD600 reached 0.6. Cells were placed in an ice bath for 18 min, and added with isopropyl β-D-1-thiogalactopyranoside (IPTG) to achieve a final concentration 1 mM of IPTG. mg2046 was incubated at 150 rpm, at 16 °C, and mgfnr was incubated at 200 rpm and induced for 1 h at 37 °C. Methionine and ferric citrate were added to respective final concentrations of 25 and 200 µM, and incubation was continued. Cells were collected, disrupted in anaerobic environment by low-temperature centrifugation, and protein-containing supernatant was placed in nickel-nitrilotriacetic acid-agarose (Ni-NTA) column (GE Healthcare; Danderyd, Sweden), repeatedly vacuumed and exposed to nitrogen gas, transferred to anaerobic glovebox cabinet (MBRAUN LABstar; München, Germany), and eluted with buffers containing 20 mM Tris (pH 8.0), 300 mM NaCl, and imidazole at various concentrations. Purified proteins were stored in liquid nitrogen.

2.9. Chromatin Immunoprecipitation-Quantitative PCR (ChIP-qPCR)

Following anaerobic purification as above, proteins were sent out (BGI Genomics; Beijing, China) in order to prepare polyclonal antibodies for ChIP-qPCR. Purified Mg2046 and Mgfnr proteins were injected into rabbits to generate respective polyclonal antibodies. qPCR was performed using primer pairs listed in Table 1, and relative levels of Mg2046 and Mgfnr-precipitated DNA were determined by comparison with IgG control.

2.10. Total Nitrogen Content

Tested bacterial cells were cultured and harvested as in preceding sections. Total nitrogen content of cells was determined using a kit (cat # LH-NT-100; Lianhua Technology; Beijing, China) as per the manufacturer’s instructions.

3. Results

3.1. Combined Effects of Dissimilatory Denitrification Pathway Genes Determined by EMSAs and ChIP-qPCR

Denitrifying effects of microorganisms in sewage are closely correlated with degree of denitrification gene expression. Two protein factors (Mg2046, MgFnr) were previously implicated in control of MSR-1 denitrification pathway [23]. We examined the capability of these factors to directly regulate specific denitrification genes, including nap, nir, nor, and nos.
His6-labeled Mg2046 and Mgfnr proteins were expressed in E. coli BL21 and confirmed by western blotting (Figure S1). The capability of Mg2046 and Mgfnr to directly regulate genes involved in the dissimilatory denitrification pathway (NO3→ NO2→ NO → N2O → N2) was determined by EMSAs using anaerobically-purified His6-Mgfnr and His6-Mg2046. Both these tagged proteins combined with upstream sequences of napF, nirT, nosZ, and mg2046 (Figure 1A,B), and His6-Mg2046 combined with norC (Figure 1A), indicating the capability of both Mg2046 and Mgfnr to directly regulate dissimilatory denitrification genes. Mgfnr directly regulated mg2046, whereas no direct regulator of mgfnr by Mg2046 was found.
Combination of Mgfnr and Mg2046 with dissimilatory denitrification gene promoters in vivo was further examined by ChIP-qPCR using WT, Δmgfnr (constructed in this study; confirmed by PCR) (Figure S2), and Δmg2046 (constructed by Wang et al. [24]). WT strain was used as negative control, qRT-PCR analysis of product DNA showed that no enrichment of Mg2046 on mgfnr was detected; enrichment levels of Mgfnr and Mg2046 on napF, nirT, norC, nosZ and mg2046 were at least 1-fold higher in Δmg2046mgfnr than that in control in all samples immunoprecipitated (Figure 1C). These findings indicate that Mg2046 regulates dissimilatory denitrification genes and itself, but does not directly regulate mgfnr, whereas Mgfnr regulates the dissimilatory denitrification genes and also mg2046.

3.2. Transcription Levels of Dissimilatory Denitrification Pathway Genes

Variations of dissimilatory denitrification pathway in Δmg2046 and Δmgfnr were evaluated by qRT-PCR analysis of key genes (napF, nirT, norC, nosZ). Elimination of nap and nir impairs magnetite biomineralization, resulting in fewer, smaller, and more irregular crystals during the denitrification process. Microaerobic respiration may interfere with magnetosome synthesis by disrupting proper oxide balance [19,25]. Δmg2046, relative to WT, did not show significant difference of nirT or norC transcription levels at 6 or 12 h, nor of napF or nosZ levels at 6 h. Levels of napF, nirT, norC, and nosZ decreased significantly in Δmg2046 relative to WT during 18–24 h but increased significantly in Δmgfnr (Figure 2). Levels of dissimilatory denitrification genes were relatively low from 6–12 h. Consumption of oxygen in medium from 18–24 h resulted in increased levels of dissolved oxygen and of dissimilatory denitrification genes. Gene transcription was significantly higher in WT than in Δmg2046, indicating a positive regulatory effect of mg2046 on denitrification pathway as oxygen content declined. Transcription levels of mgfnr genes did not differ significantly between Δmg2046 and WT, whereas levels of mg2046 genes were significantly lower (Figure 2E,F), indicating a unidirectional positive regulatory effect of mgfnr on mg2046.
Energy-saving wastewater treatment plants have received increasing research attention [26]. Microaerobic wastewater treatment has the potential to reduce energy consumption and improve operational efficiency [27,28]. Required DO concentration in microaerobic reactors is as low as 0.3–1.0 mg·L−1 and can save aeration energy [29]. mgfnr genes had a negative regulatory effect on the pathway during all growth periods, suggesting that Δmgfnr mutation could potentially increase nitrate utilization efficiency. We utilized a microaerophilic MTB strain, MSR-1, to remove nitrate from synthetic wastewater medium. Δmgfnr is a promising candidate for industrial nitrate removal from wastewater.

3.3. Phenotypic Analysis of WT and Δmg2046/Δmgfnr

Large quantities of activated sludge (an umbrella term for microbial communities and the organic and inorganic substances on which they depend [30]) are typically produced during sewage treatment. During denitrification processes, sludge is distributed throughout the sewage system and needs to be collected for treatment. Ease of solid/liquid separation is directly related to treatment efficiency of activated sludge. The activated sludge with MTB can be quickly separated from the processing wastewater under an added magnetic field, which presents a unique advantage in sewage treatment. An important consideration in studying the denitrification power of mutant strains is that their magnetosome synthesis capability be fairly unaffected in order to facilitate application of magnetic adsorption.
WT and Δmgfnr MSR-1 strains were observed by TEM, and magnetosome numbers and particle sizes were quantified. In WT, magnetosomes were densely arranged and had uniform particle size. In Δmg2046, magnetosomes were less dense and had shorter chains. Δmgfnr showed greater synthesis of irregular magnetosomes, including some with small size (Figure 3A). Relative to WT, magnetosome number and particle size were significantly smaller for Δmg2046, but similar for Δmgfnr (Figure 3B).
MTB were cultured in a thermostatic shaker. For construction of the Cmag curve, vertical and horizontal magnetic fields were added by modifying the spectrophotometer, measuring absorbance, and calculating Cmag values to reflect differences in number and maturity of magnetosomes. OD565 growth curves of Δmgfnrmg2046 were similar to that of WT (Figure 3C). Comparison of Cmag curves showed that magnetosome synthesis in Δmg2046 began at 12 h and that Cmag value was significantly lower than that of WT, indicating slower magnetosome synthesis and reduced magnetic response. The magnetic response curve of WT was similar to that of Δmgfnr, indicating that absence of mgfnr did not strongly affect magnetosome synthesis (Figure 3D). Iron absorption rates were calculated at 6-h intervals, based on measurement of residual iron content in cells. Rates for Δmg2046mgfnr were lower than for WT over various time periods. Rates for Δmgfnr were higher than those for Δmg2046 during the 0–6 h and 18–24 h periods, consistent with the higher Cmag value of Δmgfnr (Figure 3E).

3.4. Transcription of Genes Involved in Magnetosome Synthesis

The phenotypic analyses clearly showed that magnetosome synthesis was altered by mutations of mg2046 and mgfnr. Changes in gene transcription levels of magnetosome islands (MAI) were evaluated by examining key MAI genes mamA, mamB, mamF, and mamY. The mamAB gene cluster plays a key role in magnetosome synthesis [31]. Transcription levels of the four genes during various periods were significantly higher for WT than for Δmg2046, consistent with the reduced magnetosome synthesis and magnetic response of Δmg2046 during cell growth (Figure 4A,B). Transcription levels of the four genes during the most crucial magnetosome synthesis period (6–12 h) did not differ significantly between Δmgfnr and WT. During the 18–24 h period, mamA, mamB, and mamY levels were significantly lower for Δmgfnr than for WT (Figure 4C,D). These findings suggest that magnetosome synthesis in Δmg2046 was blocked, and abnormal crystals were generated during early cell growth stages because of reduced expression of the four genes. Gene transcription levels for Δmgfnr during the crucial 6–12 h period did not differ notably from those for WT, indicating that this mutation had no major effect on magnetosome synthesis and will not affect magnetic adsorption sedimentation. In contrast, normal functioning of mg2046 plays an important role in magnetosome synthesis through direct or indirect positive regulatory effects.

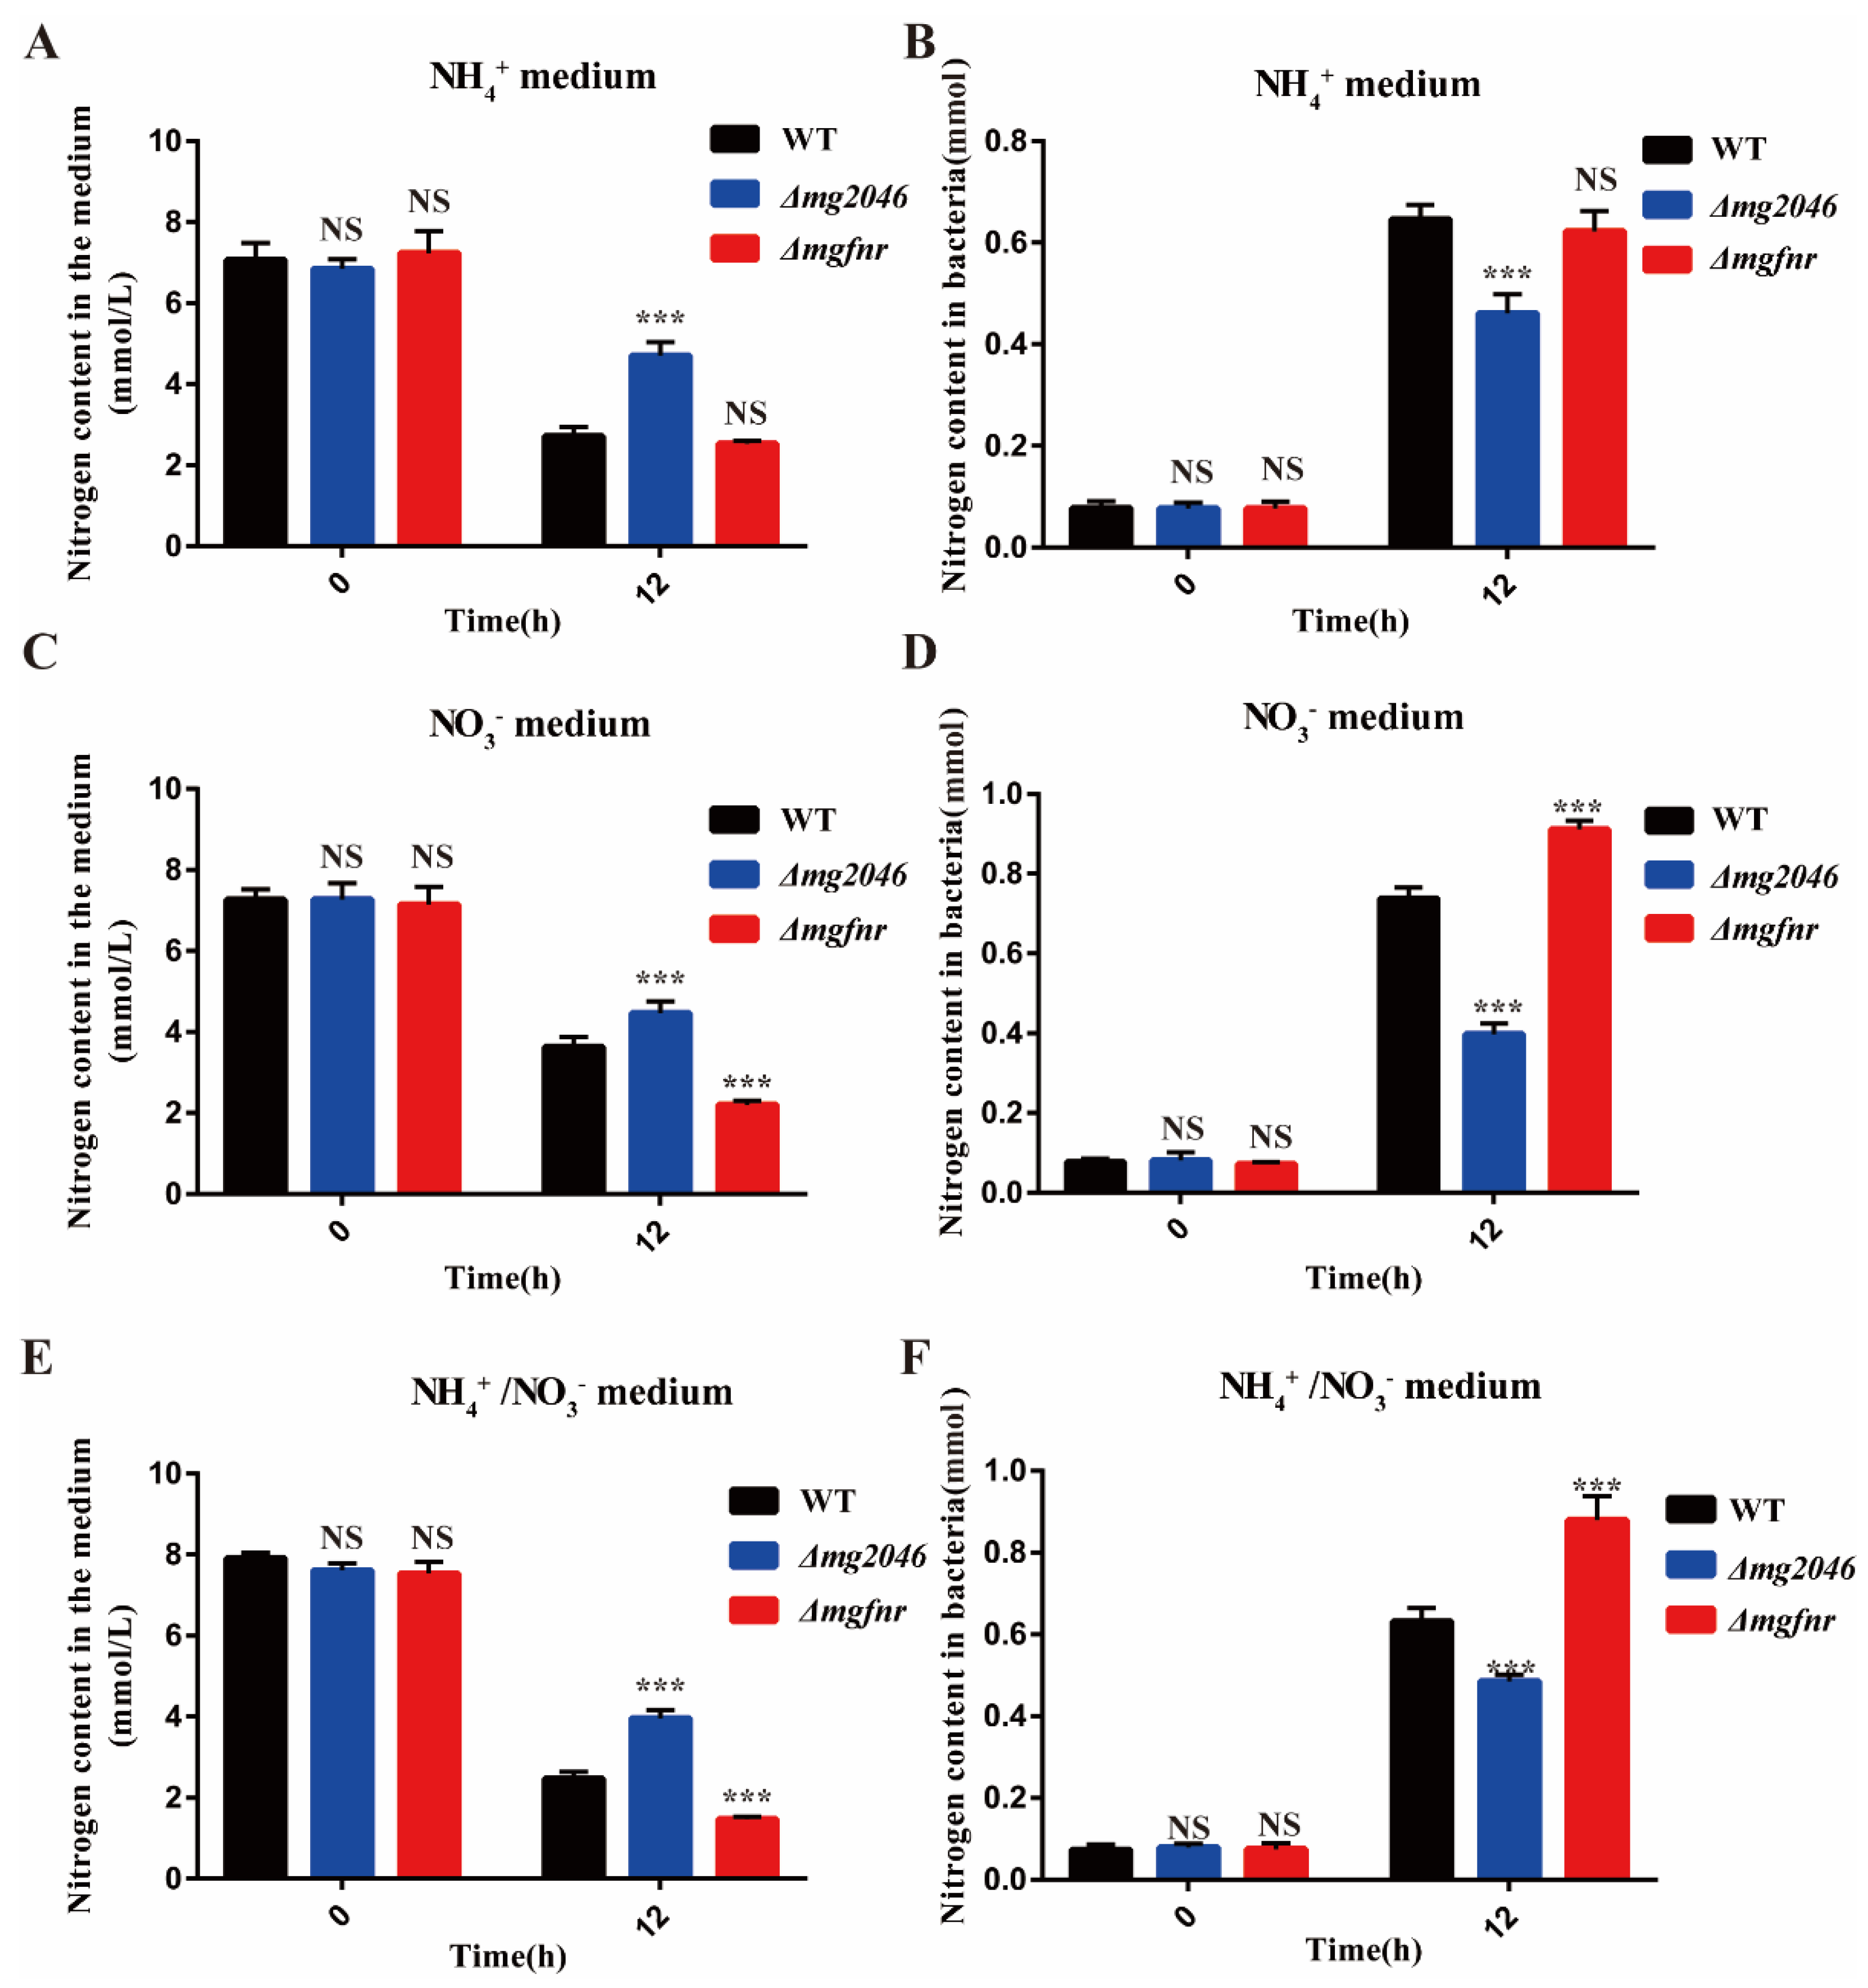
3.5. Comparative Utilization of Various Nitrogen Sources by WT and Δmg2046/Δmgfnr

Absorption and utilization capabilities of WT and Δmg2046mgfnr for various nitrogen sources (ammonium [NH4+], nitrate [NO3], ammonium/nitrate [NH4+/NO3]) were evaluated. In NH4+ medium, total nitrogen removal rates after 12 h culture for WT, Δmg2046, and Δmgfnr were respectively 0.363, 0.178, and 0.393 mmol·L−1·h−1, and total nitrogen content in medium did not differ notably for WT vs. Δmgfnr (Figure 5A,B). Total nitrogen content in medium, relative to WT, was significantly higher for Δmg2046. These findings suggest that NH4+ absorption and utilization capabilities were similar for WT and Δmgfnr but lower for Δmg2046.
Total nitrogen removal rates after 12 h culture for WT and Δmg2046mgfnr were respectively 0.302, 0.234, and 0.412 mmol·L−1·h−1 in NO3 medium, and 0.454, 0.304, and 0.505 mmol·L−1·h−1 in NH4+/NO3 medium (Figure 5C–F). Total nitrogen content in medium, relative to WT, was significantly higher for Δmg2046 but lower for Δmgfnr, and nitrogen removal rates were respectively 69.20%, 65.09%, and 80.50%. Total nitrogen content in bacteria, relative to WT, was significantly lower for Δmg2046 but higher for Δmgfnr. These findings indicate that NO3 and NH4+/NO3 absorption and utilization capabilities of Δmgfnr, relative to WT, are significantly higher, and it has superior pollution treatment capacity for major nitrogen-source nitrates in the environment. Δmgfnr can use NO3 and NH4+ simultaneously as nitrogen sources and adapt to a variety of sewage environments.

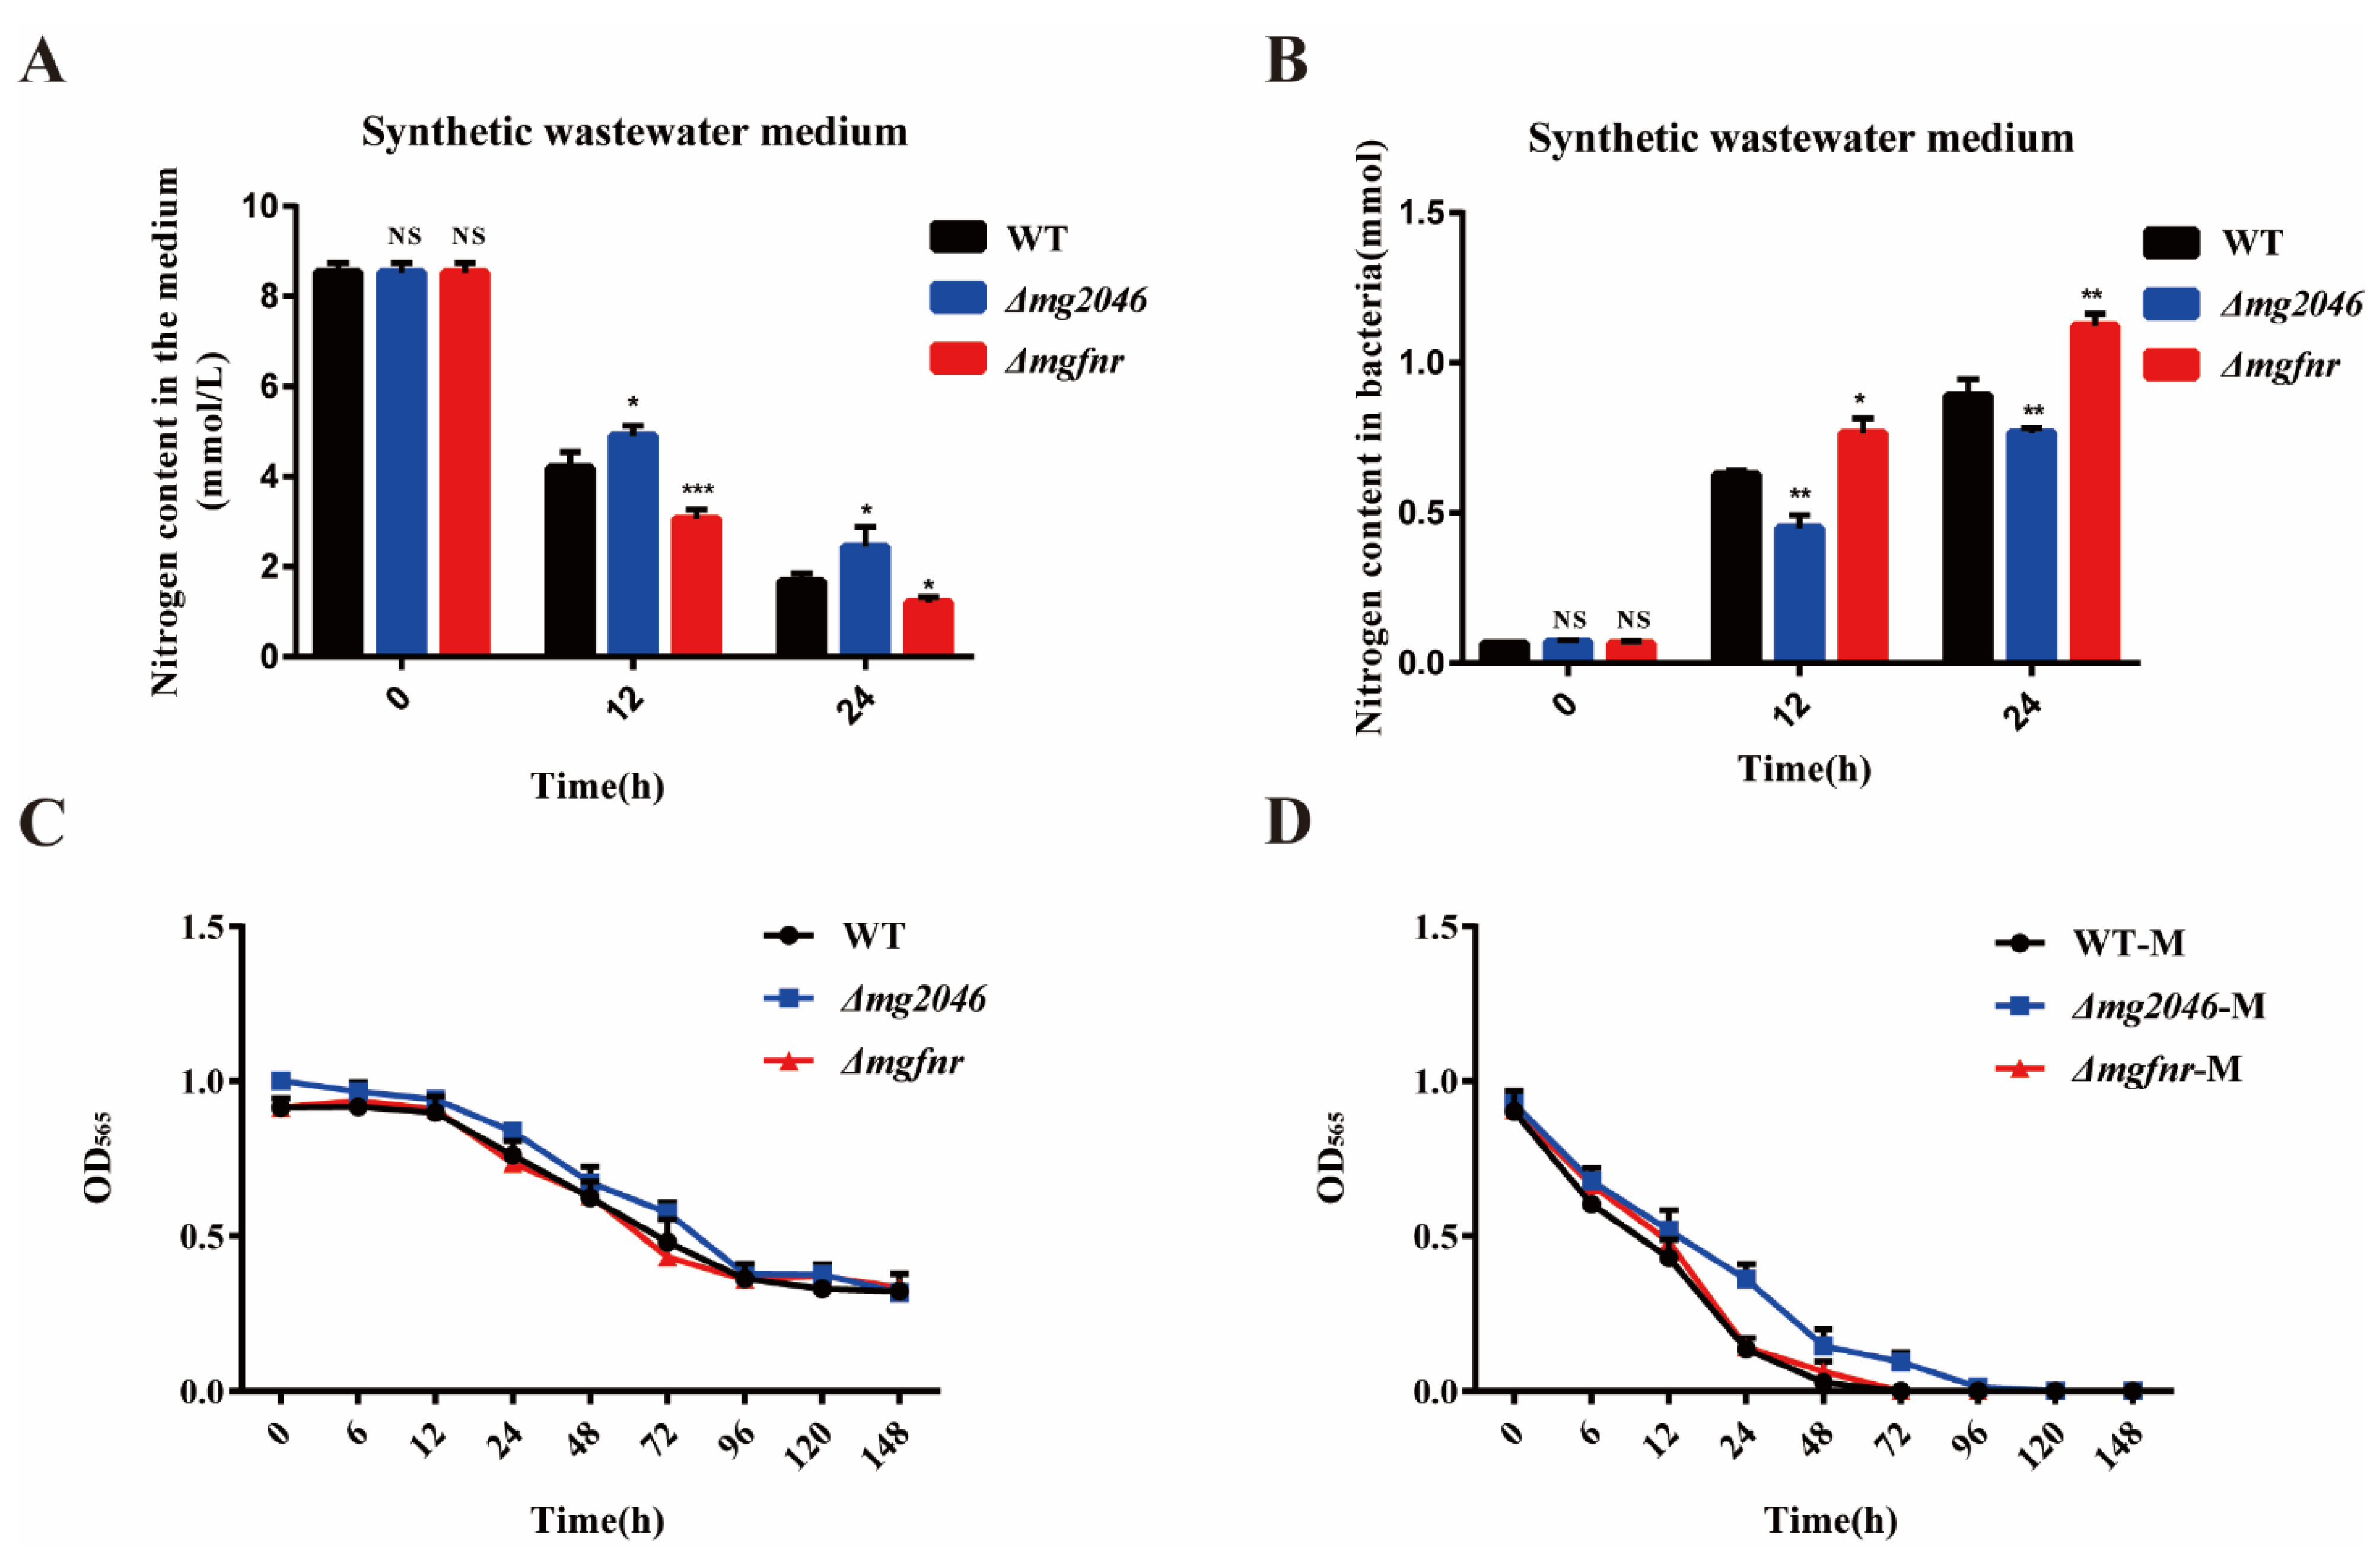
3.6. Comparative Utilization of Nitrogen Sources from Synthetic Wastewater by WT and Δmg2046/Δmgfnr

The three bacterial strains were cultured in synthetic wastewater to evaluate feasibility of using MTB for treatment of industrial wastewater from the stainless steel industry. Samples were taken at 0, 12, and 24 h for determination of total nitrogen content in medium and in bacteria. Total nitrogen levels did not differ notably at 0 h. Total nitrogen removal rates in medium for WT, Δmg2046, and Δmgfnr were respectively 0.362, 0.302, and 0.456 mmol·L−1·h−1 at 0–12 h, and 0.210, 0.205, and 0.155 mmol·L−1·h−1 at 12–24 h (Figure 6A). Total nitrogen content in bacteria generally increased with culture time, and relative to WT was higher for Δmgfnr and lower for Δmg2046 (Figure 6B). Thus, denitrification efficiency in synthetic wastewater declined for Δmg2046 but increased for Δmgfnr (0.456 mmol·L−1·h−1 during 0–12 h; 0.155 mmol·L−1·h−1 during 12–24 h). Total nitrogen removal rates for Δmgfnr were 64.09% at 12 h and 85.83% at 24 h. Δmgfnr is potentially useful for nitrate processing in synthetic industrial wastewater from the stainless steel industry, with a variety of applications.
Feasibility of magnetic adsorption by the three MTB strains was evaluated by placing cultures above a strong magnet and measuring OD565; cultures without a magnet were used as controls. Sedimentation rates of the three control groups were similar (OD565 decreased from 1.0 at 0 h to 0.3 at 148 h); the rates declined rapidly from 12 to 96 h but showed minimal change from 96 to148 h (Figure 6C). Magnetic adsorption rates were significantly higher for experimental groups than control groups (Figure 6D). OD565 for experimental groups declined from 1.0 at 0 h to 0.15–0.3 at 24 h, whereas OD565 for control groups was ~0.7 at 24 h. OD565 for WT and Δmgfnr was near 0 at 72 h, whereas that for Δmg2046 approached 0 at 96 h, presumably because magnetosome synthesis was blocked. These findings suggest that magnetic adsorption enhances sedimentation rates for MTB, reduces energy consumption required for separation of activated sludge, and has a wide variety of potential applications.
The traditional activated sludge system for wastewater treatment has always been the object of a lot of research [32,33]. Wastewater treatments using current activated sludge process (ASP) inevitably produce waste biomass. The water treatment industry has developed rapidly during the past decade, with associated increase in amount of activated sludge produced by sewage processing [34]. Various pretreatment methods for active sludge (including chemical, mechanical, biological, and thermal hydrolysis methods) have been developed [35,36]. For all of these, improved separation of liquid and solid components will result in greater energy efficiency, better sludge dewater ability, and reduced sludge viscosity, making the method more feasible and practicable [37]. The fact that MTB can be easily separated from wastewater using magnetic fields [18] is a unique feature that makes Δmgfnr promising candidates for practical application in sludge pretreatment.

4. Conclusions

Proteins Mg2046 and Mgfnr were shown to directly regulate genes involved in the dissimilatory denitrification pathway. M. gryphiswaldense MSR-1 deletion mutant strains Δmg2046 and Δmgfnr were constructed, and their functions and relationships were evaluated based on phenotypic and genetic characteristics. mgfnr mutation did not notably affect magnetosome synthesis, and transcription levels of dissimilatory denitrification genes for Δmgfnr were higher than those for WT. Total nitrogen removal rates in NH4+, NO3, NH4+/NO3, and synthetic wastewater medium were significantly higher for Δmgfnr than for WT or Δmg2046. Magnetic adsorption was shown experimentally to significantly increase the sedimentation rate of activated sludge for MTB.

Supplementary Materials

The following supporting information can be downloaded at: https://www.mdpi.com/article/10.3390/pr10030591/s1, Figure S1: Protein purification and verification. (A) SDS-PAGE purification of proteins His6-Mgfnr and His6-Mg2046. (B) Confirmation of target protein by Western blotting; Figure S2: Construction of Δmgfnr strains and confirmation by PCR. (A) Construction of Δmgfnr strains (schematic). (B) Confirmation by PCR of Δmgfnr strains. Markers: 3000, 2000, 1200, 800, 500, and 200 bp. (C) Detection by PCR of mam genes in mutant strains.

Author Contributions

H.Z.: conceptualization, methodology, software, formal analysis, investigation, data curation, writing—original draft, visualization; B.P.: methodology, software, formal analysis, Writing—review & editing, visualization; S.L.: investigation, formal analysis, software, formal analysis; S.M.: investigation, methodology; J.X.: investigation, data curation; Y.W.: Writing—review & editing, supervision, funding acquisition; J.T.: conceptualization, methodology, writing—review & editing, supervision, project administration, funding acquisition. All authors have read and agreed to the published version of the manuscript.

Funding

This research received no external funding.

Acknowledgments

This study was supported by Key Project of Inter-Governmental International Scientific and Technological Innovation Cooperation (2019YFE0115800), the National Natural Science Foundation of China (No. 31570037, 21577170), the Project for Extramural Scientists of State Key Laboratory of Agro-biotechnology (2020SKLAB6-6), Science and Technology Power Economy 2020 Key Projects (SQ2020YFF0401976), and Beijing Municipal Science and Technology Program (Z201100007920010).The authors are also grateful to S. Anderson and Tara Penner for English editing of the manuscript.

Conflicts of Interest

The authors declare no conflict of interest.

References

  1. Wick, K.; Heumesser, C.; Schmid, E. Groundwater nitrate contamination: Factors and indicators. J. Environ. Manag. 2012, 111, 178–186. [Google Scholar] [CrossRef] [PubMed] [Green Version]
  2. Fields, S. Global nitrogen-Cycling out of control. Environ. Health Perspect. 2004, 112, A556–A563. [Google Scholar] [CrossRef] [PubMed]
  3. Trodden, W.; O’Boyle, S. Water Quality in 2020: An Indicators Reports; EPA: Wexford, Ireland, 2020.
  4. Park, J.Y.; Yoo, Y.J. Biological nitrate removal in industrial wastewater treatment: Which electron donor we can choose. Appl. Microbiol. Biotechnol. 2009, 82, 415–429. [Google Scholar] [CrossRef] [PubMed]
  5. Xia, L.; Li, X.M.; Fan, W.H.; Wang, J.L. Heterotrophic nitrification and aerobic denitrification by a novel Acinetobacter sp. ND7 isolated from municipal activated sludge. Bioresour. Technol. 2020, 301, 8. [Google Scholar] [CrossRef]
  6. Elefsiniotis, P.; Wareham, D.G.; Smith, M.O. Use of volatile fatty acids from an acid-phase digester for denitrification. J. Biotechnol. 2004, 114, 289–297. [Google Scholar] [CrossRef]
  7. Sahinkaya, E.; Kilic, A.; Duygulu, B. Pilot and full scale applications of sulfur-based autotrophic denitrification process for nitrate removal from activated sludge process effluent. Water Res. 2014, 60, 210–217. [Google Scholar] [CrossRef]
  8. Tang, Y.; Ziv-El, M.; Zhou, C.; Shin, J.H.; Ahn, C.H.; Meyer, K.; Candelaria, D.; Friese, D.; Overstreet, R.; Scott, R.; et al. Bioreduction of nitrate in groundwater using a pilot-scale hydrogen-based membrane biofilm reactor. Front. Environ. Sci. Eng. China 2010, 4, 280–285. [Google Scholar] [CrossRef]
  9. Wang, J.L.; Jing, K. The characteristics of anaerobic ammonium oxidation (ANAMMOX) by granular sludge from an EGSB reactor. Process Biochem. 2005, 40, 1973–1978. [Google Scholar]
  10. Wang, J.L.; Yang, N. Partial nitrification under limited dissolved oxygen conditions. Process Biochem. 2004, 39, 1223–1229. [Google Scholar]
  11. Wang, J.L.; Chu, L.B. Biological nitrate removal from water and wastewater by solid-phase denitrification process. Biotechnol. Adv. 2016, 34, 1103–1112. [Google Scholar] [CrossRef]
  12. Di Capua, F.; Pirozzi, F.; Lens, P.N.L.; Esposito, G. Electron donors for autotrophic denitrification. Chem. Eng. J. 2019, 362, 922–937. [Google Scholar] [CrossRef]
  13. Hwang, Y.; Mines, P.D.; Jakobsen, M.H.; Andersen, H.R. Simple colorimetric assay for dehalogenation reactivity of nanoscale zero-valent iron using 4-chlorophenol. Appl. Catal. B-Environ. 2015, 166, 18–24. [Google Scholar] [CrossRef] [Green Version]
  14. Tang, S.; Wang, X.M.; Yang, H.W.; Xie, Y.F.F. Haloacetic acid removal by sequential zero-valent iron reduction and biologically active carbon degradation. Chemosphere 2013, 90, 1563–1567. [Google Scholar] [CrossRef] [PubMed]
  15. Pang, Y.; Wang, J. Various electron donors for biological nitrate removal: A review. Sci. Total Environ. 2021, 794, 148699. [Google Scholar] [CrossRef]
  16. Lefevre, C.T.; Bazylinski, D.A. Ecology, Diversity, and Evolution of Magnetotactic Bacteria. Microbiol. Mol. Biol. Rev. 2013, 77, 497–526. [Google Scholar] [CrossRef] [Green Version]
  17. Lou, X.; Chen, Z.; He, Z.; Sun, M.; Sun, J. Bacteria-Mediated Synergistic Cancer Therapy: Small Microbiome Has a Big Hope. Nano-Micro Lett. 2021, 13, 1–26. [Google Scholar] [CrossRef]
  18. Zhou, W.; Zhang, Y.Z.; Ding, X.H.; Liu, Y.; Shen, F.; Zhang, X.H.; Deng, S.H.; Xiao, H.; Yang, G.; Peng, H. Magnetotactic bacteria: Promising biosorbents for heavy metals. Appl. Microbiol. Biotechnol. 2012, 95, 1097–1104. [Google Scholar] [CrossRef]
  19. Li, Y.J.; Katzmann, E.; Borg, S.; Schuler, D. The Periplasmic Nitrate Reductase Nap Is Required for Anaerobic Growth and Involved in Redox Control of Magnetite Biomineralization in Magnetospirillum gryphiswaldense. J. Bacteriol. 2012, 194, 4847–4856. [Google Scholar] [CrossRef] [Green Version]
  20. Fernandez-Nava, Y.; Maranon, E.; Soons, J.; Castrillon, L. Denitrification of high nitrate concentration wastewater using alternative carbon sources. J. Hazard. Mater. 2010, 173, 682–688. [Google Scholar] [CrossRef]
  21. Rong, C.B.; Huang, Y.J.; Zhang, W.J.; Jiang, W.; Li, Y.; Li, J.L. Ferrous iron transport protein B gene (feoB1) plays an accessory role in magnetosome formation in Magnetospirillum gryphiswaldense strain MSR-1. Res. Microbiol. 2008, 159, 530–536. [Google Scholar] [CrossRef]
  22. Dailey, H.A.; Lascelles, J. Reduction of iron and synthesis of protoheme by spirillum-itersonii and other organisms. J. Bacteriol. 1977, 129, 815–820. [Google Scholar] [CrossRef] [PubMed] [Green Version]
  23. Wang, X.; Wang, Q.; Zhang, Y.; Wang, Y.; Zhou, Y.; Zhang, W.; Wen, T.; Li, L.; Zuo, M.; Zhang, Z.; et al. Transcriptome analysis reveals physiological characteristics required for magnetosome formation in Magnetospirillum gryphiswaldense nMSR-1. Environ. Microbiol. Rep. 2016, 8, 371–381. [Google Scholar] [CrossRef] [PubMed]
  24. Wang, X.; Zheng, H.L.; Wang, Q.; Jiang, W.; Wen, Y.; Tian, J.S.; Sun, J.B.; Li, Y.; Li, J.L. Novel Protein Mg2046 Regulates Magnetosome Synthesis in Magnetospirillum gryphiswaldense MSR-1 by Modulating a Proper Redox Status. Front. Microbiol. 2019, 10, 12. [Google Scholar] [CrossRef] [PubMed] [Green Version]
  25. Li, Y.J.; Bali, S.; Borg, S.; Katzmann, E.; Ferguson, S.J.; Schuler, D. Cytochrome cd(1) Nitrite Reductase NirS Is Involved in Anaerobic Magnetite Biomineralization in Magnetospirillum gryphiswaldense and Requires NirN for Proper d(1) Heme Assembly. J. Bacteriol. 2013, 195, 4297–4309. [Google Scholar] [CrossRef] [Green Version]
  26. Hao, X.D.; Furumai, H.; Chen, G.H. Resource recovery: Efficient approaches to sustainable water and wastewater treatment. Water Res. 2015, 86, 83–84. [Google Scholar] [CrossRef]
  27. Cheng, C.; Zhou, Z.; Pang, H.J.; Zheng, Y.; Chen, L.Y.; Jiang, L.M.; Zhao, X.D. Correlation of microbial community structure with pollutants removal, sludge reduction and sludge characteristics in micro-aerobic side-stream reactor coupled membrane bioreactors under different hydraulic retention times. Bioresour. Technol. 2018, 260, 177–185. [Google Scholar] [CrossRef]
  28. Hussain, A.; Lee, J.; Reid, R.; Lee, H.S. Upflow anaerobic-microaerobic fixed biofilm reactor integrating methanogenesis with partial nitrification. Chem. Eng. J. 2018, 348, 281–291. [Google Scholar] [CrossRef]
  29. Meng, J.; Li, J.L.; Li, J.Z.; Antwi, P.; Deng, K.W.; Wang, C.; Buelna, G. Nitrogen removal from low COD/TN ratio manure-free piggery wastewater within an upflow microaerobic sludge reactor. Bioresour. Technol. 2015, 198, 884–890. [Google Scholar] [CrossRef]
  30. Mesquita, D.P.; Amaral, A.L.; Ferreira, E.C. Activated sludge characterization through microscopy: A review on quantitative image analysis and chemometric techniques. Anal. Chim. Acta 2013, 802, 14–28. [Google Scholar] [CrossRef]
  31. Murat, D.; Quinlan, A.; Vali, H.; Komeili, A. Comprehensive genetic dissection of the magnetosome gene island reveals the step-wise assembly of a prokaryotic organelle. Proc. Natl. Acad. Sci. USA 2010, 107, 5593–5598. [Google Scholar] [CrossRef] [Green Version]
  32. Verlicchi, P.; Al Aukidy, M.; Zambello, E. Occurrence of pharmaceutical compounds in urban wastewater: Removal, mass load and environmental risk after a secondary treatment-A review. Sci. Total Environ. 2012, 429, 123–155. [Google Scholar] [CrossRef] [PubMed]
  33. Verlicchi, P.; Zambello, E. How efficient are constructed wetlands in removing pharmaceuticals from untreated and treated urban wastewaters? A review. Sci. Total Environ. 2014, 470, 1281–1306. [Google Scholar] [CrossRef] [PubMed]
  34. Yuan, S.J.; Dai, X.H. Sewage sludge-based functional nanomaterials: Development and applications. Environ. Sci.-Nano 2017, 4, 17–26. [Google Scholar] [CrossRef]
  35. Gonzalez, A.; Hendriks, A.; van Lier, J.B.; de Kreuk, M. Pre-treatments to enhance the biodegradability of waste activated sludge: Elucidating the rate limiting step. Biotechnol. Adv. 2018, 36, 1434–1469. [Google Scholar] [CrossRef] [PubMed] [Green Version]
  36. Zhen, G.Y.; Lu, X.Q.; Kato, H.; Zhao, Y.C.; Li, Y.Y. Overview of pretreatment strategies for enhancing sewage sludge disintegration and subsequent anaerobic digestion: Current advances, full-scale application and future perspectives. Renew. Sustain. Energy Rev. 2017, 69, 559–577. [Google Scholar] [CrossRef]
  37. Lu, D.; Wu, D.; Qian, T.T.; Jiang, J.K.; Cao, S.B.; Zhou, Y. Liquid and solids separation for target resource recovery from thermal hydrolyzed sludge. Water Res. 2020, 171, 115476. [Google Scholar] [CrossRef]
Figure 1. Mg2046 and Mgfnr combine with promoter regions of dissimilatory denitrification genes. (A) Mg2046 binds to promoter regions of napF, nirT, norC, nosZ, and mg2046. Each lane contains 0.4 nM of labeled probe. Lanes 1–6 respectively contain 0, 20, 40, 60, 60, and 60 ng of His6-Mg2046. Lanes 5 and 6 are added with 100-fold unlabeled nonspecific competitor DNA (N) or unlabeled specific probe (S) to confirm binding specificity. (B) Mgfnr binds to promoter regions of napF, nirT, nosZ, and mg2046. Lanes 1–6 contain 0, 40, 80, 120, 120, and 120 ng of His6-Mgfnr. (C) In vivo ChIP-qPCR analysis. MSR-1 strains WT, Δmg2046, and Δmgfnr were immunized with anti-Mg2046 and -Mgfnr antibodies for 24 h. y-axis: relative abundance of mg2046 and mgfnr for each point. NS: no significant difference (t-test). * p < 0.05; ** p < 0.01. Error bar: SD from three replicate experiments.
Processes 10 00591 g001
Figure 2. Relative transcription levels of dissimilatory denitrification genes in WT, Δmg2046, and Δmgfnr. (AF): napF, nirT, norC, nosZ, mg2046, and mgfnr genes. Reference gene: rpoC. NS: no significant difference (t-test). * p < 0.05; ** p < 0.01; *** p < 0.001. Error bar: SD from three replicate experiments.
Processes 10 00591 g002
Figure 3. Phenotypic analyses of WT, Δmg2046, and Δmgfnr. (A) TEM images with progressive enlargement from left to right. Scale bars: 1 µm, 500 nm, 200 nm. (B) Magnetosome particle size and number per cell. (C) Cell growth curve (OD565). (D) Magnetic response (Cmag) curve. (E) Cellular iron absorption rate. Data shown represent mean ± SD from three replicates. NS: no significant difference (t-test). * p < 0.05; ** p < 0.01; *** p < 0.001. Error bar: SD from three replicate experiments.
Processes 10 00591 g003
Figure 4. Relative transcription levels of MAI genes in WT, Δmg2046, and Δmgfnr. (AD): mamA, mamB, mamF, and mamY genes. Reference gene: rpoC. NS: no significant difference (t-test). * p < 0.05; ** p < 0.01; *** p < 0.001. Error bar: SD from three replicate experiments.
Processes 10 00591 g004
Figure 5. Total nitrogen content of media and bacteria for WT, Δmg2046, and Δmgfnr. (A) NH4+ medium. (B) Bacteria in NH4+ medium. (C) NO3 medium. (D) Bacteria in NO3 medium. (E) NH4+/NO3 medium. (F) Bacteria in NH4+/NO3 medium. NS: no significant difference (t-test). *** p < 0.001. Error bar: SD from three replicate experiments.
Processes 10 00591 g005
Figure 6. Total nitrogen content of media and bacteria in synthetic wastewater medium for WT, Δmg2046, and Δmgfnr (A,B), and OD565 curves (C,D). (A) Media. (B) Bacteria. (C) OD565 curve during natural sedimentation. (D) OD565 curve during magnetic adsorption sedimentation. NS: no significant difference (t-test). * p < 0.05; ** p < 0.01; *** p < 0.001. Error bar: SD from three replicate experiments.
Processes 10 00591 g006
Table 1. Primers used in this study.
PrimerSequence (5′-3′)Description
Qrpoc-FATCTGGTCTACCGCCATTGqRT-PCR for rpoc gene
Qrpoc-RCCTTGCCGAACGAAATACCqRT-PCR for rpoc gene
QmamA-FGCCTATCCGTGGCGAAGAAqRT-PCR for mamA gene
QmamA-RTCGGCATCGTAAACCTGCTqRT-PCR for mamA gene
QmamB-FAGGTCGTGTGGTGGGCATqRT-PCR for mamB gene
QmamB-RCGCTCATCCGCAGGCTTAqRT-PCR for mamB gene
Qmms6-FGGTTGGCGTTGGGAAGGTqRT-PCR for mms6 gene
Qmms6-RCATCGCTCTGTGCCGCTTqRT-PCR for mms6 gene
QmmsF-FTCGGGACGACGAGTTTGTCqRT-PCR for mmsF gene
QmmsF-RGGAACACCACGGAGACCAAqRT-PCR for mmsF gene
QnapF-FTGATGTCGCACAGCCTTAGqRT-PCR for napF gene
QnapF-RTGATGTCGCACAGCCTTAGqRT-PCR for napF gene
QnirT-FCCATTCACTACACCAACCGTTCqRT-PCR for nirT gene
QnirT-RATGGCAGTTGCGGCATTCqRT-PCR for nirT gene
QnorC-FCGGTGTTCGTTGCCTTGAqRT-PCR for norC gene
QnorC-RCAGACATTGCCCAGTTCCGqRT-PCR for norC gene
QnosZ-FTCGCCACGGTGTCCTTTqRT-PCR for nosZ gene
QnosZ-RATCACCTGACCGCTTTGGCqRT-PCR for nosZ gene
Qmg2046-FGCTCCATACCCAATGACGCqRT-PCR for mg2046 gene
Qmg2046-RTGTCCACATCCTCGCCCqRT-PCR for mg2046 gene
Qmgfnr-FGAGTTGAACCACGACGAAATCAqRT-PCR for mgfnr gene
Qmgfnr-RCGAACATCTCGCCCGAAAqRT-PCR for mgfnr gene
mgfnrSF-EcoRICGGAATTCACCCTGACCGTGGGCAAGCCGGAAAmplification upstream of mgfnr
mgfnrSR-SacICGAGCTCACCTTGTGATCGTCGTAATCCAmplification upstream of mgfnr
mgfnrR-SacIGCTGTTGTTCTTCCTGCT Confirmation of mgfnr mutant
mgfnrF-SacITCCACCGAAATGAAACCGConfirmation of mgfnr mutant
mgfnrXF-SacICGAGCTCTACCCAGTTGAAGCGTGAAGAmplification downstream of mgfnr
mgfnrXR-XbaIGCTCTAGAGAAATCGGAAAACAGCCCCAAmplification downstream of mgfnr
Pmg2046-FGGAATTC ATGACGACGATGATCCAExpression of mg2046 protein
Pmg2046-RCCTCGAG TTAAACGTTCTCCCATCExpression of mg2046 protein
Pmgfnr-FCCGGAATTCGTGATCCCCATGCCGCCExpression of mgfnr protein
Pmgfnr-RCCGCTCGAGCTAATGCGCCCCGCCGCExpression of mgfnr protein
Erpoc-FTGAAGGAAGCCAAGGACCTEMSA for rpoc gene promoter
Erpoc-RCGAGGGACGG GTCAAATCCCEMSA for rpoc gene promoter
EnapF-FCGGCGGTCAAGAAGATGA EMSA for nap operon
EnapF-RGAGTGCGCCCGAACAAGGEMSA for nap operon
EnirT-FAAGCAGCAGGGCGTTCCT EMSA for nir operon
EnirT-RAGTATTTTCATTTTGGACAEMSA for nir operon
EnorC-FAACCGATCTCATCGGCGAA EMSA for nor operon
EnorC-RTACCGCCATAAAAGATATTEMSA for nor operon
EnosZ-FAGACGTCGGGGCAGAAGGT EMSA for nos operon
EnosZ-RAGCGCGCCAAAGGACACCGTEMSA for nos operon
Emg2046-FTGTTGGGCGAAATCCTCGT EMSA for mg2046 gene promoter
Emg2046-RGGCCAGGATG TCCACATCCTEMSA for mg2046 gene promoter
Emgfnr-FTGGCTGAAATCTGCGAGGTT EMSA for mgfnr gene promoter
Emgfnr-RTCACGGGCGA CCTTGTGATEMSA for mgfnr gene promoter
Table 2. Strains used in this study.
Strain or PlasmidDescriptionSource or Reference
E. coli DH5αendA1 hsdR17 [r-m+] supE44 thi-1 recA1 gyrA [NalR] relA relA1 Δ[lacZYA-argF] U169 deoR [Ø80Δ (LacZ) M15]Novagen
E. coli DH5α-mgfnrSDH5α containing pMD18-T-mgfnrS, AmprThis study
E. coli DH5α-mgfnrXDH5α containing pMD18-T-mgfnrX, AmprThis study
E. coli S17-1Thi endA recA hsdR with RP4-2-Tc::Mu-Km::Tn7 integrated in chromosome; Smr, TraNovagen
E. coli S17-1-ΔmgfnrS17-1 containing pUX-19-mgfnrS-Gm-mgfnrX, Kmr, GmrThis study
E. coli BL21 (DE3)F- ompT hdSB (rB mB) gal dcm (DE3), general purpose expression hostNovagen
E. coli BL21-Pmg2046BL21 containing pET28a (+)-Pmg2046, KmrThis study
E. coli BL21-PmgfnrBL21 containing pET28a (+)-Pmgfnr, KmrThis study
MSR-1 WTWT M. gryphiswaldense, NxrDSM 6361
MSR-1 Δmg2046mg2046-deficient mutant, Nxr, GmrThis study
MSR-1 Δmgfnrmg2046-deficient mutant, Nxr, GmrThis study
Publisher’s Note: MDPI stays neutral with regard to jurisdictional claims in published maps and institutional affiliations.

