1. Introduction
Metallic nanoparticles have been used in spectroscopy, biomedicine and catalysis due to their size-dependent, electric, magnetic and optical properties [
1,
2]. Various methods have been employed for the synthesis of AgNPs, such as chemical reduction [
3], electrochemical reduction [
4] and bio-reduction methods [
5,
6], and they have been fabricated in biofilm with silver nanoparticles [
7], while ɣ-irradiation, UV-irradiation [
8] and the sol–gel method all have been observed to generate different sizes of AgNPs. Additionally, highly stable AgNPs are used as colorimetric sensors [
9].
A newly introduced wetted chemical technique for processing colloidal nanoparticles with higher-level shape, size and phase consistency depends upon the capping of the surfaces of the nanoparticles by organic surfactants to avoid aggregations and stabilize the dispersion in the solution. Varieties of the stabilizers, such as organic surfactants, polymers, dendrimers and ligands, have been employed between the structured nanomaterials in which van der Waals interactions have been overcome, resulting in monodispersed AgNPs, which otherwise could cause agglomeration. In order to gain long-term stability, surfactants are used by researchers as stabilizer or templates in synthesis for bringing down surface energy, controlling the growth and shape of the nanoparticles and acting against aggregations. In this research, tartaric acid has been used as a capping agent for the production of negatively charged AgNPs, which are stable and remain dispersed for over a month [
10,
11].
Another challenge in the current study is characterizing and understanding the adsorptions and the structural configurations of the capped agent on the surfaces of the AgNPs; this is essential for predicting descriptions of the nanoparticles’ stability.
Different characterization methods have been adopted in this study for obtaining better configurations and images of the capped tartaric acid, while systematic exploration of AgNPs/TA stability in varying pH conditions demonstrates wide applications in the area of nano-scaled environmental processes and materials. Thus, the molecular arrangement has been discussed to identify the thickness of tartrate as a capping layer; secondly, more attention is paid to interactions between tartaric acid molecules and Ag-clustered surfaces, and so the structures of the surfactant capped AgNPs, based on the refined capping structures, are successfully established.
Most bacteria form and grow in the form of biofilms, and this makes it difficult for antibiotics to penetrate and produce their actions. These newly synthesized nanoparticles were then evaluated for their altered biological and antioxidant activity, assessing whether alterations were due to the change in their particle size and shape alone, or whether they were acting in synergism with some members of fluoroquinolone and macrolide class of antibiotics, in order to combat the resistance developed against the antibiotics by the organisms [
12,
13]. Reportedly, changes in the physical attributes of particles will also contribute to the change in the biological response of other drugs [
14], as they can facilitate the targeted delivery or penetration of the antibiotics.
In this report, we had successfully executed the aqueous phased synthesis of monodispersed tartaric acids capped with silver nanoparticles of various sizes through one-pot chemical reductions synthesis at room temperature with low metal concentrations within a shorter period and without maintenance of inert atmospheres. Beside these, significant advantages are that the silver nanoparticles prepared via chemical reduction synthesis persist in a stable form for about ninety days without agglomerations, and they possess good antioxidant and antimicrobial activity alone and in synergism with selected antibiotics, proving that they can have a pivotal role in targeted drug delivery. Their role as sole antioxidants might contribute to their uses against the oxidative stress-prone diseases, such as CVS, diabetes and cancer, alone or as part of a targeted drug delivery system.
2. Materials and Methods
Silver nitrate, fluoroquinolones, macrolides and all the reagents and solvents used were of analytical grade and purchased form Sigma-Aldrich, Darmstadt, Germany.
2.1. Synthesis of Capped AgNPs/TA
In a 10 mL reaction flask, 1.00 mL (4 mM trisodium citrate) was taken and heated until it reached 70 °C; then, a mixture of 7 mL tartaric acid and 0.50 mL of 0.10 M NaOH was added dropwise under vigorous stirring with a magnetic stirrer. After 10 min, 1 mL of 10% silver nitrate solution was added dropwise to the reaction flask. The reaction mixture was stirred for about 15 min until the solution changed its color from being colorless to bright yellow. The AgNPs/TA solution was kept in the dark at 4 °C.
2.2. Characterization of AgNPs
Using a UV–Vis spectro photometer (Model # UV -1800 Parma Requirements of Shimadzu in Tokyo, Japan), we examined pH-dependent AgNPs/TA synthesis. SEM analysis (Model # JSM 6380A, JEOL Ltd., Tokyo, Japan) was used to examine the shape and size of the produced and stabilized AgNPs/TA. Fourier transform infrared spectroscopy (FTIR) was used to look for the functional groups of AgNPs/TA (Shimadzu, Tokyo, Japan, IR-Prestige-21). Using a Zetasizer (Nano ZS, Malvern Instruments, Malvern, UK) fitted with a red laser, the size distribution (DLS) and zeta potential measurement of AgNPs/TA were examined (633 nm).
2.3. Ultraviolet–Visible Absorption Spectroscopy (UV–Vis)
UV–Vis spectrophotometer (Model # UV-1800 Parma Spec., Shimadzu, Tokyo, Japan) was used to measure photosensitive attributes. A color transition from clear to light brown was seen, and results were recorded after adding the dicarboxylic acid as the capping agent at a given series of volumes. Various reaction combinations were produced with different molar concentrations of AgNO3, tartaric acid, time of reaction and pH.
2.4. Fourier Transform Infrared Spectroscopy (FTIR)
The optimum combination of molarity, pH and duration for trisodium citrate-mediated and TA-capped AgNPs was chosen after the standardization of the reaction parameters, and the final product was dried in a 60 °C vacuum furnace to produce the fine powder of AgNPs. After this was performed, the final product was dried. The FTIR method was used to describe the acquired powder, revealing the adsorption of functional groups on the surface of AgNPs. For functional groups, FTIR analysis was conducted using a Shimadzu IR-Prestige-21. The operating spectral range was 400–4000 cm−1.
2.5. Scanning Electron Microscopy (SEM) of AgNPs
SEM analysis was used to evaluate the morphologies of AgNPs/TA and the size distribution of particle aggregates was measured using a JEOL Ltd., Tokyo, Japan, SEM Model: JSM 6380A. For morphological examination and to quantify the diameter of particle aggregates, the fine powder of AgNPs was attached to a double-sided carbon tape on aluminum stubs and inspected via SEM at a 15 kV accelerating voltage.
2.6. Dynamic Light Scattering and Zeta Potential Analysis of AgNPs
The hydrodynamic size of the produced AgNPs in solution was measured to verify their aggregation behavior. The hydrodynamic size of nanoparticles in solution is important for their biological processes. It also gives data on a nanoparticle’s toxicological profile. To evaluate the hydrodynamic size and net positive or negative potential, DLS and zeta potential parameters were measured in double-distilled water at a concentration of 50 µg/mL of AgNPs.
2.7. Microbiological Assay of AgNPs Alone and in Synergism with Antibiotics
The disc method for assessing susceptibility was used to test the antibacterial properties of nanoparticles alone and in combination with different antibiotics, developed by Bauer et al. 2009 [
15], against selected organisms. For in vitro studies,
Escherichia coli ATCC 11775
T,
Klesbellia pneumoniae ATCC 43816,
Escherichia.Coli ATCC 8739,
Salmonella typhi ATCC 2881,
Pseudomonas aeruginosa 9353
and Staphylococus aureus ATCC 8868 isolates were gifted by Dr. Essa Laboratory and Diagnostics (Pvt.) Ltd. Nanoparticles were purified via the centrifugation method [
16] and then loaded onto discs, placed on the Petri dishes containing sterilized Muller–Hinton agars with the inoculums of bacteria. Nanoparticles, antibiotics (with ofloxacin and azithromycin as positive controls), silver nitrate and distilled water paper discs (as a negative control) were prepared through soaking in 100 ppm solutions of the drugs, followed by drying. The dish was then incubated at 36 °C ± 1 °C for up to twenty-four hours. For each concentration, three replicate experiments were conducted against each bacterial strain. Using Digimatic calipers, the zones of inhibition were precisely measured (Mitutoyo Rochester, New York, NY, USA). Here, 0.50 McFarland standard (1.0 × 10
8 CFU per mL) bacterial strains were used for the study [
17,
18,
19].
2.8. Antioxidant Activity and IC50 Calculations
The antioxidant activity or radical scavenging activity of the nanoparticles were determined by using the DPPH assay method [
20,
21]. In this method, 3 mL of a 0.1 molar of DPPH (ethanol) was added to 2 mL of five different concentrations of nanoparticles. Then, 100–500 µg/mL. solutions were allowed to stand for 30 min in the dark to prevent the effect of light. The absorbance of the standard ascorbic acid (2:3), control DPPH (DPPH: Ethanol; 3:1) and samples were observed using a UV-Vis spectrophotometer at a wavelength of 517 nm, in a triplicate manner. Results were analyzed as a percentage of DPPH inhibition activity using the formula:
where A
1 is the absorbance of the standard and A
2 is the absorbance of sample solution of a variable concentration.
The IC
50 of each concentration was as calculated via the interpolation method, where m (slope) and b (intercept) values were determined by plotting a linear graph. These values were then put in the formula:
where sY is the concentration of the sample [
22].
3. Results
3.1. Ultraviolet–Visible Absorption Spectroscopy (UV–Vis)
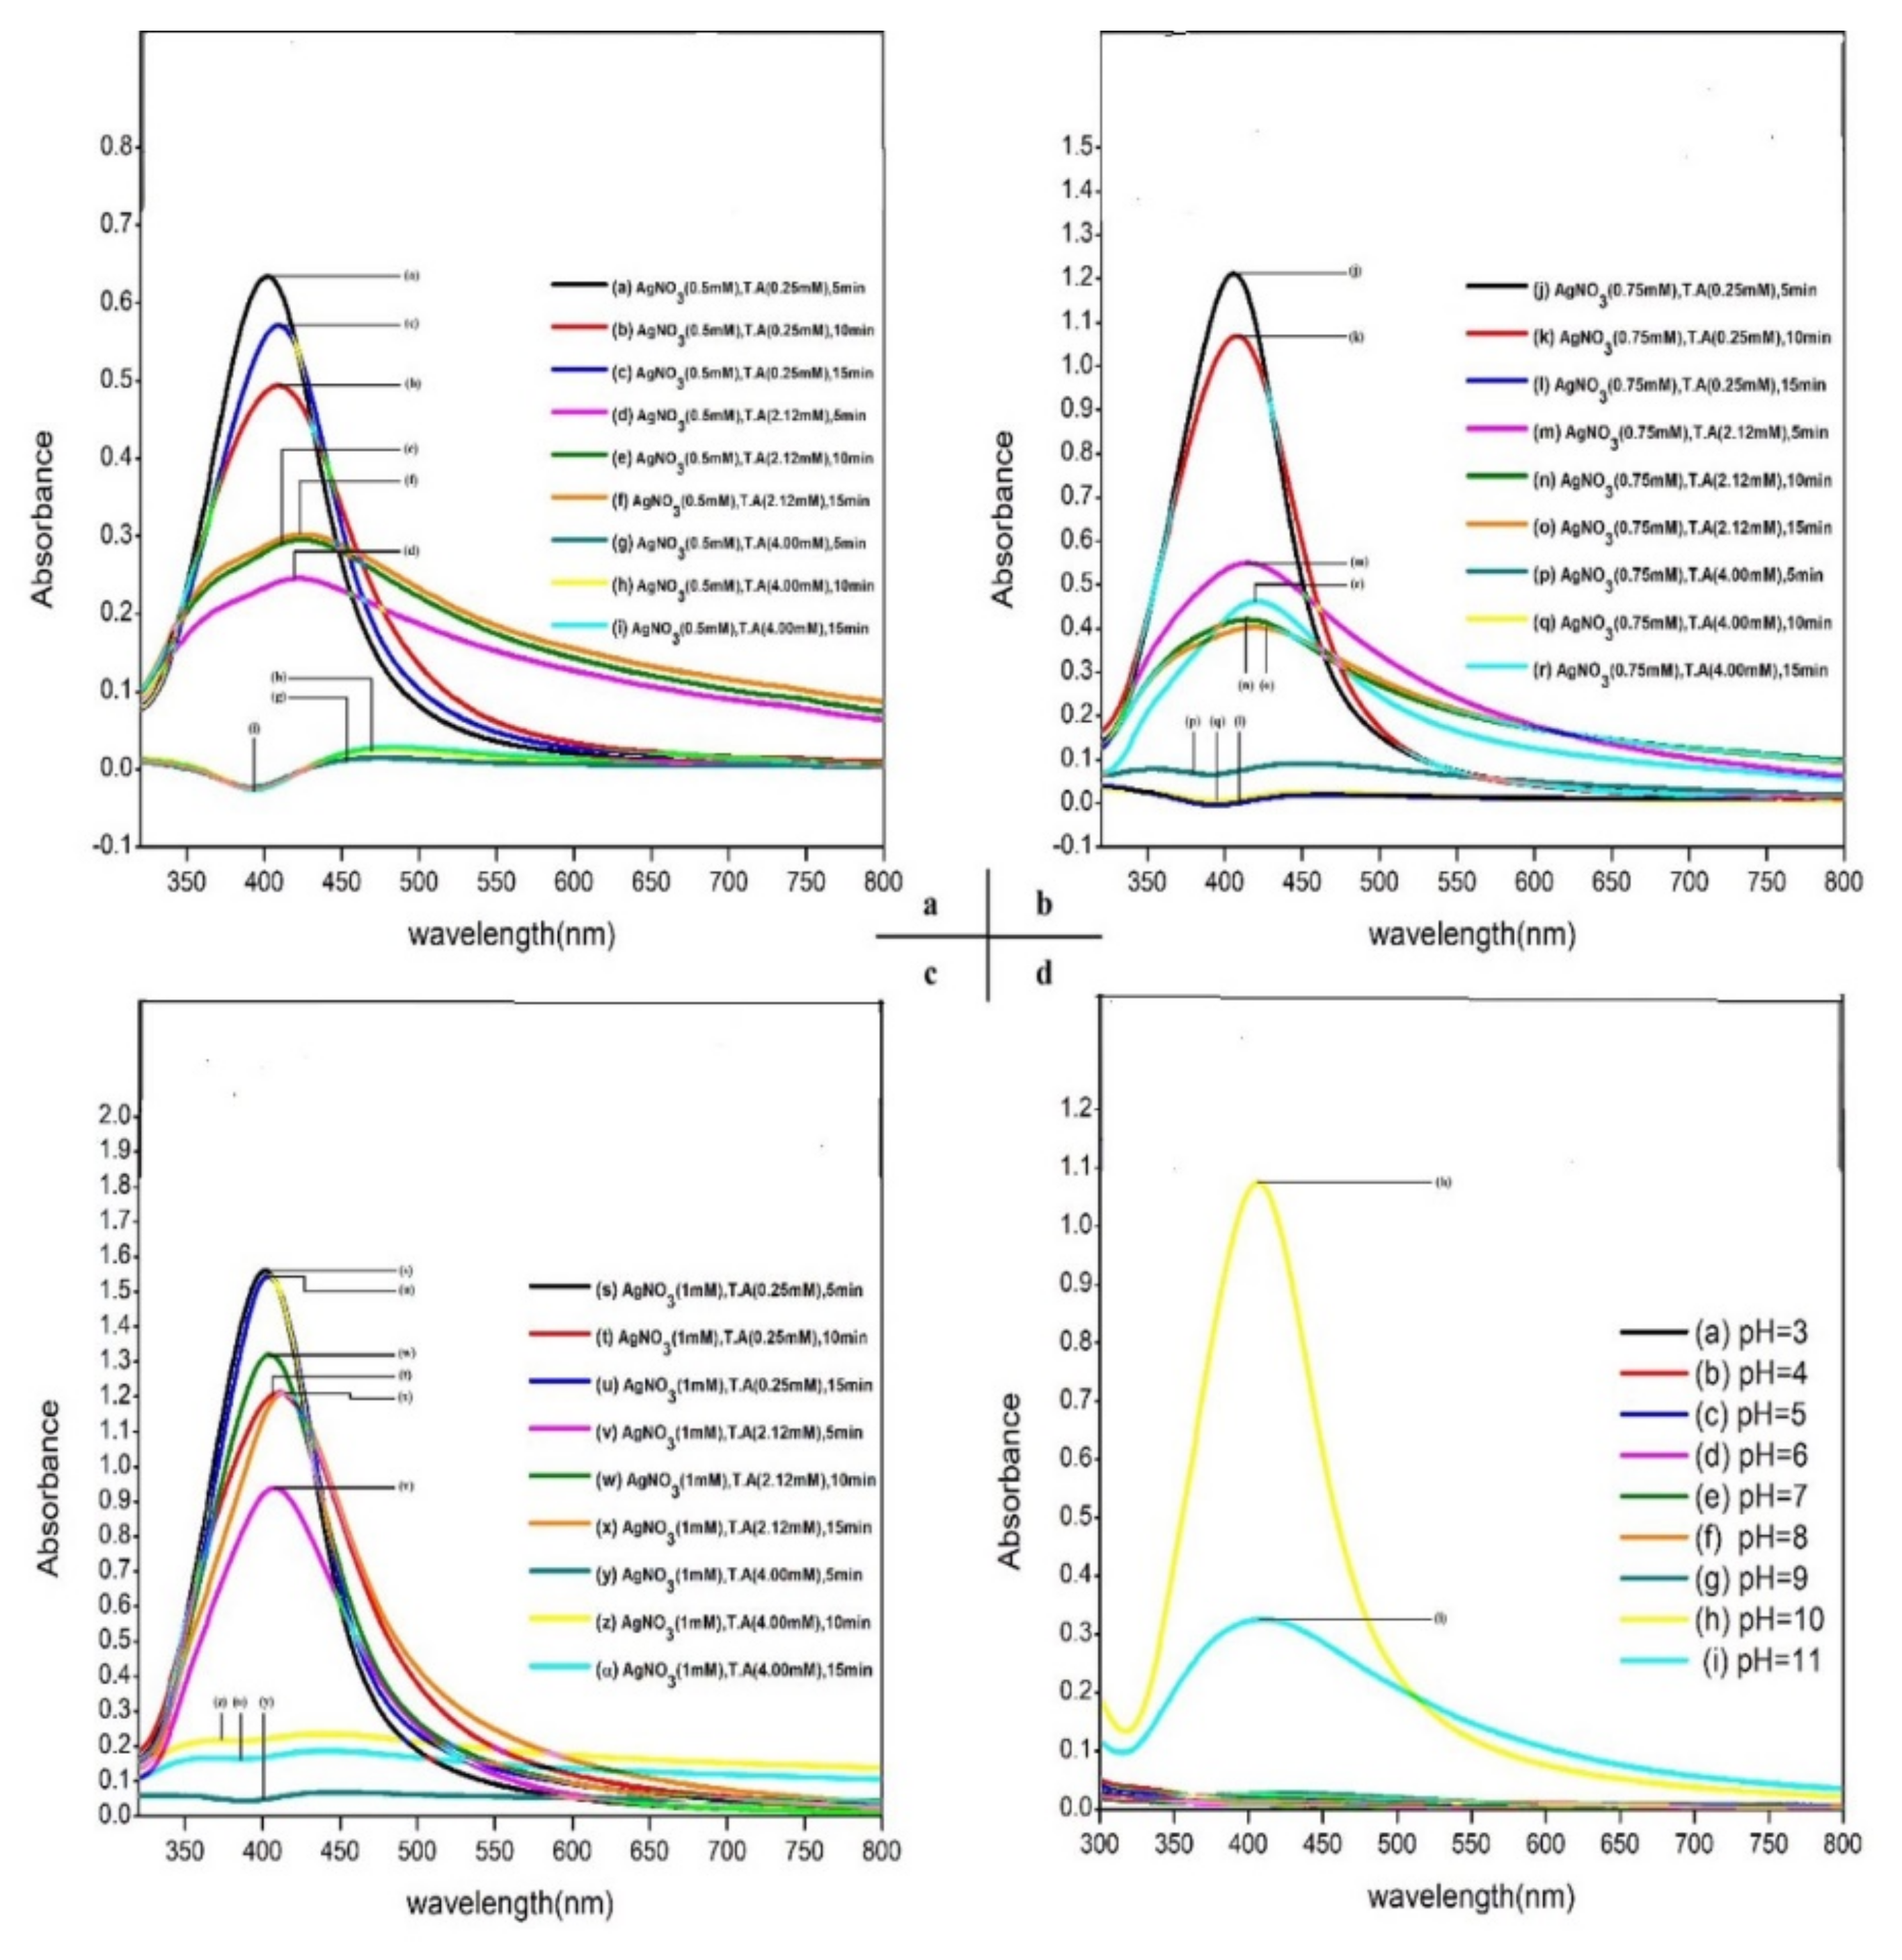
The formation of AgNPs/TA was confirmed by the visual observation as well as by the evaluation of the UV-visible spectrum at different pH levels. The color of the solution was a transition from colorless to yellowish brown with respect to pH, and this is an indication for the formation of AgNPs/TA. This color change was due to the excitation of surface plasmon vibrations in the metal NPs. At 406 nm with 1.07 a.u absorbance, the strong surface plasmon resonance (SPR) band was identified (
Figure 1). This was also indication of the reduction of Ag
+ into Ag
0, as well as for the formation of AgNPs/TA [
23]. Furthermore, the intensity of the SPR band also progressively increased as a function of pH. Additionally, with the pH increases, the net charge on the capped AgNPs/TA changed from positive to negative, which resulted in extreme repulsion among the negatively charged particles. Furthermore, the spectrum reveals that the solution is free of aggregated particles.
During the study, it was also observed that tartaric acid (dibasic acid) here worked as a capping agent instead of as a reducing agent and prevented the aggregation of the silver nanoparticles [
24,
25]. This is evident from the clear solution obtained at a concentration of 1 milli molar at a wavelength of 450 nm using only trisodium citrate and the appearance of a peak at 633 nm when applied in combination with tartaric acid, indicating a bathochromic shift.
3.2. Fourier Transform Infrared Spectroscopy (FTIR)
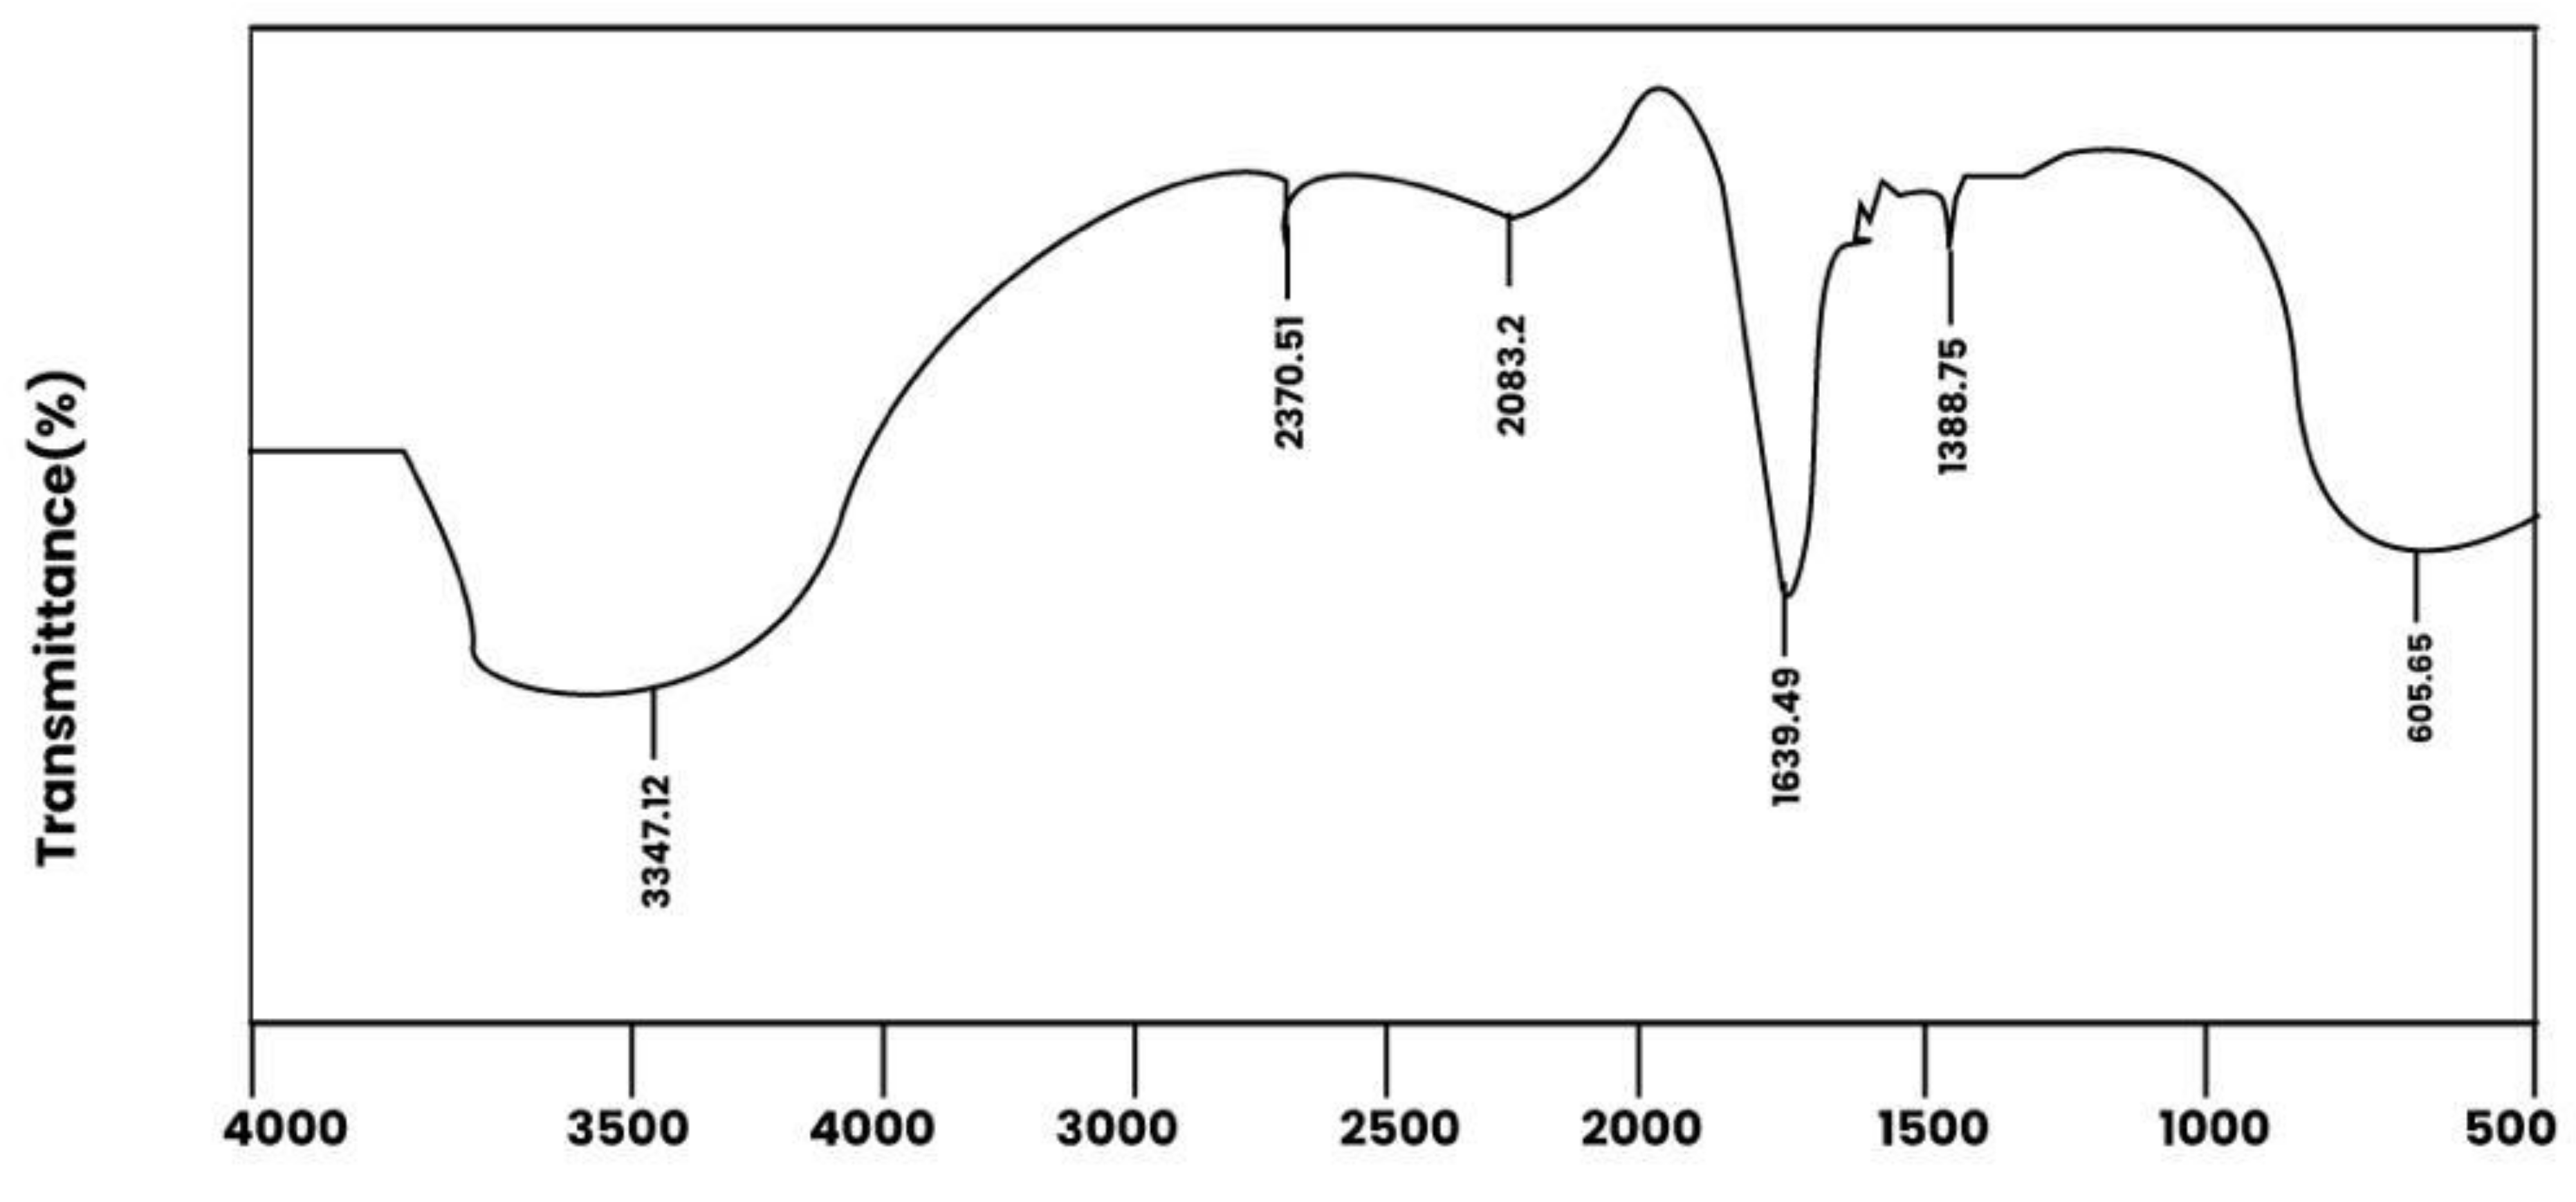
Here, we discuss the FTIR spectra of pure TA and AgNPs/TA (
Figure 2). The spectra show the presence of various types of bands at 3433, 2370, 1639, 1388 and 605.65 cm
−1. In the FTIR spectra, the first peak appeared at 3433 cm
−1, which was assigned into the hydroxyl group. During the oxidation process, few of the hydroxyl groups remained unreactive, and moisture was also absorbed on the highly reactive surfaces of the AgNPs. A carboxylic acid frequency range was observed in the range of 1700 to 1300 cm
−1. Given their unique signature, the hydroxyl groups have direct interactions with carbonyl groups, as shown by the formations of the stable hydrogen bonding structure. A peak appeared at 2370 cm
−1 belonging to the –CH stretching bands [
26]. The highly intense peaks were obtained at 1639 cm
−1 and 1388 cm
−1, which were attributed to the symmetrical stretching of CO and C–O
−, correspondingly, from the COOH group of the tartaric acids. The peak that appeared at 605.65 cm
−1 was due to the metal vibration (Ag-O). FTIR data confirm the role of tartaric acid as a capping agent within the formation of AgNPs. The spectrum of AgNPs /TA shows a decrease in signal intensities, and shifts in the bands were identified that reveal their differences to pure TA compounds. We see the binding of the TA group upon the surfaces of AgNPs because of chemisorptions of carboxylated ions. The role of COO
− in capped AgNPs/TA with regard to electrostatic attraction demonstrates the formation and stabilization of silver nanoparticles in an aqueous medium.
3.3. Scanning and Transmission Electron Microscopy
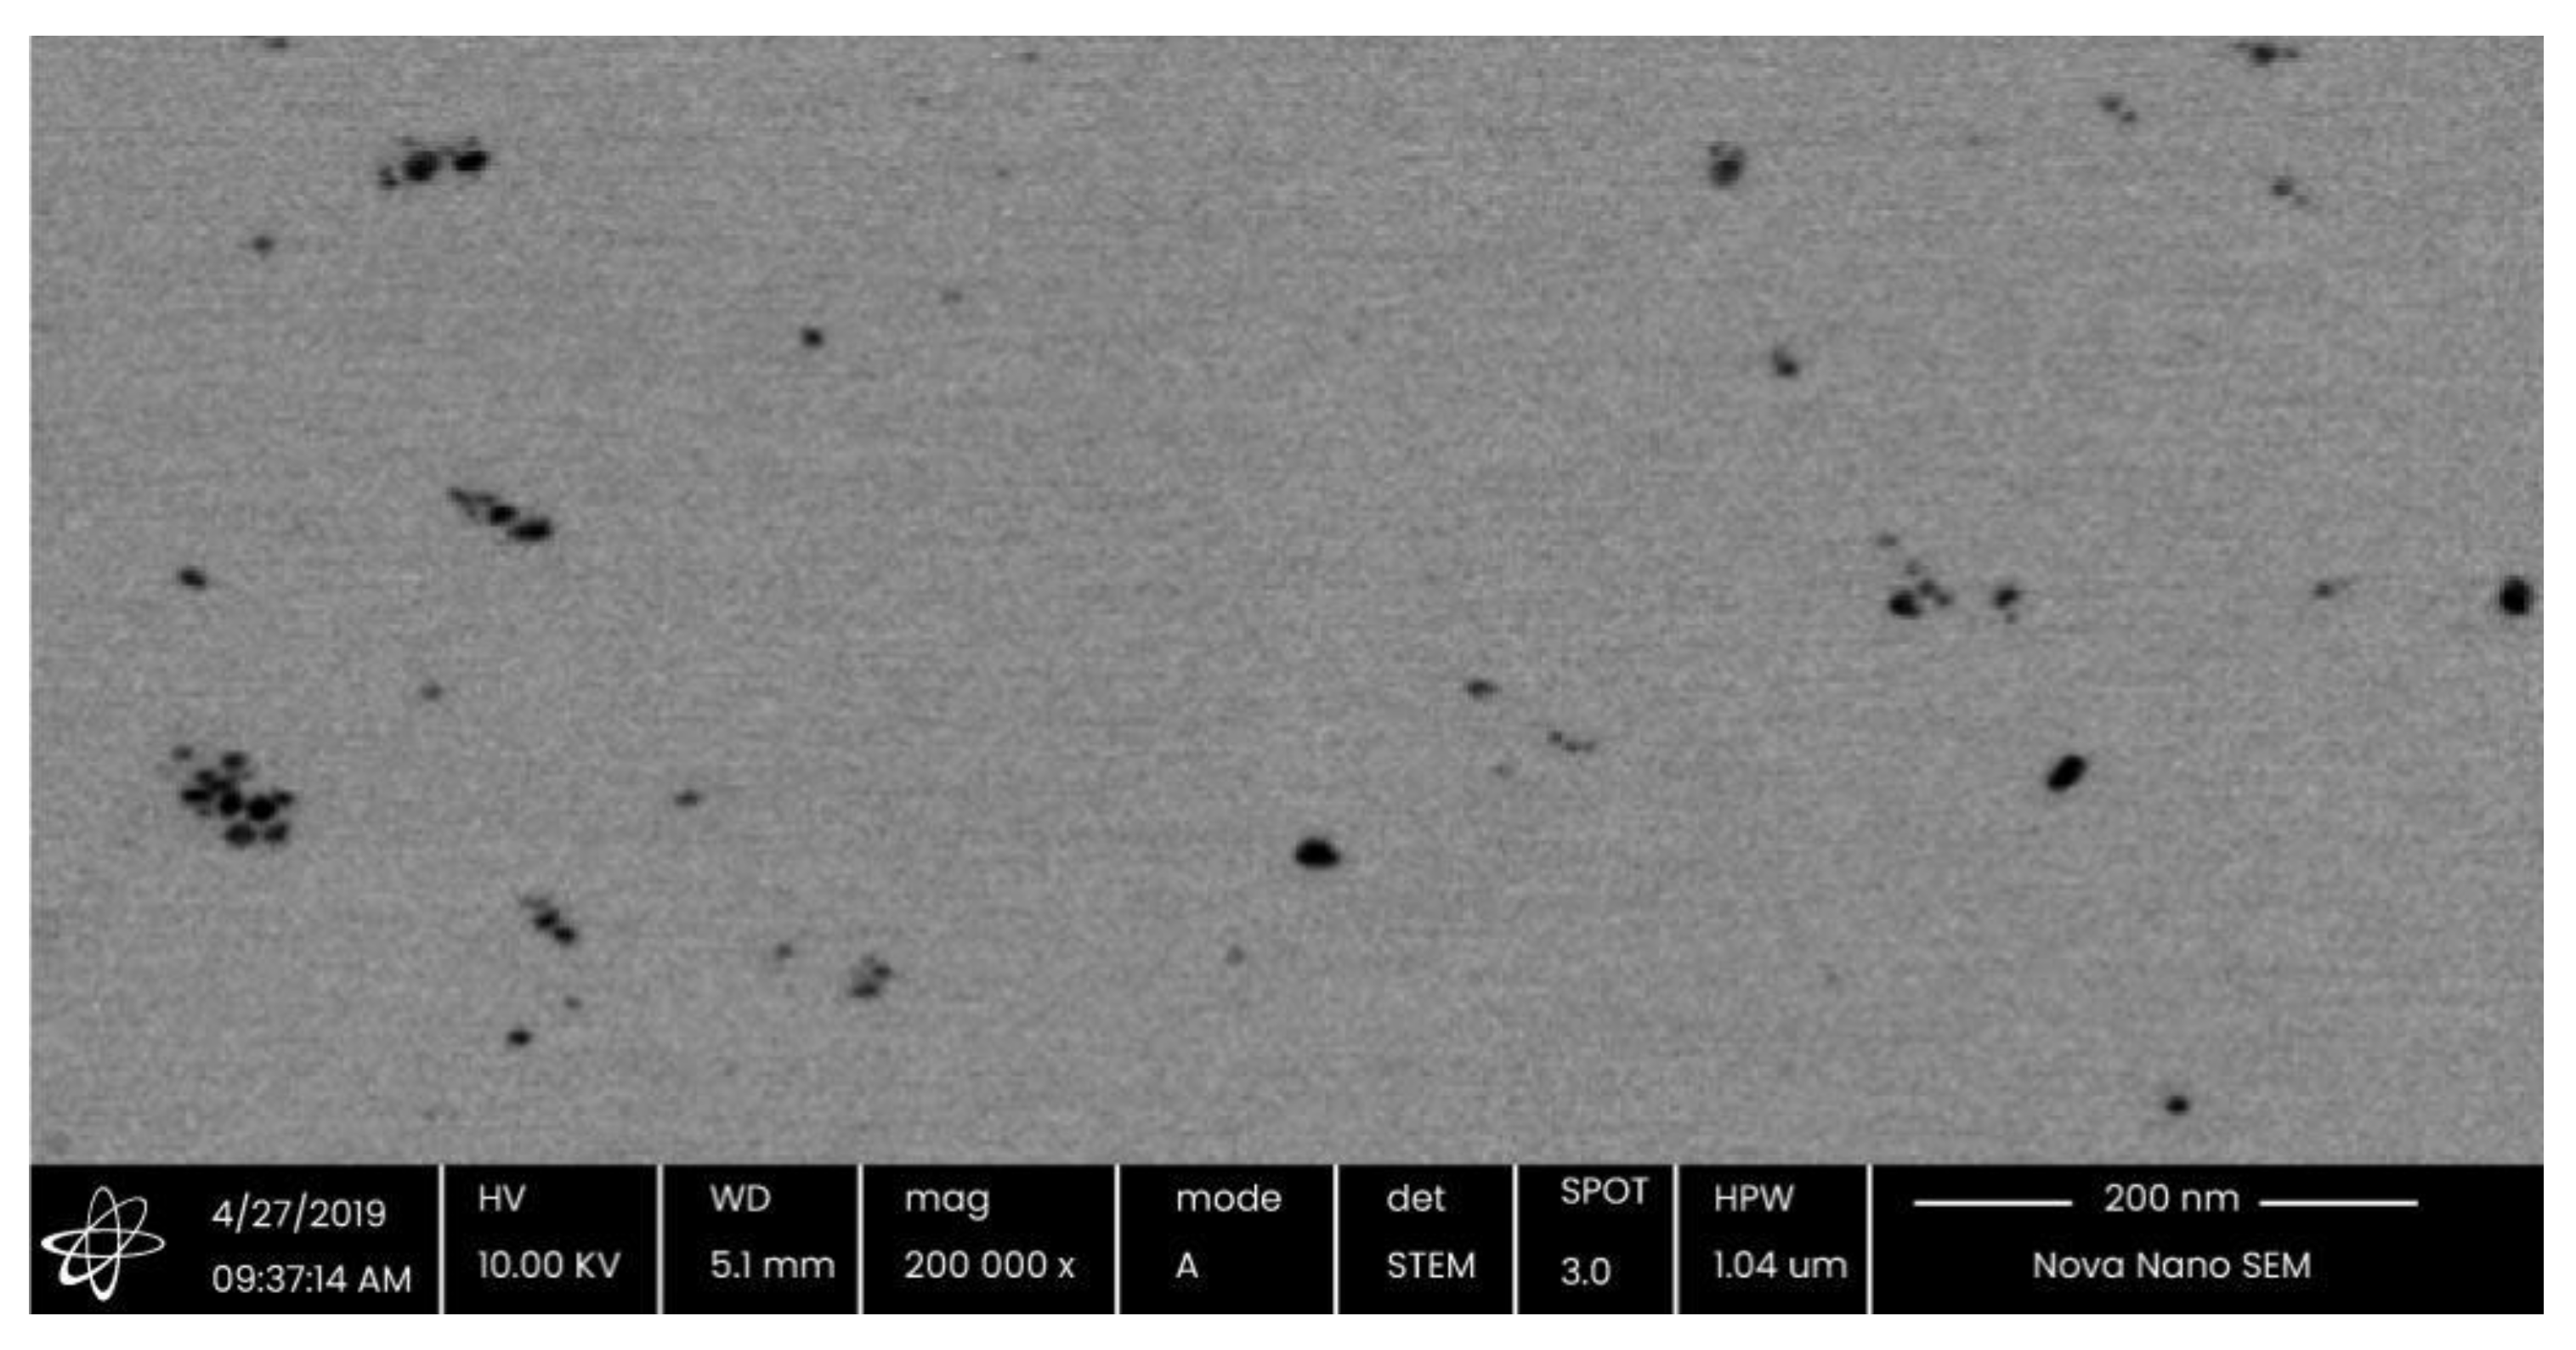
The SEM technique was used for visualizing the sizes and shapes of AgNPs/TA (
Figure 3). The image also shows that the particles were monodispersed and spherical in shape. Electrical repulsion among the silver nanoparticles was caused by the surrounding of the citrate and the COO
− of dicarboxylic acid, which would be the source of negative charge. The image confirmed that the optimizations of the experimental condition with regard to temperature, pH and concentrations of the Ag
+ ions were suitable for the production of monodispersed and uniformly shaped NPs.
3.4. Dynamic Light Scattering
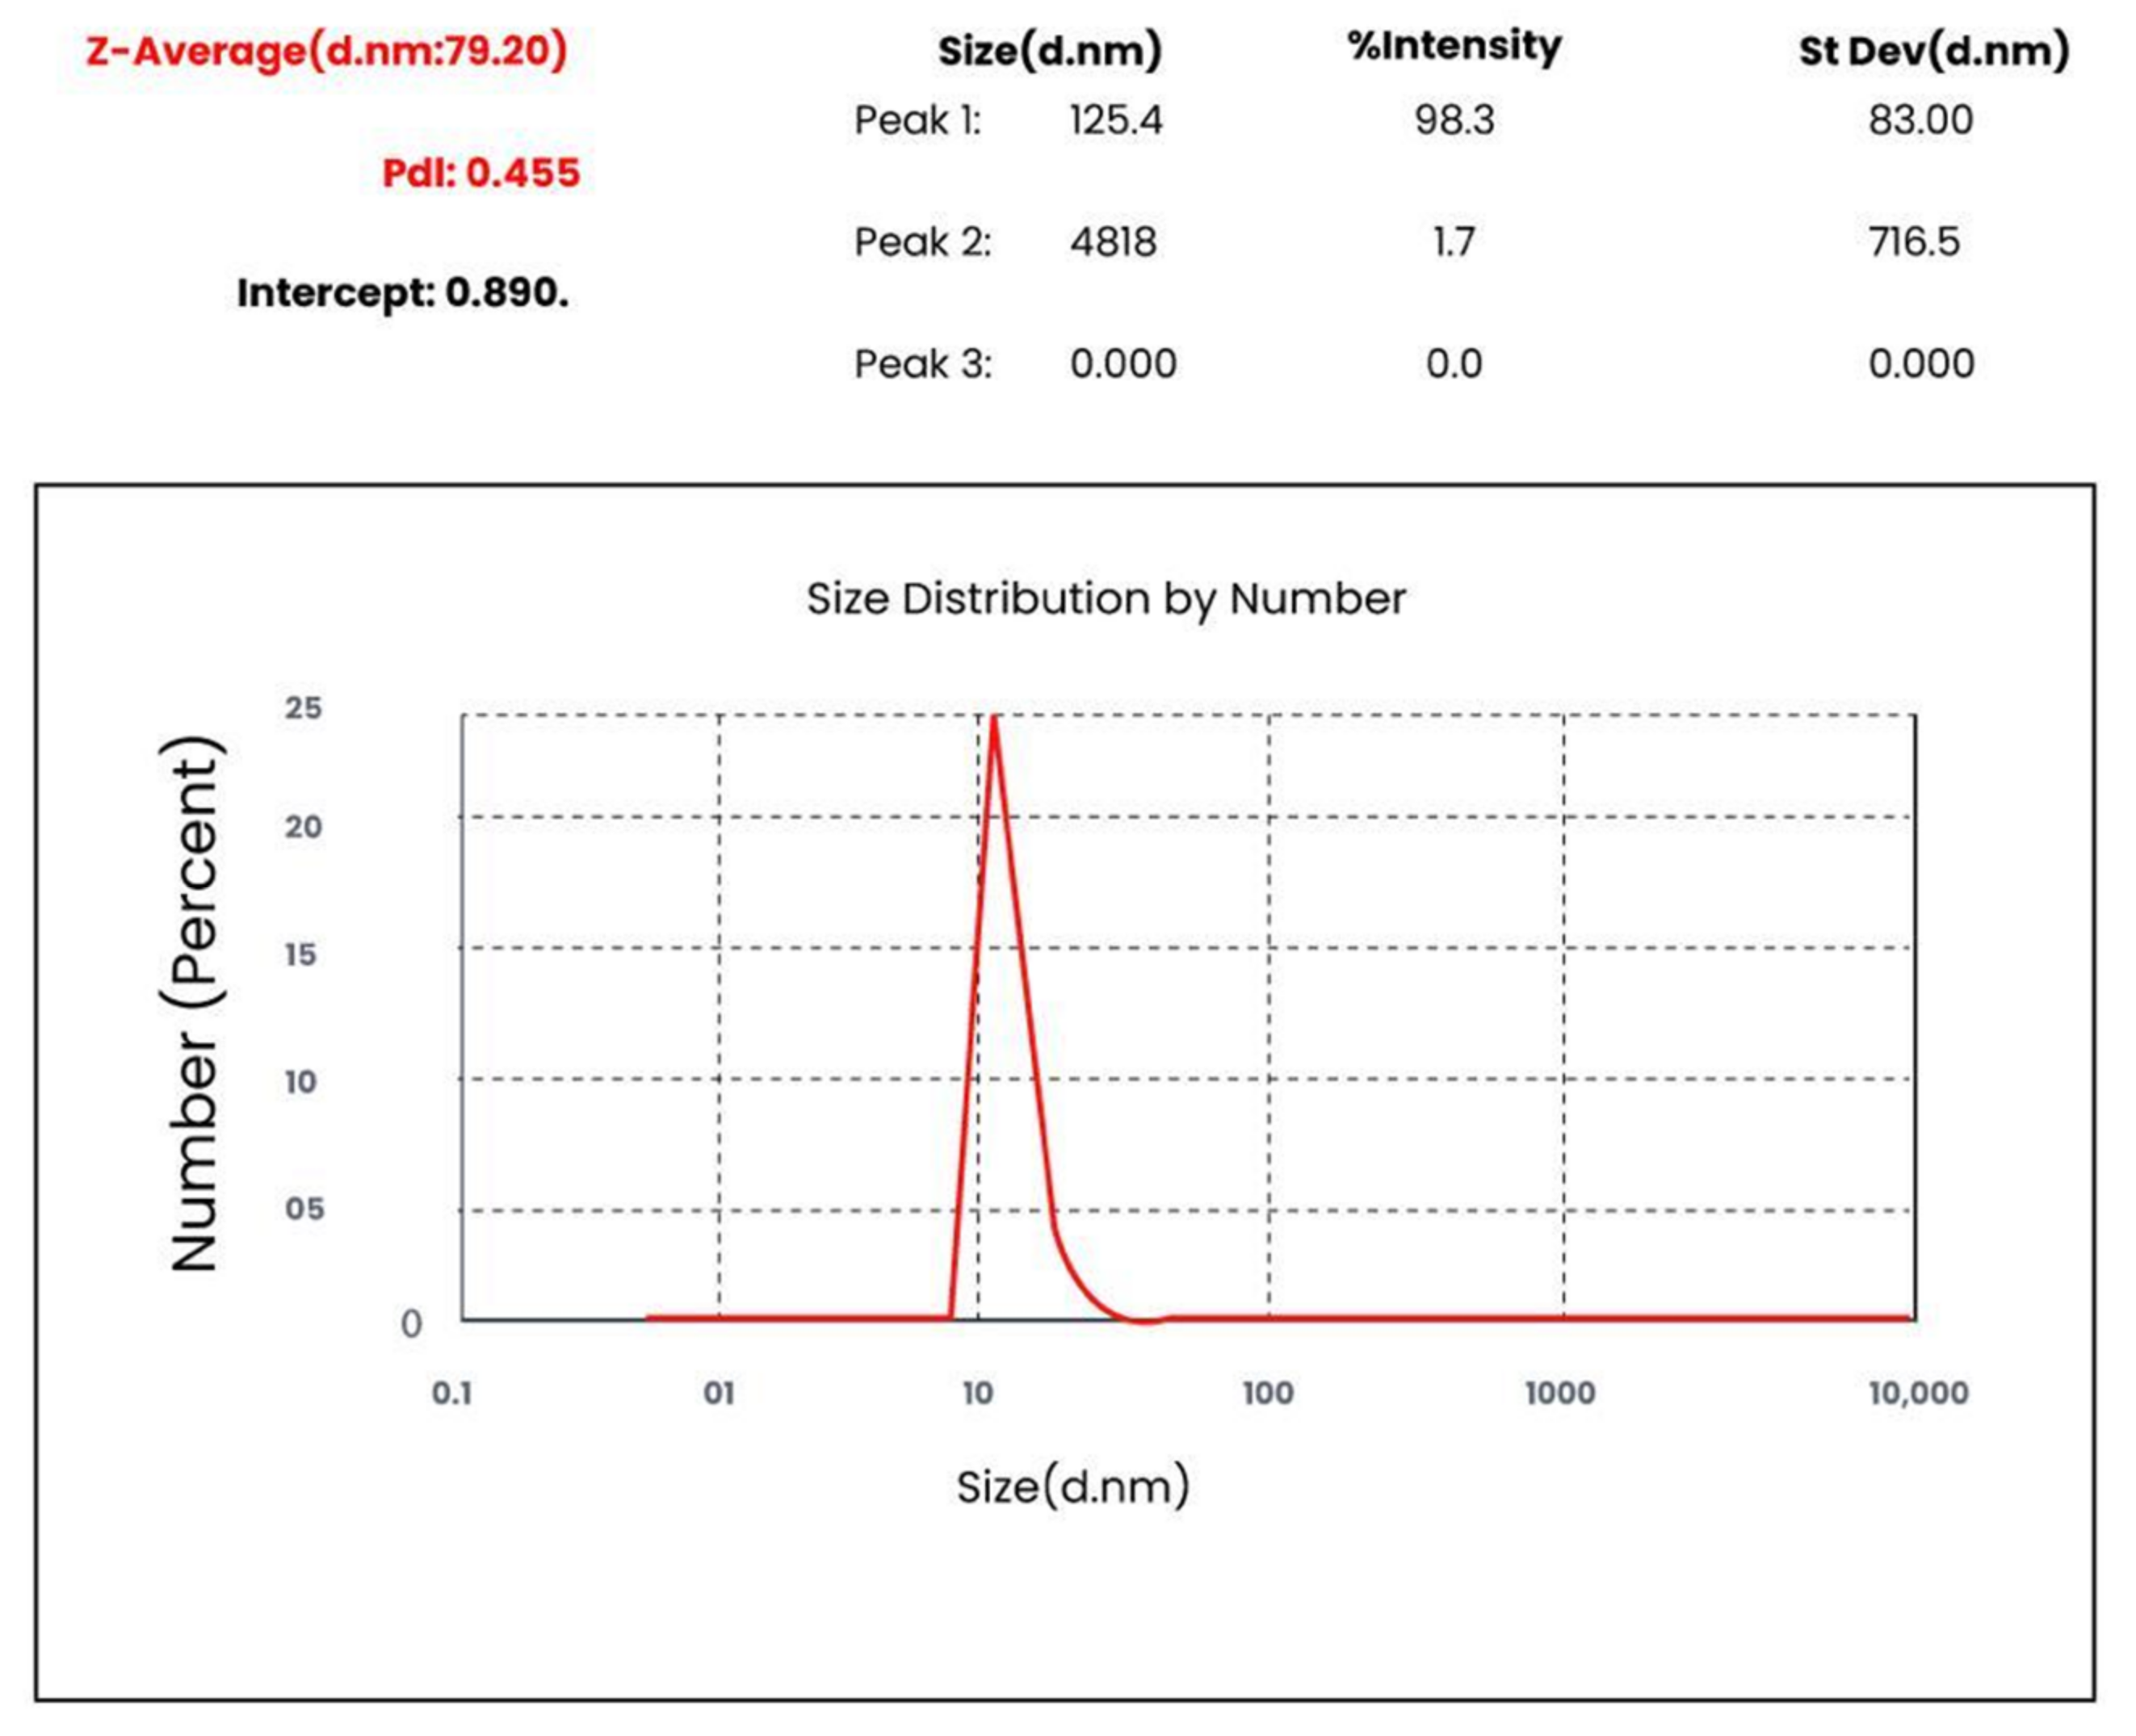
The DLS data demonstrate that the z-average size distribution of AgNPs/TA in the colloidal solution was found to be 79.20 nm. The average particle size peak 1 determined using dynamic light scattering (DLS) and was found to be 125.4 nm, whereas the PDI value for the AgNPs/TA was found to be 0.445 (
Figure 4). The PDI value indicates an increase in the broadness of non-spherical shapes of the dispersed particles. The values of PDI larger than 0.7 indicate a very broad size distribution of the sample. The PDI values < 0.7 indicate a monodispersed sample wherein all particles have the same size and shape, as found in the present study (0.445) [
26]. The presence of a single peak confirms that the particles are monodispersed. In addition, using a hard-sphere model, the z-average calculates the AgNPs’ hydrodynamic size. In reality, the NPs are encased in a thin layer of solvent molecules, and the DLS is used to determine the diameter of the solvated particles. It is expected that the measured z-average is greater than the AgNPs’ actual size. Broadly speaking, this research shows that the peak 1 size and PDI significance of capped AgNPs/TA increased with the addition of the capping agent.
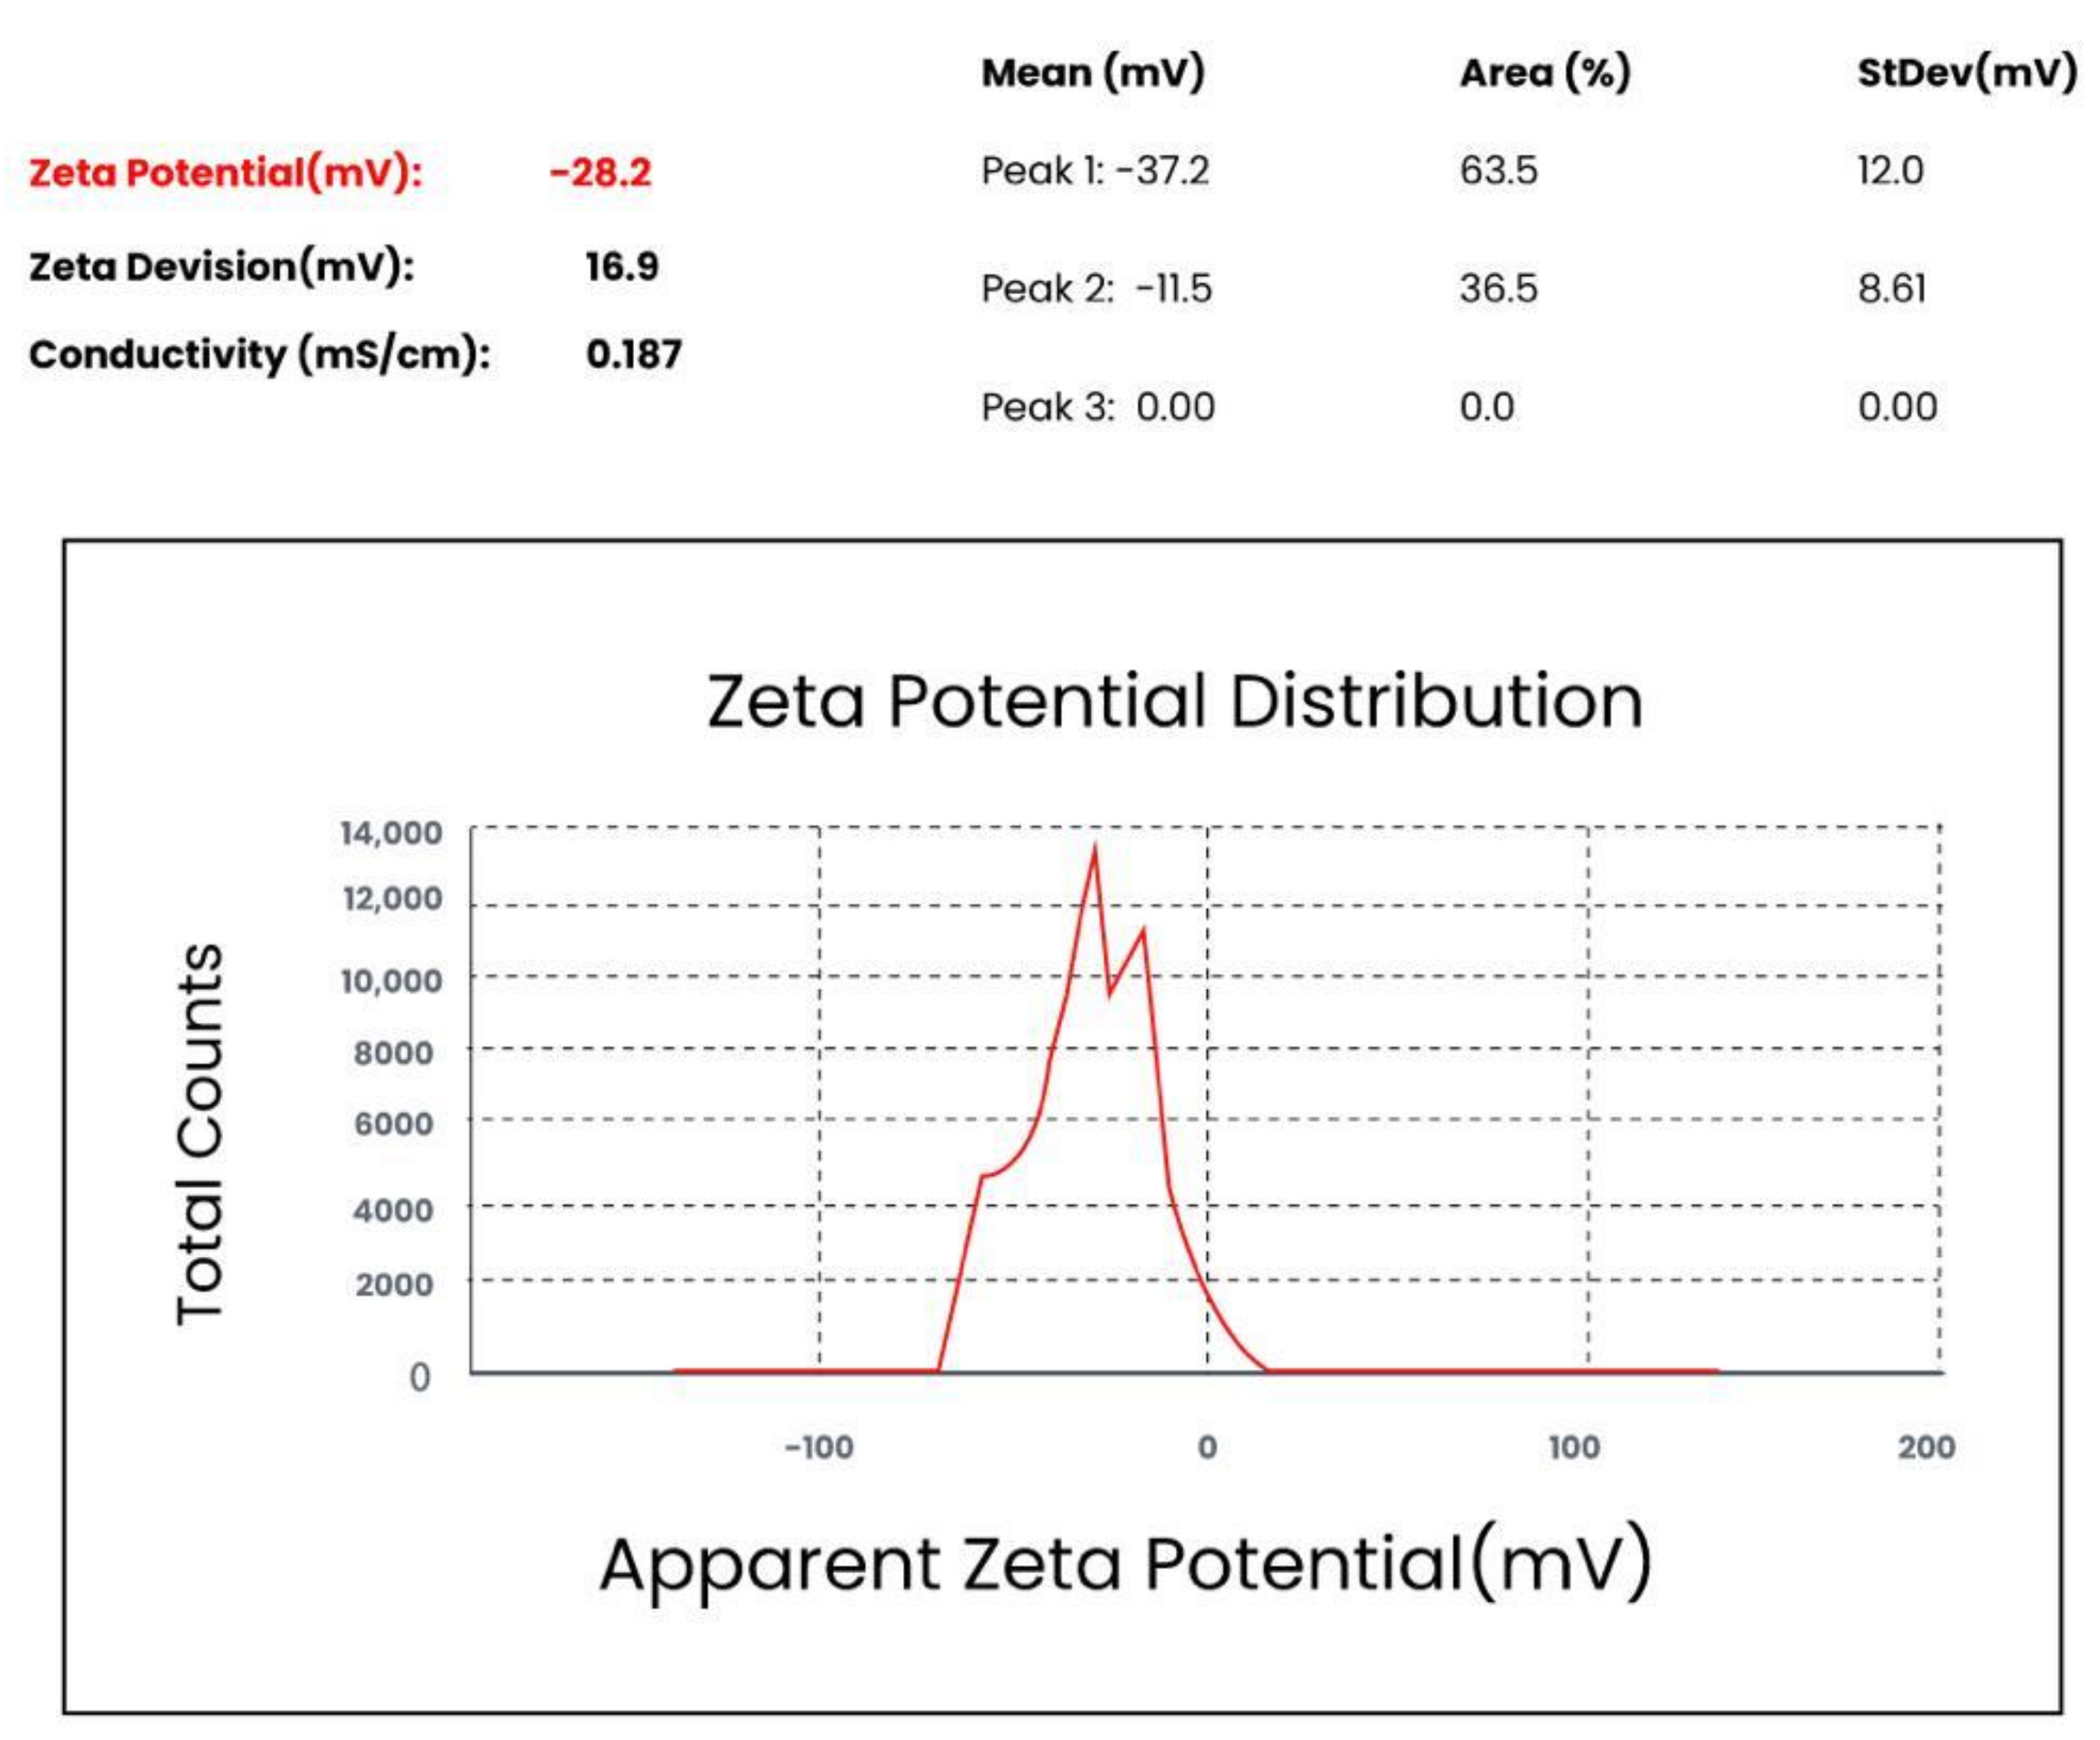
3.5. Zeta Potential
The observed zeta potential for the AgNPs/TA was found to be −28.2 mV (
Figure 5). Since the colloidal AgNPs hold a negative charge due to the adsorbed citrate and tartrate ions, a repulsive force operated along the particles and prevented aggregation. The intensity of these nanoparticles shows the relative intensity of the enticing interactions of the van der Waals forces versus the electrostatic repulsion on the particle surface of the dicarboxylic acid groups. These negatively charged AgNPs/TA could help to enhance the antimicrobial activity against the Gram-negative bacteria via metal depletion.
3.6. Synergistic Antibacterial Effect of AgNPs/TA
These newly synthesized nanoparticles were then evaluated for their antimicrobial activities alone and in synergism with the antibiotics used most commonly in infections caused by Gram-positive and Gram-negative organisms. The antibacterial activities of selected fluoroquinolones (ofloxacin, gemifloxacin, sparfloxacin and ciprofloxacin) and macrolides (erythromycin and azithromycin) classes of antibiotics were selected to study their synergistic effects in combination with AgNPs/TA against test strains of
E. coliT,
S. typhi,
S. aureus,
K. pneumoniae,
Pseudomonas aerogenosa and
E. coli [
27]. These two classes of antibiotics are most commonly prescribed for infections. The disc diffusion method was used and their mean zone of inhibition (mm) was determined in triplicate against organisms, as shown in
Table 1.
The percentage increase in comparison to the AgNPs alone and in combination has shown that the synergistic phenomenon is there, and that it has increased the antibiotic response specifically of the macrolide (azithromycin) against
K. pneumoniae. The active groups, such as amido and hydroxyl groups that comprise the antibiotics molecules, easily react with the large surface of the AgNPs via chelation, causing an increase in the synergistic effect of the AgNPs/TA bonded with antibiotics [
28].
Therefore, these capped silver nanoparticles can provide a better drug delivery system to overcome the development of microbial resistance, dose-dependent toxicities and side effects of the antibiotics.
3.7. Antioxidant Activity
The DPPH assay is the easiest, most convenient and most rapid test for the determination of the antioxidant characteristics of the compounds. A visible change in color from purple to yellow is indicative of the antioxidant activity. This can be further confirmed by the change in absorbance at a reported wavelength of 517 nm. Purified capped silver nanoparticles synthesized using tartaric acid possess mild to moderate free radical scavenging activity as the concentration increases. Ascorbic acid is used as the standard while the DPPH solution is the control (
Table 2).
The antioxidant property is indicative of its use and application in various disease conditions, such as diabetes, cardiovascular disease, inflammation and cancer, alone or in synergism, that involve scavenging free radicals. Therefore, we can say that these capped silver nanoparticles possess antioxidant activities which indicate that further studies should be conducted concerning their use in various disease related to oxidative stress.
4. Conclusions
We have shown, by using a UV-Vis spectrophotometer and conducting FTIR, SEM, DLS and zeta potential analyses, the formation of synthesized and capped silver nanoparticles with trisodium citrate as a reducing agent and tartaric acid as a capping agent. The optimization of the procedure variables is essential in order to achieve the optimum conditions of silver nanoparticle formation. The operating factors involved in this procedure were silver ion concentration, the concentration of tartaric acid, the time of synthesis reaction and temperature. Silver nanoparticles synthesized at optimum conditions exhibit surface plasmon resonance spectra at 406 nm and at 1.07 a.u absorbance, with a brownish-yellow color. Representative FTIR spectra of synthesized and capped silver nanoparticles revealed bands at about 1639 cm−1 and 1388 cm−1, which confirms the bonding between silver nanoparticles and the -OH/COO- groups of the tartaric acids. The SEM image of synthesized and capped AgNPs showed that they were well dispersed and clearly showed that the product comprises extremely fine and spherically shaped particles with sizes ranging between 30 and 85 nm. The z-average size of the synthesized and capped silver nanoparticles was 79.20 nm, as shown by the DLS. The average particle size peak 1 was determined using dynamic light scattering (DLS) and was found to be 125.4 nm, whereas the PDI value of AgNPs/TA was found to be 0.445. The polydispersity value signifies the good quality of the synthesized AgNPs. In the present work, the observed zeta potential for the AgNPs/TA was found to be −26.2 mV. The zeta potential of synthesized NPs, capped by tartaric acid, confirmed that the particles accumulate negative charge. These values were found to fall to the negative side, which showed the efficiency of the capping materials in stabilizing the nanoparticles by providing intensive negative charges that keep all the particles away from each other. The tartaric acid used as capping agent is used for isolating NPs from each other, and the nearly monodispersed NPs appear to be transparently colored solutions with no precipitate formation. These nanoparticles also possess good synergistic antimicrobial activity in combination with a macrolide antibiotic (azithromycin) against K. pneumoniae, along with good antioxidant activity. Therefore, these synthesized nanoparticles can be further studied for their antidiabetic, anti-inflammatory and anticancer activity, along with their role as part of a drug delivery system, to overcome the development of microbial drug resistance.
Author Contributions
Conceptualization, I.B., Z.H. and S.S.; Data curation, I.B., Z.H. and S.S.; Formal analysis, I.B., Z.H. and S.S.; Investigation, I.B., S.S. and F.A.; Methodology, I.B. and S.S.; Project administration, F.A. and S.A.B., Resources, M.H., and T.Q.; Supervision, Z.H. and S.S.; Validation, Z.H.; Visualization, I.B., S.S. and T.Q.; Writing—original draft, I.B. and S.S.; Writing—review and editing, I.B., S.S. and F.A. All authors have read and agreed to the published version of the manuscript.
Funding
This research was funded by the Researchers Supporting Project, number (RSP-2021/364), King Saud University, Riyadh, Saudi Arabia.
Informed Consent Statement
Not applicable.
Data Availability Statement
Not applicable.
Conflicts of Interest
All authors declare no conflict of interest.
References
- Sathishkumar, P.; Preethi, J.; Vijayan, R.; Yusoff, A.R.M.; Ameen, F.; Suresh, S.; Balagurunathan, R.; Palvannan, T. Anti-acne, anti-dandruff and anti-breast cancer efficacy of green synthesised silver nanoparticles using Coriandrum sativum leaf extract. J. Photochem. Photobiol. B Biol. 2016, 163, 69–76. [Google Scholar] [CrossRef] [PubMed]
- Kim, D.-Y.; Sarataleb, R.G.; Shindea, S.; Syedc, A.; Ameenc, F.; Ghodake, G. Green synthesis of silver nanoparticles using Laminaria japonica extract: Characterization and seedling growth assessment. J. Clean. Prod. 2018, 172, 2910–2918. [Google Scholar] [CrossRef]
- Agasti, N.; Kaushik, N. Myristic acid capped silver nanoparticles: Aqueous phase synthesis and pH-induced optical properties. J. Chin. Adv. Mater. Soc. 2014, 2, 31–39. [Google Scholar] [CrossRef]
- Dong, Y.; Ding, L.; Jin, X.; Zhu, N. Silver nanoparticles capped with chalcon carboxylic acid as a probe for colorimetric determination of cadmium (II). Microchim. Acta 2017, 184, 3357–3362. [Google Scholar] [CrossRef]
- Khan, M.Z.H.; Tarek, F.K.; Nuzat, M.; Momin, M.A.; Hasan, M.R. Rapid biological synthesis of silver nanoparticles from Ocimum sanctum and their characterization. J. Nanosci. 2017, 1, 1–6. [Google Scholar] [CrossRef] [Green Version]
- Umadevi, M.; Bindhu, M.; Sathe, V. A novel synthesis of malic acid capped silver nanoparticles using Solanum lycopersicums fruit extract. J. Mater. Sci. Technol. 2013, 29, 317–322. [Google Scholar] [CrossRef]
- Sambalova, O.; Thorwarth, K.; Heeb, N.V.; Bleiner, D.; Zhang, Y.; Borgschulte, A.; Kroll, A. Carboxylate functional groups mediate interaction with silver nanoparticles in biofilm matrix. ACS Omega 2018, 3, 724–733. [Google Scholar] [CrossRef]
- Hosny, A.M.S.; Kashef, M.T.; Rasmy, S.A.; Aboul-Magd, D.S.; El-Bazza, Z.E. Antimicrobial activity of silver nanoparticles synthesized using honey and gamma radiation against silver-resistant bacteria from wounds and burns. Adv. Nat. Sci. Nanosci. Nanotechnol. 2017, 8, 045009. [Google Scholar] [CrossRef] [Green Version]
- Le, A.-T.; Tam, P.D.; Huy, P.T.; Huy, T.Q.; Van Hieu, N.; Kudrinskiy, A.A.; Krutyakov, Y.A. Synthesis of oleic acid-stabilized silver nanoparticles and analysis of their antibacterial activity. Mater. Sci. Eng. C 2010, 30, 910–916. [Google Scholar] [CrossRef]
- Ravindran, A.; Dhas, S.P.; Chandrasekaran, N.; Mukherjee, A. Differential interaction of silver nanoparticles with cysteine. J. Exp. Nanosci. 2013, 8, 589–595. [Google Scholar] [CrossRef]
- Rajar, K.; Balouch, A.; Bhanger, M.I.; Shah, M.T.; Shaikh, T.; Siddiqui, S. Succinic acid functionalized silver nanoparticles (Suc-Ag NPs) for colorimetric sensing of melamine. Appl. Surf. Sci. 2018, 435, 1080–1086. [Google Scholar] [CrossRef]
- Mythili, R.; Selvankumar, T.; Srinivasan, P.; Sengottaiyan, A.; Sabastinraj, J.; Ameen, F.; Al-Sabri, A.; Kamala-Kannan, S.; Govarthanan, M.; Kim, H. Biogenic synthesis, characterization and antibacterial activity of gold nanoparticles synthesised from vegetable waste. J. Mol. Liq. 2018, 262, 318–321. [Google Scholar] [CrossRef]
- Ameen, F.; Srinivasan, P.; Thangaswamy, S.; Kamalakannan, S. Phytosynthesis of silver nanoparticles using Mangifera indica flower extract as bioreductant and their broad-spectrum antibacterial activity. Bioorg. Chem. 2019, 88, 102970. [Google Scholar] [CrossRef]
- Bowler, P.G.; Jones, S.A.; Davies, B.J.; Coyle, E. Infection control properties of some wound dressings. J. Wound Care 1999, 8, 499–502. [Google Scholar] [CrossRef] [PubMed]
- Hudzicki, J. Kirby-Bauer disk diffusion susceptibility test protocol. Am. Soc. Microbiol. 2009, 15, 55–63. [Google Scholar]
- Powell, C.J.; Werner, W.S.M.; Shard, A.G.; Castner, D.G. Evaluation of two methods for determining shell thicknesses of core–shell nanoparticles by X-ray photoelectron spectroscopy. J. Phys. Chem. C 2016, 120, 22730–22738. [Google Scholar] [CrossRef] [Green Version]
- Fayaz, A.M.; Balaji, K.; Girilal, M.; Yadav, R.; Kalaichelvan, P.T.; Venketesan, R. Biogenic synthesis of silver nanoparticles and their synergistic effect with antibiotics: A study against gram-positive and gram-negative bacteria. Nanomed. Nanotechnol. Biol. Med. 2010, 6, 103–109. [Google Scholar] [CrossRef] [PubMed]
- Arayne, S.; Sultana, N.; Shamim, S.; Naz, A. Synthesis characterization and antimicrobial activities of azithromycin metal complexes. Mod. Chem. Appl. 2014, 2, 3. [Google Scholar]
- Muthuvel, A.; Jothibas, M.; Manoharan, C. Synthesis of copper oxide nanoparticles by chemical and biogenic methods: Photocatalytic degradation and in vitro antioxidant activity. Nanotechnol. Environ. Eng. 2020, 5, 1–19. [Google Scholar] [CrossRef]
- Xiao, F.; Xu, T.; Lu, B.; Liu, R. Guidelines for antioxidant assays for food components. Food Front. 2020, 1, 60–69. [Google Scholar] [CrossRef] [Green Version]
- Shamim, S.; Begum, I.; Gul, W.; Quds, T.; Imran, M.; Shah, E.; Jahan, N. Antibacterial, antifungal and enzymatic activities of azithromycinheavy metal complexes: Newly synthesized and characterized. Pak. J. Pharm. Sci. 2021, 34, 1149–1156. [Google Scholar] [PubMed]
- Shamim, S.; Gul, S.; Khan, A.; Ahmed, A.; Gul, A. Antimicrobial, Antifungal and Enzymatic Profiling of Newly Synthesized Heavy Metal Complexes of Gemifloxacin. Pharm. Chem. J. 2022, 1–7. [Google Scholar] [CrossRef]
- Begum, I.; Ameen, A.; Soomro, Z.; Shamim, S.; AlNadhari, S.; Almansob, A.; Al-Sabri, A.; Arif, A. Facile fabrication of malonic acid capped silver nanoparticles and their antibacterial activity. J. King Saud Univ.-Sci. 2021, 33, 101231. [Google Scholar] [CrossRef]
- Shrivas, K.; Sahu, S.; Patra, G.K.; Jaiswalb, N.K.; Shankar, R. Localized surface plasmon resonance of silver nanoparticles for sensitive colorimetric detection of chromium in surface water, industrial waste water and vegetable samples. Anal. Methods 2016, 8, 2088–2096. [Google Scholar] [CrossRef]
- Jiang, X.C.; Chen, C.Y.; Chen, W.M.; Yu, A.B. Role of citric acid in the formation of silver nanoplates through a synergistic reduction approach. Langmuir 2010, 26, 4400–4408. [Google Scholar] [CrossRef] [PubMed]
- Amendola, V.; Bakr, O.M.; Stellacci, F. A study of the surface plasmon resonance of silver nanoparticles by the discrete dipole approximation method: Effect of shape, size, structure, and assembly. Plasmonics 2010, 5, 85–97. [Google Scholar] [CrossRef]
- Gamboa, S.M.; Rojas, E.R.; Martínez, V.V.; Vega-Baudrit, J. Synthesis and characterization of silver nanoparticles and their application as an antibacterial agent. Int. J. Biosen. Bioelectron. 2019, 5, 166–173. [Google Scholar]
- Agarwal, K.R.; Lakshman, S.; Sharma, K.D. Synthesis, Spectral, and Biological Properties of Copper(II) Complexes of Thiosemicarbazones of Schiff Bases Derived from 4-Aminoantipyrine and Aromatic Aldehydes. Bioinorg. Chem. Appl. 2006, 2006. [Google Scholar] [CrossRef] [Green Version]
| Publisher’s Note: MDPI stays neutral with regard to jurisdictional claims in published maps and institutional affiliations. |
© 2022 by the authors. Licensee MDPI, Basel, Switzerland. This article is an open access article distributed under the terms and conditions of the Creative Commons Attribution (CC BY) license (https://creativecommons.org/licenses/by/4.0/).


 ,
, 


