Article

Optimizing Pressure Prediction Models for Pneumatic Conveying of Biomass: A Comprehensive Approach to Minimize Trial Tests and Enhance Accuracy

1
Centre for Bulk Solids and Particulate Technologies, The University of Newcastle, Newcastle, NSW 2308, Australia
2
Department of Chemical and Petroleum Engineering, University of Pittsburgh, Pittsburgh, PA 15261, USA
*
Author to whom correspondence should be addressed.
Processes 2023, 11(6), 1698; https://doi.org/10.3390/pr11061698
Submission received: 9 May 2023 / Revised: 29 May 2023 / Accepted: 30 May 2023 / Published: 2 June 2023
(This article belongs to the Special Issue Biomass Combustion and Energy Production Processes)

Abstract

:
This study investigates pneumatic conveying of four different biomass materials, namely cottonseeds, wood pellets, wood chips, and wheat straw. The performance of a previously proposed model for predicting pressure drop is evaluated using biomass materials. Results indicate that the model can predict pressure with an error range of 30 percent. To minimize the number of trial tests required, an optimization algorithm is proposed. The findings show that with a combination of three trial tests, there is a 60 percent probability of selecting the right subset for accurately predicting pressure drop for the entire range of tests. Further investigation of different training subsets suggests that increasing the number of tests from 3 to 7 can improve the probability from 60% to 90%. Moreover, thorough analysis of all three-element subsets in the entire series of tests reveals that when considering air mass flow rate as the input, having air mass flow rates that are not only closer in value but also lower increases the likelihood of selecting the correct subset for predicting pressure drop across the entire range. This advancement can help industries to design and optimize pneumatic conveying systems more effectively, leading to significant energy savings and improved operational performance.

1. Introduction

The conveying of bulk solids through pipelines utilizing a gaseous medium, predominantly air, is referred to as pneumatic conveying, which is widely employed in diverse industrial settings such as the food, chemical, and pharmaceutical sectors. Historically, the examination of pneumatic conveying has been grounded in the distinction between dilute and dense phase flow. The former encompasses low solid concentrations and high velocities, while the latter pertains to high solid concentrations and low velocities [1]. Given the capacity, dense phase flows are favored due to their heightened efficiency and gentle treatment of materials relative to dilute flows [2]. Nevertheless, the extensive implementation of dense phase conveying is restricted by the intricacies of articulating the discontinuous, wave-like nature of flowing plugs, leading to an empirical dense phase design that frequently necessitates expensive conveying trials for dependable operation [2].
In the engineering of a pneumatic conveying system, it is imperative to recognize the diverse flow behaviors of substances as they traverse the pipelines. After identifying the flow modes, predicting the potential regime becomes essential for ensuring the efficacy of the conveying system design. Both users and producers of pneumatic conveying systems prioritize forecasting material behavior without resorting to full-scale conveying trials, thus underscoring the significance of precise prediction methods.
In this regard, fluidization tests serve as a prevalent instrument for examining the flow behavior in pneumatic conveying applications. By introducing air through a porous base, investigators can observe the material’s behavior, encompassing aeration, de-aeration, and permeability properties. The gathered data is utilized to devise models that anticipate the flow attributes of bulk solids under varying conditions, thereby optimizing the design and operation of equipment and processes across multiple industries [3].
In the groundbreaking study carried out by Geldart, a categorization method for particles was suggested, centering on their fluidization characteristics and considering particular particle properties like density and diameter [4]. Nevertheless, Geldart’s fluidization categorization has been critiqued for insufficiently identifying dense phase transport potential in pneumatic conveying contexts [5]. As a result, Dixon introduced a classification system based on differences in density and average particle dimensions [6]. Scholars have emphasized bulk density in determining the boundaries between particle behaviors [7,8]. Moreover, other methods consider investigating air-particle interactions by utilizing permeability and deaeration factors derived from bench-scale experiments [9,10]. Sanchez contended that the approaches of Dixon and Geldart were more appropriate compared to dimensionless values [11]. Factoring in air velocity facilitates transportation across diverse flows [8,12]. Advancing in this area, Rabinovich and Kalman presented a flow regime chart that incorporated material characteristics and operational conditions [13], which was later expanded for horizontal flow by Kalman and Rawat [14].
The identification and prediction of flow modes are of considerable importance in designing a dependable pneumatic conveying system. However, the accurate prediction of pressure drop serves as a critical element in achieving a reliable system. Pressure drop is a vital parameter in the design of pneumatic conveying systems, as it dictates the power consumption required for air compression and the overall efficiency of the system. Primarily, pressure drop in a pneumatic conveying system is caused by frictional losses due to the interaction between solid particles and the conveying gas. An increase in gas velocity, solid particle concentration, and conveying distance results in an increased pressure drop. To precisely predict the pressure drop, various models have been proposed, including empirical correlations, semi-empirical models, and numerical simulations.
In early studies, several researchers suggested a piston-like model to characterize the behavior of dense phase flow in pipes [15,16,17,18,19,20,21]. These models propose that the dense material forms a solid piston moving through the pipe, with the pressure drop determined by a force balance on the piston. Utilizing this model, researchers have devised various pressure drop models to predict the material’s behavior in the pipe. Sanchez [22] performed a comparative analysis of such pressure drop models and concluded that the Mi and Wypych model [21] was the most accurate in predicting pressure drop based on experimental data. Later, Pan and Wypych [23] further refined Mi’s model by incorporating experimental parameters to account for bulk solid materials of diverse shapes.
Subsequent advancements in determining pressure drop in pneumatic conveying systems have considered the fluctuations and complexities of dense phase flow. In these models, pressure drop is generally described as the combined effect of gas and solids [24], which can be expressed as:
Δ P = Δ P g + Δ P s
The term P g is calculated as it would be for single-phase gas flow, while the term P s is associated with particle transport.
The determination of pressure drop caused by solid particles in pneumatic conveying systems, particularly in dense phase flow, has always been a challenging task. To design more reliable systems, several studies have been conducted to better understand the underlying physics and apply engineering simplifications.
The comprehension of dense phase flow and its characteristics has remained elusive due to the inherent complexities arising from its intrinsic dynamic nature. These complexities can be exacerbated in slug flow, where wave-like movements and the continuous exchange of particles occur during the conveying process. While the microscopic aspects of slug flow continue to be ambiguous, macroscopic approaches have been developed to address these challenges [25,26].
One such approach involves focusing on the total pressure drop of the system [2], as derived from the existing literature [1], which has demonstrated that the pressure drop associated with air pockets is negligible. By prioritizing the total pressure drop, researchers can effectively disregard the microscopic alterations within the system, concentrating instead on the overarching changes that predominantly influence the system’s behavior. Based on these findings, it is possible to consider the entire system as a theoretical single slug [21,23,27,28,29].
However, the models discussed thus far are limited in their scope, as they only consider specific modes of flow and develop pressure drop equations for those modes. They do not account for the full range of flow modes, from dense phase to dilute phase, which can vary significantly in terms of particle concentration and pressure drop characteristics. Therefore, the development of comprehensive models that can predict pressure drop across a wide range of flow conditions is necessary. The Zenz diagram [30] is a common way to capture the full range of modes of flow in conveying trials by plotting the system pressure drop against a parameter reflecting the gas feed into the system.
One of the earliest attempts to predict the entire Zenz curve was carried out by Barth [31], which is a development to Darcy’s equation [32], where the pressure drop of the single phase of gas is predicted. This equation is given by:
Δ P = λ f + m * λ s L D ρ v 2 2
Here, λ f represents the gas friction factor, L represents the pipe length in meters, D represents the pipe diameter in meters, ρ represents the density of air, and v represents the air velocity. Additionally, λ s represents the solids friction factor, while m * represents the solids loading ratio.
While the gas friction factor can be calculated relatively easily using established formulas, determining the solids friction factor is a challenging task due to limited understanding of the underlying mechanisms involved in the flow of powdered materials. The solids friction factor term represents a combination of energy losses resulting from interactions between solid particles, solids and gas, and solids and pipe walls [1].
Numerous researchers have investigated the solids friction factor as a means of predicting pressure drop caused by the presence of solids using the model described above [33,34,35,36,37]. The turbulent and intricate nature of the moving slugs and high solids to gas mass ratio presents a challenge in linking particle and bulk properties, as well as interactions with the actual operating conditions and design parameters. As a result, there has been limited progress in fundamentally understanding the flow mechanisms and modeling of the solids friction factor.
Building on the discussion of predicting modes of flow and pressure drop in the context of pneumatic conveying, it is important to consider its functionality to biomass. With the increasing global demand for sustainable energy sources, biomass usage has experienced significant growth. Consequently, the need for efficient biomass handling and conveying systems has also escalated [12,38,39]. Conventional methods for determining flow modes are not entirely appropriate for biomass materials due to their unique properties, including irregular particle shape and broad particle size distribution. As a result, much remains to be explored regarding biomass material flow modes in the context of pneumatic conveying [38,39].
A significant portion of biomass pneumatic conveying research has focused on dilute phase conveying, characterized by low solid concentrations and dispersed particles. In this phase, the complexities of dense phase flow, as mentioned earlier, are generally minimized, making it well-suited for biomass [40]. Various studies have examined dilute phase conveying of biomass, including Barbosa et al.’s work on cork stopper transport [41] and Gomes et al.’s investigation into biomass feeding [42]. Gomes et al. discovered that biomass with lower bulk density exhibited higher feeding efficiencies at reduced material heights in the silo due to the ease of breaking cohesive arches. Conversely, higher density materials demonstrated enhanced efficiencies at greater heights. In a recent study, Rajabnia et al. [43] explored the flow modes of cottonseed conveying and aimed to identify the conditions that lead to Plug-1 formation [27]. The authors concluded that the feeding method was crucial in determining plug formation, indicating a reliance on local particle arrangements during fixed bed formation. Additionally, the research highlighted the importance of the plug’s base or rear in maintaining its structure, as it acted as a piston to propel the material bed forward.
Broadening the discussion, it becomes evident that a more comprehensive model capable of predicting system behavior across various flow modes and particle characteristics is necessary. In response to this need, we have recently developed a model that predicts pressure drop for the entire Zenz diagram [44], which relies solely on trial tests. Building upon this foundation, the present study aims to develop the previously proposed model using a novel optimization approach, with the objective of minimizing the number of required trial tests. In the subsequent subsection, a synopsis of the prior research, as well as the aims and objectives of the current investigation, will be delineated.

1.1. Summary of Previous Study on Pressure Predictive Model and the Novelty of the Current Study

The previous study [44] focused on the development of a phenomenological pressure model, specifically aimed at predicting Zenz diagrams in the context of slug flow and fluidized dense flow. The proposed model is founded on the principle of a summation of two terms. One term takes into account the influence of solids, while the other term considers the effect of gas mass flow rates only. This approach facilitates the prediction of the entire Zenz diagram, even with limited conveying trials.
The theoretical foundation of the model is based on four primary assumptions [44], which are as follows:
  • The pressure drop in a pneumatic conveyor comprises both a gas-only term and a solids term, taking into account the flow rates of gas and solids.
  • The gas-only pressure drop is directly proportional to the square of the gas mass flow rate.
  • The pressure drop attributed to the solids term is directly proportional to the solids loading ratio [45].
  • The pressure gradient across a slug or pipeline remains constant, whether in dense or dilute phase conditions [46].
The study establishes that the model can be represented by Equation (3), where the constants a and b are specific to a particular configuration and must be determined through trial tests.
Δ P = a m ˙ a 2 + b m ˙ s m ˙ a
To derive the values of the constants in the pressure model presented in Equation (3), the equation can be rearranged to reveal a linear relationship between m ˙ s m ˙ a 3 and Δ P m ˙ a 2 .
Δ P m ˙ a 2 = a + b m ˙ s m ˙ a 3
After the constants have been ascertained for a particular test configuration, the Equation (3) can be utilized to forecast the pressure across the entire Zenz diagram.
To validate the proposed model, two distinct datasets were utilized, encompassing diverse scales: the horizontal 17 m long pipeline located at the university of Newcastle, and the 52 m and 96 m loops of Mi [21].
The determination of the constants is a crucial aspect of the proposed pressure model, and our prior study [44] provides an in-depth discussion on the influence of the constants on the predicted pressure. It was demonstrated that disregarding the term accounting for the gas-only contribution results in an underestimation of the pressure. Additionally, the study revealed that the effect of the constant b is more dominant due to the vast range and domain of the data.
In light of the existing model, this research seeks to investigate the model’s adaptability in predicting the behavior of various biomass materials, such as wood chips, wheat straw, wood pellets, and cottonseed which vary considerably in particle and bulk properties. The study’s objective is to refine the model through comprehensive data analysis and the evaluation of various setup configurations, with the goal of determining the minimum number of trial tests necessary for precise predictions.
The choice of biomass materials is motivated by their distinctive properties, including irregular and heterogeneous particle shapes, as well as diverse particle size distributions. In the context of the growing global demand for sustainable energy sources, biomass materials have become increasingly important. This surge in demand has led to a pressing need for efficient biomass handling and conveying systems. Therefore, expanding our understanding of biomass flow behaviors and developing suitable models are essential for designing effective and reliable biomass pneumatic conveying systems [47].
To achieve the research objectives, the first part of the study involves conveying biomass material in two distinct setups: single batch and continuous conveying. The model is then applied to examine its precision in predicting pressure drop within these systems when using different biomass materials.
Moreover, the study seeks to clarify the model’s ability to determine the optimal number of trial tests required to obtain consistent results. To accomplish this, a search algorithm is employed that iteratively selects various subsets of different combinations and assesses their efficacy in predicting pressure. This process involves dividing the dataset into training and validation sets, defining performance metrics (R-squared and RMSE), and implementing a search strategy based on a combination approach. Model evaluation, and if necessary, model selection, are conducted to identify the most suitable empirical model and the most effective test subset.
This study endeavors to augment the comprehension of the selection process for efficacious tests and to improve the empirical model by integrating the proposed algorithmic procedures. The ultimate objective of this endeavor is to enhance the performance of the model, and to facilitate more precise and efficient prediction.

2. Material Properties and Experimental Set Up and Procedure

This section presents the material properties, as well as the testing arrangements and procedures employed in this study.
The study incorporates two conveying setups, namely the single batch conveying and the continuous conveying methods. The former involves the transport of biomass material in a single batch, while the latter employs a rotary valve to facilitate uninterrupted conveying. Detailed descriptions of both setups, as well as the corresponding test procedures, are expounded in the ensuing sections.

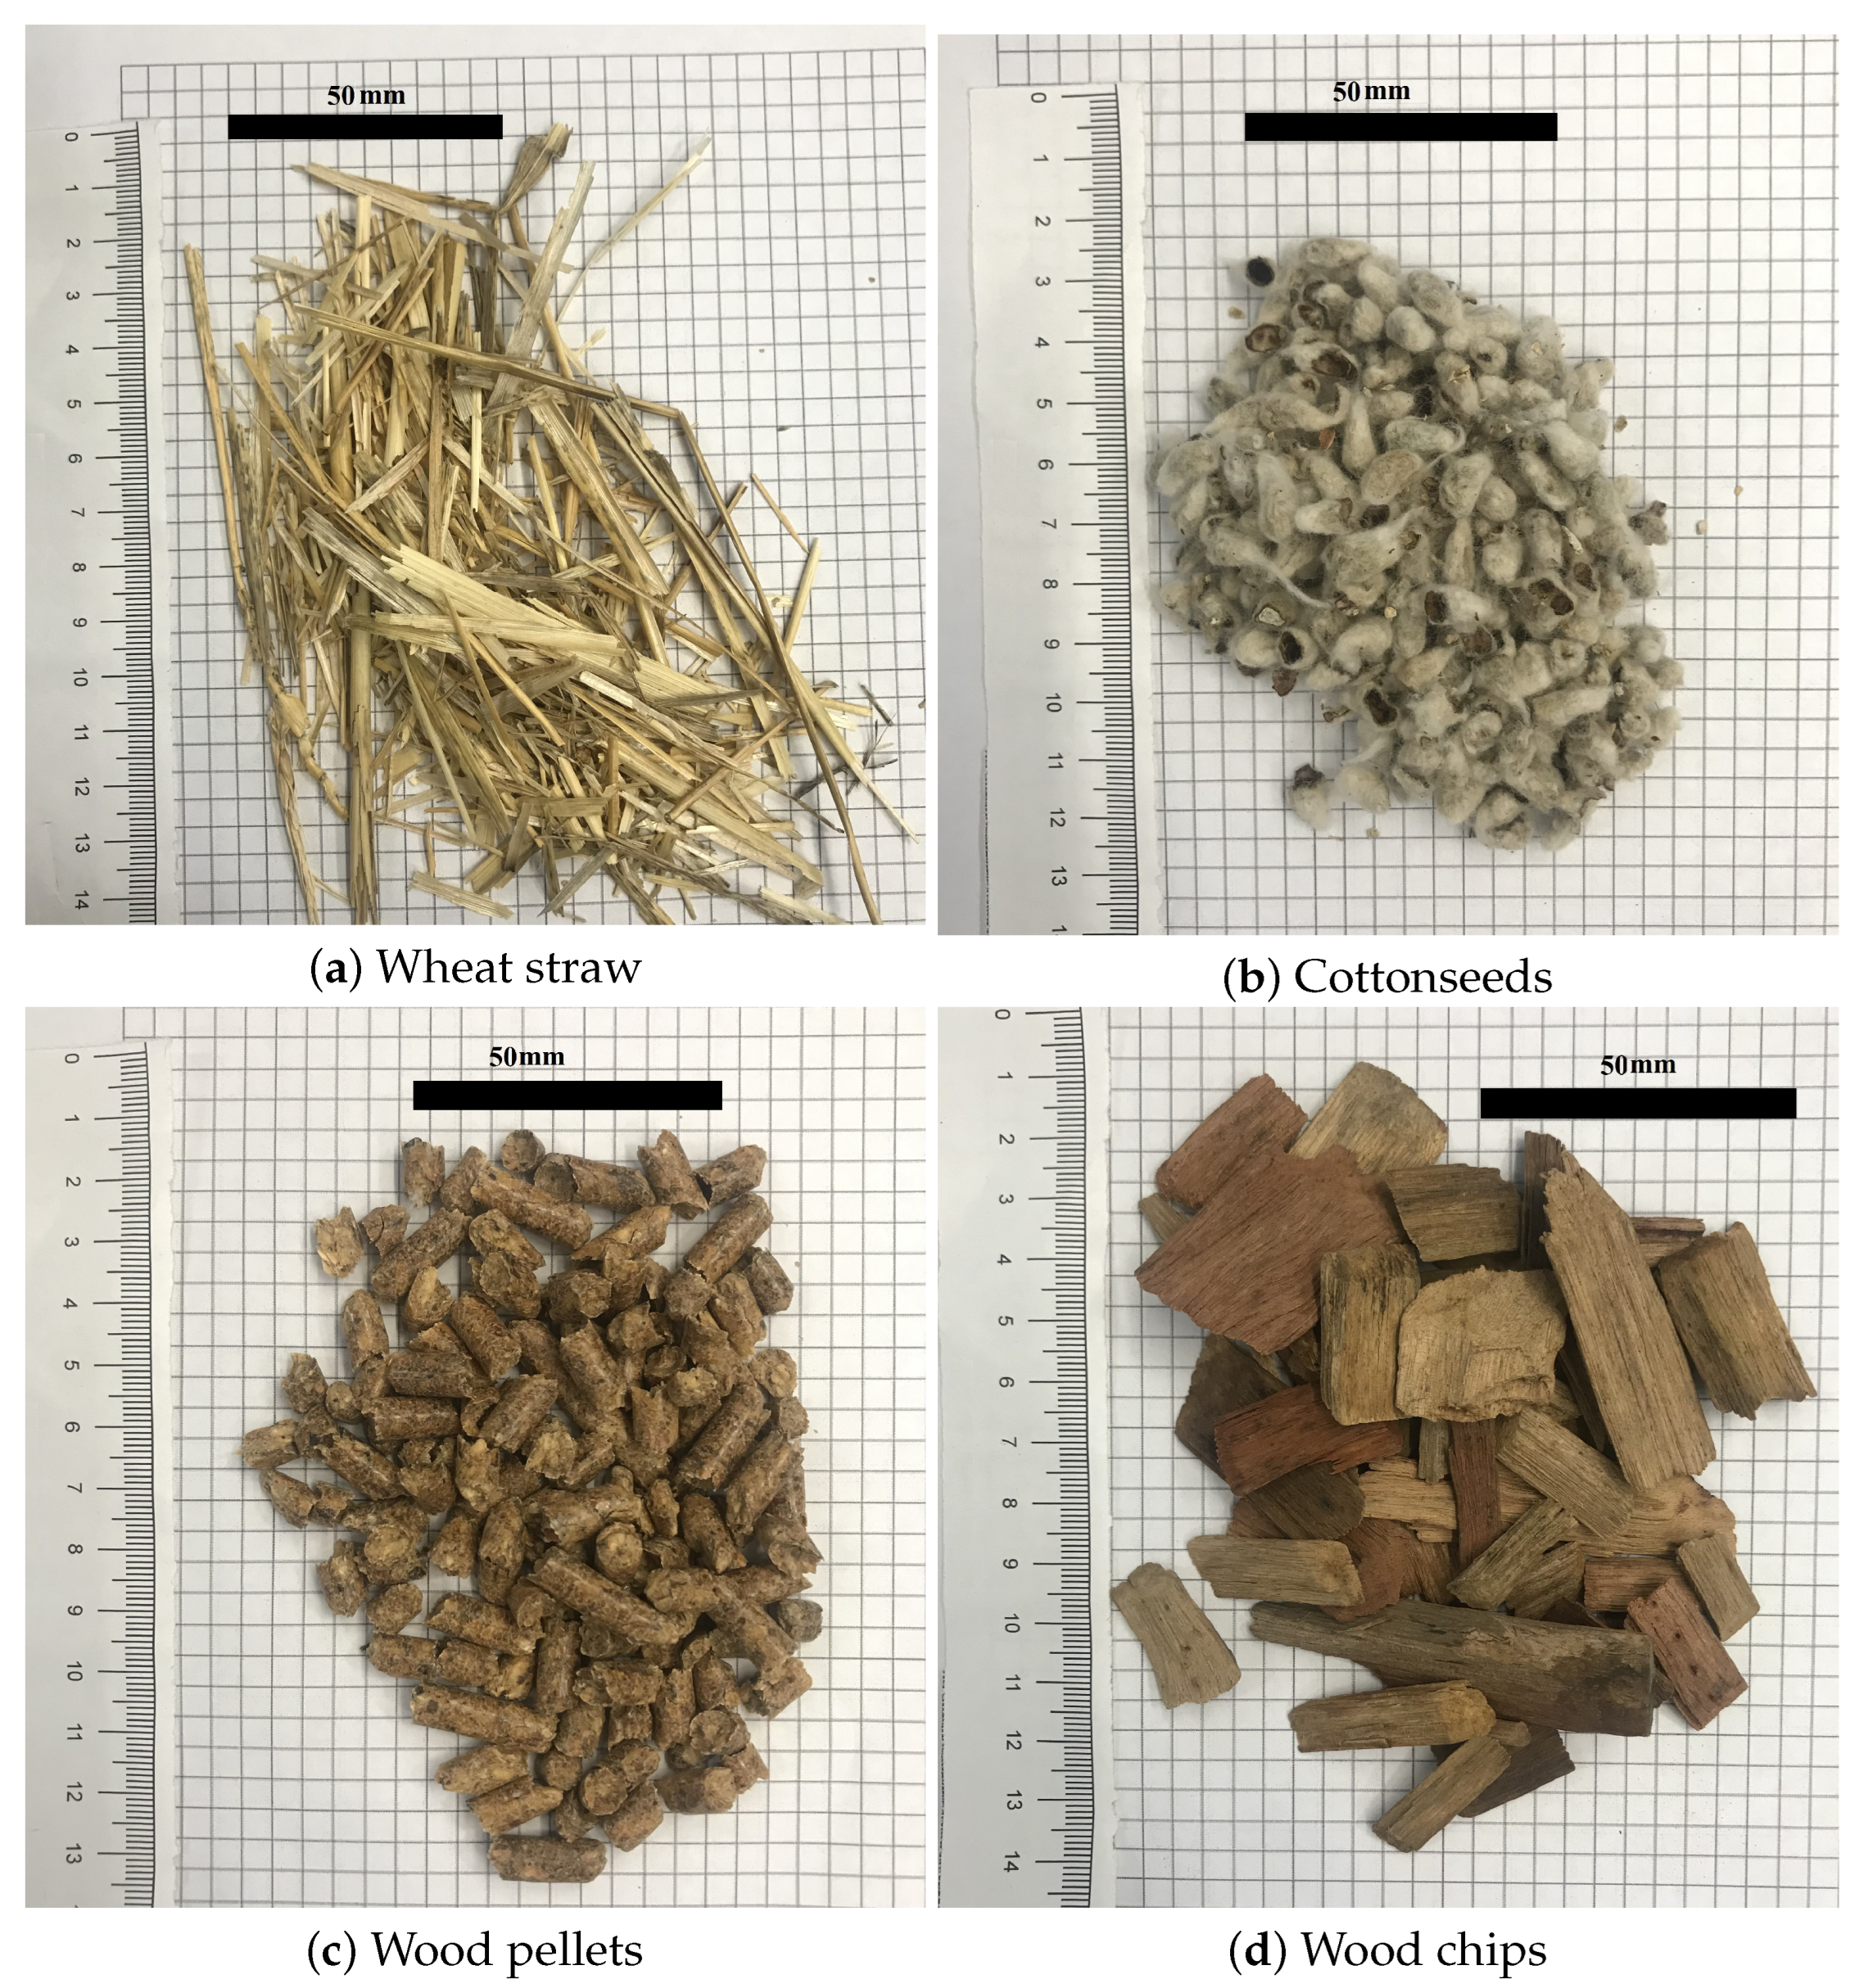
2.1. Material Properties

This research utilized four discrete biomass materials, namely cottonseed, wood chips, wood pellets, and wheat straw, specifically selected based on their distinct characteristics that differentiate them from conventional granular materials. Figure 1 showcases representative samples of the various materials utilized in this study.
In order to determine the true bulk density of the four aforementioned biomass materials, a fixed quantity was introduced into a vertical pipeline, and the resulting bed length was measured. This process was conducted three times for each material, with varying weights, and the average of these measurements was computed to obtain the bulk density. Nonetheless, our ongoing research is primarily focused on evaluating the efficacy of the proposed pressure model using biomass material, which is distinct from regular granular material, along with considering the optimal number of trial tests. Therefore, investigating the influence of detailed particle shape characteristics on the performance of pneumatic conveying of these biomass materials falls outside the scope of this paper. However, for better clarity on the particle size and shape used in this study, Table 1 represents a detailed description of the bulk density, particle shape, and dimensions.
Worth mentioning is the existence of extensive prior research concerning particle-related factors of these four types of biomass materials, which provide beneficial insights into their characteristics [48,49,50,51].

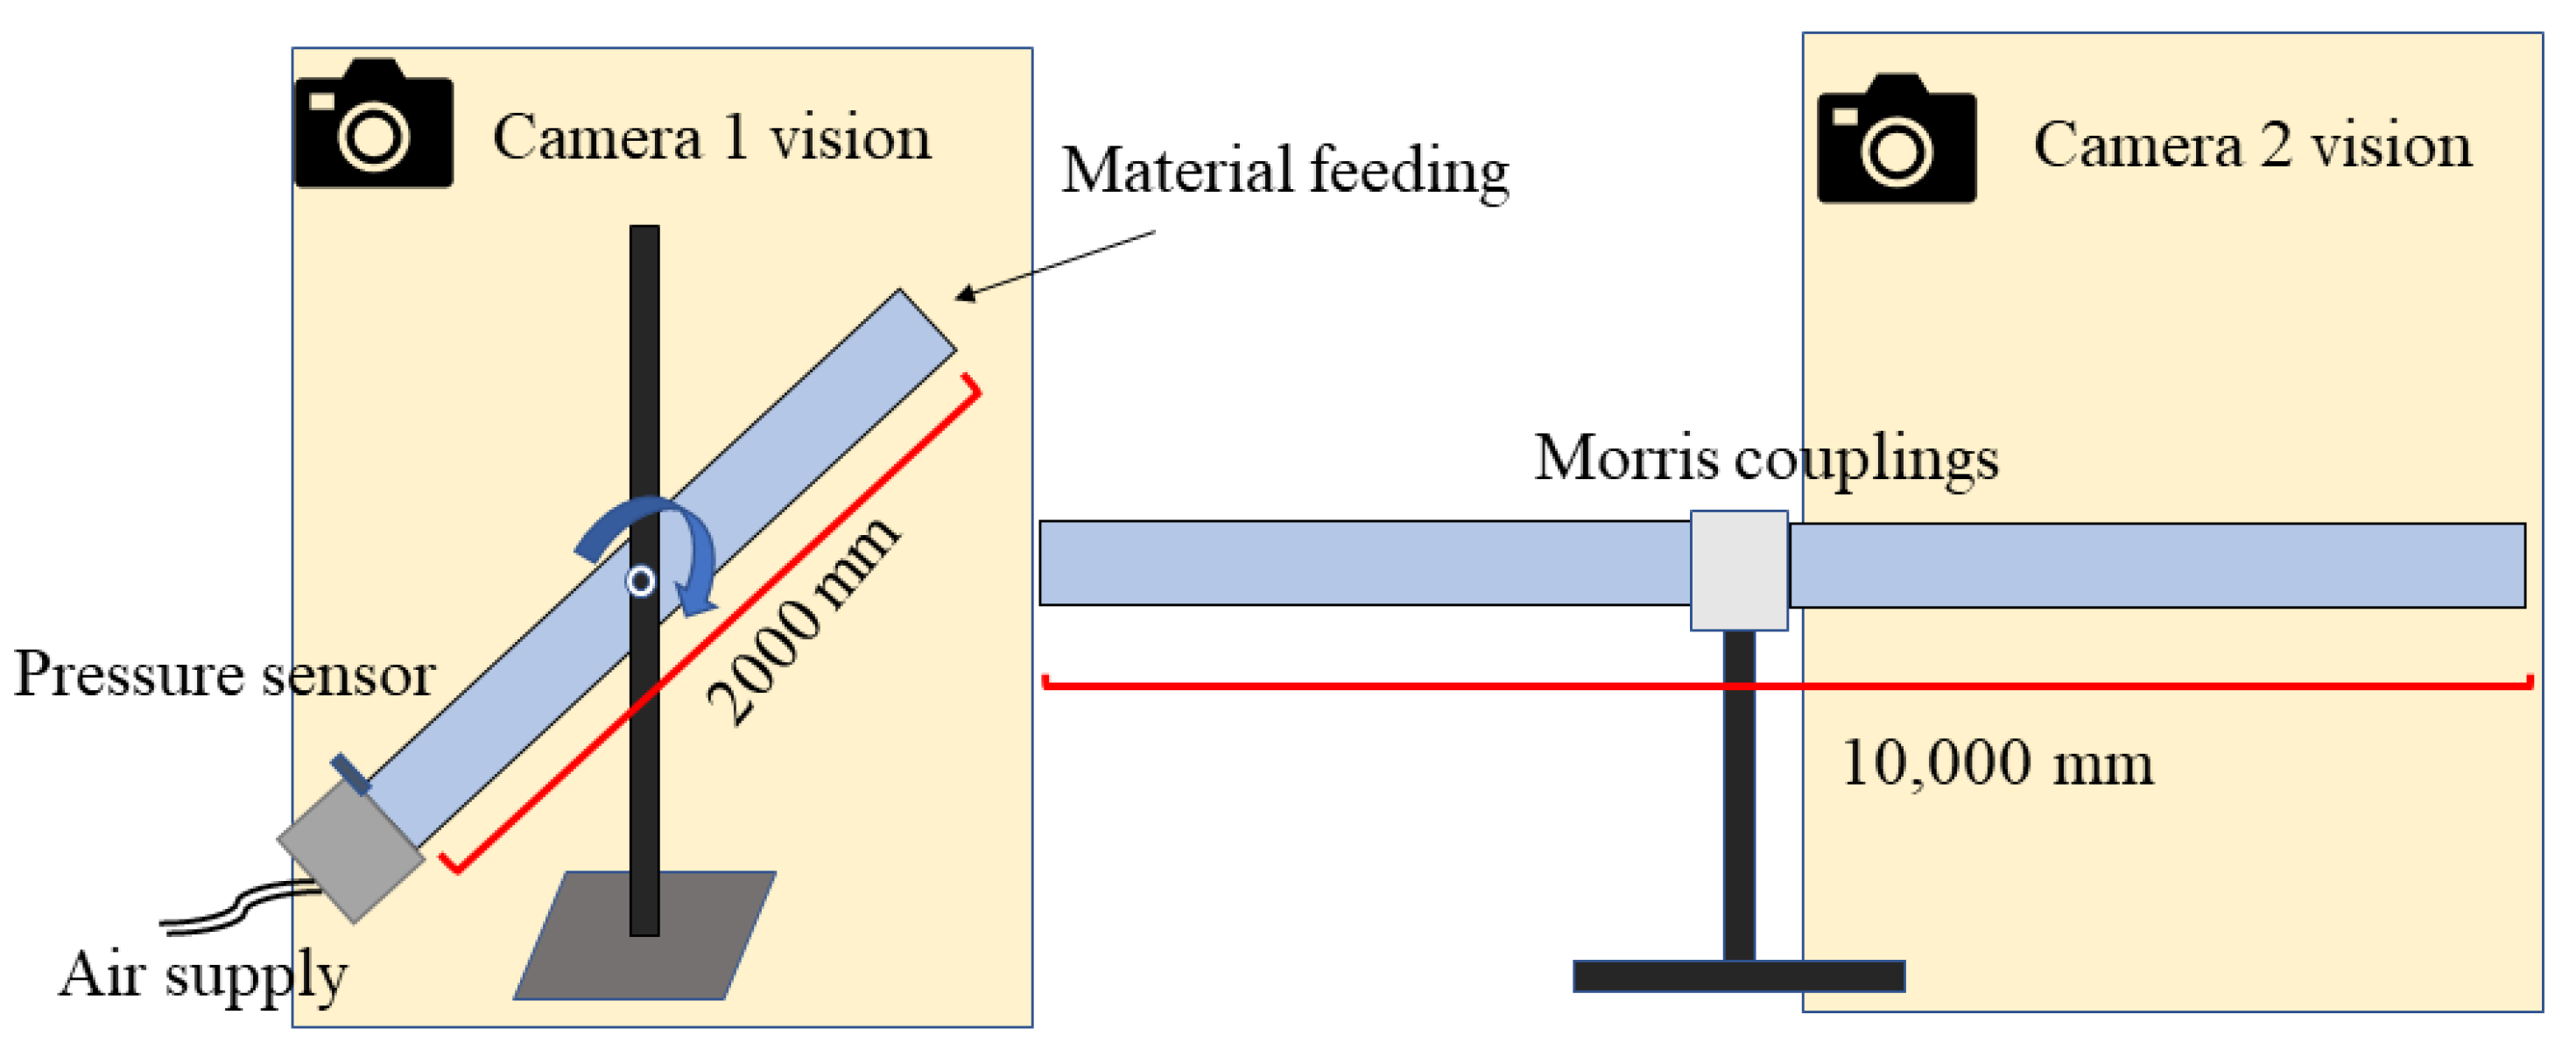
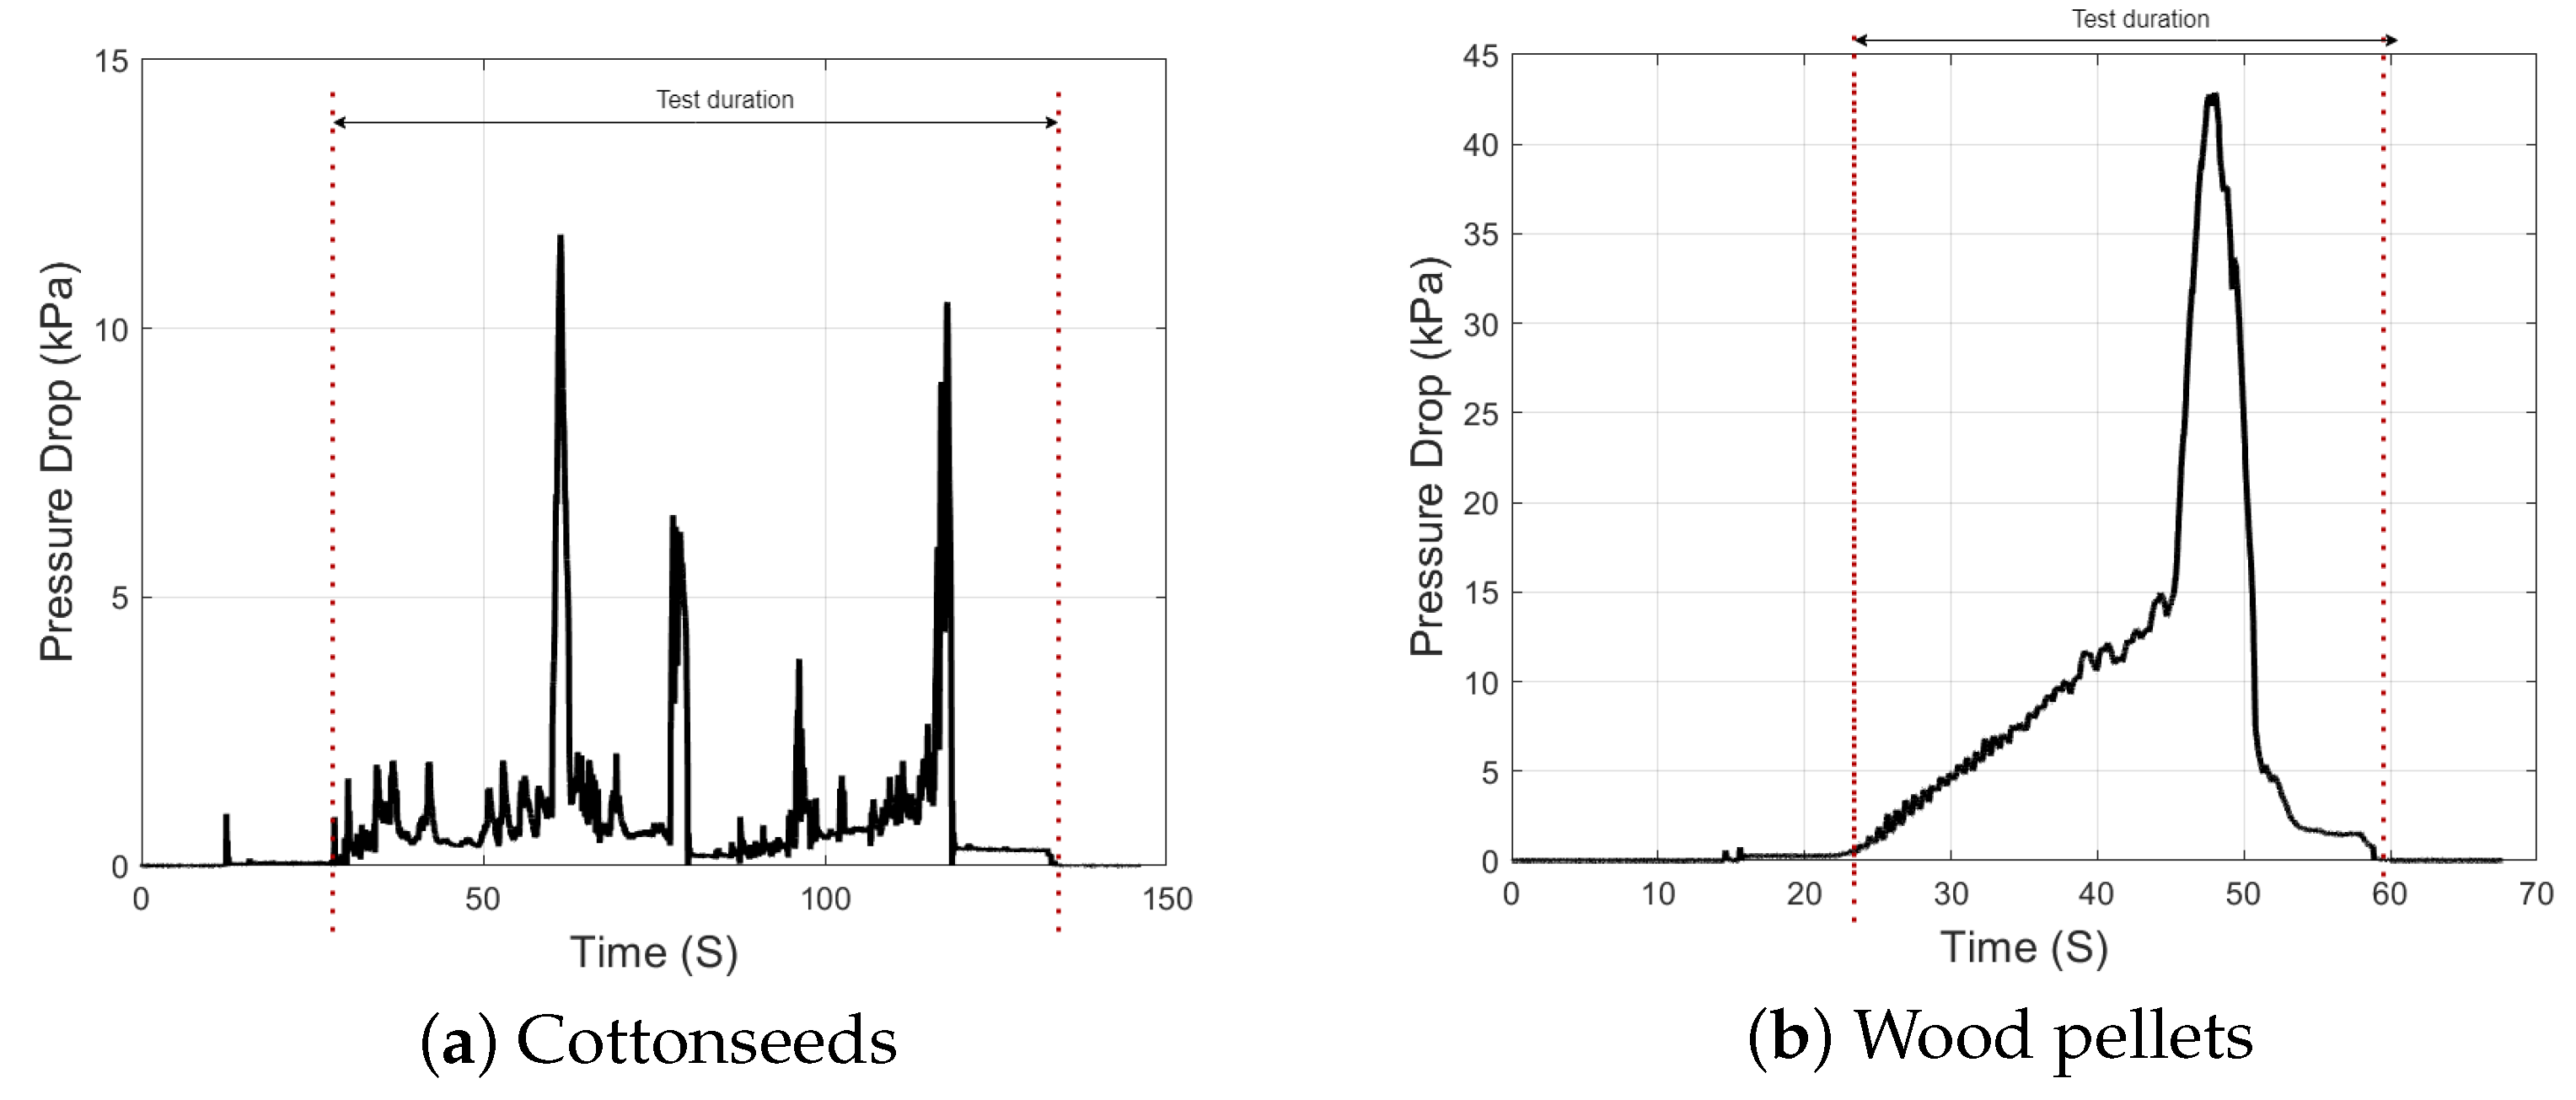
2.2. Single Batch Conveying Set Up and Test Procedure

A part of this study employed a pneumatic conveying test rig that was specifically developed for conducting single-batch conveying evaluations. This experimental setup is characterized by its flexibility and is composed of a transparent PVC pipeline, which is 101.6 mm (4 inches) in diameter and spans 12 m in length. This feature permits unobstructed visual observation of the material’s behavior throughout the transportation process. As illustrated in Figure 2, in order to improve the efficiency of material feeding in the system, we have introduced a mechanism within the first two meters of the pipeline. This mechanism involves a rotatable 2-m segment of the pipeline through which the material is loaded. The key feature of this mechanism is its ability to smoothly rotate the pipeline segment from a horizontal position to a vertical position during the loading process. Once the loading is complete, the segment is returned to its original horizontal position and securely reconnected to the rest of the pipeline using Morris couplings.
The experimental setup comprises a range of additional essential components, including Morris couplings, a plenum, a receiver, wireless sensors, and stands. To precisely observe and document the pressure drop during the experimental trials, six pressure sensors have been strategically installed along the pipeline, with the first sensor located at the base of the initial pipe. Furthermore, two cameras have been placed at different distances in front of the continuous pneumatic conveying rig, with the first camera intended to capture the initial one-third segment of the test and the second camera intended to record the final one-third section of the rig.
In the Figure 2, the shadow area illustrates the visual coverage of both cameras, offering a clearer understanding of the captured area during the test. This visualization enhances insight into the camera’s field of view.
Both experimental setups in this study were equipped with a compressor to guarantee a sufficient air supply during the experiments. A digital airflow regulator controlled a set of sonic nozzles to provide the system with the required airflow rate.
In the experimental setup, all four categories of biomass materials were conveyed using a vertically-fed methodology. The primary conduit possessed the capability to rotate and achieve a vertical alignment, subsequently connecting to the remaining pipeline through Morris couplings upon reverting to a horizontal position. To maintain uniformity during the examination phase, cottonseeds, wood pellets, and wood chips were systematically introduced in 3 kg and 4 kg batches. As shown in Table 1, wheat straw’s substantially lower bulk density, about nine times less than that of wood pellets, affects its conveyance. In our tests, instead of using 3 kg and 4 kg quantities, we created 1 m and 2 m long plugs of wheat straw in the test section to examine its single batch transport properties.
During experiments involving wood chips, wood pellets, and cottonseeds, the initial superficial air velocity of the first nozzle was established at 9 m/s. Nevertheless, considering the lower air demands for transporting wheat straw, the initial testing for this substance began at 6.5 m/s. In later trials with the same substance, the velocity was progressively decreased by 0.5 to 0.8 m/s. This procedure continued until either conveying stopped within the pipe or the plug became unstable, preventing it from leaving the pipeline. The experimental design and test results pertaining to single batch conveying are presented in Table 2. The table comprehensively displays the test matrix and the corresponding conditions of all tests conducted.
In order to compute the solid mass flow rate, the batch weight of the material is divided by the conveying time. The conveying time can be ascertained by examining the pressure time series of the initial sensor, positioned at the beginning of the pipeline. The commencement of the test is identified when the pressure drop surpasses zero for the first time, while the conclusion of the test is marked when the entire batch of material has exited the pipeline and the pressure drop reverts to zero. The precise instant of the chosen points is determined through MATLAB (2022b) programming, subsequently enabling the calculation of the test duration. Additionally, to assess the precision of the pressure model, it is imperative to measure the pressure drop during the testing process. Due to the pressure drop’s fluctuations while conveying, the average pressure drop during plug conveying is considered.
The aforementioned procedure is depicted in Figure 3, where the dashed red lines signify the beginning and end of the test employed to measure the test duration. Simultaneously, the dashed blue lines indicate the region utilized to determine the average pressure drop during conveying.
In the context of pneumatic conveying in extended pipelines, it is commonly observed in the literature that a steady-state pressure drop prevails, with fluctuations and peaks occurring predominantly at the beginning and end of the tests. These pressure surges at the pipeline entrance and exit are more pronounced when the pipeline length is sufficiently long, allowing for a more distinct identification of the steady-state region [7,52,53].
However, our study was conducted using a comparatively shorter pipeline, resulting in variations in the steady-state area under different test conditions involving different materials and air mass flow rates. To ensure consistent identification of the steady-state pressure drop, we have chosen to define the start and end points of each test and calculate the average pressure drop within this defined region.
It is worth noting that the count of peak pressure drop values at the beginning of the tests is considerably lower compared to the number of measurements taken as the material plug moves through the pipeline. Consequently, these initial peak values have a limited impact on the overall average value. Nevertheless, considering them provides a more comprehensive and consistent approach for identifying the pressure drop associated with each test and evaluating the model. We highly appreciate your feedback, and we believe that this explanation adequately addresses your inquiry.

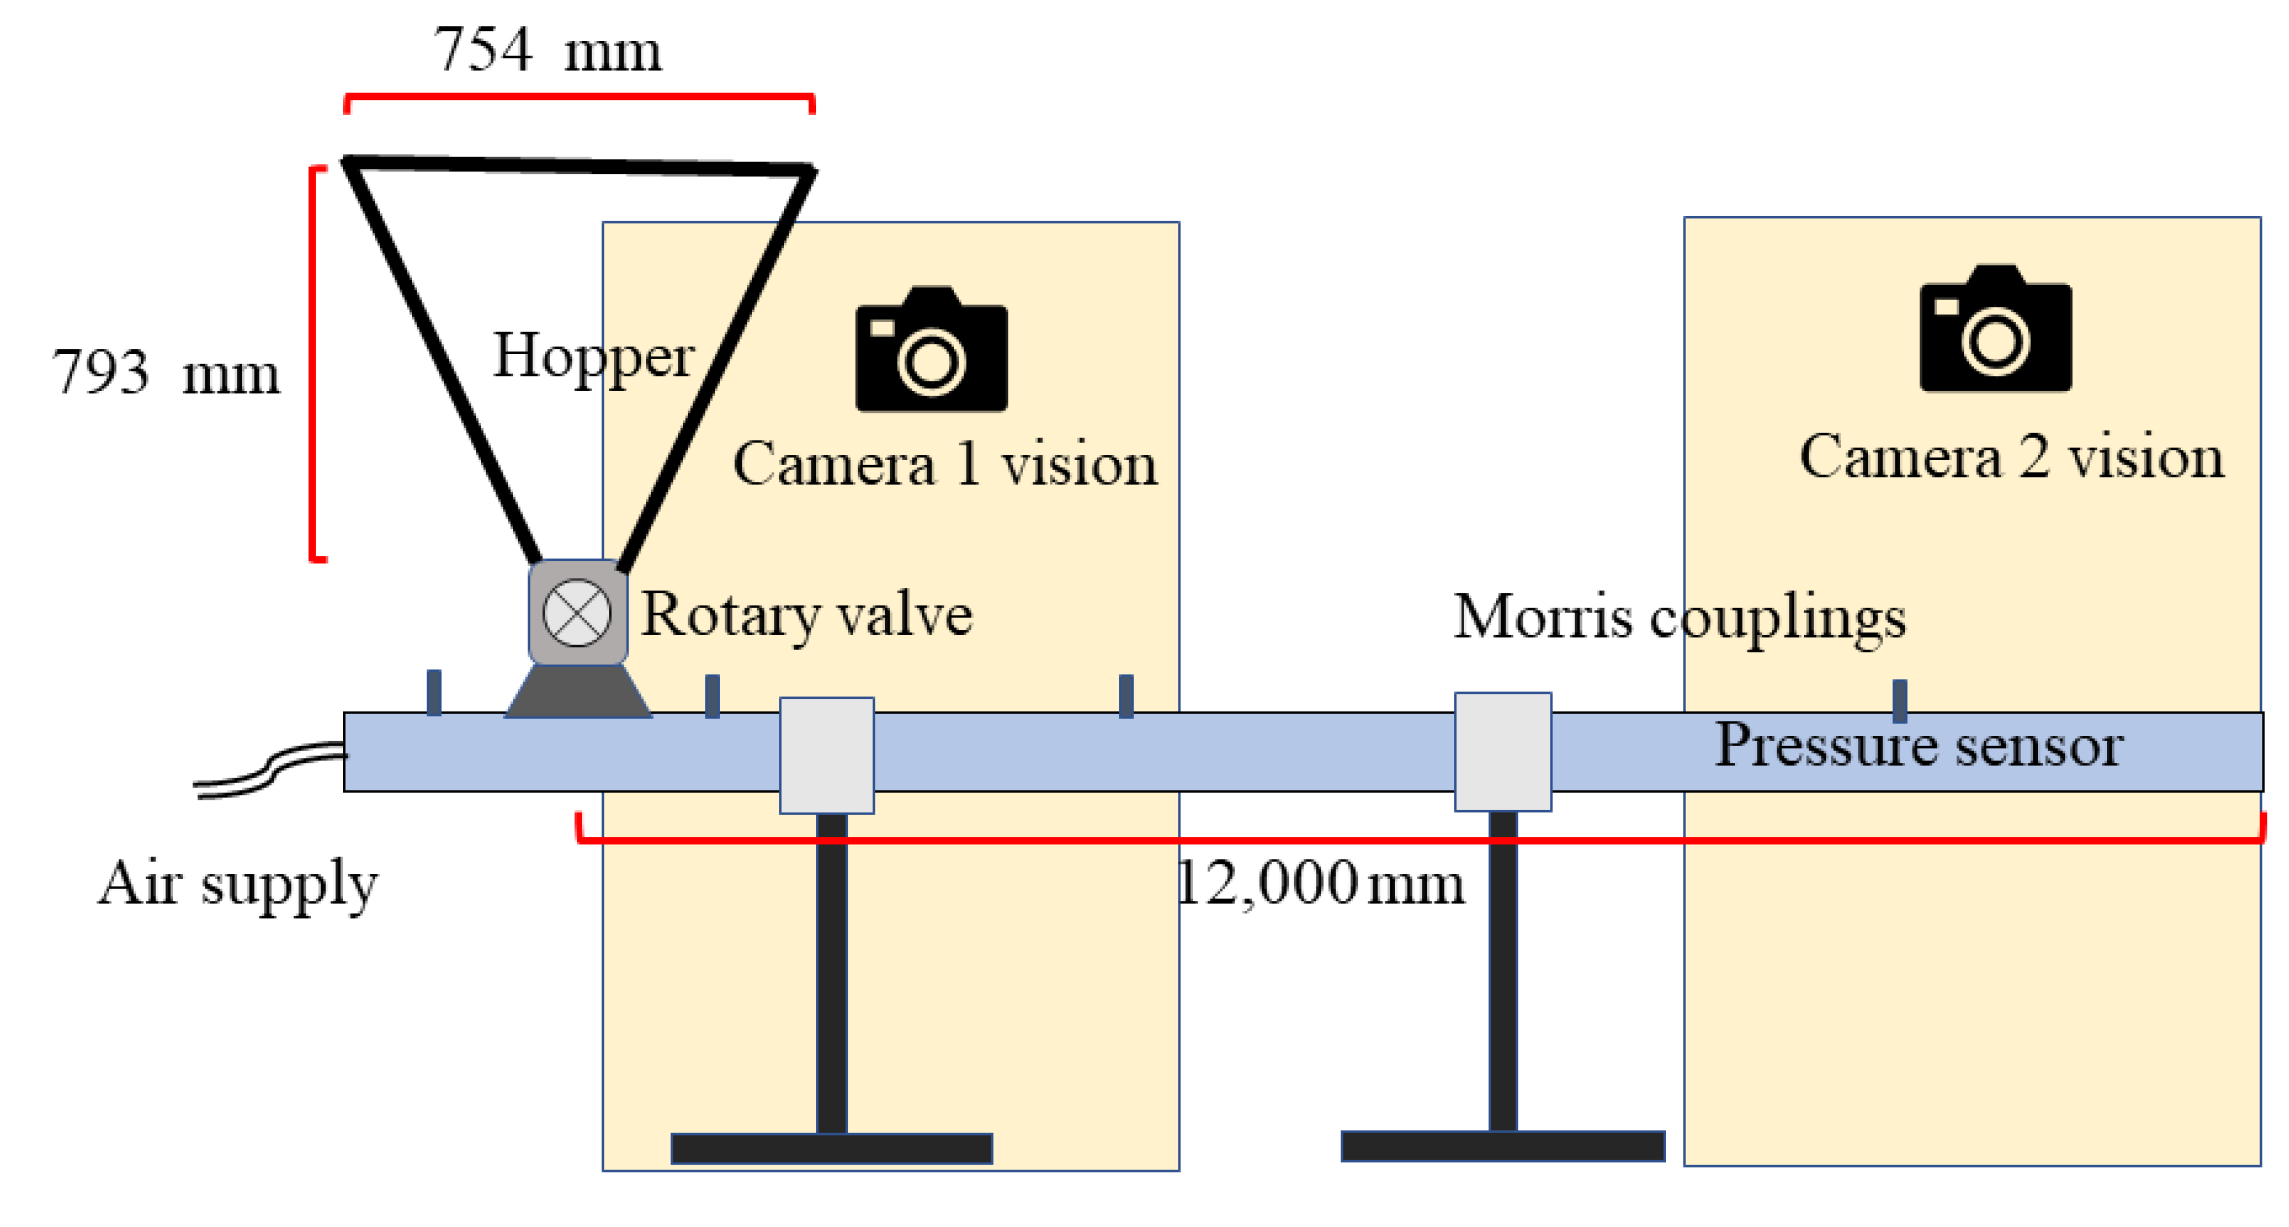
2.3. Experimental Setup for Pneumatic Conveying Rotary Valve and Test Procedure

A specialized experimental arrangement, known as the continuous pneumatic conveying rig, was developed to investigate the behavior of biomass materials during continuous conveying. The primary distinction between this configuration and the batch feeding system lies in the inclusion of a hopper and rotary valve, which enable the continuous introduction of materials into the pipeline.
In this experimental configuration, a NU-CON DT 500 C NS, GEA Nu-Con Ltd. Auckland, New Zealand rotary valve featuring a 250 mm inlet and outlet diameter was employed. The chosen rotary valve has an 8-vane bevel tip rotor design that minimizes air leakage and curtails product accumulation, leading to a uniform and seamless material flow. Furthermore, the valve contains dual-shaft air seals that inhibit product leakage, enhancing its dependability and conveying efficiency for biomass materials. To enable efficient and effective biomass material conveying, a drop box was incorporated into the conveying system below the rotary valve. The inlet air supply was positioned 1000 mm from the drop box’s center to encourage optimal airflow and strengthen the interaction between the material and the air. A 1-inch fitting was utilized to connect the air supply hose directly to the pipeline, introducing air into the system. A controller was implemented to manage the air supply and maintain consistency during the conveying process.
The assembly of the hopper and rotary valve utilized in this study is presented in Figure 4.
To enhance adaptability and efficiency in the testing procedure, variable speed drives (VSDs) motor controllers were employed to control the rotary valve’s speed. This provided the capability to accurately adjust the rotary valve speed over a wide range of frequencies, from 0 to 50 Hz. It was noted that the rotary valve’s maximum RPM was 12 RPM, which corresponds to a 50 Hz frequency in VSD. By utilizing VSDs, tests could be conducted at various solid mass flow rates without negatively affecting the uniformity of the rotary valve speed. This enabled consistent and accurate evaluation of the conveying system’s performance under different conditions.
Upon an initial evaluation of the rotary valve’s capabilities, it was determined that wood chips and wheat straw could not be fed through the valve without potentially damaging its chain. This raised safety concerns and led to the exclusion of these materials from the continuous pneumatic conveying experiments.
The primary distinction between batch-fed and continuous pneumatic conveying testing procedures lies in the material feeding method. In continuous testing, the material is conveyed through the pipeline after being loaded into the hopper. For each test, roughly 40 kg of material is fed from the top of the hopper. The tests are conducted at three different rotary valve RPMs, which are 7, 9, and 12 RPM, corresponding to 30 Hz, 40 Hz, and 50 Hz respectively, with varying air mass flow rates. Before loading the material into the hopper, the desired frequency for the appropriate rotary valve RPM is established. Once the frequency is set, the material is loaded into the hopper, and the testing procedure commences. Table 3 shows test matrix of continuous conveying for wood pellets and cottonseeds.
In order to ensure consistency in data analysis throughout this study, the measurement of solid mass flow rate was conducted in a manner analogous to the batch-fed test described in the previous section. Specifically, the entire test duration was gauged through the pressure sensor results, while the material weight was recorded at the receiving drum. The material weight was then divided by the test duration to ascertain the solid mass flow rate.
The approach for selecting the measured pressure drop varied between the continuous pneumatic conveying tests performed on cottonseed and wood pellets. Although both materials exhibited plug flow, cottonseed plugs formed over shorter lengths but in greater numbers per test compared to wood pellets. For wood pellets, at the pipeline’s beginning, particles were observed to roll and form a longer layer of material, resulting in the rear of the plug’s formation, which subsequently moved as a lengthy plug within the pipe. Consequently, the pressure drop trend for cottonseed was characterized by multiple pulses allocated to each formed plug. In contrast, for wood pellets, a linear increase in pressure drop was observed until the plug formation. Once the plug was in place, a single pulse of pressure drop was observed until the plug exited the pipe. Based on these observations, the measured pressure drop for wood pellets and cottonseed was determined as the maximum peak of pulses within the pipeline. This procedure is shown in Figure 5.
Furthermore, load cells have been installed on the receiver of the pipeline to measure the solid mass flow rate. These load cells are connected to a computer and set up to record the mass flow rate at a frequency of 20 Hz.

3. Results and Discussion

This section presents the outcomes and analysis of the present investigation in two distinct sub-sections. The first sub-section deals with the assessment of the model’s performance in conveying biomass through pneumatic conveying in both single-batch and continuous modes. Meanwhile, the second sub-section outlines the proposed optimization algorithm.

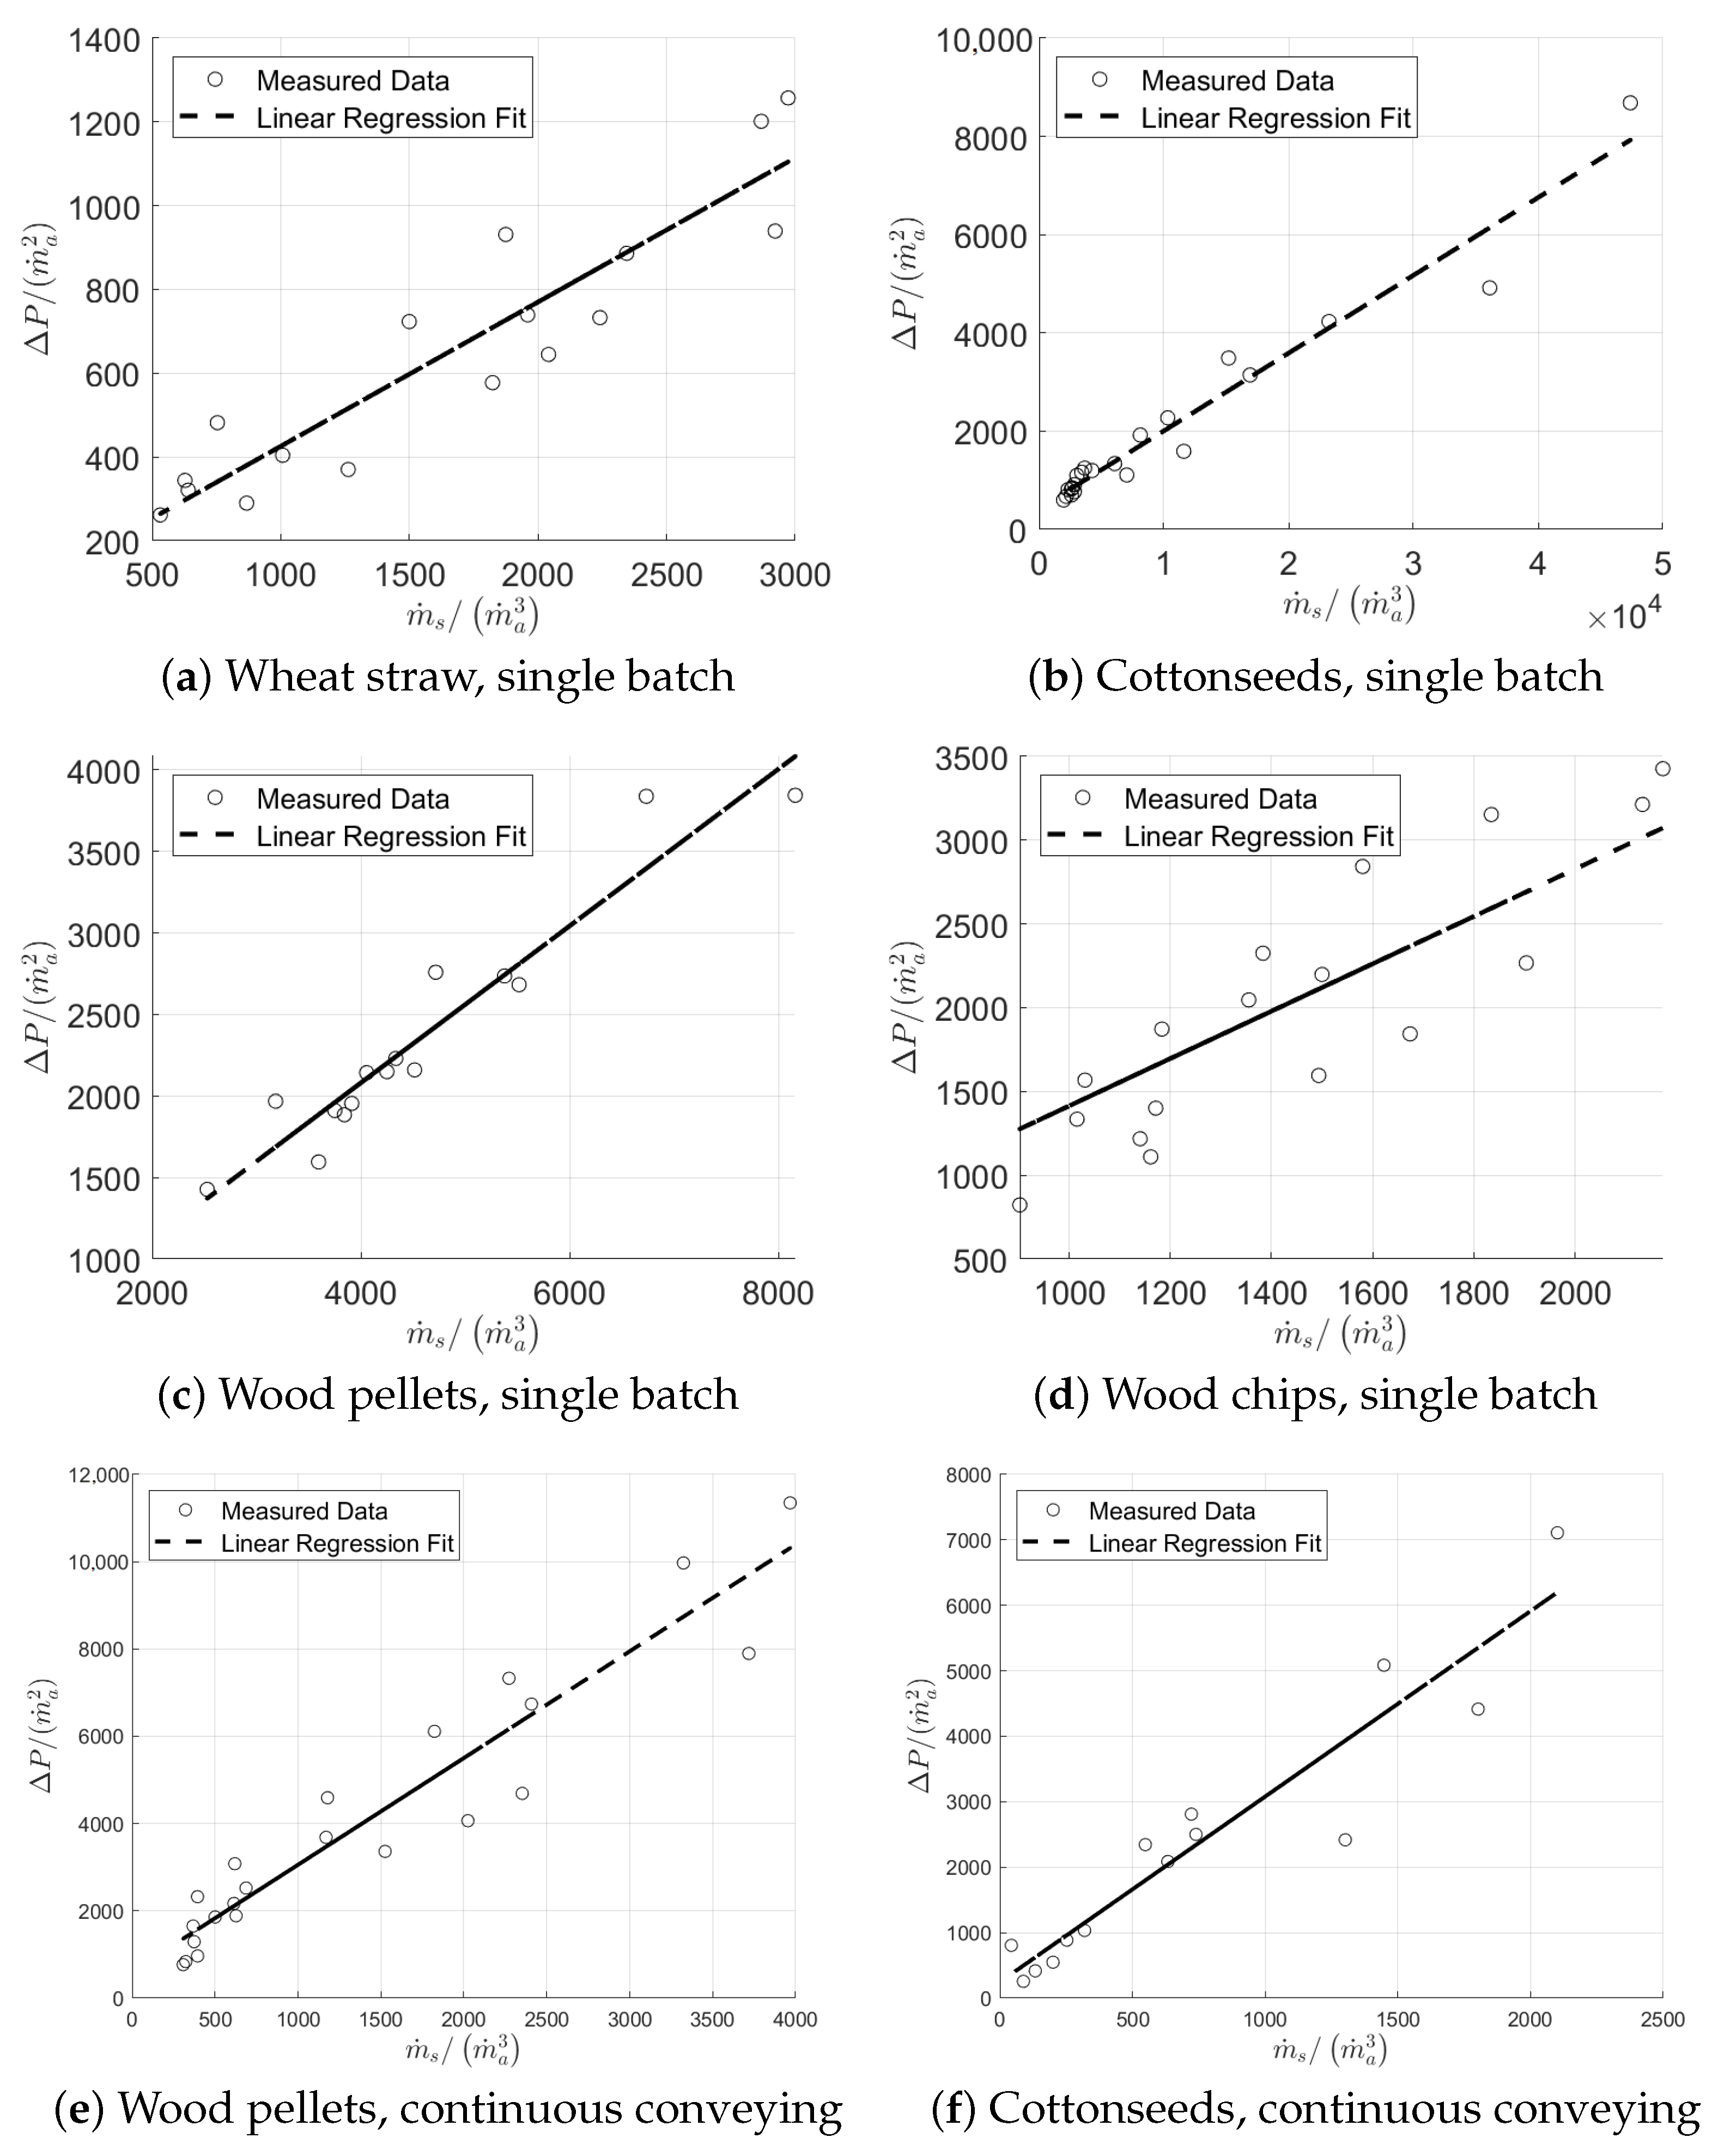
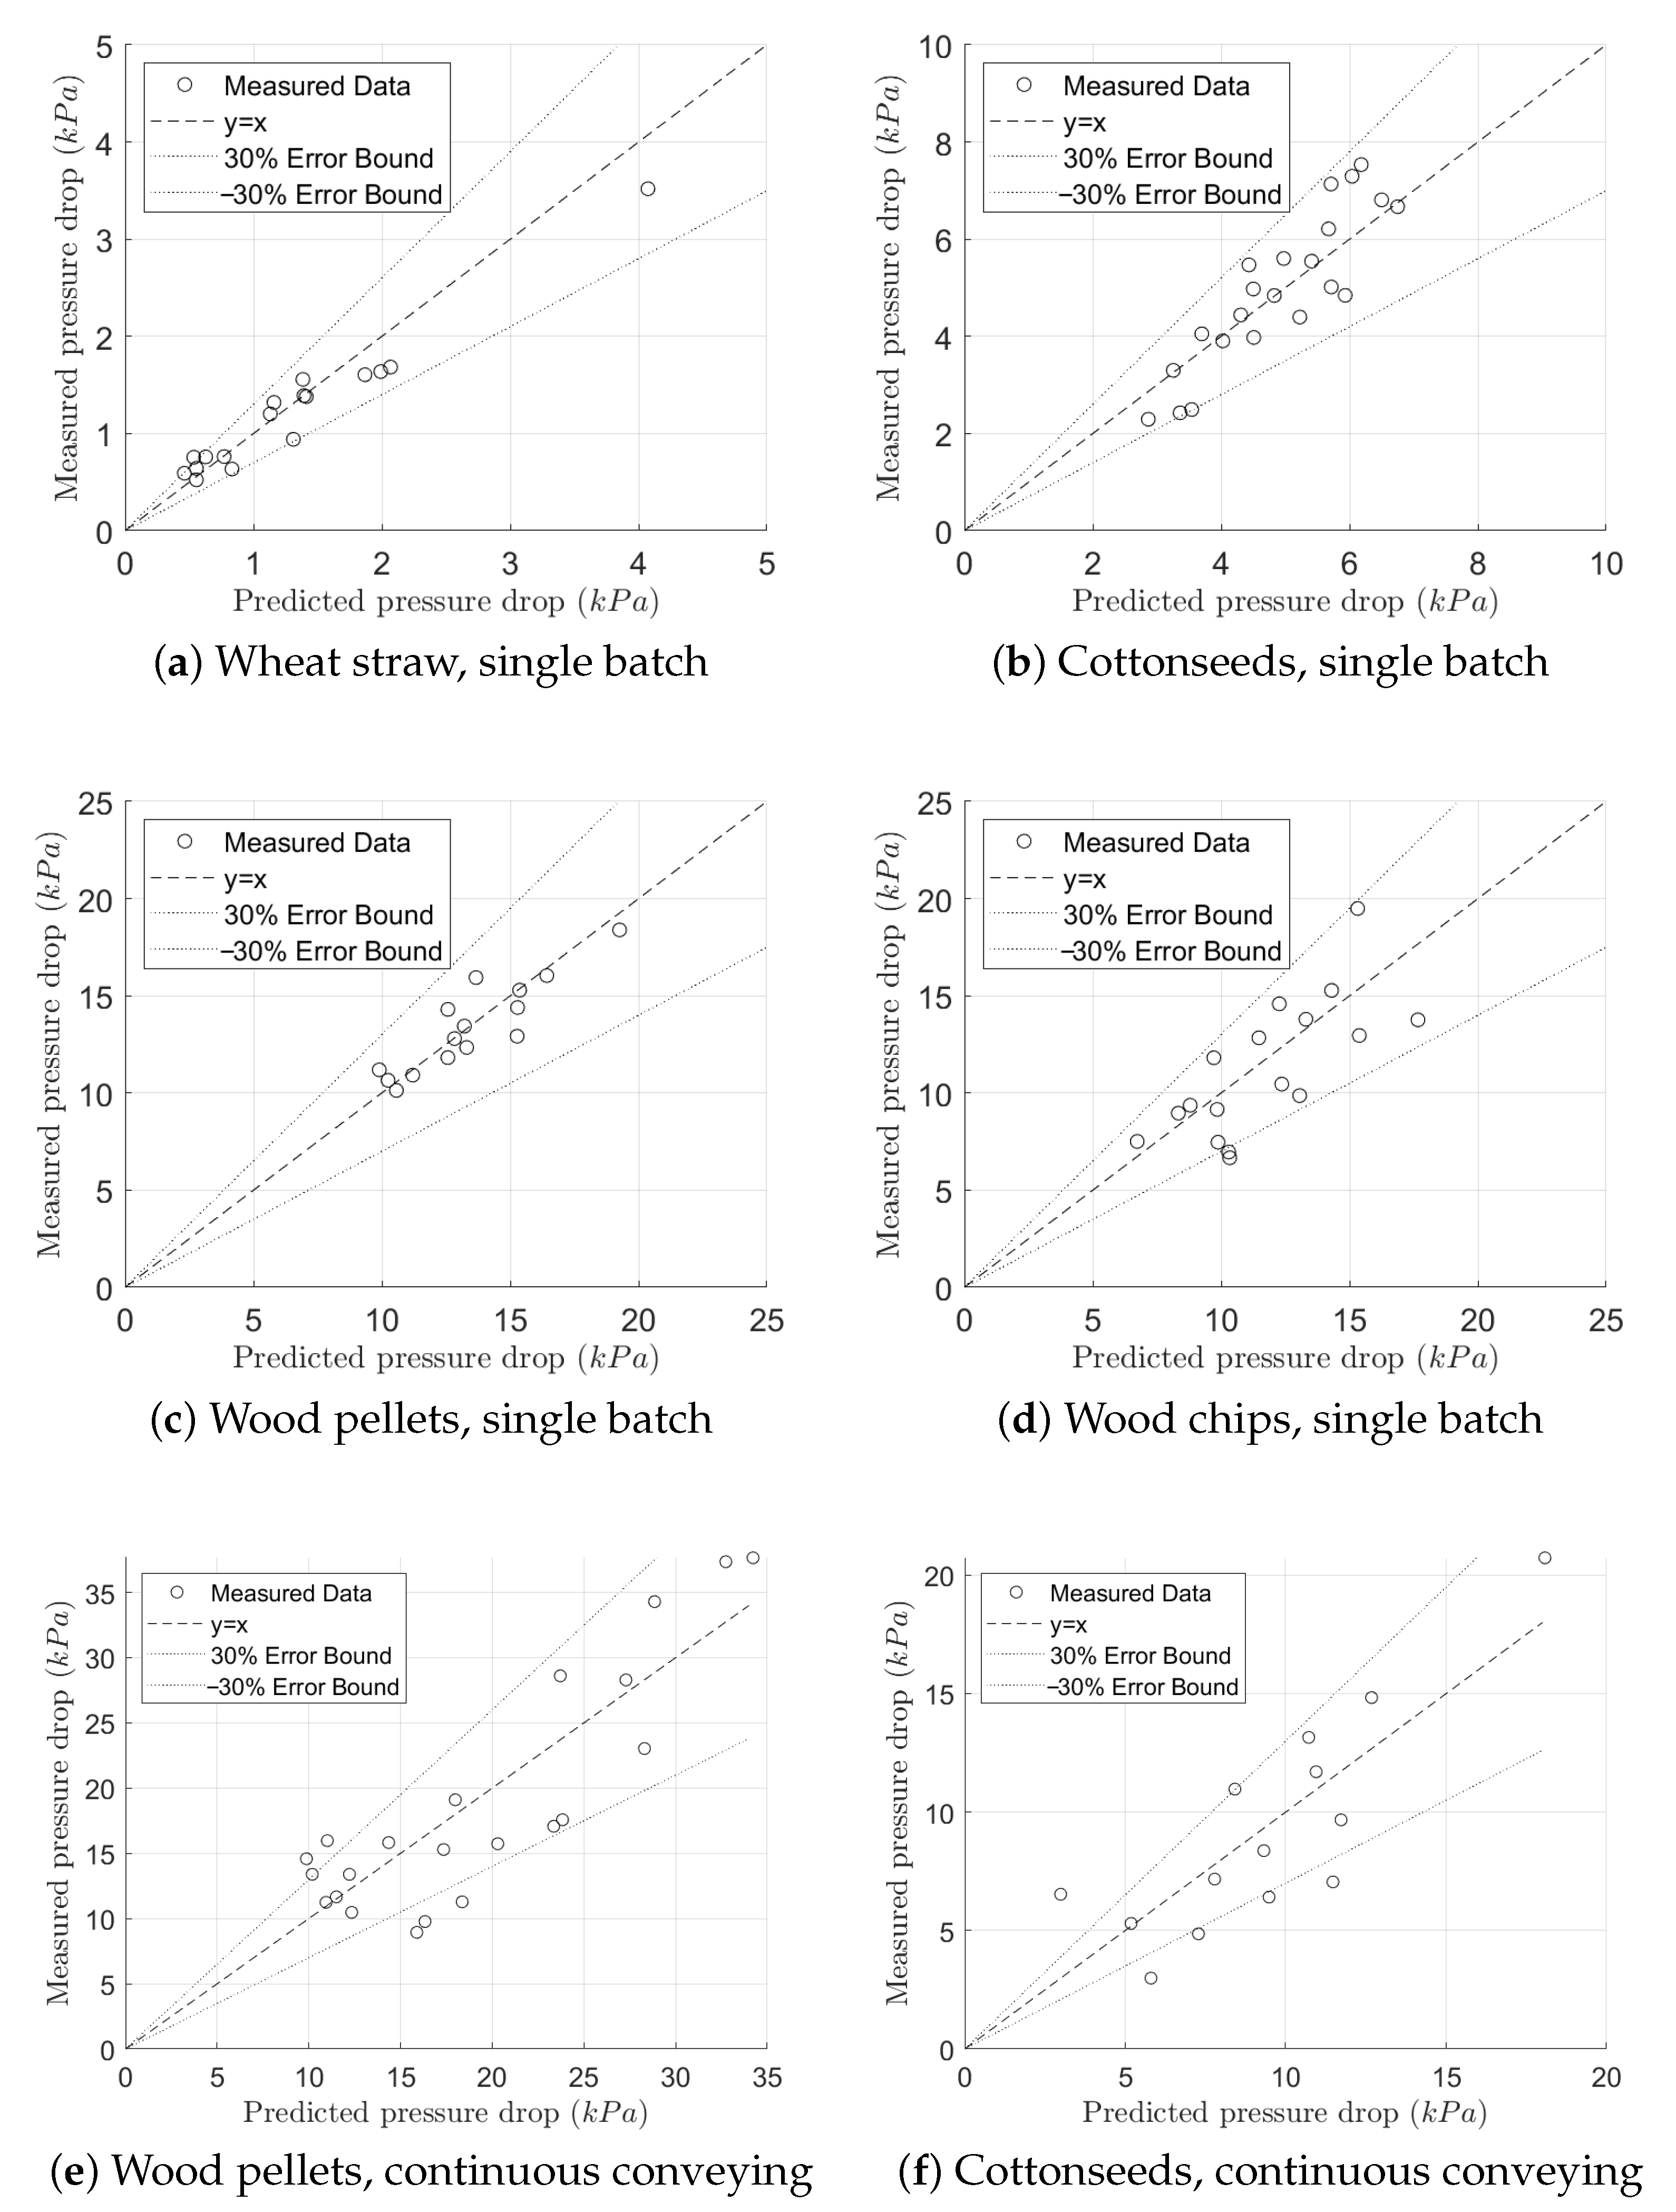
3.1. Analysis of Biomass Pneumatic Conveying Model: Single-Batch and Continuous Modes

This section emphasizes the assessment of the model’s performance as depicted in Table 2 and Table 3. In particular, six experiment sets were carried out, consisting of four series of single batch conveying for four unique materials at two different bed weights, as well as two extra test series performed on cottonseed and wood pellets using three distinct rotary valve RPM settings. Altogether, 132 individual tests were conducted.
In this study, it is essential to mention our previous investigation on cottonseed plug formation [43], which concluded that cottonseed possesses the ability to maintain plug flow during conveying. Rajabnia et al. [43] further emphasized the importance of the rear section of the plug in sustaining its stability throughout the conveying process. Although the author has submitted another paper discussing the performance of three additional materials, the results from all four materials collectively demonstrate their potential to maintain plug flow during both single batch and continuous conveying. Notably, cottonseed displayed a higher level of consistency in maintaining plug flow compared to the other examined materials.
As previously discussed in our prior study and Section 1.1, the initial step of the model involves determination of linearity and identification of constants.Subsequently, Equation (3) will be employed to calculate the predicted pressure, which will then be compared against the measured pressure drop obtained from testing.
Figure 6 demonstrates the achieved linearity for all four materials.
The results from the single batch feeding test series presented in Figure 6a–d indicate that all four materials exhibit a degree of linearity. However, the observed linearity is superior for cottonseeds and wood pellets compared to wood chips and wheat straw. This outcome is in line with the existing understanding that biomass materials possess unique characteristics such as irregular and heterogeneous shape [54]. In particular, wood chips and wheat straw are considered to be the most extreme in this regard, exhibiting a significantly greater particle size distribution and a less consistent particle shape [38]. The literature [55] suggests that high wall pressures, manifested as large fluctuations in pressure, are associated with fewer particle contact points. Therefore, it is plausible that the irregular shapes of wood chips and wheat straw result in fewer contact points with the conveying system walls, leading to an increased incidence of pressure fluctuations. The present analysis highlights that in the case of cottonseed and wood pellets, a higher degree of linearity is observed on the graph as the values approach the origin on the x-axis. This observation is attributed to the fact that in Equation (4), the denominator term containing m ˙ a 3 results in lower x-axis values for higher air mass flow rates. Additionally, the conveying of materials through dense phase conveying is more stable at higher air mass flow rates, leading to a better linearity in the observed trends. Additionally, it is evident that wood pellets exhibit better agreement in pressure drop prediction. This can be ascribed to the conveying nature of this material, as it was observed to convey in a manner more akin to slug flow rather than piston-like plug flow. Consequently, the contact area between the particles and the pipe wall is smaller compared to the other materials, resulting in reduced frictional forces from the wall. Thus, the recorded pressure drop is closer to the final steady-state condition rather than that of the other materials. Moreover, it is apparent that wood pellets demonstrate better alignment in pressure drop prediction. This can be attributed to the conveying characteristics of this material, as it was observed to convey in a manner more similar to slug flow rather than piston-like plug flow, and its highest bulk and particle density compared to the other materials. As a result, the contact area between the batch of wood pellets and the pipe wall is smaller compared to the other materials, leading to decreased frictional forces from the wall.
Furthermore, the results depicted in Figure 6e,f for continuous conveying using a rotary valve indicate a similar behavior, wherein all materials can be conveyed in plug flow. However, at lower air flow rates, there exists a possibility of blockage in the conveying of the tested materials due to the dominant effect of wall friction on the plug. This finding is consistent with the outcomes of Vasquez et al. [55], who concluded that an increase in superficial air velocity results in a nearly linear increase in wall pressure. Therefore, in lower air superficial velocities, a higher pluses of pressure drop will be captured by the sensor which can affect the measured average pressure drop described in Section 2.3.
In order to evaluate the efficacy of the model, the obtained regression constants must be applied to the model to calculate the pressure drop. The resultant predicted pressure drop is then compared to the actual measured values, as depicted in Figure 7. Within a range of 30% error, it is evident that the model aligns well with the empirical data, thereby indicating a satisfactory level of agreement between the predicted and actual pressure drops.
More specifically, in the context of continuous pneumatic conveying experiments which is more widely utilized technique in industry, findings indicate that two materials under investigation possess unique particle characteristics, despite their smaller particle size distributions in comparison to other materials studied. Specifically, cottonseed displays lower bulk density and mechanical cohesion between particles, which can be attributed to the existence of a surrounding fuzz. In contrast, wood pellets exhibit a cylindrical shape and a wider range of particle size distribution with heterogeneous bulk density due to the presence of crushed particles within the bulk [49]. However, it is worth noting that the pressure model employed in the experiments demonstrates excellent performance for both materials, with an error bound of 30 percent.
The results reveal that some data points surpass the 30 percent error threshold. This discrepancy can be linked to the relatively short test section used in this research, measuring only 12 m, which may capture minor fluctuations in the system compared to a longer configuration. Furthermore, in continuous pneumatic conveying, the pressure drop is regarded as the maximum value of pressure pulses within the system, potentially preventing the system from reaching a steady-state condition. Consequently, the implementation of an extended pipeline might enhance system stability and increase predictability.
In particular for the cottonseed, this discrepancy may be attributed to the relatively limited range of air mass flow rates tested for cottonseed as compared to wood pellets. Specifically, in a continuous conveying system where multiple plugs are present within the pipe, at lower air superficial velocities, the movement of a plug can be influenced by the residual material left from the plug in front. Such changes in plug movement can translate to fluctuations in the pressure drop, which is a response of the system.
Based on the results, it can be inferred that the model employed in this study exhibits a high degree of sensitivity to the accurate extraction of its constants. In order to further refine and optimize the model, a thorough understanding of the impact of these constants on the model’s performance is required. The subsequent section of this study will center on this matter, with the aim of providing a deeper understanding of the efficient extraction of these constants.

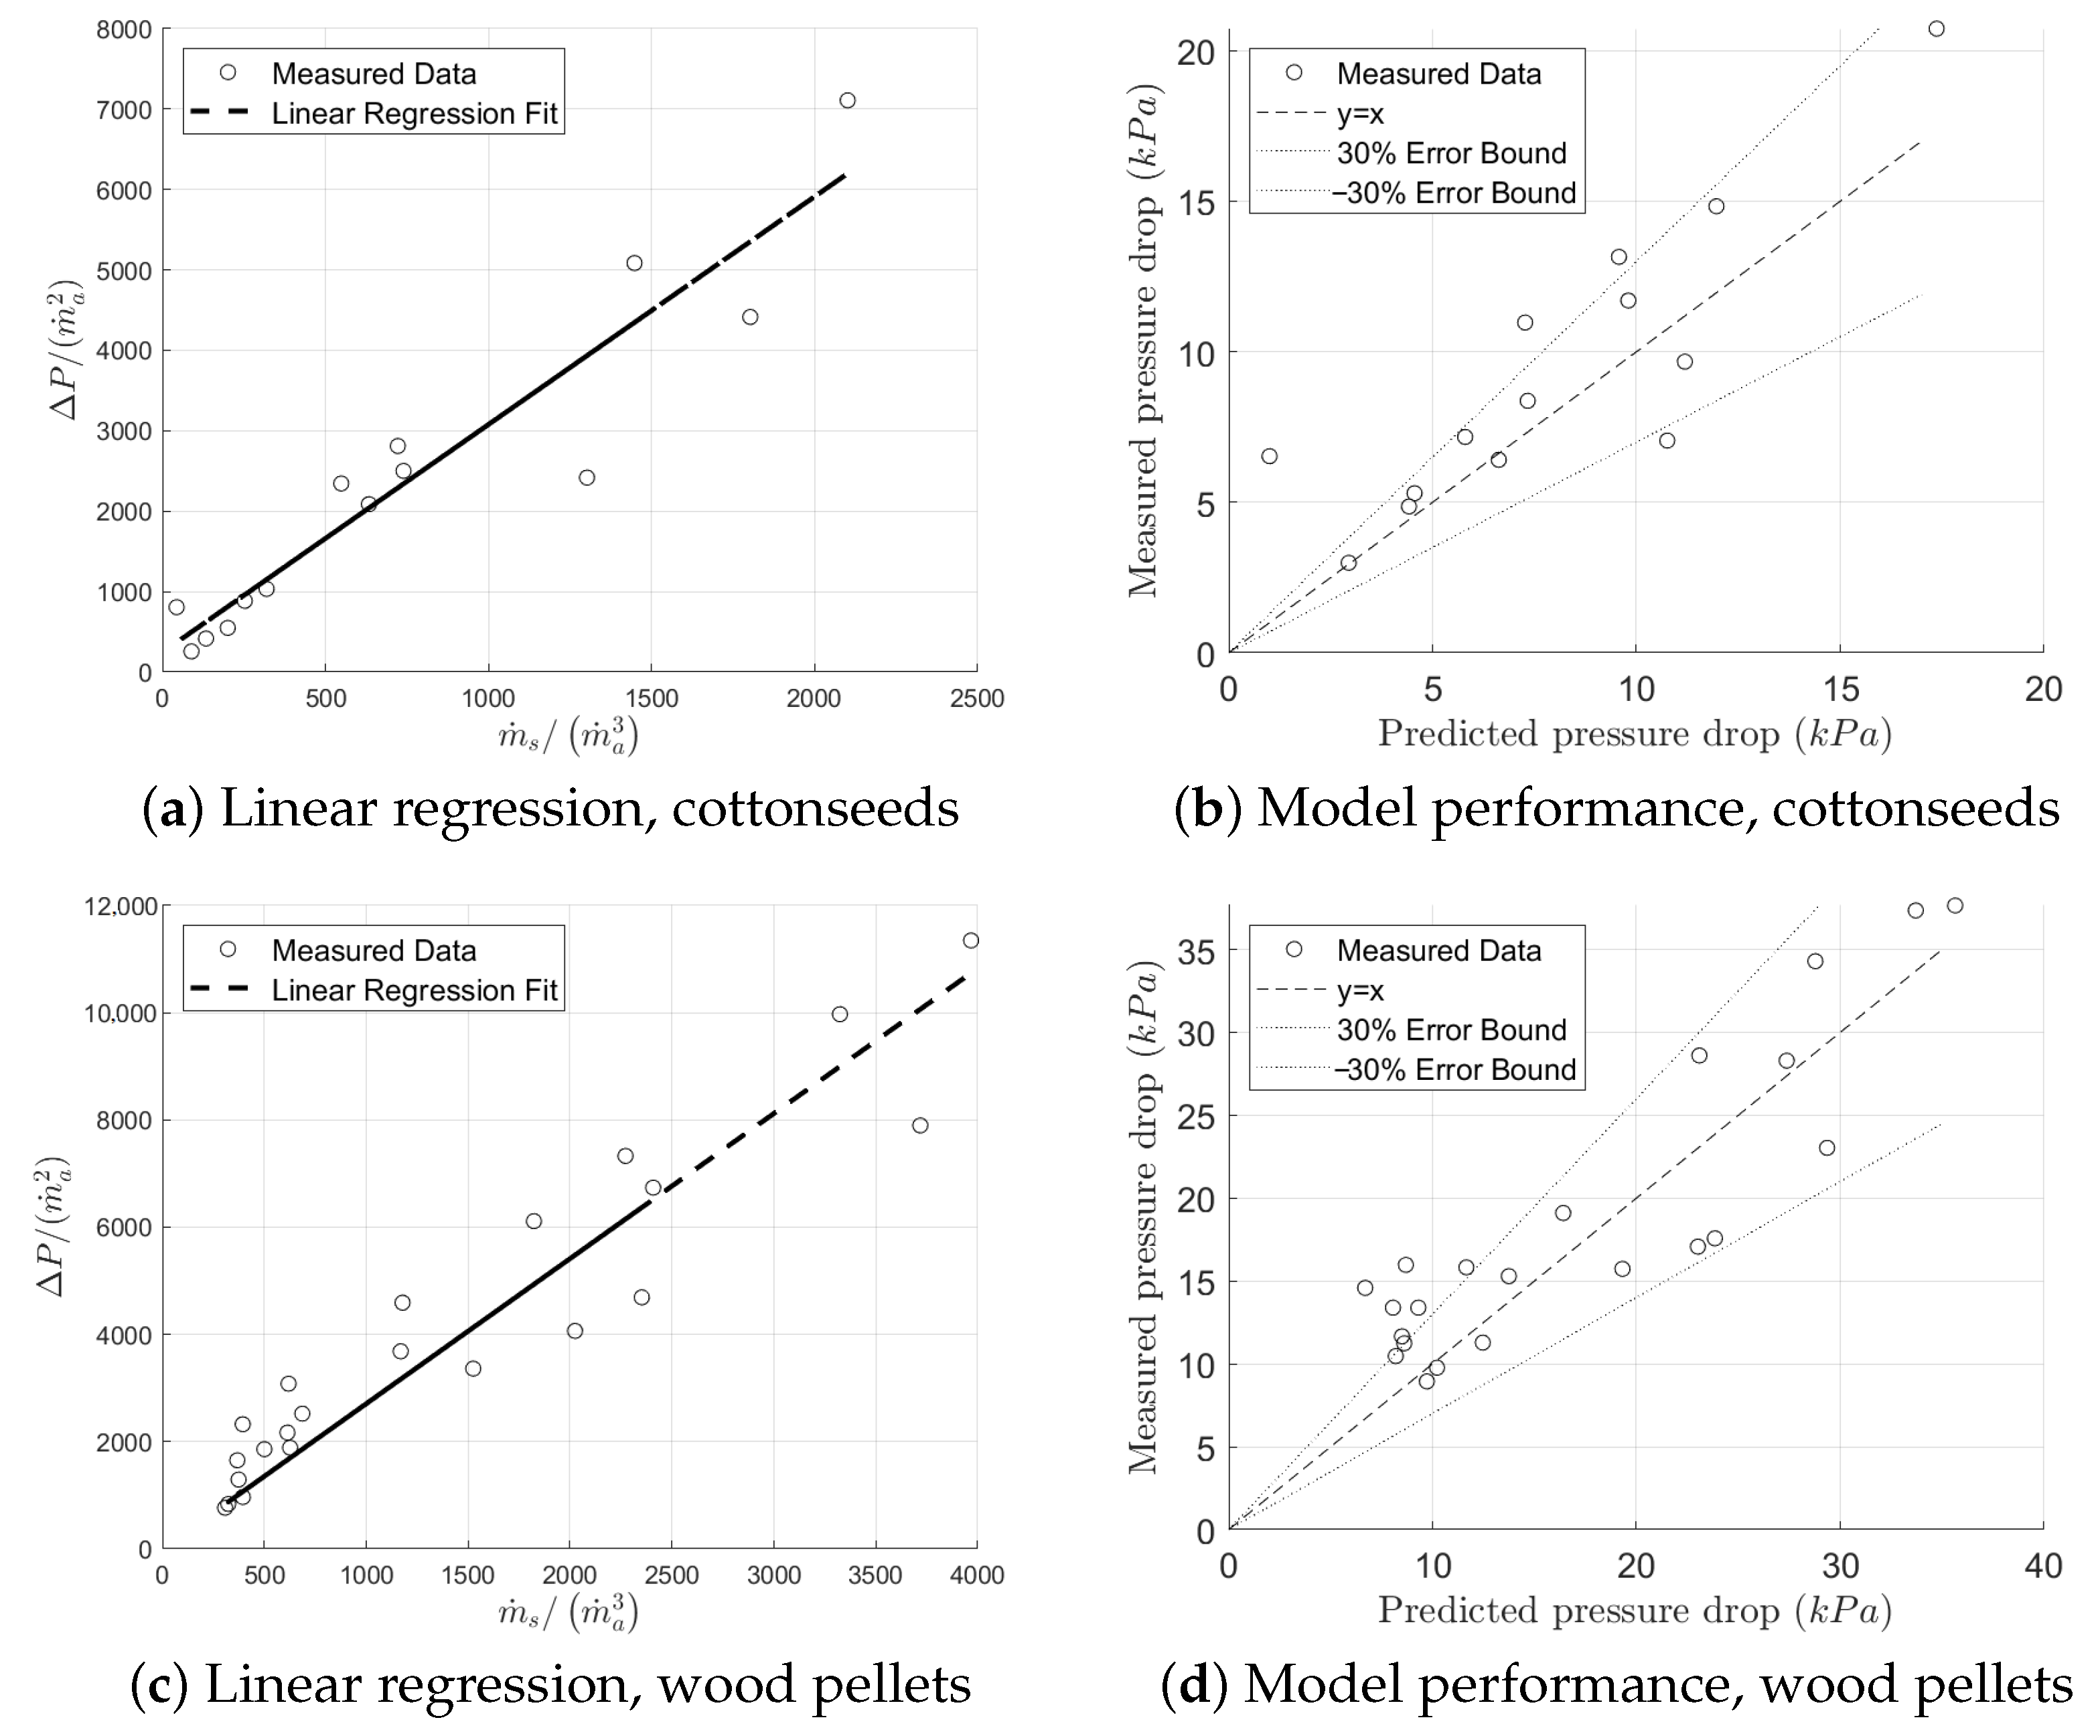
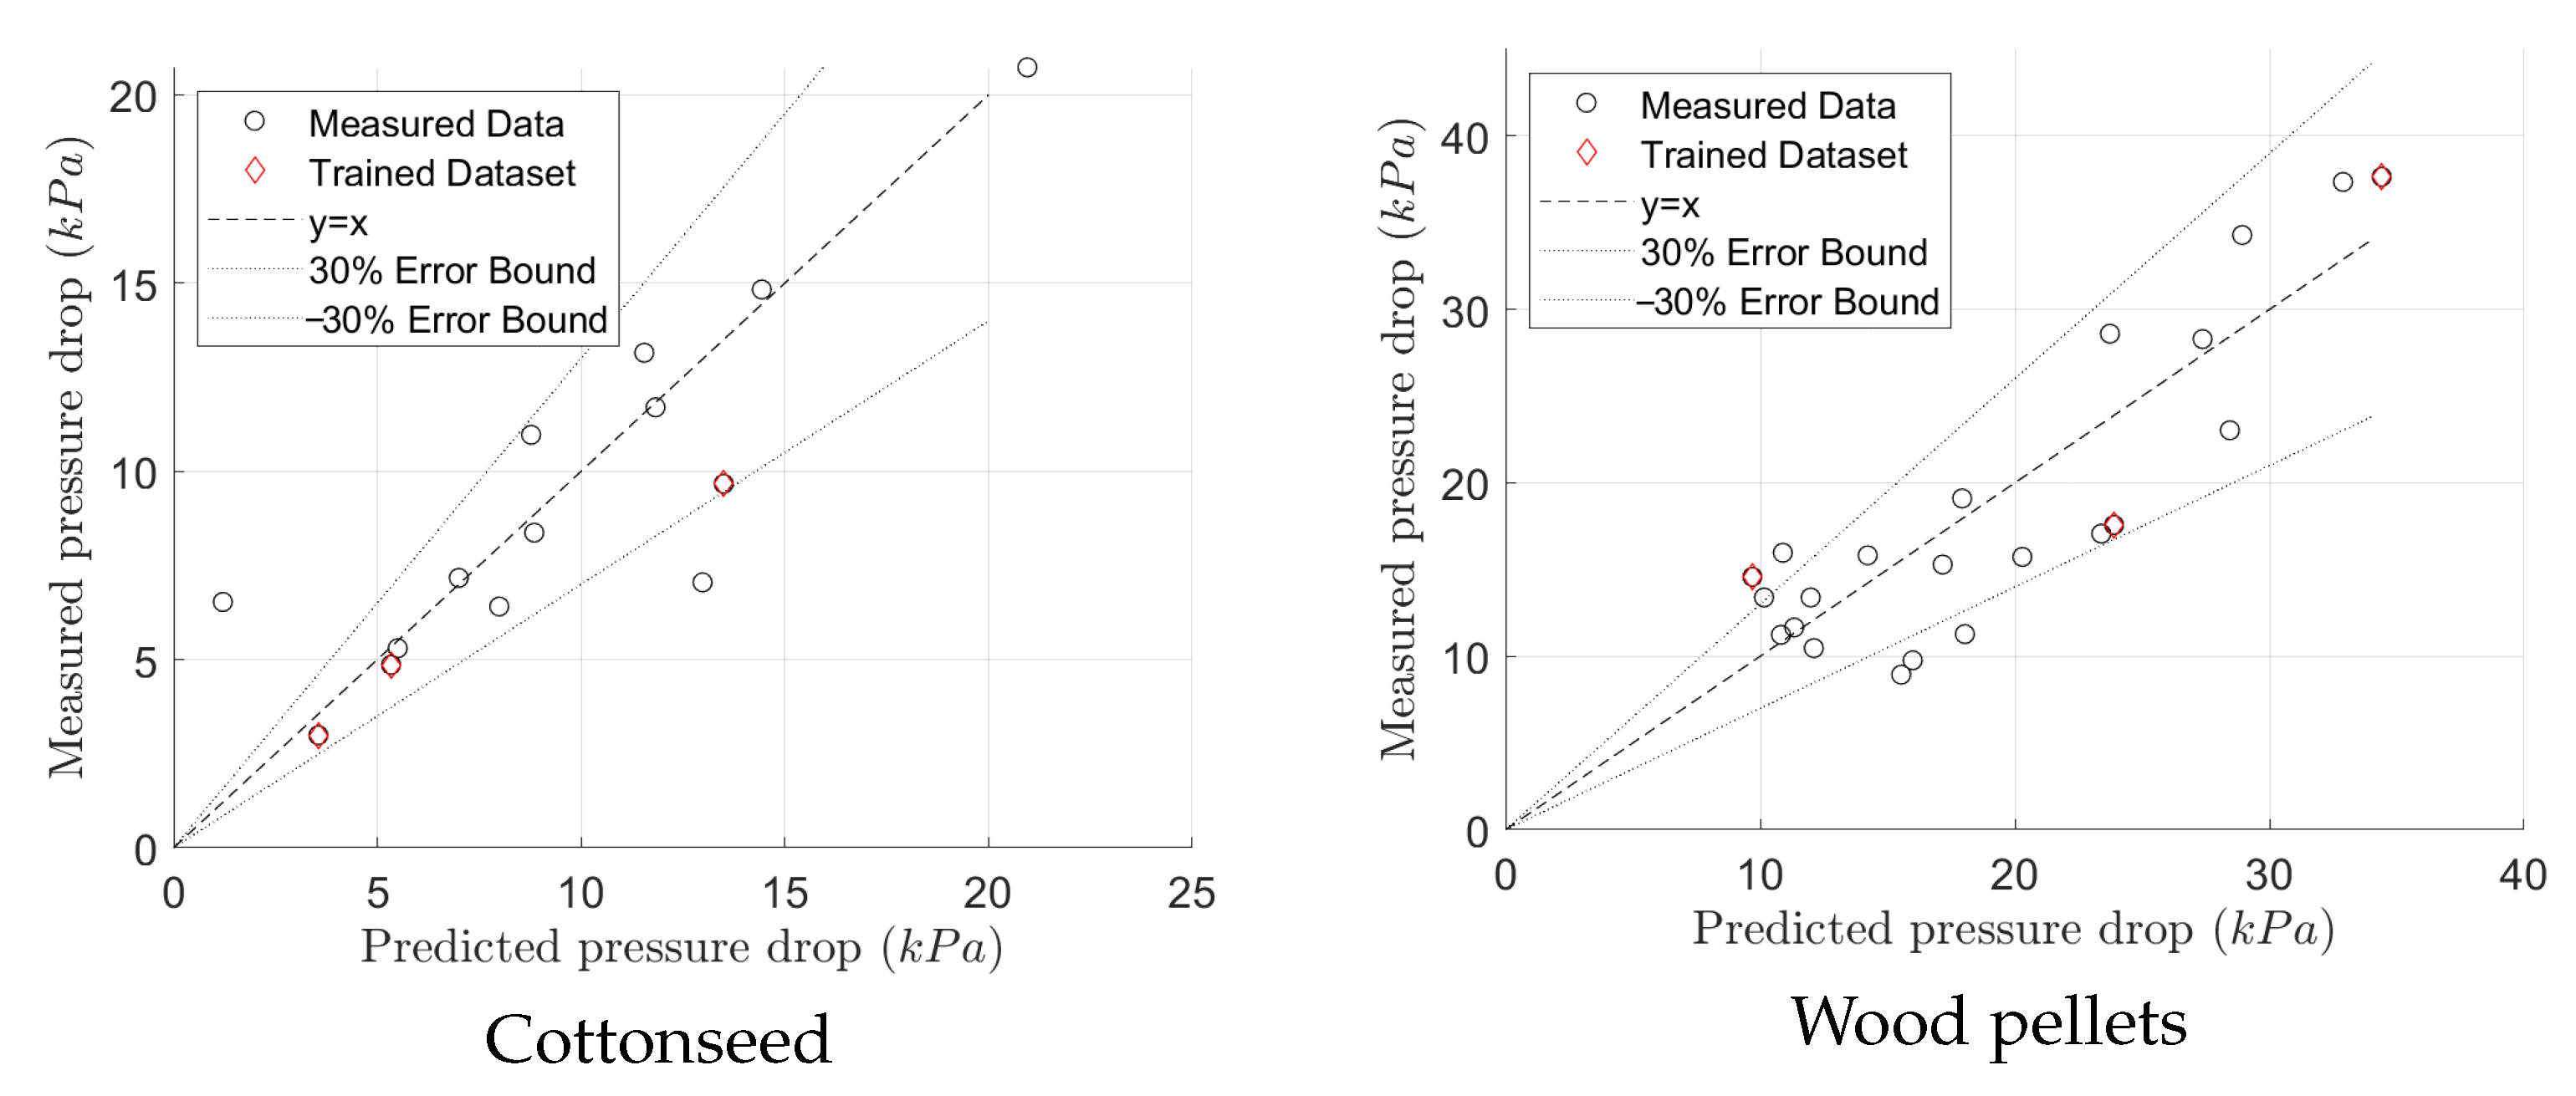
3.2. Model Optimization

As previously discussed, the present model offers the advantage of eliminating the need to calculate the solid friction factor, as seen in similar pressure models that comprise two components: air and solid. However, to predict the pressure accurately, this model requires trial tests to obtain the constants. This study aims to address two questions that may arise regarding this matter. Firstly, what is the minimum number of trial tests required to achieve optimal results from the model, and secondly, what are the criteria for selecting the conditions for the minimum number of trial tests to use the model effectively. Providing valid answers to these questions can significantly benefit the industry by reducing the cost of trial tests.
In order to address the research questions posed in this study, a methodical approach comprising several stages has been adopted, which can be represented as an algorithm. These stages are delineated as follows:
1.
Assess the impact of constant parameter sensitivity on the pressure model outcomes.
2.
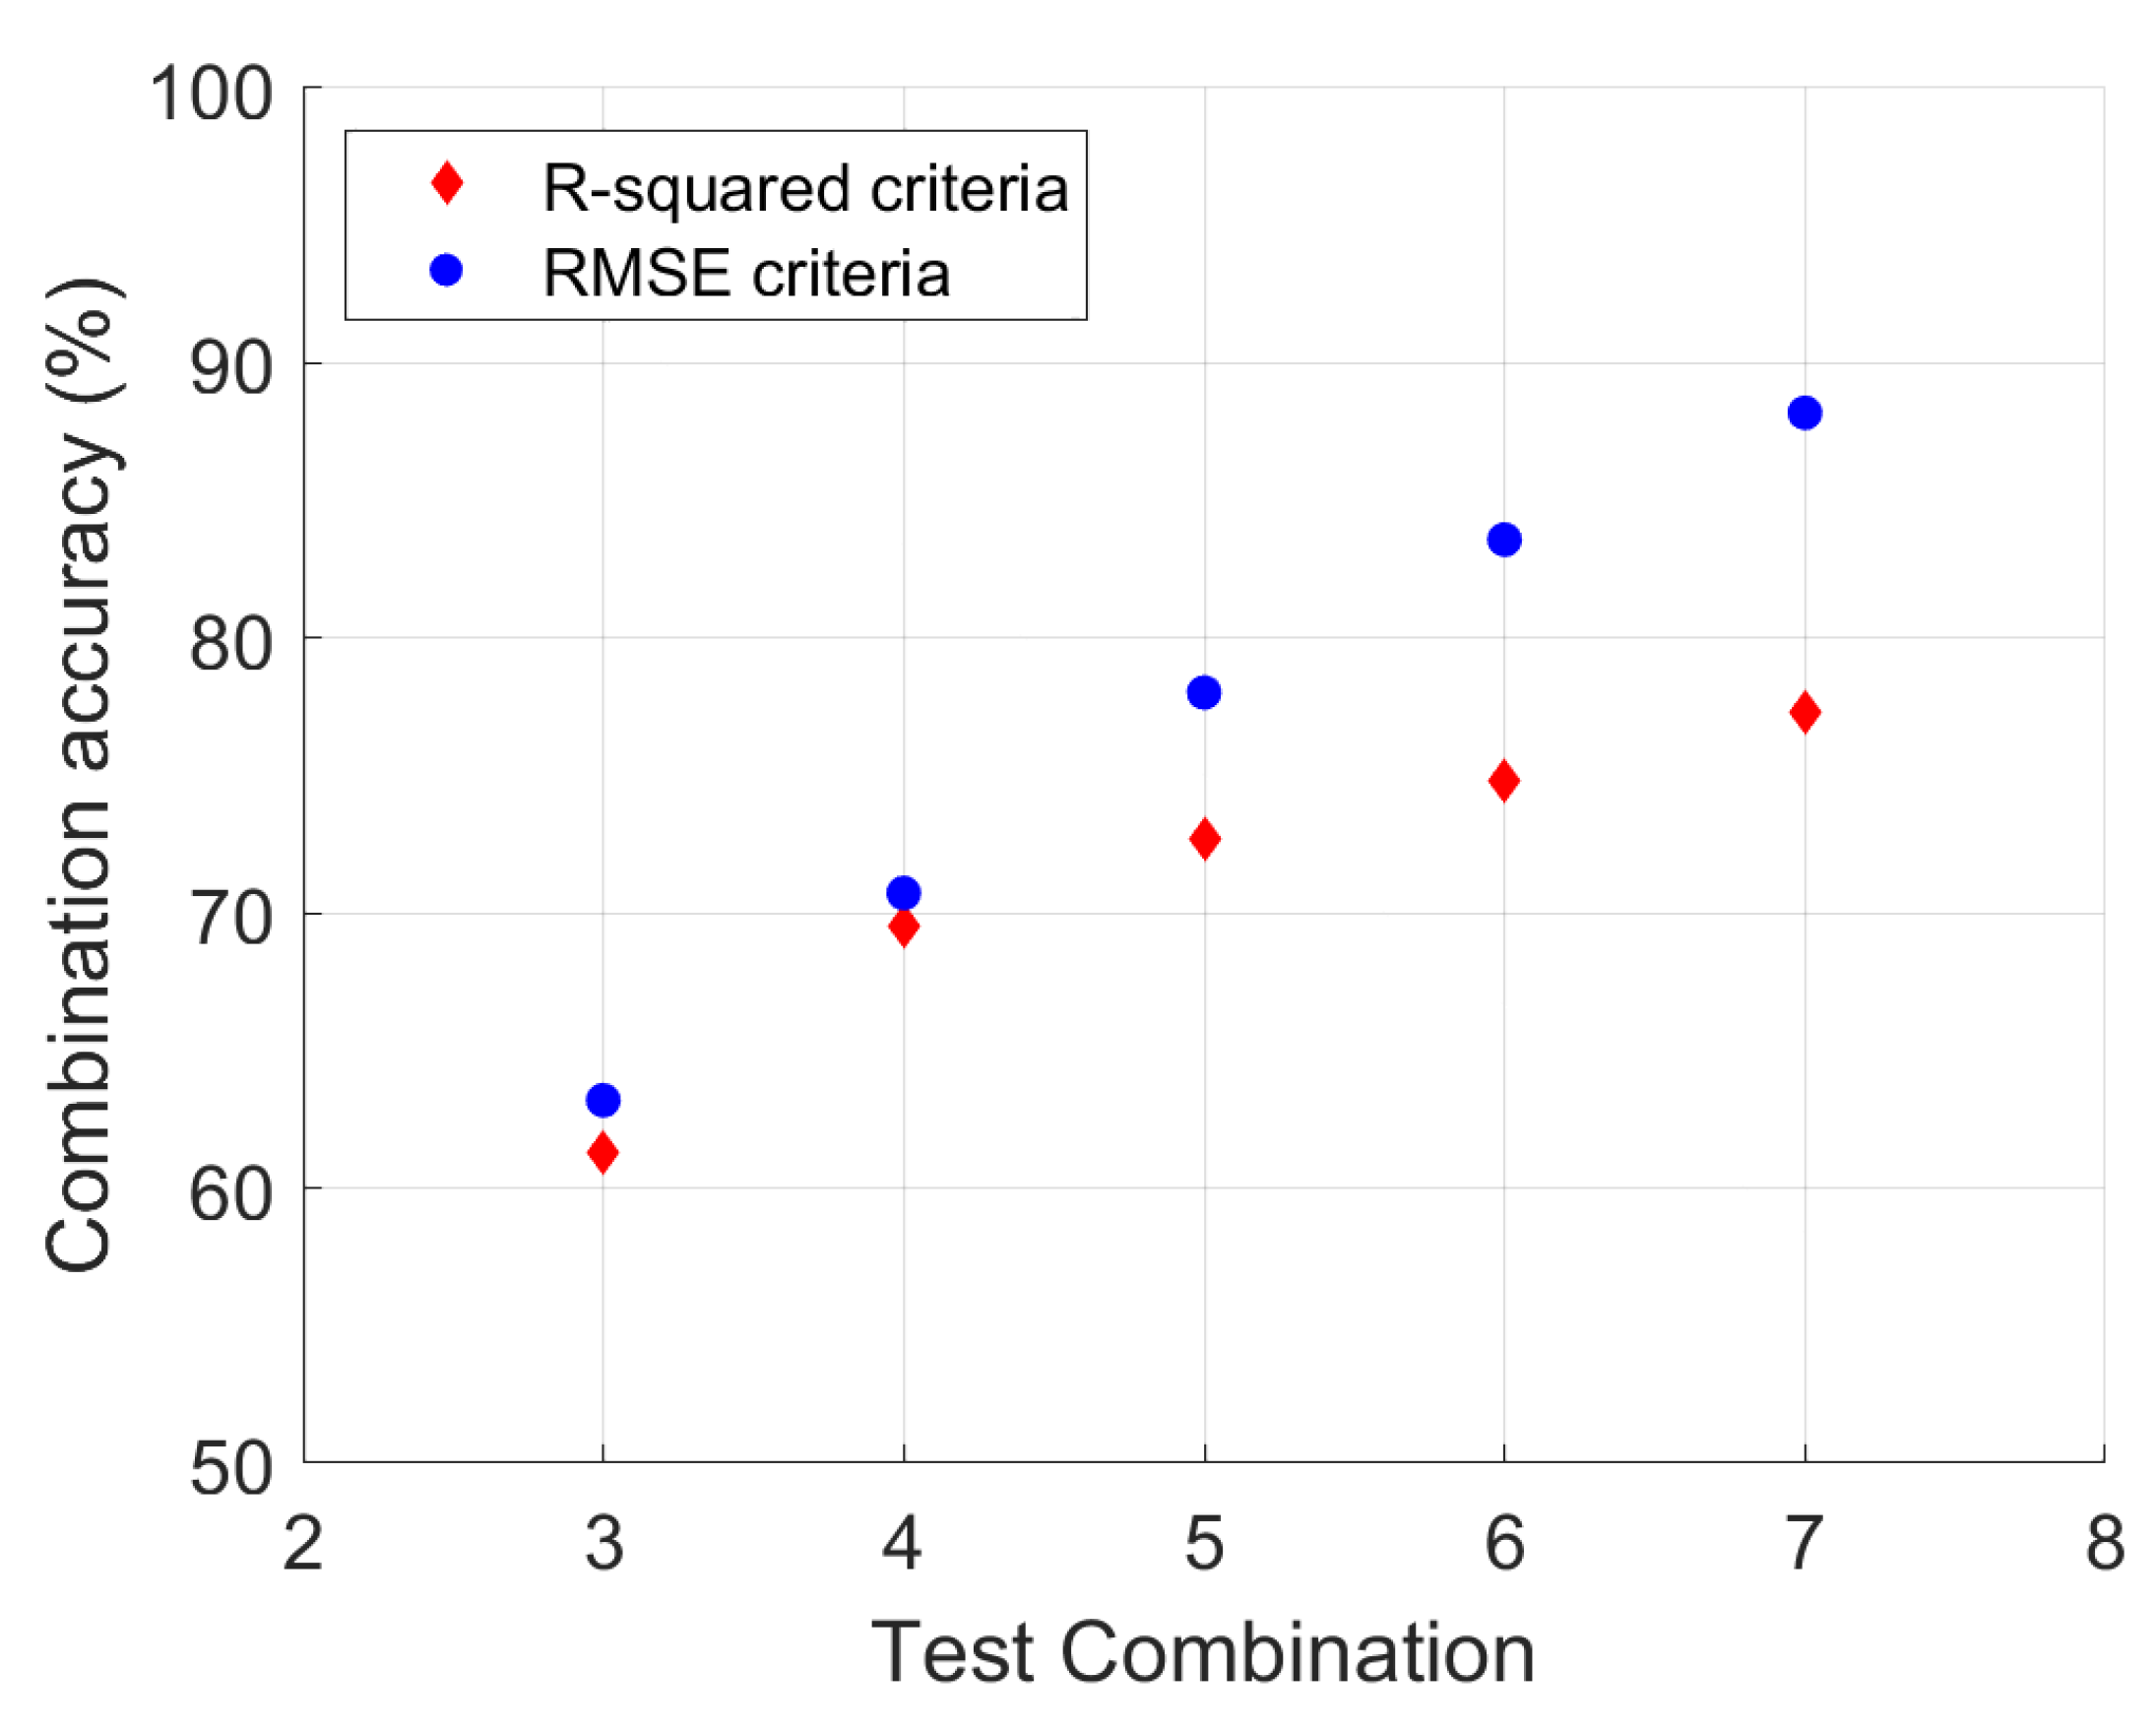
Identify various combinations of test sets, denoted as C ( m , n ) , where m signifies the total number of tests for a specific test series (e.g., single-batch conveying of wood chips), and n represents the distinct combinations that can vary from 2 to ( m 1 ) .
3.
Establish an R-squared value to evaluate the accuracy of the linear regression fit, and employ the Root Mean Square Error (RMSE) metric to gauge the precision of the predicted pressure.
4.
Determine the proportion of C ( m , n ) outcomes that adhere to the acceptable error range.
5.
Iterate through the preceding four steps to identify the appropriate value of n.
6.
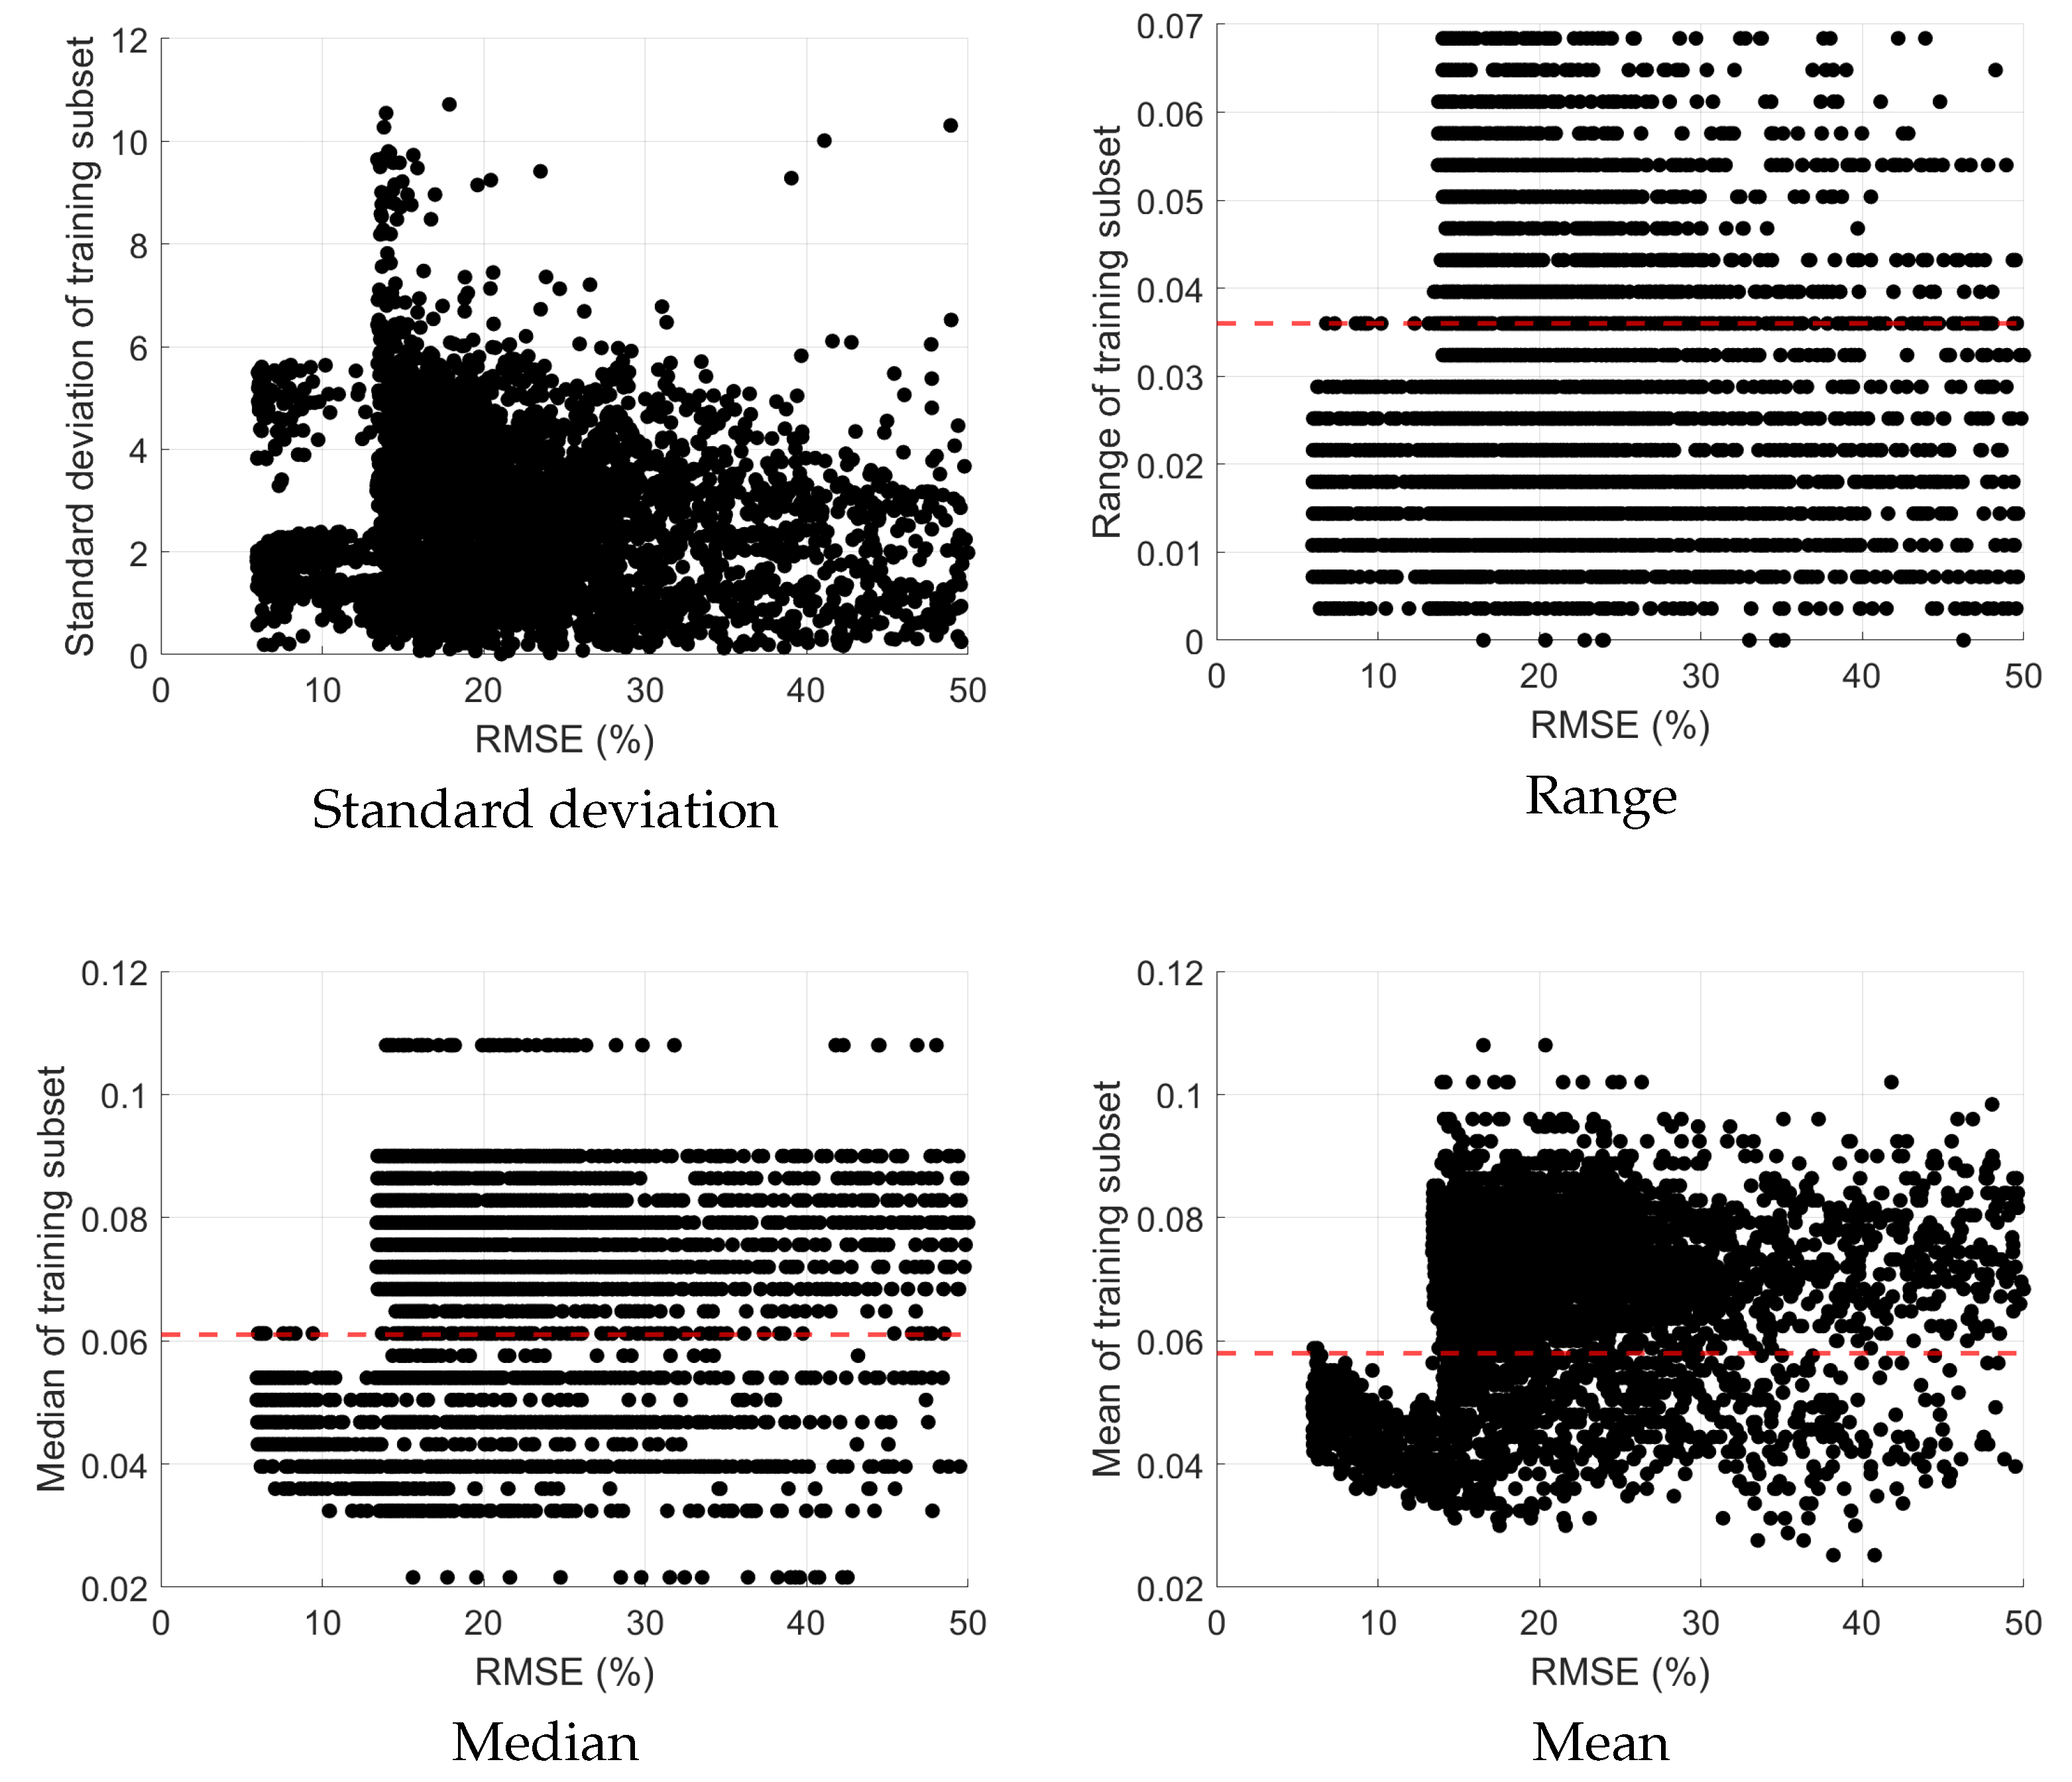
Investigate potential correlations between the input parameters of the n tests and the corresponding error to identify meaningful patterns.
In order to provide a more detailed explanation of our approach, we will outline each step of the algorithm in greater detail.
Firstly, we begin by examining the linear fit coefficient for different materials and two sets of experiments: batch feed and continuous pneumatic conveying. The achieved coefficients from the tests conducted in this study are presented in Table 4. These coefficients are used to represent the intercept of the y-axis in the model, denoted by a, and are multiplied by the squared air mass flow rate. The slope of the linear fit, denoted by b, is the multiplication of the solid ratio in the model.
Our previous study [44] provided a detailed analysis of the sensitivity of the pressure model to the constants and their impact on model performance. The investigation found that the a coefficient, which counteracts the effect of the air component in the model, has little influence on the results. However, a zero value for a would likely result in an underestimation of the pressure. Our previous study also concluded that the constants are highly dependent on the system configurations.
In this current study, we aim to further investigate the effect of the constants on the model’s performance. The experimental findings shown in Table 4 reveal that when comparing single batch and continuous conveying of cottonseeds and wood pellets, the slopes are generally lower for single batch conveying. This observation aligns with the understanding that in single batch conveying, the plug length is intentionally limited to a specific length due to the fixed weight of the bed. Consequently, this results in a smaller constant b in the model, which accounts for the solid component, as compared to continuous conveying where the solid component is more dominant.
To further examine the impact of a zero value for a in this study, we conducted a survey of the results, which are depicted in the Figure 8 showing the predicted pressure drop for continuous conveying of cottonseed and wood pellets.
The results presented in Figure 8 demonstrate that there was no significant difference in the linear fit when forcing it to pass through the origin. However, it should be noted that the proposed model is more likely to underestimate the pressure drop when the intercept value is forced to zero, as it does not consider the contribution of gas pressure drop inside the system. Despite disregarding the a coefficient, the model still operates effectively. It is worth noting that the boundary conditions of the linear fit require that both constants must be positive, while the intercept can be zero.
Hence, In light of the fact that the constants have a significant impact on the accuracy of the linear fit and the pressure model in predicting the pressure drop, and given the objective of this study to determine the minimum number of trial tests needed to obtain the most precise constants, we will evaluate the accuracy of both the linear fit and the pressure model at each stage of the study. To accomplish this, we will use the R-squared value as the measure of the accuracy of the linear fit, and the Root Mean Square Error (RMSE) will be employed to verify the predicted pressure against the measured pressure drop. In this study, we used the RMSE error in percentage form due to its benefits in interpreting and comparing the model’s performance. Expressing RMSE as a percentage enables easier understanding of the error magnitude and facilitates better comparison between models or datasets. Furthermore, it maintains consistency with other percentage-based metrics, such as the R-squared value, resulting in a more coherent presentation of results. Ultimately, using the RMSE in percentage form provides a more intuitive understanding of the model’s accuracy and its potential applications.
In the second step of the proposed algorithm, the optimal number of tests required to obtain accurate results is determined by identifying the combination of tests that can provide results equivalent to conducting the entire series of tests. Specifically, combinations of n tests for each series of tests were identified as the training data. Linear regression was performed on the training data and compared with the linear regression of the entire series of tests, which served as a reference to determine the R_squared value. Subsequently, the training data was utilized to predict the pressure drop for the entire series of tests, defined as the validation data, and compared with their corresponding RMSE values.
The study defines R_squared of 0.8 and RMSE of 20 percent as the criteria for model accuracy. Specifically, if the linear regression of training subset data results in an R_squared of 0.8 or higher compared to the reference linear fit and an RMSE error of less than 20 percent compared to the measured data, those subset data are considered suitable as trial tests. Since n = 3 represents the minimum and ideal number of trial tests, the procedure commences with combinations of three tests. Table 5 presents the number of subset data involving three tests, which corresponds to the second step of the algorithm. Additionally, The R-squared and RMSE columns in the table represent the proportion of training data subsets that achieve acceptable results in pressure prediction. These subsets are evaluated using the R-squared and RMSE values as indicators of their performance.
For a subset to be considered acceptable, its R-squared value must exceed 0.8, indicating a strong correlation between the predicted and actual pressure values. Additionally, the RMSE value of a subset should be less than 20%, reflecting a low level of error in the predicted pressure values compared to the actual values.
By applying these criteria to each subset, we calculate the percentage of subsets that meet the acceptability thresholds, which is then presented in the table.
As observed in Table 5, despite the single batch test of wood chips exhibiting the lowest percentage of three-test groups meeting the established criteria, the other test series demonstrate that a minimum of 40 percent of any three-test subset selections can fulfill the specified requirements. As previously mentioned, wood chips were tested solely in single batch conveying. Despite the persistent presence of a plug with low conveying in the system, it is more likely for the plug to collapse within the pipe, which could influence the system’s steady-state condition. In other words, a more extended and continuous system would offer enhanced stability in pressure, thereby improving the model’s performance, as discussed in earlier studies. However, as the primary objective of this study section is to optimize the selection of the best subset of training data, the focus should remain on the three-test groups capable of predicting pressure for an entire independent test series. Consequently, since each material has at least one three-test subset that can accurately predict the system’s pressure, it is sufficient for consideration.
As a reference, Figure 9 demonstrates an example of the model’s ability to predict the validated dataset using a group of three trained test subsets in continuous conveying of cottonseed and wood pellets. The subset of cottonseed exhibited an R-squared value of 0.94 and an RMSE of 14.26%, while the subset of wood pellets displayed an R-squared value of 0.89 and an RMSE of 15.36%. These results are indicated by the red markers in the figure.
As depicted in Figure 9, a subset of three tests can effectively predict the entire set of conducted tests within an acceptable error bound. The algorithm presented demonstrates that carrying out three trial tests allows for the extraction of the model’s coefficients, which can subsequently be used to predict the pressure drop accurately. While the combination of three tests exhibits strong performance, increasing the number of trial test selections to 4, 5, or 6 tests could further improve the accuracy. This enhancement corresponds to the completion of stage 5 of the algorithm.
The accuracy of selecting a subset of data to improve the model’s performance is investigated by examining the combinations of C (n, 4), C (n, 5), C (n, 6), and C (n, 7) in continuous conveying of cottonseed, as shown in the Figure 10. The results demonstrate that increasing the number of training subsets exponentially increases the likelihood of choosing a subset to predict accurately the pressure drop for all data points in a system, with a more significant improvement in the RMSE error than the R-squared. Specifically, among all combinations of tests, the number of combinations meeting the criteria for the R-squared increases relatively weaker than that for the RMSE. Thus, although the R-squared may be less than 80%, the model’s performance in predicting the pressure improves with an increasing number of trial tests.
The primary objective of the final phase of the algorithm is to further enhance the likelihood of selecting the most accurate subset of training data. To achieve this, a total of 5259 combinations of three tests are generated, encompassing various subsets. The proposed approach involves treating the air mass flow rate as the input data and evaluating the model’s performance using the root mean square error (RMSE) as the output metric.
An investigation is conducted to examine the relationship between the key descriptive statistics of the training subsets, namely standard deviation, range, mean, and median, and the RMSE error. The findings are presented in Figure 11, which offers insights into the connection between the training data’s statistical characteristics and the performance of the model. As observed from the results, there is a notable shift when the error is approximately 15%. This point is taken as a reference to identify patterns, and the red solid lines demarcate the values of range, median, and mean of subsets that have an error exceeding the reference value. The percentage of points above the red line is subsequently computed.
The findings reveal that 76% of mean subsets and 72% of median subsets lie above the red lines, indicating that the selection of a three-test subset in these cases would certainly result in an error greater than 15 percent.
The results also indicates that the model’s performance is strongly influenced by the distribution of the training data, with increased dispersion leading to less accurate predictions. Consequently, it is advisable to prioritize the selection of training subsets that exhibit lower values for standard deviation, median, mean, and range, in order to reduce the model’s error rate and improve its overall accuracy.
Further exploration into the underlying causes of this observed relationship unveils a potential mathematical rationale. Considering that the cubic term of the air mass flow rate is present in the denominator of Equation (4), lower flow rate values correspond to the highest values on the linear regression fit. As the intercept values are negligible compared to the highest values on the linear graph, a valid dataset for the constants can be obtained from a subset of three tests.
Additionally, it has been noted that as the air mass flow rate decreases, the impact of the model’s solid part becomes more pronounced, which in turn results in a more accurate prediction of the slope of the linear fit. This slope is a dominant factor in determining the model’s accuracy. Consequently, within this range of air mass flow rates, the model is capable of providing valid and acceptable constants for predicting the pressure across the entire system.
Therefore, the observations from this portion of the algorithm suggest that selecting a subset of three trial tests with air mass flow rates in close proximity and at lower values that can stably convey the material significantly increases the probability of generating accurate constants for the model, as shown in Equation (3). This, in turn, enables the prediction of pressure drop across a broader range of air mass flow rates.
This paper focused on assessing the effectiveness of the proposed model using various types of biomass. However, it is important to note that the study is conducted in a straight pipeline with a length of 12 m. For future studies, it would be intriguing to investigate a wider range of materials in a longer pipeline that includes bends. This would provide a more comprehensive understanding of the model’s performance in more industrial scale of conveying scenarios.

4. Conclusions

This study advances the authors’ previous research on proposing a pressure model to predict pressure drop in pneumatic conveying systems. The study aims to address two questions concerning the pressure model: (1) the comprehensiveness and functionality of the proposed model for complex materials such as biomass, and (2) the minimum number of trial tests required for the model to maintain its effectiveness in predicting system pressure.
To answer these questions, a series of tests were conducted using two different test configurations and four biomass materials: cottonseeds, wood pellets, wood chips, and wheat straw. The first test configuration involved single batch conveying with an artificial plug formed at the bottom of the pipe, while the second configuration incorporated a rotary valve and hopper for continuous material feeding. The performance of the model was assessed, and the results demonstrated its ability to predict pressure within an error bound of 30 percent.
Regarding the second research objective, different training subsets of trial tests were selected using combination analysis, C ( m , n ) , where m represents the total number of tests and n denotes the training subset. Model effectiveness was evaluated by examining R-squared values from linear regression and root mean square error (RMSE) values for predicted versus measured pressure in validation data. Results indicated that when considering R-squared as the validation measurement, when using R-squared as the validation metric for wheat straw, there is an 80 percent likelihood of choosing a trial test combination capable of predicting pressure within an acceptable error range ( R 2 0.8 ) . When employing RMSE as the validation criterion and maintaining an accuracy level of RMSE = 20%, the probability of achieving this level can reach up to 60 percent for cottonseeds.
Further investigation of the optimization process involved examining key descriptive statistics, such as standard deviation, median, and mean, for subsets of three, with air mass flow rate as the input and RMSE as the output. The findings suggested that selecting inputs within lower ranges and closer to each other increases the probability of avoiding subsets with higher error rates than the acceptable range by up to 70 percent.
This study has the potential to significantly reduce the number of trial tests required in industry while maintaining the pressure model’s capability to predict pressure across a range of air mass flow rates, leading to improved efficiency and cost savings.

Author Contributions

H.R.: Conceptualization, Methodology, Experimental tests and design, Software, Formal analysis, Visualization, Writing—original draft, Writing—review & editing, Funding acquisition. O.O.: Methodology, Software, Formal analysis, Writing—review & editing, Visualization. A.L.: review & editing. D.I.: Supervision, review & editing. K.C.W.: Supervision, Project administration, Funding acquisition. M.G.J.: Methodology, Supervision, Project administration, Funding acquisition. G.K.: Methodology, Supervision, Project administration, Funding acquisition. All authors have read and agreed to the published version of the manuscript.

Funding

This research was supported under Australian Research Council’s Discovery Project funding scheme (No. DP1 90103221).

Data Availability Statement

The data presented in this study are available on request from the corresponding author. The data are not publicly available due to restrictions imposed by the research participants’ privacy and confidentiality agreements.

Conflicts of Interest

The authors declare no conflict of interest.

References

  1. Klinzing, G.E.; Rizk, F.; Marcus, R.; Leung, L. Pneumatic Conveying of Solids: A Theoretical and Practical Approach; Springer Science & Business Media: Berlin/Heidelberg, Germany, 2011; Volume 8. [Google Scholar]
  2. Mills, D. Pneumatic Conveying Design Guide; Elsevier: Amsterdam, The Netherlands, 2003. [Google Scholar]
  3. McGlinchey, D. Characterisation of Bulk Solids; John Wiley & Sons: Hoboken, NJ, USA, 2009. [Google Scholar]
  4. Geldart, D. Types of Gas Fluidization. Powder Technol. 1973, 7, 285–292. [Google Scholar] [CrossRef]
  5. Wypych, P.W.; Hastie, D.B. Theoretical Modelling of Rotary Valve Air Leakage for Pneumatic Conveying Systems; University of Wollongong: Wollongong, NSW, Australia, 2002. [Google Scholar]
  6. Dixon, G. The Impact of Powder Properties on Dense Phase Flow; University of Wollongong: Wollongong, NSW, Australia, 1979. [Google Scholar]
  7. Williams, K.; Jones, M. Bulk Material Classifications for the Design of Pneumatic Conveying Systems; University of Wollongong: Wollongong, NSW, Australia, 2002. [Google Scholar]
  8. Pan, R. Material Properties and Flow Modes in Pneumatic Conveying. Powder Technol. 1999, 104, 157–163. [Google Scholar] [CrossRef]
  9. Mainwaring, N.; Reed, A. Permeability and Air Retention Characteristics of Bulk Solid Materials in Relation to Modes of Dense Phase Pneumatic Conveying. Bulk Solids Handl. 1987, 7, 415–425. [Google Scholar]
  10. Jones, M.G. The Influence of Bulk Particulate Properties on Pneumatic Conveying Performance. Ph.D. Thesis, Thames Polytechnic, Thames, New Zealand, 1988. [Google Scholar]
  11. Sanchez, L.; Vasquez, N.; Klinzing, G.E.; Dhodapkar, S. Characterization of Bulk Solids to Assess Dense Phase Pneumatic Conveying. Powder Technol. 2003, 138, 93–117. [Google Scholar] [CrossRef]
  12. Borzone, L.A. A comparison of particle wear in pneumatic transport. Chem. Eng. Commun. 2010, 197, 1215–1224. [Google Scholar] [CrossRef]
  13. Rabinovich, E.; Kalman, H. Flow Regime Diagram for Vertical Pneumatic Conveying and Fluidized Bed Systems. Powder Technol. 2011, 207, 119–133. [Google Scholar] [CrossRef]
  14. Kalman, H.; Rawat, A. Flow Regime Chart for Pneumatic Conveying. Chem. Eng. Sci. 2020, 211, 115256. [Google Scholar] [CrossRef]
  15. Muschelknautz, E.; Krambrock, W. Vereinfachte Berechnung horizontaler pneumatischer Förderleitungen bei hoher Gutbeladung mit feinkörnigen Produkten. Chem. Ing. Tech. 1969, 41, 1164–1172. [Google Scholar] [CrossRef]
  16. Konrad, K. Dense Phase Pneumatic Conveying of Particles; University of Cambridge: Cambridge, UK, 1981. [Google Scholar]
  17. Kano, T.; Takeuchi, F.; Sugiyama, H.; Yamazaki, E. Study of the Optimum Conditions for Plug-Type Pneumatic Conveying of Granular Materials. Int. Chem. Eng. 1984, 24, 702–709. [Google Scholar] [CrossRef]
  18. Borzone, L.; Klinzing, G. Dense-Phase Transport: Vertical Plug Flow. Powder Technol. 1987, 53, 273–283. [Google Scholar] [CrossRef]
  19. Hong, G.; Klinzing, G. Vertical plug flow of cohesive coal in 2-and 4-inch pipes. Powder Technol. 1989, 57, 59–67. [Google Scholar] [CrossRef]
  20. Aziz, Z.B. Plug Flow Transport of Cohesive Powders: The Horizontal Flow; UMI: Bellflower, CA, USA, 1991. [Google Scholar]
  21. Mi, B.; Wypych, P. Pressure drop prediction in low-velocity pneumatic conveying. Powder Technol. 1994, 81, 125–137. [Google Scholar] [CrossRef]
  22. Sanchez, L.; Vasquez, N.A.; Klinzing, G.E.; Dhodapkar, S. Evaluation of models and correlations for pressure drop estimation in dense phase pneumatic conveying and an experimental analysis. Powder Technol. 2005, 153, 142–147. [Google Scholar] [CrossRef]
  23. Pan, R.; Wypych, P. Pressure Drop and Slug Velocity in Low-Velocity Pneumatic Conveying of Bulk Solids. Powder Technol. 1997, 94, 123–132. [Google Scholar] [CrossRef]
  24. Molerus, O. Prediction of pressure drop with steady state pneumatic conveying of solids in horizontal pipes. Chem. Eng. Sci. 1981, 36, 1977–1984. [Google Scholar] [CrossRef]
  25. Orozovic, O.; Lavrinec, A.; Georgiou, F.; Wensrich, C. A Continuum Mechanics Derivation of the Empirical 1 Expression Relating Slug and Particle Velocities. Powder Technol. 2020, 380, 598–601. [Google Scholar] [CrossRef]
  26. Orozovic, O.; Lavrinec, A.; Alkassar, Y.; Williams, K.; Jones, M.; Klinzing, G. On the kinematics of horizontal slug flow pneumatic conveying and the relationship between slug length, porosity, velocities and stationary layers. Powder Technol. 2019, 351, 84–91. [Google Scholar] [CrossRef]
  27. Shaul, S.; Kalman, H. Three Plugs Model. Powder Technol. 2015, 283, 579–592. [Google Scholar] [CrossRef]
  28. Konrad, K. Prediction of the pressure drop for horizontal dense phase pneumatic conveying of particles. In Proceedings of the 5th Conference BHRA Fluid Engineering, Elsinore, Denmark, 18–23 May 1986. [Google Scholar]
  29. Tan, S.; Williams, K.C.; Jones, M.G.; Krull, T. Determination of slug permeability factor for pressure drop prediction of slug flow pneumatic conveying. Particuology 2008, 6, 307–315. [Google Scholar] [CrossRef]
  30. Zenz, F.A. Two-phase fluid-solid flow. Ind. Eng. Chem. 1949, 41, 2801–2806. [Google Scholar] [CrossRef]
  31. Barth, W. Strömungsvorgänge beim Transport von Festteilchen und Flüssigkeitsteilchen in Gasen. mit besonderer Berücksichtigung der Vorgänge bei pneumatischer Förderung. Chem. Ing. Tech. 1958, 30, 171–180. [Google Scholar] [CrossRef]
  32. Darcy, H. Les fontaines publiques de la ville de Dijon, Victor Dalmont, Paris. The Flow of Homogeneous Fluids Through Porous Media. Soil Sci. 1856, 46, 169. [Google Scholar]
  33. Stegmaier, W. Zur Berechnung der Horizontalen Pneumatischen Foerderung Feinkoerniger Feststoffe; University of Wollongong: Wollongong, NSW, Australia, 1978. [Google Scholar]
  34. Chambers, A.; Marcus, R. Pneumatic conveying calculations. In Proceedings of the Second International Conference on Bulk Materials Storage, Handling and Transportation, Wollongong, Australia, 7–9 July 1986; Preprints of Papers; Institution of Engineers: Barton, ACT, Australia, 1986; pp. 49–52. [Google Scholar]
  35. Setia, G.; Mallick, S. Modelling fluidized dense-phase pneumatic conveying of fly ash. Powder Technol. 2015, 270, 39–45. [Google Scholar] [CrossRef]
  36. Sharma, K.; Mallick, S.; Mittal, A. An evaluation of testing and modeling procedure for solids friction factor for fluidized dense-phase pneumatic conveying of fine powders. Part. Sci. Technol. 2021, 39, 62–73. [Google Scholar] [CrossRef]
  37. Shijo, J.; Behera, N. Review and analysis of solids friction factor correlations in fluidized dense phase conveying. Tribol.-Mater. Surf. Interfaces 2021, 15, 1–9. [Google Scholar] [CrossRef]
  38. Ilic, D.; Williams, K.; Ellis, D. Assessment of Biomass Bulk Elastic Response to Consolidation. Chem. Eng. Res. Des. 2018, 135, 185–196. [Google Scholar] [CrossRef]
  39. Cheng, Z.; Leal, J.H.; Hartford, C.E.; Carson, J.W.; Donohoe, B.S.; Craig, D.A.; Xia, Y.; Daniel, R.C.; Ajayi, O.O.; Semelsberger, T.A. Flow behavior characterization of biomass Feedstocks. Powder Technol. 2021, 387, 156–180. [Google Scholar] [CrossRef]
  40. Cui, H.; Grace, J.R. Pneumatic Conveying of Biomass Particles: A Review. China Particuol. 2006, 4, 183–188. [Google Scholar] [CrossRef]
  41. Barbosa, R.; Pinho, C. Dilute phase vertical pneumatic conveying of cork stoppers. Rev. Eng. Térmica 2006, 5, 36–41. [Google Scholar] [CrossRef] [Green Version]
  42. Gomes, T.L.; Lourenço, G.A.; Ataíde, C.H.; Duarte, C.R. Biomass feeding in a dilute pneumatic conveying system. Powder Technol. 2021, 391, 321–333. [Google Scholar] [CrossRef]
  43. Rajabnia, H.; Orozovic, O.; Lavrinec, A.; Ilic, D.; Williams, K.; Jones, M.; Klinzing, G. An experimental investigation on plug formation using fuzzy cottonseeds. Powder Technol. 2022, 398, 117131. [Google Scholar] [CrossRef]
  44. Orozovic, O.; Rajabnia, H.; Lavrinec, A.; Alkassar, Y.; Meylan, M.; Williams, K.; Jones, M.; Klinzing, G. A phenomenological model for the pressure drop applicable across both dilute and dense phase pneumatic conveying. Chem. Eng. Sci. 2021, 246, 116992. [Google Scholar] [CrossRef]
  45. Lavrinec, A.; Orozovic, O.; Rajabnia, H.; Williams, K.; Jones, M.; Klinzing, G. An assessment of steady-state conditions in single slug horizontal pneumatic conveying. Particuology 2021, 58, 187–195. [Google Scholar] [CrossRef]
  46. Orozovic, O.; Lavrinec, A.; Rajabnia, H.; Williams, K.; Jones, M.; Klinzing, G. Transport Boundaries and Prediction of the Slug Velocity and Layer Fraction in Horizontal Slug Flow Pneumatic Conveying. Chem. Eng. Sci. 2020, 227, 115916. [Google Scholar] [CrossRef]
  47. Planning of the Biomass Heating Plant for the REW Regional Energie Wienerwald eGen|Energy Changes. Available online: https://energy-changes.com/en/projekt/planning-biomass-heating-plant-rew-regional-energie-wienerwald-egen (accessed on 1 January 2020).
  48. Bitra, V.S.; Womac, A.R.; Yang, Y.T.; Miu, P.I.; Igathinathane, C.; Chevanan, N.; Sokhansanj, S. Characterization of wheat straw particle size distributions as affected by knife mill operating factors. Biomass Bioenergy 2011, 35, 3674–3686. [Google Scholar] [CrossRef]
  49. Rezaei, H.; Lim, C.J.; Lau, A.; Sokhansanj, S. Size, shape and flow characterization of ground wood chip and ground wood pellet particles. Powder Technol. 2016, 301, 737–746. [Google Scholar] [CrossRef] [Green Version]
  50. Manimehalai, N.; Viswanathan, R. Physical properties of fuzzy cottonseeds. Biosyst. Eng. 2006, 95, 207–217. [Google Scholar] [CrossRef]
  51. Samuelsson, R.; Larsson, S.H.; Thyrel, M.; Lestander, T.A. Moisture content and storage time influence the binding mechanisms in biofuel wood pellets. Appl. Energy 2012, 99, 109–115. [Google Scholar] [CrossRef]
  52. Kennedy, O. Pneumatic Conveying Performance Characteristics of Bulk Solids; University of Wollongong: Wollongong, NSW, Australia, 1998. [Google Scholar]
  53. Wypych, P.W. Pneumatic Conveying of Bulk Solids; University of Wollongong: Wollongong, NSW, Australia, 1989. [Google Scholar]
  54. Tursi, A. A review on biomass: Importance, chemistry, classification, and conversion. Biofuel Res. J. 2019, 6, 962. [Google Scholar] [CrossRef]
  55. Vásquez, N.; Sánchez, L.; Klinzing, G.E.; Dhodapkar, S. Friction Measurement in Dense Phase Plug Flow Analysis. Powder Technol. 2003, 137, 167–183. [Google Scholar] [CrossRef]
Figure 1. A sample of cottonseeds, wheat straw, wood pellets and wood chips used in the study.
Processes 11 01698 g001
Figure 2. Schematic of the batch fed pneumatic conveying set up.
Processes 11 01698 g002
Figure 3. Process for determining pressure drop and test duration in single batch conveying.
Processes 11 01698 g003
Figure 4. The assembly of the hopper and rotary valve.
Processes 11 01698 g004
Figure 5. Process for determining pressure drop and test duration in continuous conveying of cottonseeds and wood pellets.
Processes 11 01698 g005
Figure 6. Linear fit regression to both single batch and continuous conveying of wheat straw, cottonseeds, wood pellets and wood chips.
Processes 11 01698 g006
Figure 7. Predicted pressure drop versus the measured pressure drop in both single batch and continuous conveying of wheat straw, cottonseeds, wood pellets and wood chips.
Processes 11 01698 g007
Figure 8. Linear regression and model performance with constant a set to zero in continuous pneumatic conveying.
Processes 11 01698 g008
Figure 9. Model’ performance using training subset of three for cottonseed and wood pellets in continuous conveying.
Processes 11 01698 g009
Figure 10. Variations in the probability of selecting accurate subsets of trial tests for cottonseed conveying.
Processes 11 01698 g010
Figure 11. Comparative analysis of the relationship between RMSE error and key descriptive statistics of the trained Subset: Standard Deviation, Range, Median, and Mean.
Processes 11 01698 g011
Table 1. Material properties of selected biomass materials.
Wood PelletsCottonseedsWood ChipsWheat Straw
Particle shapeCylindricalEllipsoidRectangularFibrous
Bulk density (kg/m3)61639020272
Particle width (mm)63–58–221–5
Particle length (mm)5–336–1221–6815–165
Table 2. Test matrix of single batch feeding tests for wheat straw, wood pellets, wood chips and cottonseeds.
Wheat StrawWood PelletsWood ChipsCottonseeds
Air Superficial
Velocity (m/s)
330 g660 g3000g4000 g3000 g4000 g3000 g4000 g
2.56XX XX
3.30XX XX
3.60XX XX
4.01XX XX
4.34XX XX
4.75XXXX XX
5.45XXXX XX
6.49XXXX XX
7.23 XXX XX
7.64 XXX XX
7.93 XXXXXX
8.34 XXXXXX
8.67 XXXXXX
9.08 XXXXXX
9.38 XXXXXX
Table 3. Test matrix of continuous conveying for wood pellets and cottonseeds.
Wood PelletsCottonseeds
Frequency to Control the Rotary Valve’s Speed
Air Superficial
Velocity (m/s)
30 Hz40 Hz50 Hz30 Hz40 Hz50 Hz
4.34 X
4.75 XX
5.04 XXX
5.45 X XXX
5.78 X
6.49XXXXXX
6.90XXX
7.23XXXXXX
7.64XXX
8.34XXX
9.38XXXXXX
11.23XXXXXX
Table 4. Linear fit coefficients of all tests.
MaterialSingle Batch TestContinuous Test
abab
Cottonseed421.880.16245.112.83
Wood pellets155.700.48608.852.45
Wheat straw81.470.34XX
Wood chips0.001.41XX
Table 5. Number of combination subsets and the associated accuracy percentage for training data.
Single Batch, Percentage AccuracyContinuous, Percentage Accuracy
C (m, 3)RMSER_SQUAREDC (m, 3)RMSER_SQUARED
Cottonseed154050.8463.3836461.2663.19
Wood pellets45552.0959.34154041.4350
Wheat straw68081.6242.79XXX
Wood chips6807.6519.41XXX
Disclaimer/Publisher’s Note: The statements, opinions and data contained in all publications are solely those of the individual author(s) and contributor(s) and not of MDPI and/or the editor(s). MDPI and/or the editor(s) disclaim responsibility for any injury to people or property resulting from any ideas, methods, instructions or products referred to in the content.

