
Modeling of the Refractive Index for the Systems MX+H2O, M2X+H2O, H3BO3+MX+H2O, and H3BO3+M2X+H2O. M = K+, Na+, or Li+ and X = Cl− or SO42−


1
Departamento de Química, Facultad de Ciencias Naturales, Matemática y del Medio Ambiente, Universidad Tecnológica Metropolitana, Santiago, Chile
2
Programa Institucional de Fomento a la Investigación, Desarrollo e Innovación (PIDi), Universidad Tecnológica Metropolitana, Santiago, Chile
3
Departamento de Ingeniería Eléctrica, Universidad de Santiago de Chile, Avenida Ecuador N° 3519, Estacíon Central, Santiago 9170124, Chile
4
Carrera de Ingeniería Química, Facultad Nacional de Ingeniería, Universidad Técnica de Oruro, P.O. Box 49, Oruro, Bolivia
*
Author to whom correspondence should be addressed.
Processes 2021, 9(3), 525; https://doi.org/10.3390/pr9030525
Submission received: 11 January 2021
/
Revised: 2 March 2021
/
Accepted: 5 March 2021
/
Published: 15 March 2021
Abstract
:The modeling of the refractive index for binary aqueous solutions of boric acid, sodium chloride, potassium chloride, sodium sulfate, lithium sulfate, and potassium sulfate, as well as ternary aqueous solutions of boric acid in the presence of sodium sulfate, lithium sulfate, or potassium chloride, is reported. The refraction index was represented by molar refraction. It was described as the sum of solutes’ partial molar refraction and solvent molar refraction. The solutes’ partial molar refraction was estimated from the molar refraction of the binary solutions. The excess molar refraction for these systems was described with the equation of Wang et al. The polarizability of the solutes present in the studied systems was estimated using the Lorenz–Lorenz relation. The results showed the model is appropriate for describing the systems studied; the interactions of boric acid, sodium, potassium, lithium, chloride, and sulfate ions with water molecules are relevant to explain the molar refraction and refractive index, and those for the binary systems of lithium chloride and sodium chloride are also relevant the ion–ion interactions. The model is robust and presents estimation capabilities within and beyond the concentrations and temperature range studied. Therefore, the outcomes represent valuable information to understand and follow the industrial processing of natural brines.
Keywords:
refractive index; polarization coefficient; modeling; boric acid; lithium; alkaline; sulfate; chloride1. Introduction
The refractive index is a physical property of a medium. It is defined as the ratio of the speed of light in a vacuum to its speed in that medium [1]. This property is useful to determine the concentration of compounds in liquid solutions and to study optical properties in film and fiber optic technologies, thermodynamic properties, molecular polarizability, and molecular interactions in liquid solutions, among others [2,3]. The refractive index could be also applied for monitoring industrial processes where the control variable is the concentration of the target compound in the solution [4,5]. This is feasible because the refractive index is sensitive to changes in concentration and is easy to measure [4,5].
The refractive index could be used for monitoring the industrial processing of natural brines from the Salar de Atacama. Brines are aqueous solutions that contain B3+, Li+, Na+, K+, Mg2+, Cl−, and SO42− ions [6,7], from which potassium, sodium, boron, and lithium compounds are produced [8,9]. To obtain the target compounds, the brines are concentrated by solar evaporation and further purified by chemical methods and crystallization [8,10,11]. Evaporation is performed in systems of ponds that work in concentration ranges to control salts’ precipitation [8,12]; therefore, it is necessary to periodically measure the concentration of the salts in the solutions; however, measuring the concentration is time-consuming and costly. Moreover, the knowledge of the behavior of the brines is required for designing and simulating the concentration processes [13], purification, and selective crystallization of the target compounds [14].
Brines containing these valuable resources are also located in other salt lakes in Chile, Bolivia, Argentina, China [15,16], and the USA [11,17], thus the monitoring of brine processing by the refractive index could be used where the solar evaporation process is applied. To monitor the brines’ processing using the refractive index, experimental data of the chemical systems involved are required [18]. Moreover, robust models to describe the data and estimate this property at the industrial operational conditions are needed.
In the literature [6], experimental data and empirical correlations of the refractive index and density have been reported for two types of synthetic solutions of H3BO3+KCl+H2O and Na2B4O7+KCl+H2O, including the binary systems H3BO3+H2O, KCl+H2O, and Na2B4O7+H2O at (293.15, 298.15, and 303.15) K. In previous work, we reported the refractive index of solutions saturated with respect to boric acid of the systems H3BO3+Na2SO4+H2O [19] and H3BO3+Li2SO4+H2O [10], at T = (293.15, 298.15, 303,15, 308.15, and 313.15) K. The data of the system in the presence of lithium sulfate were represented with an empirical correlation. Pacak et al. [20,21] measured the refractive index and density of Li+, Na+, NH4+, and Ag+ nitrates and iodides, as well as tetraalkylammonium salts (chlorides, bromides, iodides, and nitrates) in aqueous and dimethyl sulfoxide solutions. They estimated the molar refraction and analyzed the polarization effect for the ions and solvents. They represent the dependence of the solution molar refraction with the salt molar fraction by a quadratic equation. Deosarkar et al. [22] measured the density and refractive index at low salt concentrations of KCl, KBr, and KI in mixed-solvent solutions (ethanol + water) at 303.15 K. They estimated the solutions’ molar refractions using the Lorentz–Lorentz equation. Nonetheless, models to describe the refractive index and molar refraction for these systems are necessary.
An et al. [1] proposed a theoretical equation to describe the refractive index for binary salt solutions (NaCl, KCl, NaBr, and KBr) and water + acetonitrile + salt solutions at 298.15 K, obtaining good results, particularly at low salt concentrations. Li et al. [23] presented a method to estimate the polarizability of the ions from their refractive index in water. This method was based on their previous theoretical equation [1]. They studied 32 binary salt solutions. The values obtained agreed with the literature. They also calculated the polarizability of the cations Na+, K+, Rb+, Cs+, Ca2+, Ba2+, and Sr2+ and the anions F−, Cl−, Br−, I−, ClO4−, NO3−, and SO42−. Wang et al. [3] proposed a molecular model to represent the refractive index of quaternary aqueous solutions (chromium trioxide + potassium chromate + potassium dichromate + water) at (298.15 to 333.15) K. The results were consistent with the experimental observations. The multicomponent system was considered as a pseudo binary system with chromium trioxide as solute and potassium chromate + potassium dichromate + water as solvent. Wang et al. [24] proposed a modified mixing rule to determine the refractive index and the extinction coefficient of multicomponent mixed salt solutions at different wavelength and salt concentrations at 293.15 K. They studied the binary, ternary, and quaternary solutions as well as a quinary solution, of the system NaCl+KCl+MgCl2+CaCl2+Na2SO4+H2O. The mixing rule described the experimental data well. Leyendekkers and Hunter applied the Tamman–Tait–Gibson model to describe the refractive index for aqueous electrolyte solutions [25]. They extended the model to estimate the refractive index at different wavelengths, temperatures, and pressures, as well as for multicomponent solutions [26]. To validate its model, they studied the refractive index for the solutions of CuSO4+ZnSO4+H2O, HCl+H2SO4+H2O, KCl+HCl+H2O, KCl+H2O, and NaCl+H2O. Padova [27] modelled the apparent molar refractions of Na2SO4, MgSO4, MnCl2, NaOCOCH3, Ba(OCOCH3)2, Mg(OCOCH3)2, and K(OCOCH3) in mixed solvents (ethanol + water) at 298.15 K. Padova also determined the solutes’ molar refraction at an infinite dilution and discussed the ion–solvent interactions. Li et al. [28] estimated the polarizability of LiCl, NaCl, NaBr, KBr, and Na2SO4 in mixed solvents (water + acetonitrile and water + ethanol). For this purpose, they extended their model reported in [1,23]. The ion polarizability of Na+, Cl−, and Br− in the mixed solvents was reported. Their results showed that the solvent composition affects the anion polarizability, presenting a nonmonotonic behavior with organic solvent concentration increases, but the cation polarizability is nearly unaffected.
However, there is still a need for models that represent the refractive index and molar refraction of electrolyte and non-electrolyte binary solutions, and estimate these properties for aqueous multicomponent solutions, up to high concentrations at different temperatures. Moreover, the models should estimate the excess molar refraction, solutes’ molar refraction at different concentrations and at infinite dilution, and their polarizability coefficients.
The knowledge of the molar refraction is useful to explain the changes of ions’ properties by polarization or their electron shell changes in the presence of other ions [20]. The excess molar refraction is useful to understand the ion–ion and ion–solvent [29] interactions and how they affect the refractive index and the behavior of the studied systems.
Therefore, the aim of this work is to model the refractive index and molar refraction of binary aqueous solutions of boric acid from [6] and inorganic salts (sodium chloride [30], potassium chloride [6], lithium chloride [31,32], sodium sulfate and potassium sulfate [33], and lithium sulfate [34]), and the ternary solutions of boric acid + sodium sulfate + water [19], boric acid + lithium sulfate + water [10], and boric acid + potassium chloride + water [6]. The solution molar refraction is represented as the sum of the partial molar refraction of the solutes and the solvent. The partial molar refraction of the solutes was estimated from the molar refraction of their binary solutions. The required excess molar refraction was described with the equation from Wang et al. [35]. The model we proposed is also able to estimate the molar refraction of the solutes at infinite dilution. The expression of the refractive index is obtained from the relation between the molar refraction and the refractive index [24]. The parameters of the model are estimated comparing the calculated refractive index to the experimental refractive index of the binary solutions involved. Moreover, the polarizability coefficient of the compounds present in all systems studied using the Lorenz–Lorenz relation [20] is estimated.
2. Method
2.1. Molar Refraction and Refractive Index
The molar refraction of a solution R is described by the following equation [24]:
where n is the refractive index and Vm is the molar volume of the solution. Ri is the molar refraction and xi is the molar fraction of the component i, and N is the number of components. The molar volume is calculated by the following equation [36]:
where Mi is the molar weight of the component i and ρ is the density of the solution. Starting from the excess molar refraction REx [37] or deviation in molar refraction ΔR [38] representation, the molar refraction R can also be expressed as follows:
Rid is the molar refraction of an ideal solution and is given as follows:
Roi is the molar refraction of the pure component i. Replacing Equation (4) in Equation (3), the following is obtained:
For an aqueous solution of M solutes, based on [24,37,39] the molar refraction could be written as follows:
Rj and Rw are the partial molar refractions of the solute j and water, respectively. To estimate Rj, it is proposed to apply the relation for molar properties for binary solutions reported in [38], then Rj can be derived from the following equation:
Roj is the molar refraction of the pure solute, T is the temperature, and P is the pressure of the system. REx is the excess molar refraction for the binary solution.
Equation (8) was derived out of a molecular theoretical model, which considers that the macroscopic solution properties result from the degree of aggregation of subclusters formed by the molecules in the solution. The subclusters are formed by complex interactions between all molecules in the solution. The groups statistical theory and a pseudo-chemical reaction process were used to determine the degree of aggregation when the system reaches the equilibrium. The parameters a and b are related to the monomolecular membrane aggregates and pseudo-chemical reaction constants Kij; therefore, they are concentration x and temperature T dependent. The parameter g is related to the pseudo-chemical reaction constants, thus it depends on temperature. Based on Equation (8), it is proposed that the excess molar refraction for a binary solution REx is given by the following equation:
Replacing Equation (9) in Equation (7) and after simplifying the resulting equation, the following is obtained:
For Equation (10), when xj tends to 0, the molar refraction at infinite dilution R∞j is given by the following:
Isolating R∞j from Equation (11) and replacing in Equation (10),
Equation (12) is combined with Equation (6) to obtain the molar refraction of a multicomponent solution as a function of binary properties:
Rw is calculated from Equation (1) using the refractive index and molar volume of pure water. Refractive index is obtained. From [40] and the molar volume is calculated from Equation (2) using water density from [41]. It is considered that R∞j is temperature dependent and is represented by the following equation:
R∞,0j and R∞,1j are constants.
To calculate the refractive index, the refractie index n is isolated from Equation (1):
R is calculated from Equation (13). Vm is estimated from Equation (2) using the solution density calculated from Equation (16). It is proposed based on [42,43].
where wj is the weight fraction of the solute j and ρoj is the density of the binary solution of the solute j in water calculated at total solute weight fraction wj. ρoj is estimated using the equation reported by Apelblat [41]:
Aj and Bj are constants. To estimate the values of the parameters R∞,0j, R∞,1j, aj, bj and ցj, Equation (15) is applied for a binary solution. For this purpose R and Vm are obtained from Equations (12), (18) and (2), respectively. The resulting expressions are as follows:
The calculated refractive index is contrasted with the experimental values nexp, considering the objective function:
- m is the number of data points.
For the multicomponent solutions, the excess molar refraction is estimated combining Equations (5) and (13):
2.2. Polarizability
The solute electronic polarizability αe,j is related to the partial molar refraction by Equation (24) [20]:
where NA is Avogadro’s constant and Rj is the partial molar refraction of the solute j. The electronic polarizability coefficient is obtained by isolating this coefficient from Equation (24):
The value of Rj is calculated from Equation (12), using the parameters estimated from the binary system following the procedure described in Section 2.1.
3. Results
This section presents the results obtained by the application of the proposed model to describe the refraction index and the molar refraction of the binary and ternary systems studied. Moreover, the estimated electronic polarizability of the solutes is reported. The sources of the experimental data and temperature and concentration ranges studied are shown in Table 1.
3.1. Binary Systems
The parameters of the systems H3BO3+H2O, NaCl+H2O, KCl+H2O, Na2SO4+H2O, K2SO4+H2O, and Li2SO4+H2O are presented in Table 2. All parameters reported are statistically significant with a confidence level equal to or greater than 0.95. The models’ residuals are normally distributed. The parameters’ estimation and statistical analysis presented in this work were performed using the software Gretl [44]. For all systems studied, it was determined that the parameters a, b, and g are not temperature and concentration dependent. It was necessary to set g to 1 to assure that the parameters estimated of the molar refraction are physically significant. The parameter a was set to −b ln(1+g) to satisfy the limiting conditions for the excess molar refraction and the partial molar refraction. The partial molar refraction is equal to the partial molar refraction at an infinite dilution when x tends to 0, and it is equal to the pure compound molar refraction when x tends to 1. The excess molar refraction must be equal to 0 when x tends 0 and 1 because, at that concentration, the molar refraction is equal to the ideal molar refraction.
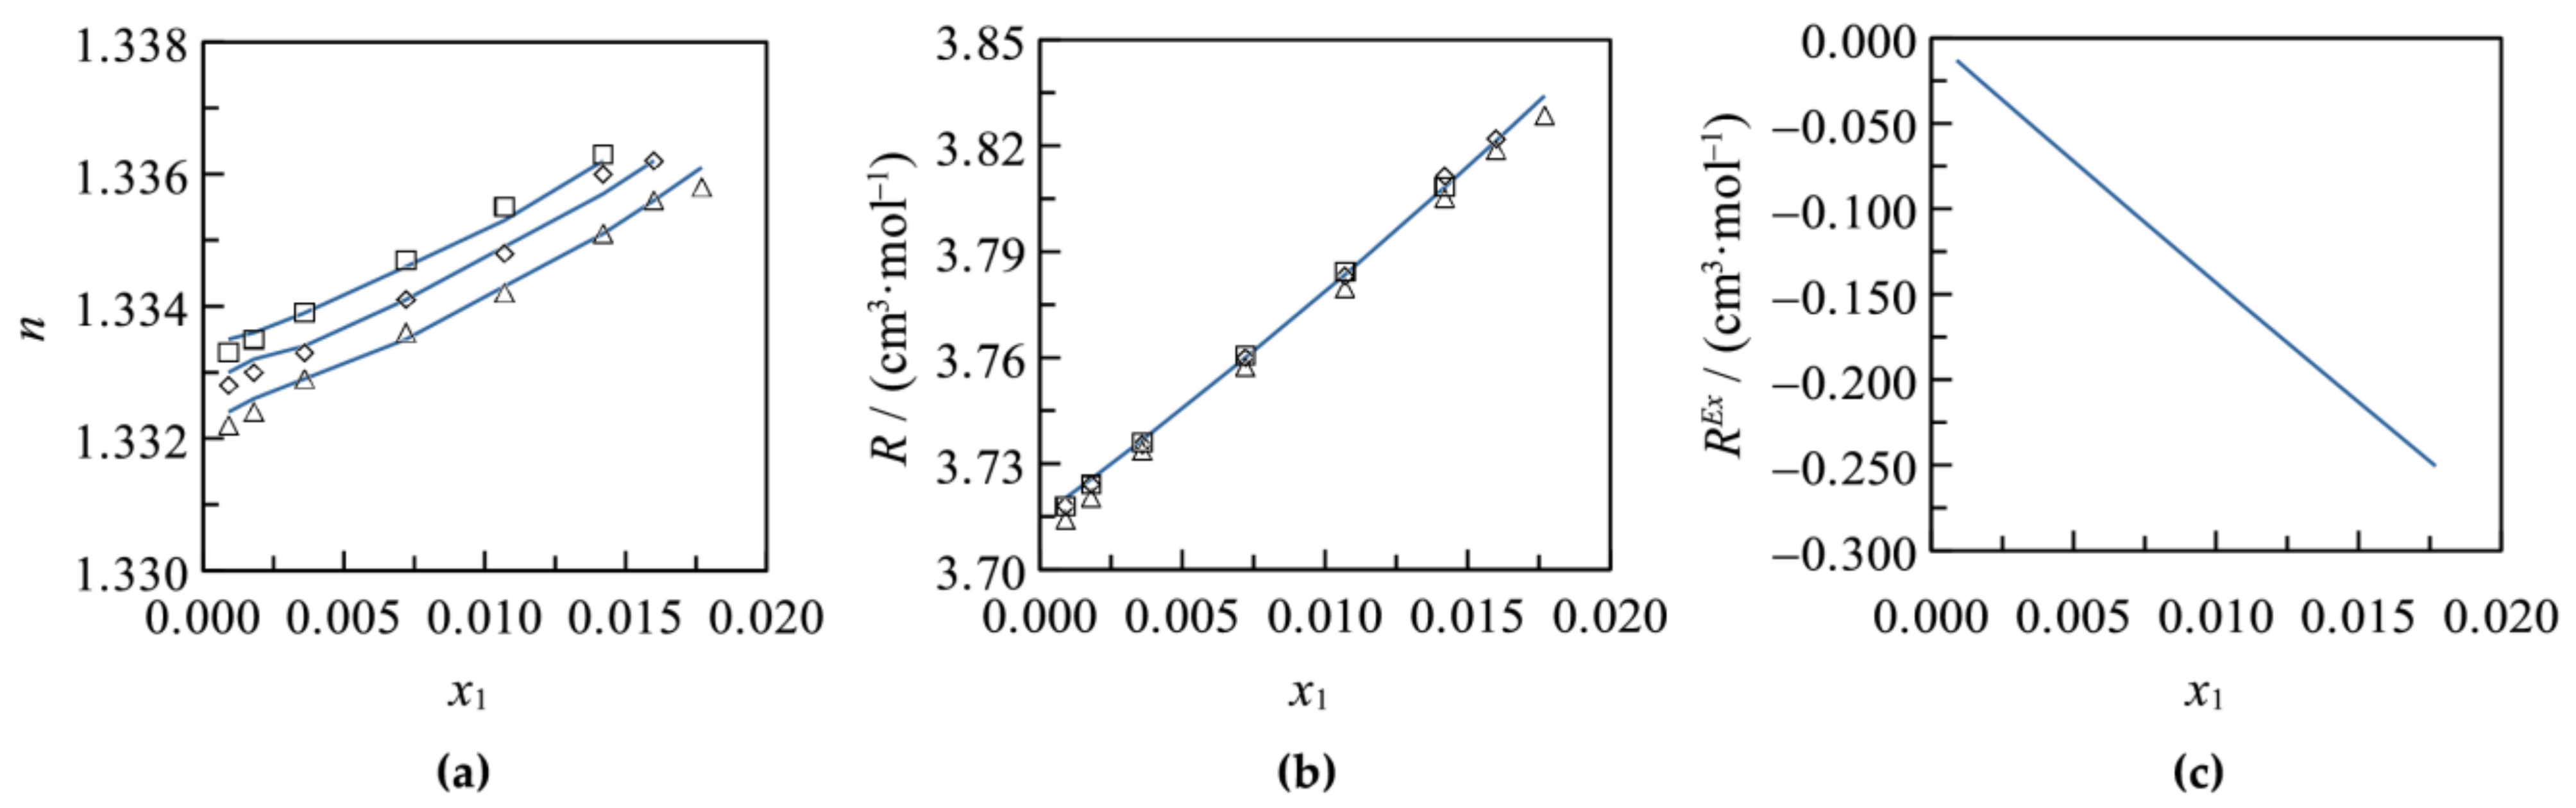
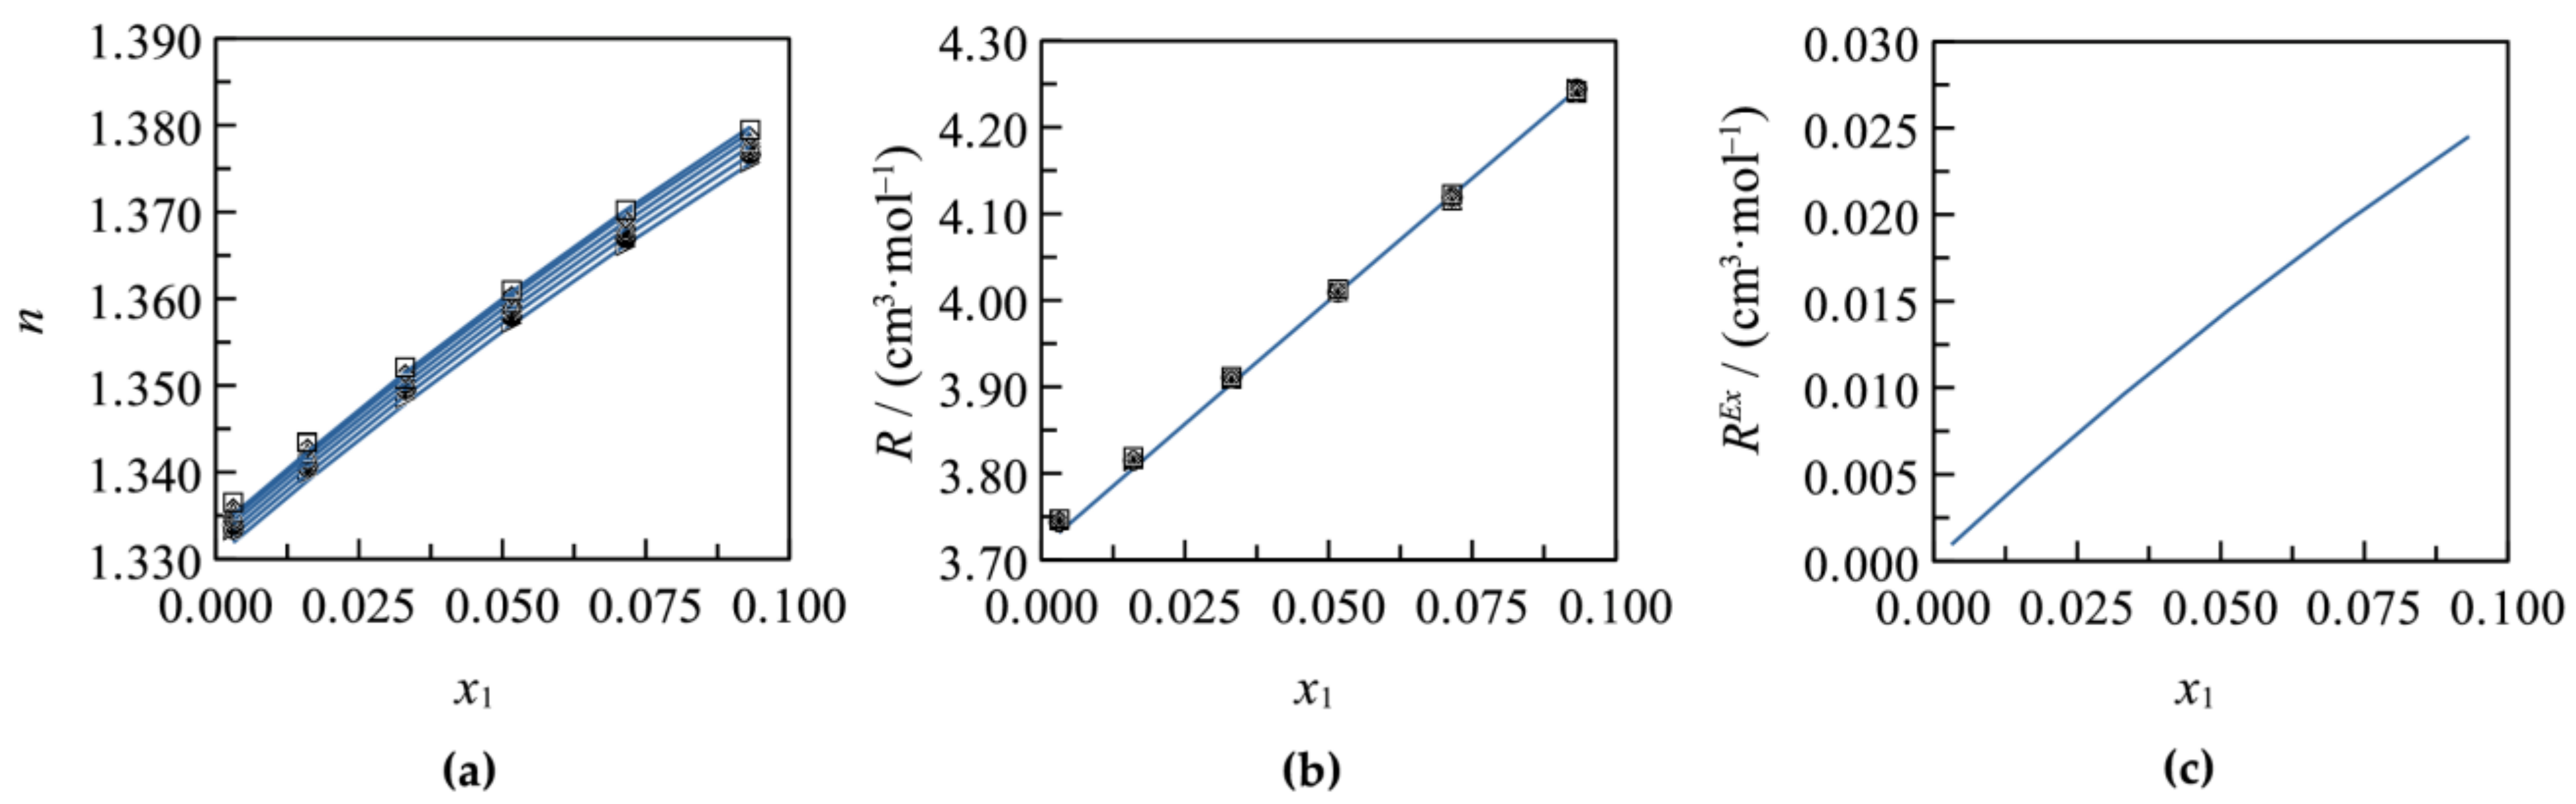
For the system H3BO3+H2O, the model described well the refractive index. The coefficient of multiple determination, r2, is 0.9986 and the standard error of regression, S.E., is 0.0002. Moreover, the molar refraction was in agreement with the data calculated from Equations (1) and (2) using the density and refractive index from [6] (r2 = 0.9941 and S.E. = 0.0030 cm3·mol−1). Figure 1 shows the results obtained. The statistically significant parameters of the model are bj and R∞,0j (Table 2). This means that the molar refraction is unaffected by temperature changes, as can be seen in Figure 1b. The refractive index decreases slightly with temperature increase at a constant acid concentration (Figure 1a). This property depends on the molar refraction and the molar volume as shown in Equation (15). Thus, the temperature effect could be attributed to the increasing of the solution molar volume with temperature changes (by density decreases [6]) at a constant acid concentration, because the molar refraction is unaffected. Both the refractive index and the molar refraction increase with the acid concentration increments at a constant temperature, but the excess molar refraction decreases (Figure 1c). Boric acid behaves as a water structure maker in aqueous solutions [19]; therefore, the behavior of these properties could be related to the changes in the interactions between boric acid and water molecules.
The excess molar refraction is only concentration dependent for all systems studied because a, b, and g are constants (Table 2).
Figure 2, Figure 3 and Figure 4 show the results obtained for the systems Na2SO4+H2O, Li2SO4+H2O, and K2SO4+H2O, respectively. To represent these systems, the parameter b was fixed to −1 and the values of R∞,0j and R∞,1j were estimated by contrasting the calculated refractive index to their experimental data (Table 1).
For the systems Na2SO4+H2O and K2SO4+H2O, only R∞,0j was statistically significant (Table 2). This shows that molar refraction for these systems is not temperature dependent; however, the refractive index decreases with temperature increases. This could be attributed to the increasing of the solution molar volume with the temperature increase (by solution density decreases) at a constant salt molar fraction. The molar refraction and refractive index of these salts increase with salt concentration increments, but the excess molar refraction decreases, as can be seen in Figure 2 and Figure 4. Sodium sulfate [19] and potassium sulfate [47] are water structure breakers in aqueous solutions [19]; therefore, the behavior of these properties could be related to the ion–water interactions variations. To describe the refractive index of sodium sulfate, r2 is 0.9981 and S.E. is 0.00064, and for potassium sulfate, r2 is 0.9894 and S.E. is 0.00046. In the case of molar refraction, r2 is 0.9992 and S.E. is 0.0063 cm3·mol−1 for sodium sulfate, and r2 is 0.9964 and S.E. is 0.0090 cm3·mol−1 for potassium sulfate.
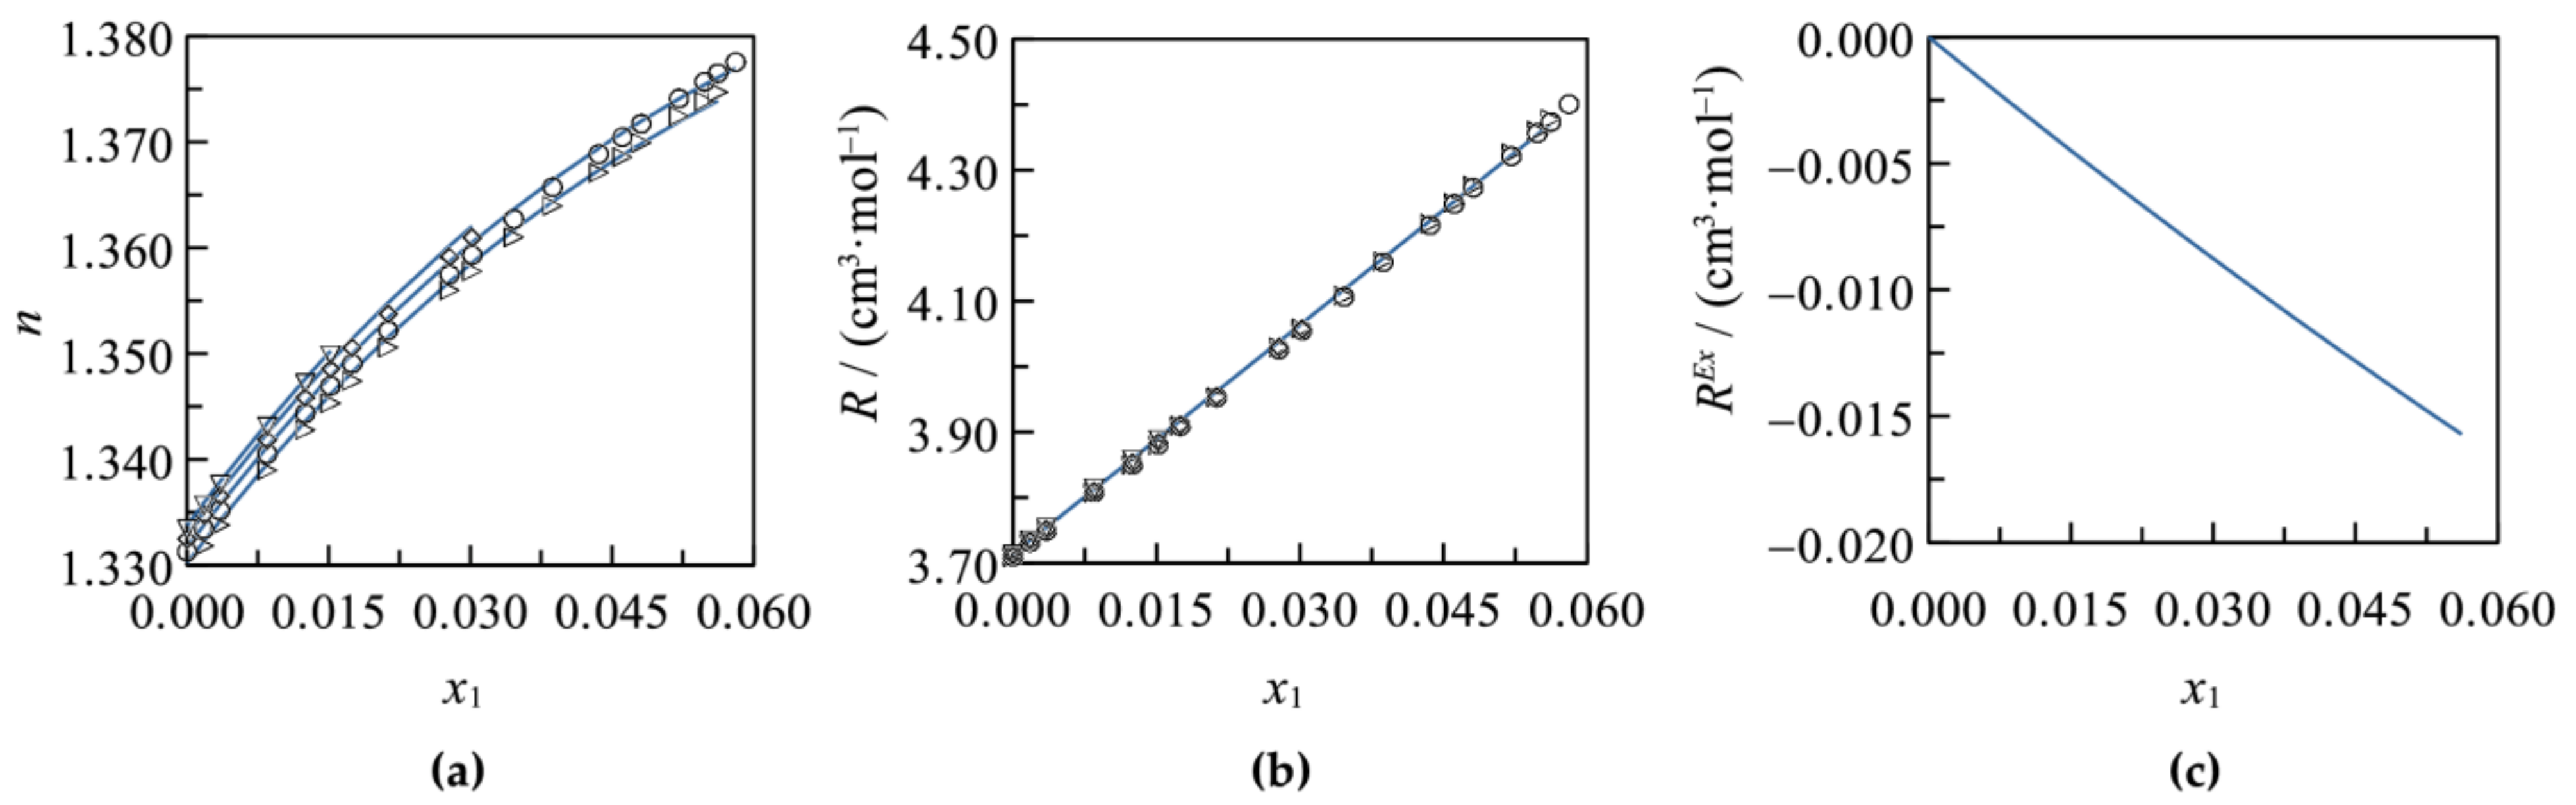
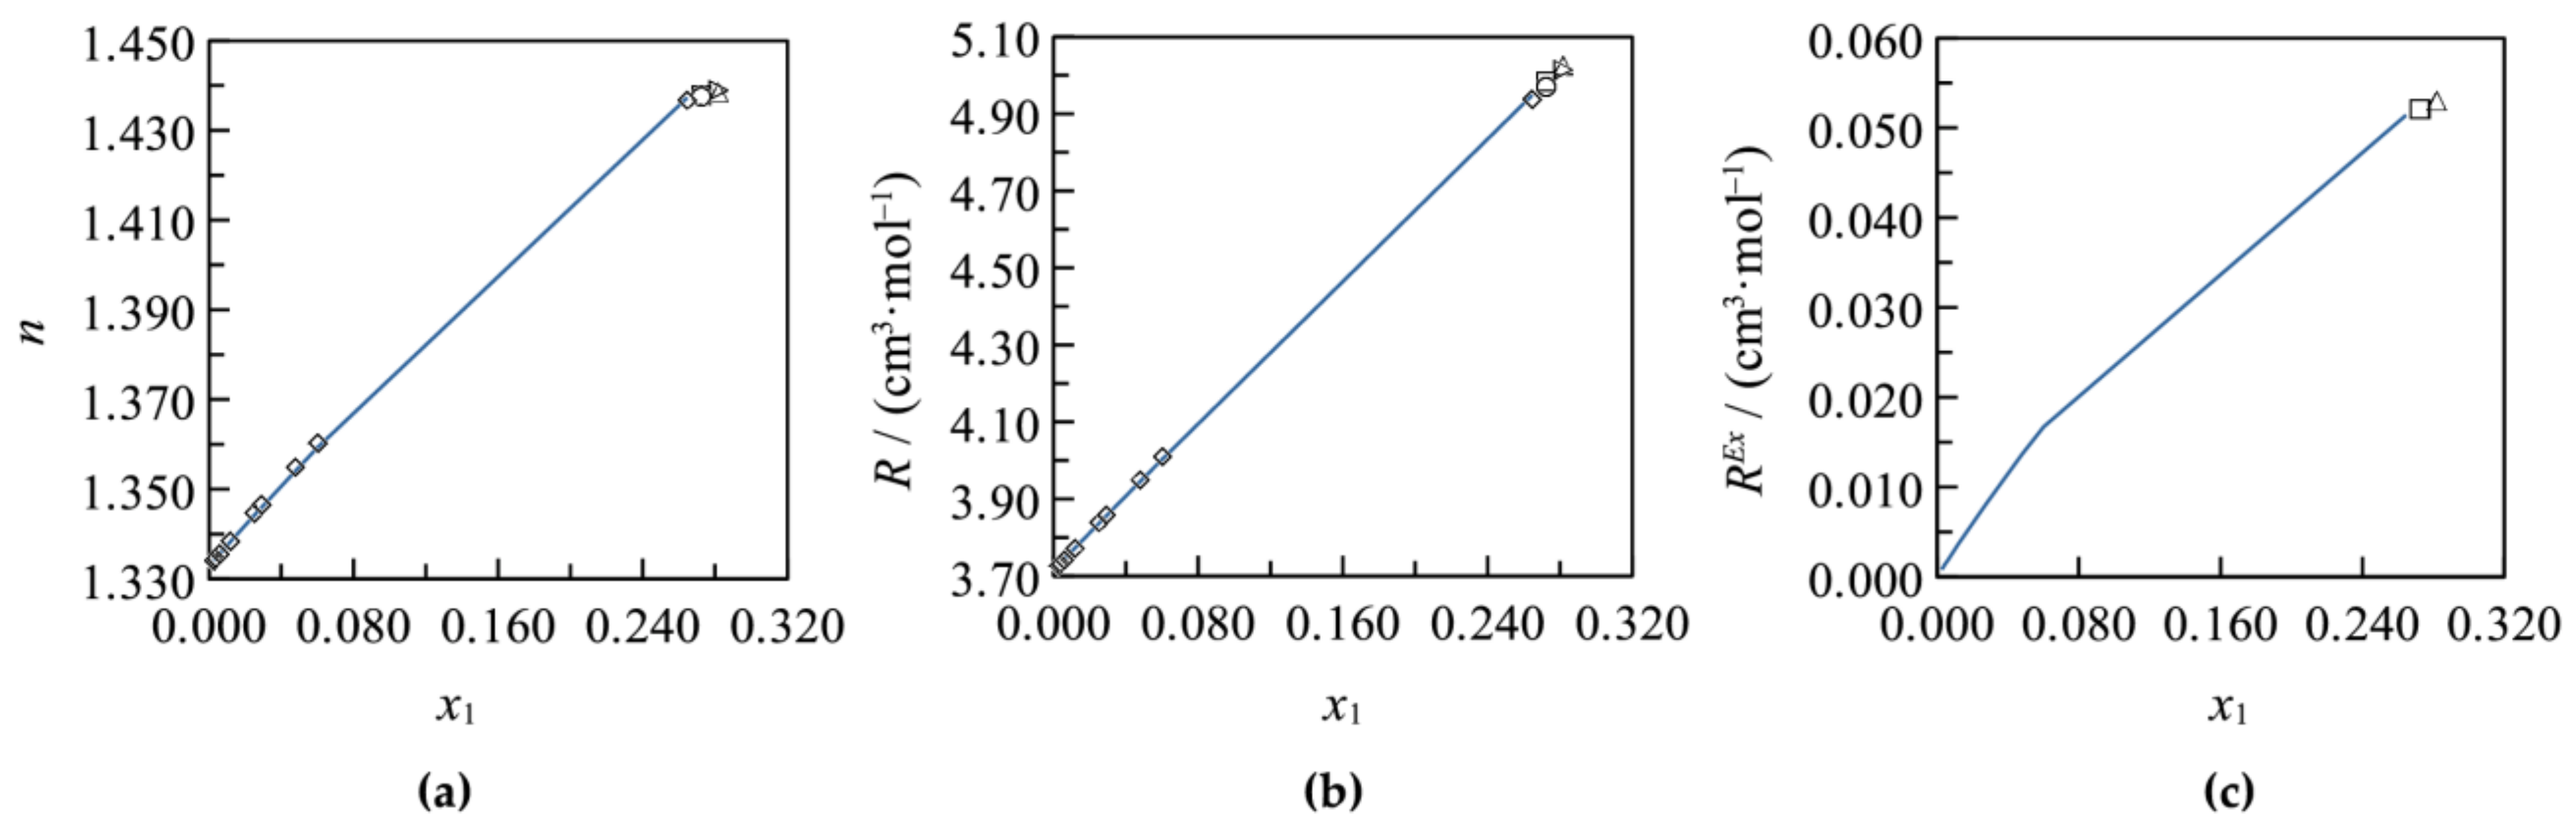
The refractive index and molar refraction for the system Li2SO4+H2O were described using the parameters R∞,0j and R∞,1j. For the refractive index, r2 is 0.9825 and S.E. is 0.00136, and for the molar refraction, r2 is 0.9086 and S.E. is 0.0446 cm3·mol−1. This shows that n and R are affected by temperature and salt concentration changes, as can be seen in Figure 3a,b. The temperature effect is relevant for the refractive index. It decreases with temperature increases at a constant salt concentration, while for molar refraction, it is significant at a high salt concentration, as shown in Figure 3a,b. It could be explained by the increasing of the solution molar volume with temperature increases (by solution density decreases [34]) at a constant salt molar fraction. The molar refraction and refractive index increase with the salt concentration increments, but the excess molar refraction decreases (Figure 3). Considering that lithium sulfate is a water structure maker [19], these changes in properties could be related to the ion–water interactions modifications.
Table 2 shows the estimated values of R∞,0j and the values reported in the literature. For sodium sulfate, the calculated value agrees with the values from the literature [36,45]. For lithium sulfate, the R∞,0j value is greater than the value from the literature [46] and, for sodium sulfate, R∞,0j is smaller than the value reported in [36].
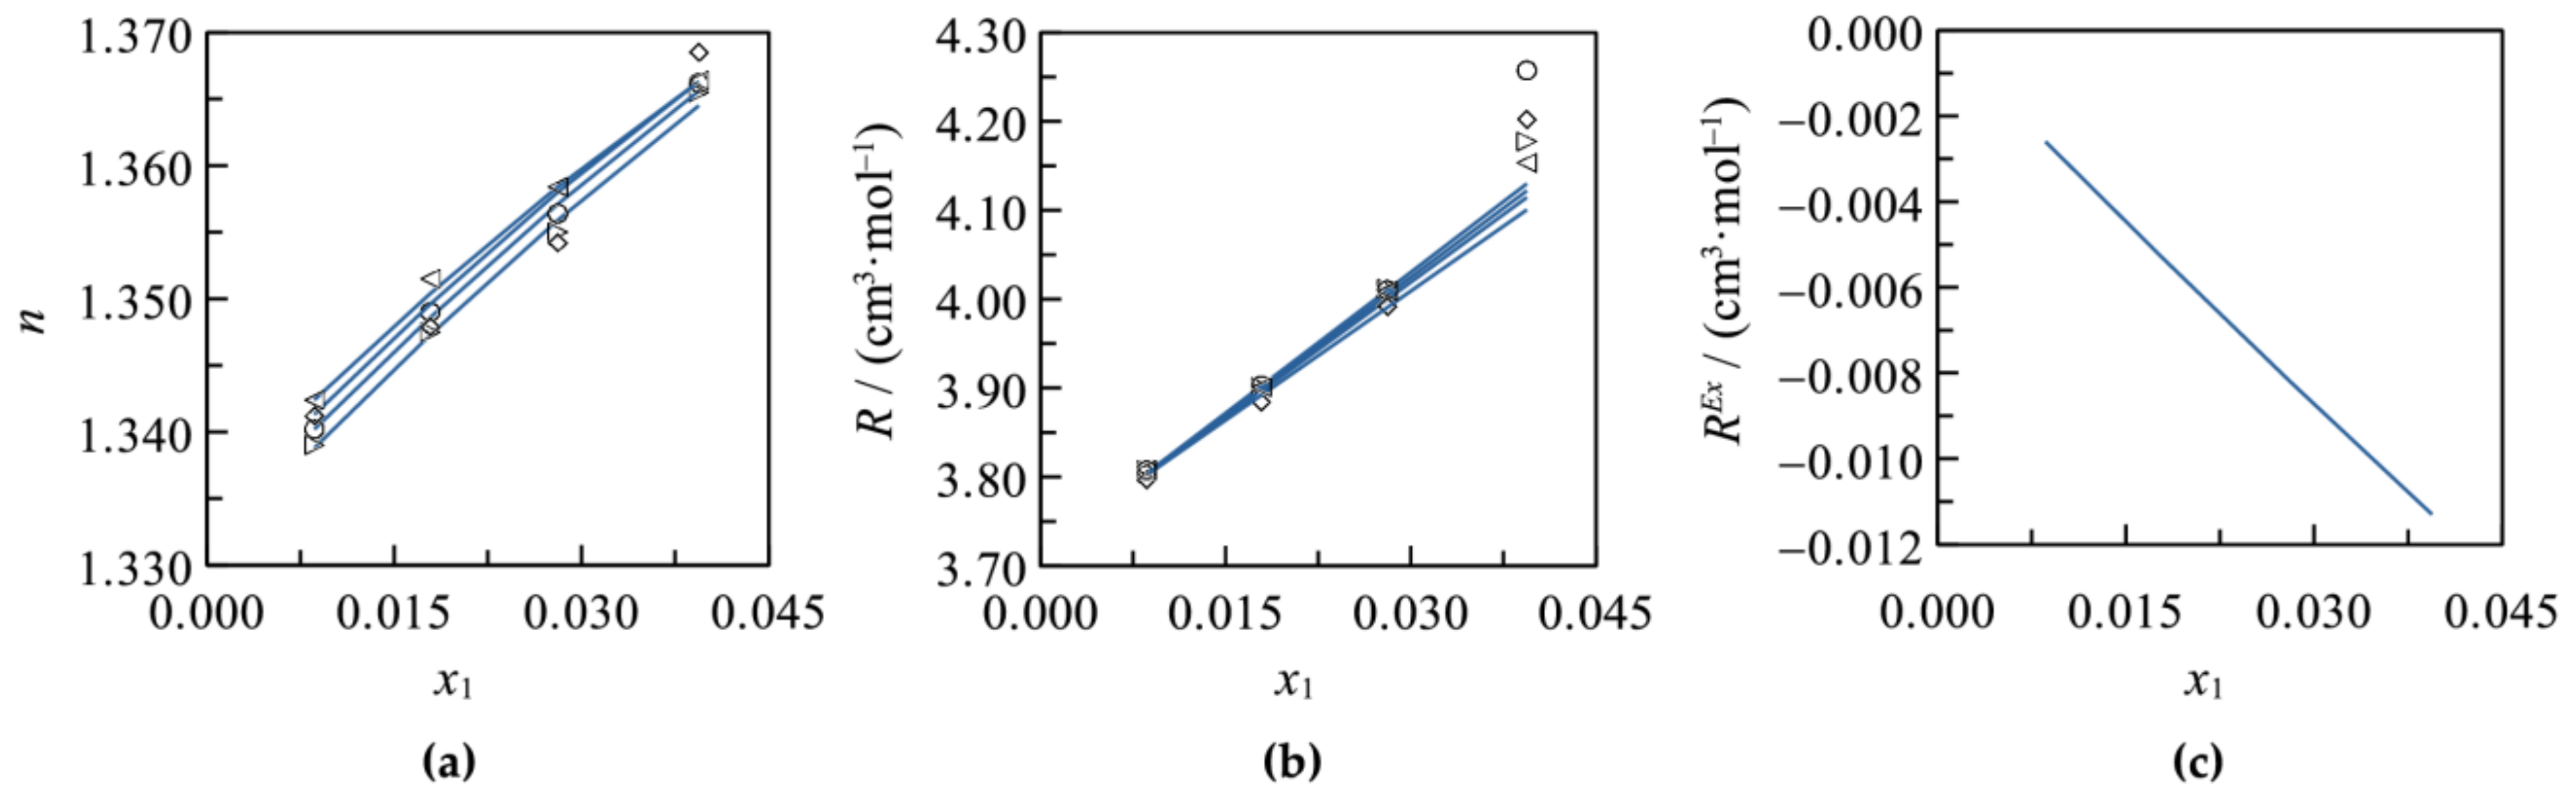
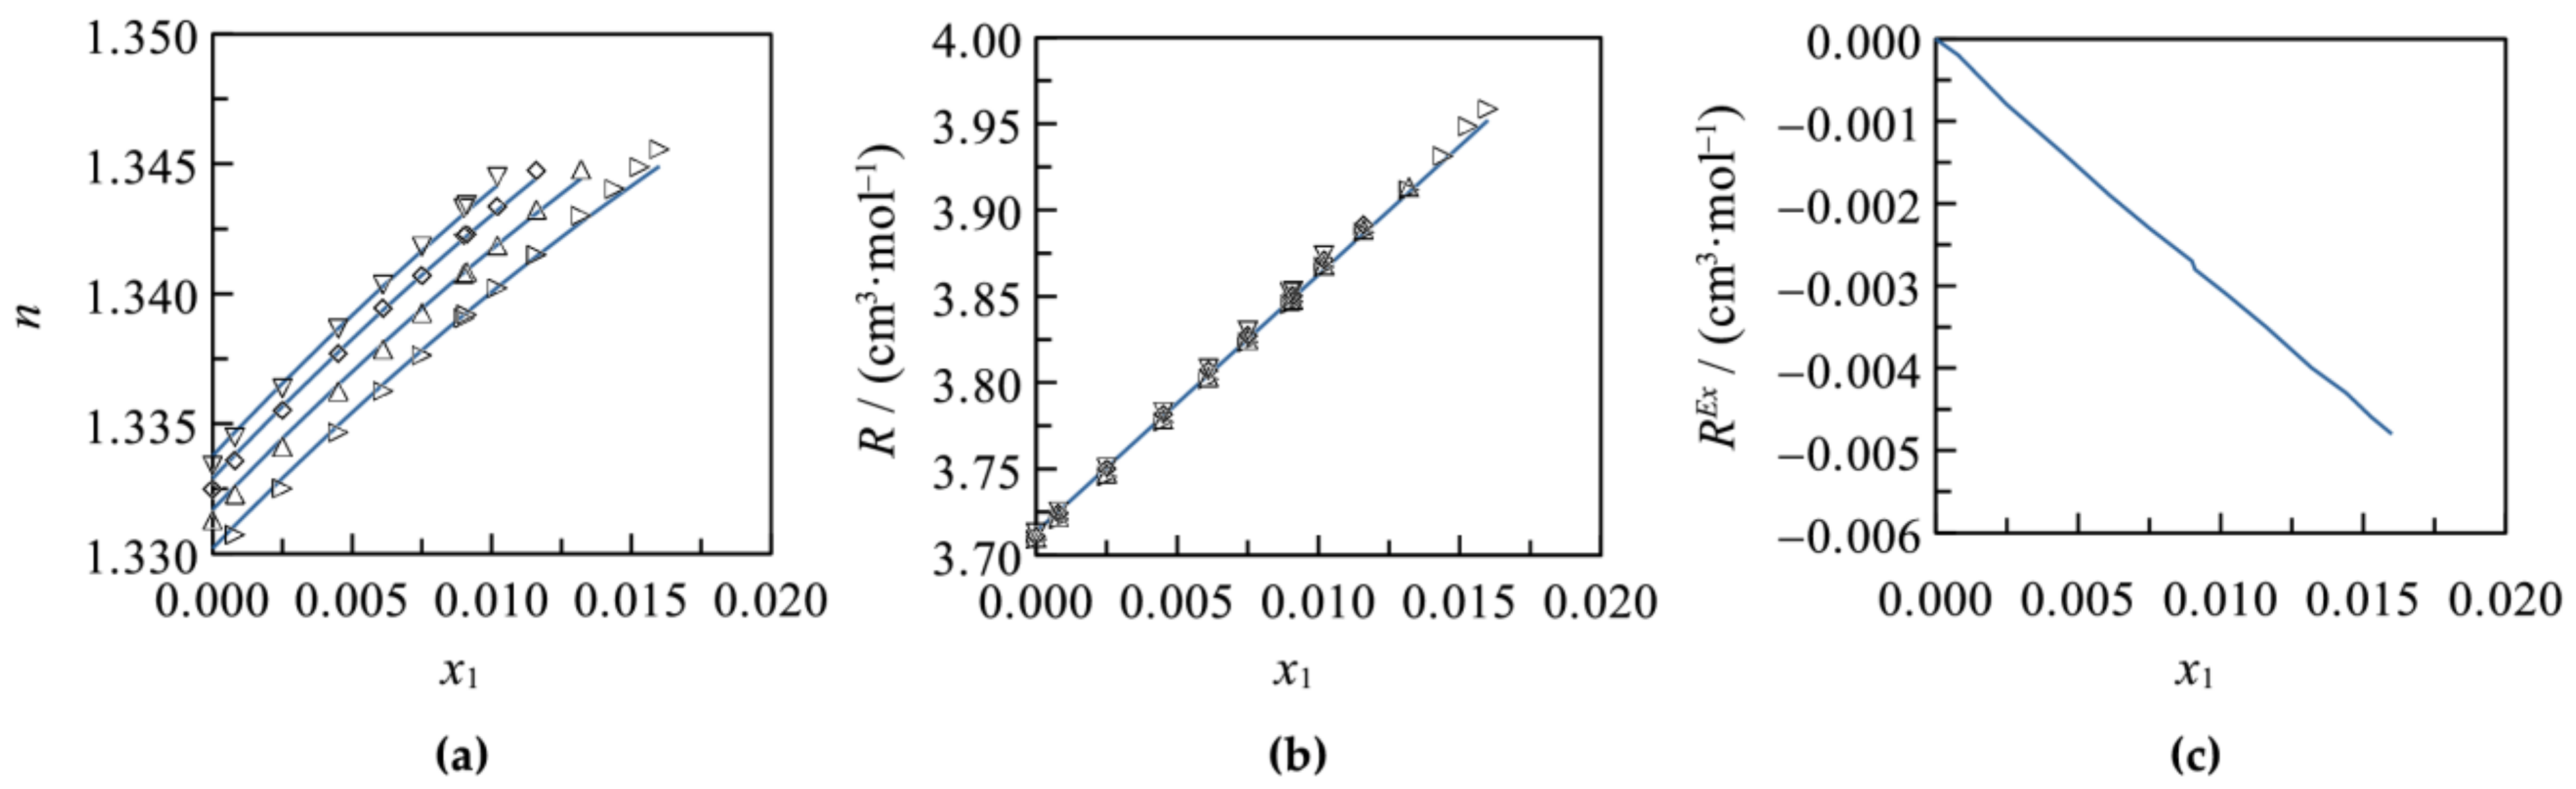
In Figure 5a,b, Figure 6a,b, and Figure 7a,b, it can be observed that the model described well the experimental data of the systems NaCl+H2O, LiCl+H2O, and KCl+H2O. The parameter b was set to 1, in the presence of sodium chloride and lithium chloride, and set to −1 in the presence of potassium chloride. To represent these systems, only the parameter R∞,0j is needed (Table 2). The values of the parameter R∞,0j estimated for every chloride salt are in agreement with the values reported in the literature [36,46,48]. For the refractive index, the goodness of fit statistics are given in Table 2. For the molar refraction of sodium chloride, r2 is 0.9728 and S.E. is 0.0285 cm3·mol−1; for potassium chloride, r2 is 0.9993 and S.E. is 0.0047 cm3·mol−1; and for lithium chloride, r2 is 0.9998 and S.E. is 0.0060 cm3·mol−1.
For the system NaCl+H2O, the molar refraction is not temperature dependent, but it changes with salt concentration variations (Figure 5a,b). The refractive index changes with temperature and salt concentration modifications. It decreases with temperature increments at a constant salt concentration and increases with salt concentration increments at a constant temperature. The temperature effect is related to the molar volume variation with temperature modifications (density changes). The excess molar refraction is positive and increases with concentration increments, as shown in Figure 5c. Sodium chloride is a water structure maker [49]; therefore, the concentration effect could be explained by changes in the ion–water and ion–ion interactions [49].
Figure 6 shows that the refractive index and molar refraction of the system LiCl+H2O are mainly reported at 298.15 K; therefore, only the salt concentration effect was analysed. Both properties and the excess molar refraction increase with salt concentration increments. In lithium chloride solutions, ion–water and ion–ion interactions (ion-pair formation) are relevant [50]; therefore, those interactions could explain the behavior of the properties studied.
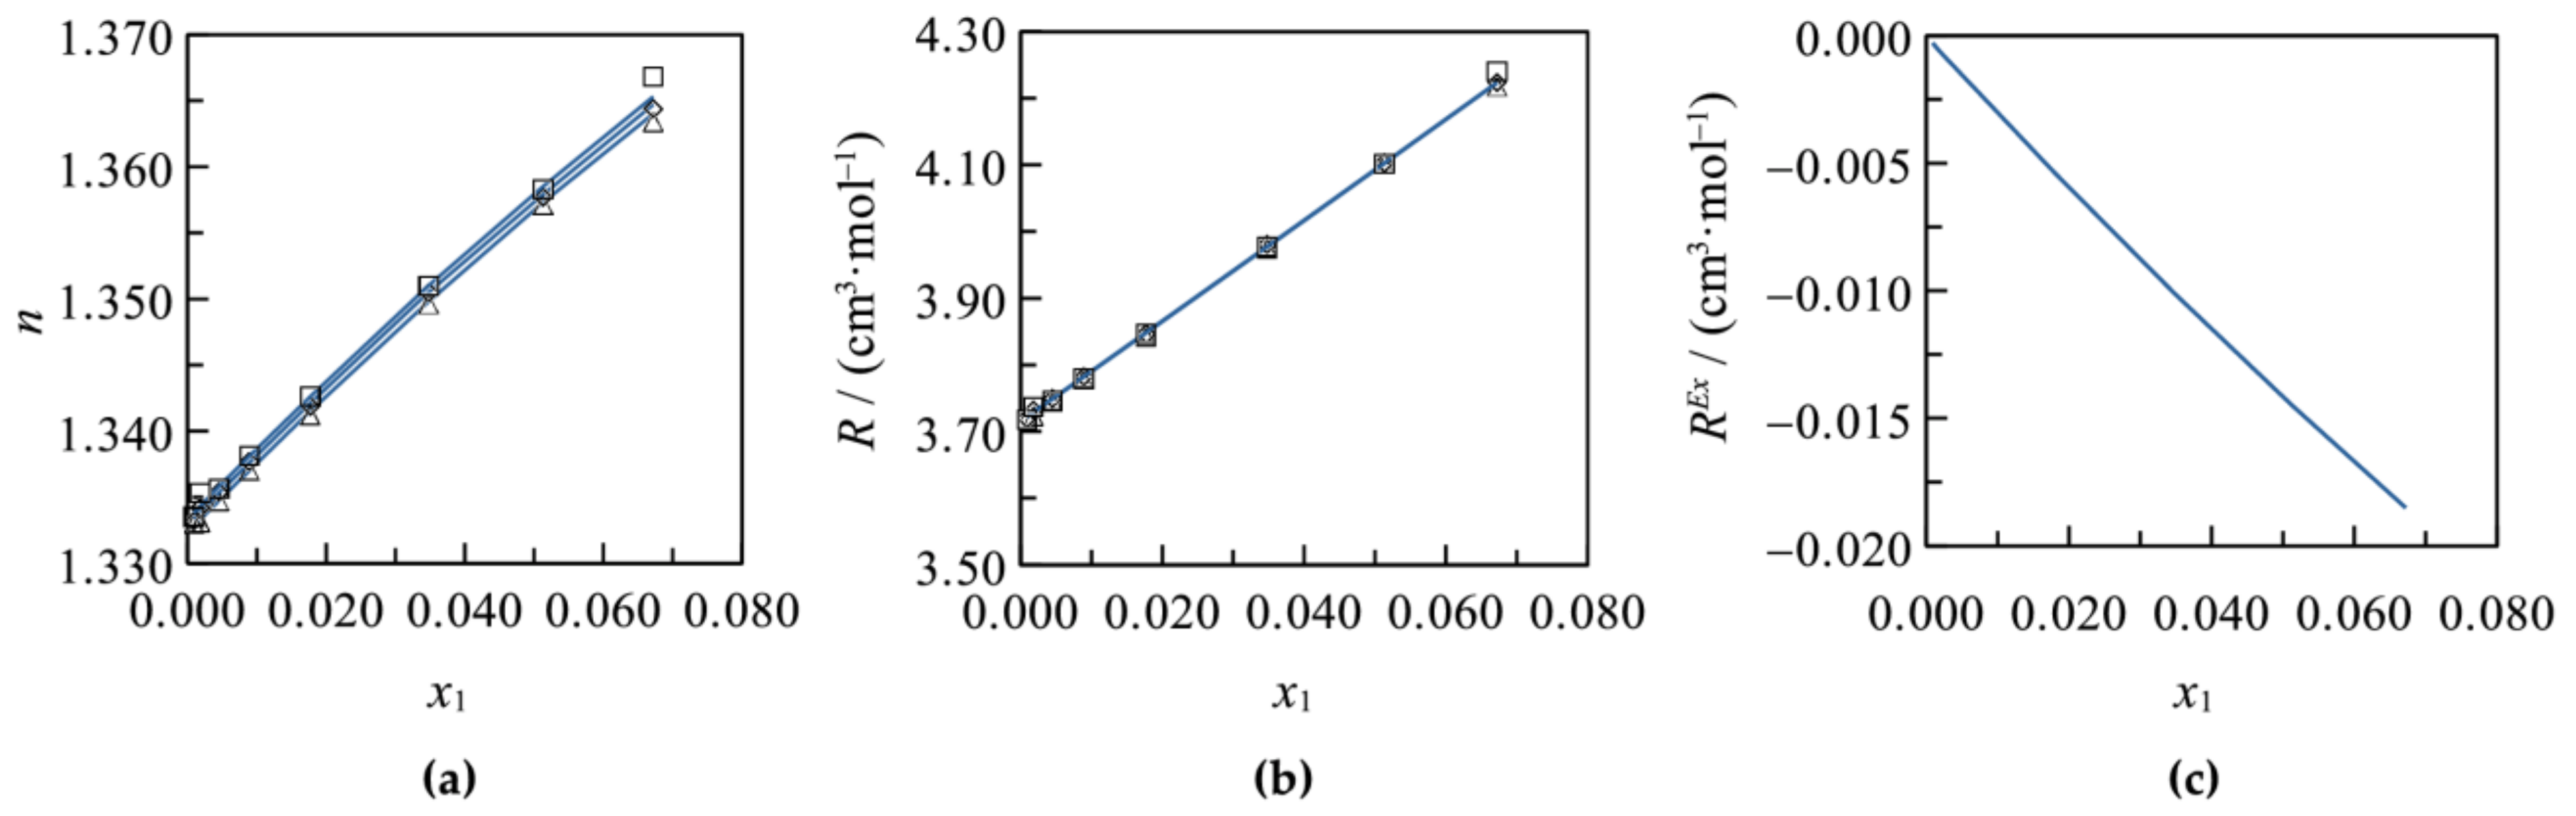
For the system KCl+H2O, the molar refraction is unaffected by temperature changes, but the refractive index is slightly affected, as can be seen in Figure 7a,b. This could be attributed to the slight molar volume changes with the increases in temperature (density decreases [6]). These properties increase with salt concentration increments. This salt is a water structure breaker [49], where the ion–water interactions are relevant [49]; therefore, these interactions could explain the behavior of the refraction index, molar refraction, and excess molar refraction.
Table 3 presents the values of the polarizability coefficients estimated from Equation (24) at infinite dilution at 298.15 K. Polarizability of H3BO3, Na2SO4, and K2SO4 is concentration dependent. It rises with concentration increments. The temperature effect is negligible. Polarizability of Li2SO4 grows as temperature rises, but it is not changed by concentration increments. Polarization of NaCl, LiCl, and KCl is not modified with temperature increases. In the case of NaCl and LiCl, the polarization decreases with concentration increments, but the polarization of KCl increases with concentration increases (Figures S1–S7 in the Supplementary Materials).
Table 3 shows that the polarizability values of NaCl, LiCl, and KCl are slightly greater, but greater than the values reported in [48]. Because the polarizability is unaffected by temperature changes, it was also compared with the values reported at 291.15 K in [51] as cited in [23]. The values we reported are similar to those values for Na2SO4, Li2SO4, and KCl; slightly greater for NaCl; and slightly smaller for LiCl. These comparisons showed that the values we reported in Table 3 are consistent.
The values we reported are close to the values in [51] as cited in [23], because those values were obtained from molar refraction at infinite dilution. The values from [48] were calculated from the total in solution molar polarizability by the direct extrapolation method [23]. The values reported by Li et al. [23] were estimated from the slope K of a linear equation that relates the refractive index to the salt molar fraction. K depends on the constant γ’ that is obtained from fitting the solution volume Vsol with the molar fraction of the salt. Thus, it can be inferred that the polarizability value depends on the solution volume and refractive index values. The method we proposed also depends on the solution volume and refractive index because they are necessary to estimate the molar refraction at infinite dilution. Therefore, the differences between the values we obtained and those reported by Li et al. [23] could be related to the different methods used to estimate the solution volume. In our work, we calculated the molar volume using Equation (2) with density from Apelblat [41].
The effect of the ion nature on the refractive index and molar refraction can be explained by determining the ions’ polarizability as well as applying the hard and soft bases concept (HSAB). It is related to the atom or molecules’ polarizability [52].
The HSAB [52] states that the atoms or molecules can be classified as hard and soft according to the easiness with which their electrons can polarize (easy deformation of the electrical field). An atom or molecule that easy polarizes is called soft, otherwise it is called hard. The relevance of the hard/soft classification is related to the strength of the acid–basic interactions, the bonds, and their nature (ionic or covalent). Hard bases may coordinate with hard acids, by ionic bonds, and soft acids with soft bases, by covalent bonds. An indicator to classify the atoms or molecules is the absolute hardness η. The inverse of the hardness is the softness (σ = 1/η). Soft acid and bases have high polarizability. The interaction between molecules that increases the chemical hardness is promoted [53].
The polarizability of the ions was estimated using the procedure described in [20]. The reference ion was Li+ (αe = 0.029 Å3) [23,54]. The polarization of Cl− was obtained by subtracting the value of Li+ from the polarization of LiCl (Table 3). The value obtained for Cl− was used to calculate the polarization of Na+ and K+ from NaCl and KCl polarizability, respectively. The polarizability of SO42− was obtained for every sulfate salt studied using the polarization of Na+, Li+, and K+ ions calculated previously. The average polarizability of ion sulfate was calculated from the values obtained for every sulfate salt. Table 4 reports the estimated values. The ion polarizability increases with the ionic bare radius increments, but the polarizability decreases with the hardness increments.
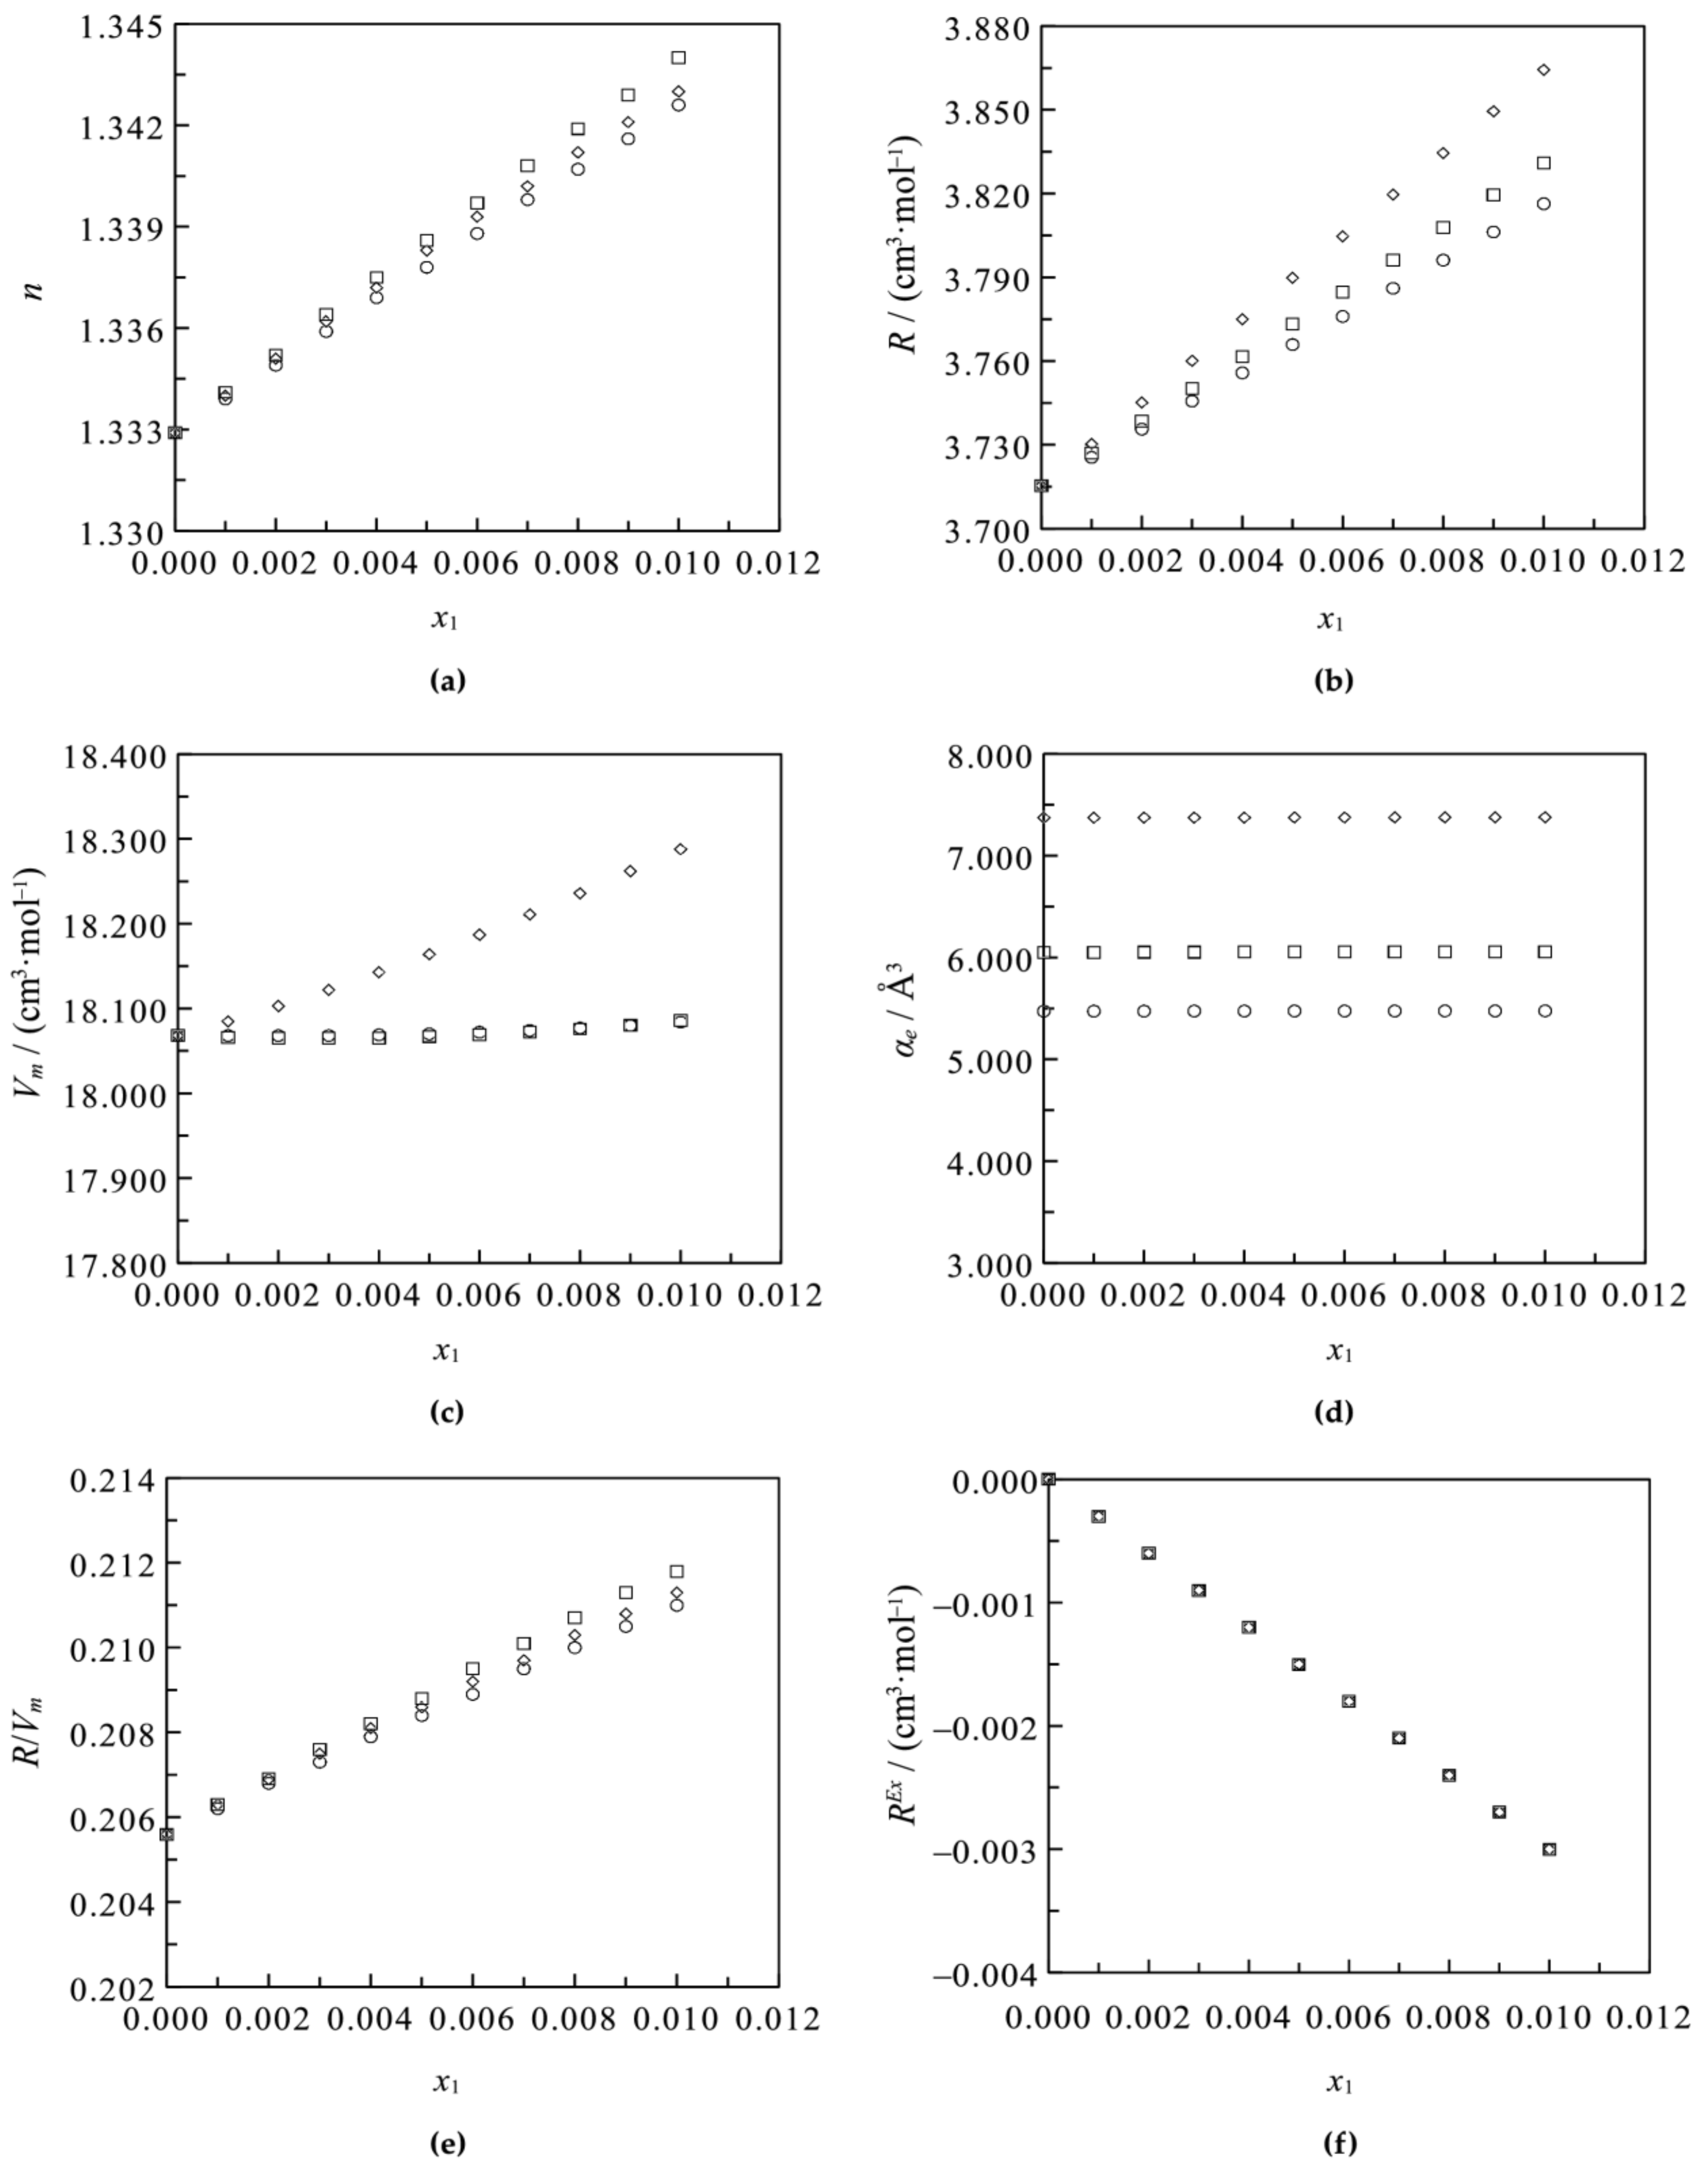
For the systems Na2SO4+H2O, K2SO4+H2O, and Li2SO4+H2O, the effect of salt concentration increments on the refractive index is related to the type of cation. The basis of this was the analysis of the cation effect on their refractive index, molar refraction, molar volume, salt polarizability coefficient, the ratio between the solution molar refraction and the molar volume (R/Vm), and excess molar refraction, when salt concentration increases at a constant temperature (Figure 8). Their values were calculated with the equations presented in Section 2 and the parameters estimated in this study.
Figure 8b shows that, in the presence of K+, the molar refraction has the greatest value. This can be explained by its greatest bare ionic radius and polarizability coefficient, as well as lowest hardness (Table 4). The ions’ effect follows the order K+ >Na+ > Li+, as shown in Figure 8c. In the case of the refractive index, the salt concentration effect is strong at high concentrations and the ions’ effect order (Na+ > K+ > Li+) is different from for molar refraction (Figure 8a,b). This is because the refractive index depends on the solution molar refraction and molar volume. The molar refraction increases in the order K+ > Na+ > Li+, but, although the molar volume is the greatest in presence of K+, there is no significant difference for Na+ and Li+ (Figure 8b,d). However, the salt effect on the refractive index is similar to the salt effect on R/Vm, as shown in Figure 8e. This implies that the refractive index is directly proportional to R/Vm. The excess molar refraction increases with salt concentration increments, as shown in Figure 8f; thus, it could be related to ion–water interactions changes.
The temperature effect was analyzed by comparing the properties of the sulfate salts at a constant salt concentration (Figure 9). The molar refraction is the greatest in the presence of potassium ion. The effect of the other ions follows the order Na+ > Li+. In presence of K+ and Na+, the molar refraction decreases slightly with temperature increments, but the in presence of Li+, this property has a low increase. This is attributed to the negligible effect of temperature on the ions’ polarizability. The refractive index decreases with temperature increments in the order Na+ > K+ > Li+. This property behavior is similar to that presented by the ratio of solution molar refraction to molar volume, as shown in Figure 9a,e. In this case, R/Vm reduces with the temperature increases. This means that the refractive index is directly proportional to R/Vm. Figure 9f shows that temperature changes are not significant for the excess molar refraction.
In the systems NaCl+H2O, KCl+H2O, and LiCl+H2O, the molar refraction increases with the growth in salt concentration. Moreover, the greatest effect on the molar refraction is attributed to the potassium ion (Figure 10b). The ions’ effect follows the order K+ > Na+ > Li+. The refractive index increases with the salt concentration increments (Figure 10a). There is no significant difference in the presence of the K+, Na+, and Li+ at low concentrations, while it is slightly greater for K+ >Na+ > Li+ when the concentration rises. This property has the same trend that R/Vm has with salt concentration increments, as shown in Figure 10a,e. The greatest molar volume is given in the presence of K+ ions, and significant differences in the presence of Na+ and Li+ ions are present at a higher salt concentration than 0.06 molar fraction (Figure 10c). The excess molar refraction is positive in presence of Na+ and Li+ and negative in the presence of K+. It increases in the presence of Na+ and Li+, but decreases in the presence of K+. This indicates that ion–water and ion–ion interactions are relevant in the presence of Na+ and Li+, but in the presence of K+, ion–water interactions are important.
The temperature effect was analyzed only in the presence of sodium and potassium ions (Figure 11). Figure 11b shows that molar refraction is not temperature dependent, but its value is greater in the presence of potassium ion than in the presence of sodium ion. This could be attributed to ions’ polarizability behavior (Figure 11d). Figure 11d shows that ions’ polarizability is not temperature dependent. Polarizability is greater for K+ than for Na+. The refractive index decreases slightly with the temperature increments (Figure 11a). This effect is greater for Na+ than K+. Moreover, it can be inferred from the refractive index and R/Vm behaviors (Figure 11a,e) that n is directly affected by changes in R/Vm. Figure 11f shows that only salt concentration variations affect the excess molar refraction.
The results suggest that the molar refraction and refractive index are more affected by salt concentration changes than for temperature variations. The K+, Na+, and Li+ effects on these properties are similar, but greater in the presence of sulfate than chloride ions at the same concentration range and constant temperature. This is attributed to the greater polarizability for SO42− than for Cl−. Moreover, the refractive index is directly proportional to R/Vm, and the solution molar volume is a relevant property to describe this property.
3.2. Ternary Systems
The molar refraction and refractive index of the systems H3BO3+Na2SO4+H2O and H3BO3+Li2SO4+H2O were described using Equations (13) and (15). The boric acid concentration was calculated with the equation reported in our previous work [58] because the solutions were saturated in boric acid. The concentrations were converted from molality to molar fraction to apply in the model. The partial and excess molar refraction were calculated from Equations (12) and (23), respectively. Table 2 presents the values used for the parameters b and R∞,0j for boric acid, sodium sulfate, and lithium sulfate. The model residuals were normally distributed. The model represented well the refractive index. In the presence of sodium sulfate, r2 is 0.9885 and S.E. is 0.0013, and in the presence of lithium sulfate, r2 is 0.9953 and S.E. is 0.0009. Moreover, good results were obtained for the molar refraction. In the presence of sodium sulfate, r2 is 0.9969 and S.E. is 0.0121 cm3·mol−1, and in the presence of lithium sulfate, r2 is 0.9948 and S.E. is 0.0122 cm3·mol−1.
Figure 12c,d shows that the molar refraction increases with the salt concentration and temperature increases. The refractive index increases considerably with salt concentration increases, but the temperature effect is negligible (Figure 12a,b). The excess molar refraction decreases in the presence of sodium sulfate, but increases in the presence of lithium sulfate (Figure 12e,f). This could be related to the behavior of these salts in the systems H3BO3+Salt+H2O. In the system, in the presence of sodium sulfate, the effect of salt concentration increments could be attributed to boric acid solubility increasing with salt concentration increases [58] (Figure 13a). This is because sodium sulfate behaves as a water structure breaker [19]. In the presence of lithium sulfate, the effect of salt concentration increments could be explained by the decreasing of boric acid solubility with increases in salt concentration [10] (Figure 13b). This is attributed to the behavior of lithium sulfate as a water structure maker [19]. This implies that, for these systems, the interactions between acid and water and between ion and water molecules are relevant. For both systems, the salt contribution is greater than the boric acid over the molar refraction. This is demonstrated by its greater partial molar refraction and salt polarization coefficient than that corresponding to boric acid (Figure 13a,b and Figure 14). The temperature effect is explained by the increasing of boric acid solubility with temperature increments at a constant salt concentration [10,58]. Figure 12a,b shows that the temperature effect on the refractive index is negligible. This is because R/Vm is not temperature dependent, as can be seen in Figure 13c,d.
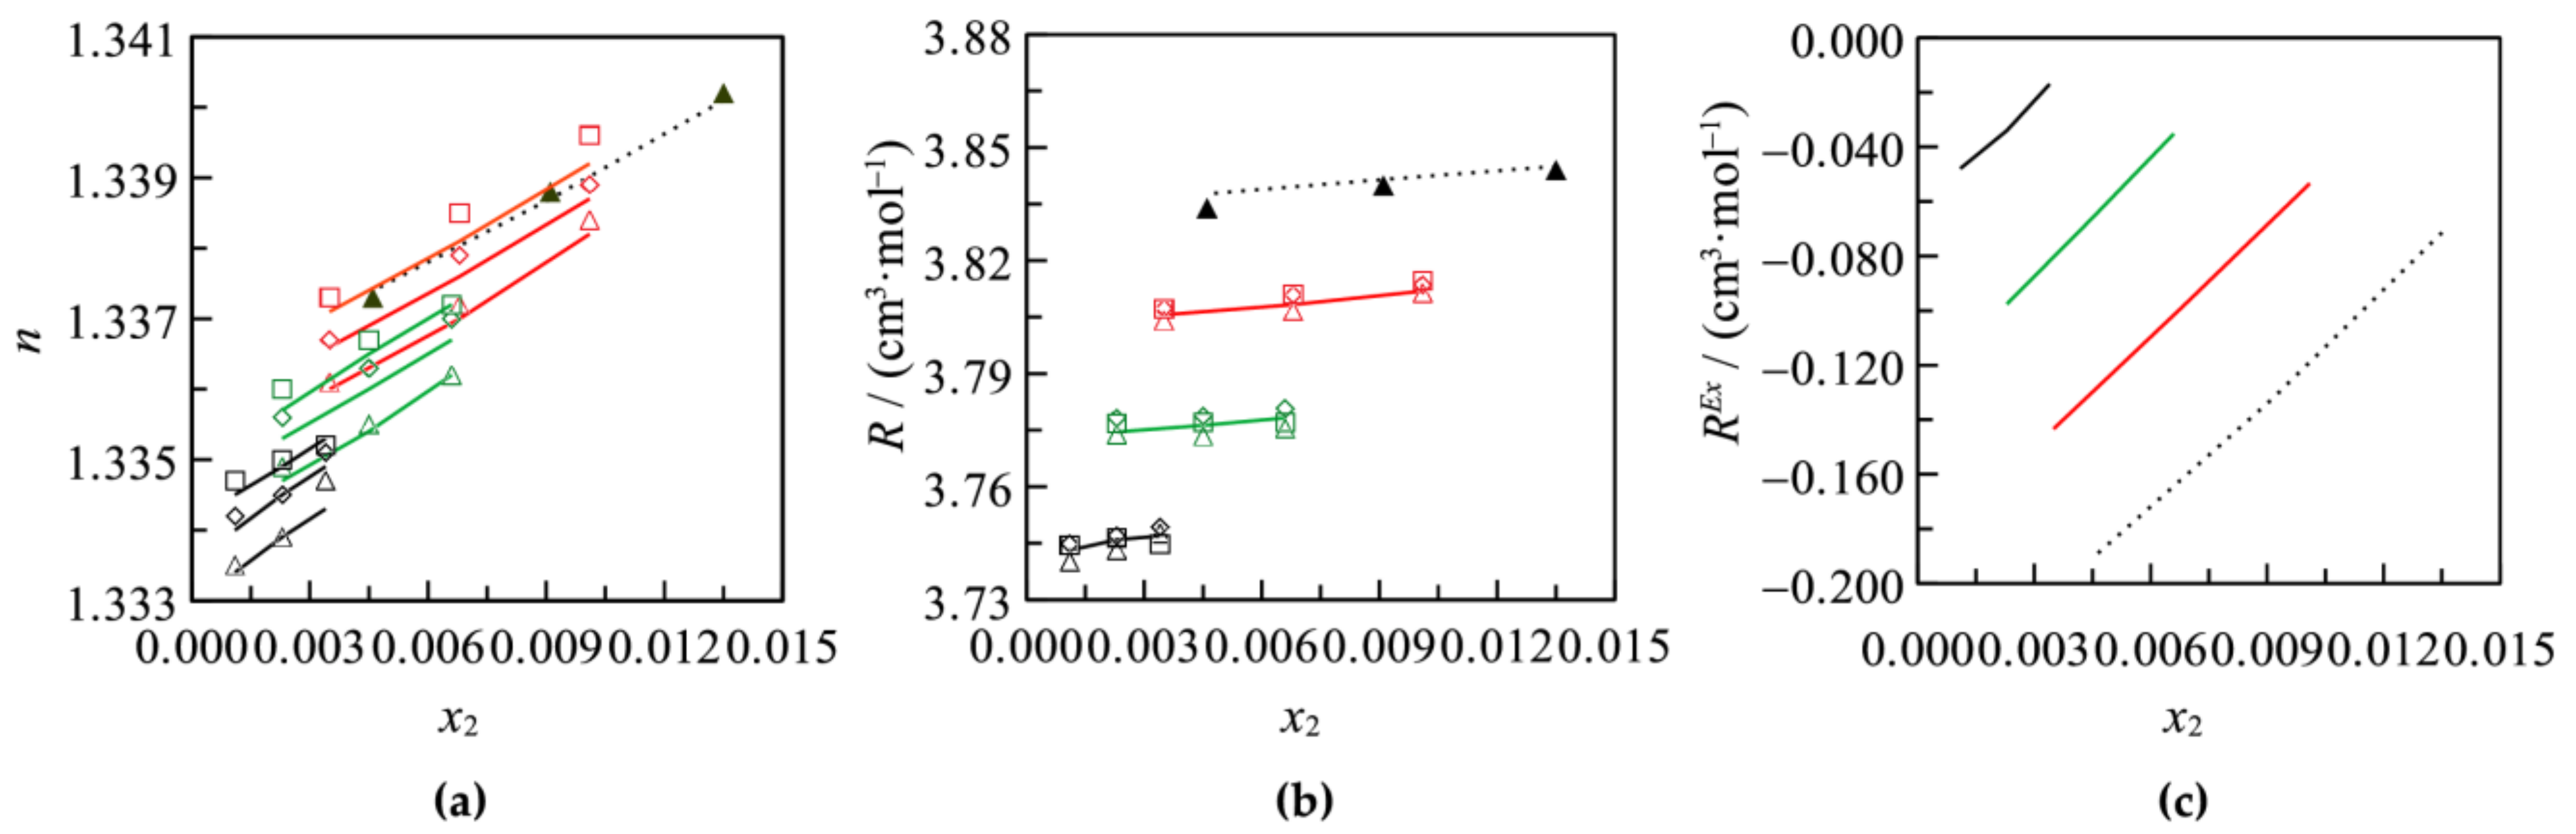
Figure 15 presents the molar refraction, refractive index, and excess molar refraction of the system H3BO3+KCl+H2O. Boric acid (1) and potassium chloride (2) solutions were studied at total solutes molar fractions (xT = x1 + x2): 0.0045 ± 0.0001, 0.0090 ± 0.0001, and 0.0182 ± 0.0001 at T = (293.15, 298.15, and 313.15) K. Both properties, molar refraction and refractive index, increase with salt and acid concentration increases, as shown in Figure 15a,b. The temperature effect on molar refraction is negligible, but that of the refractive index is not. It decreases when temperature rises at a constant salt concentration. Equations (13) and (15) represent appropriately the molar refraction and refractive index, respectively, using the binary parameters estimated for boric acid and potassium chloride (Table 2).
For the refractive index, r2 and S.E. are 0.9843 and 0.0002, respectively, and for the molar refraction, r2 is 0.9971 and S.E. is 0.0017 cm3·mol−1. The excess molar refraction was calculated from Equation (22). It is negative and decreases with salt and acid concentrations increment, but it is not affected by temperature changes, as shown in Figure 15c. This may imply that acid–water and ion–water interactions are relevant. For this system, the boric acid polarization increases with the salt and acid concentrations increases. Figure 16 shows that the polarizability of potassium chloride mainly depends on the salt concentration.
3.3. Models’ Estimation Applicability
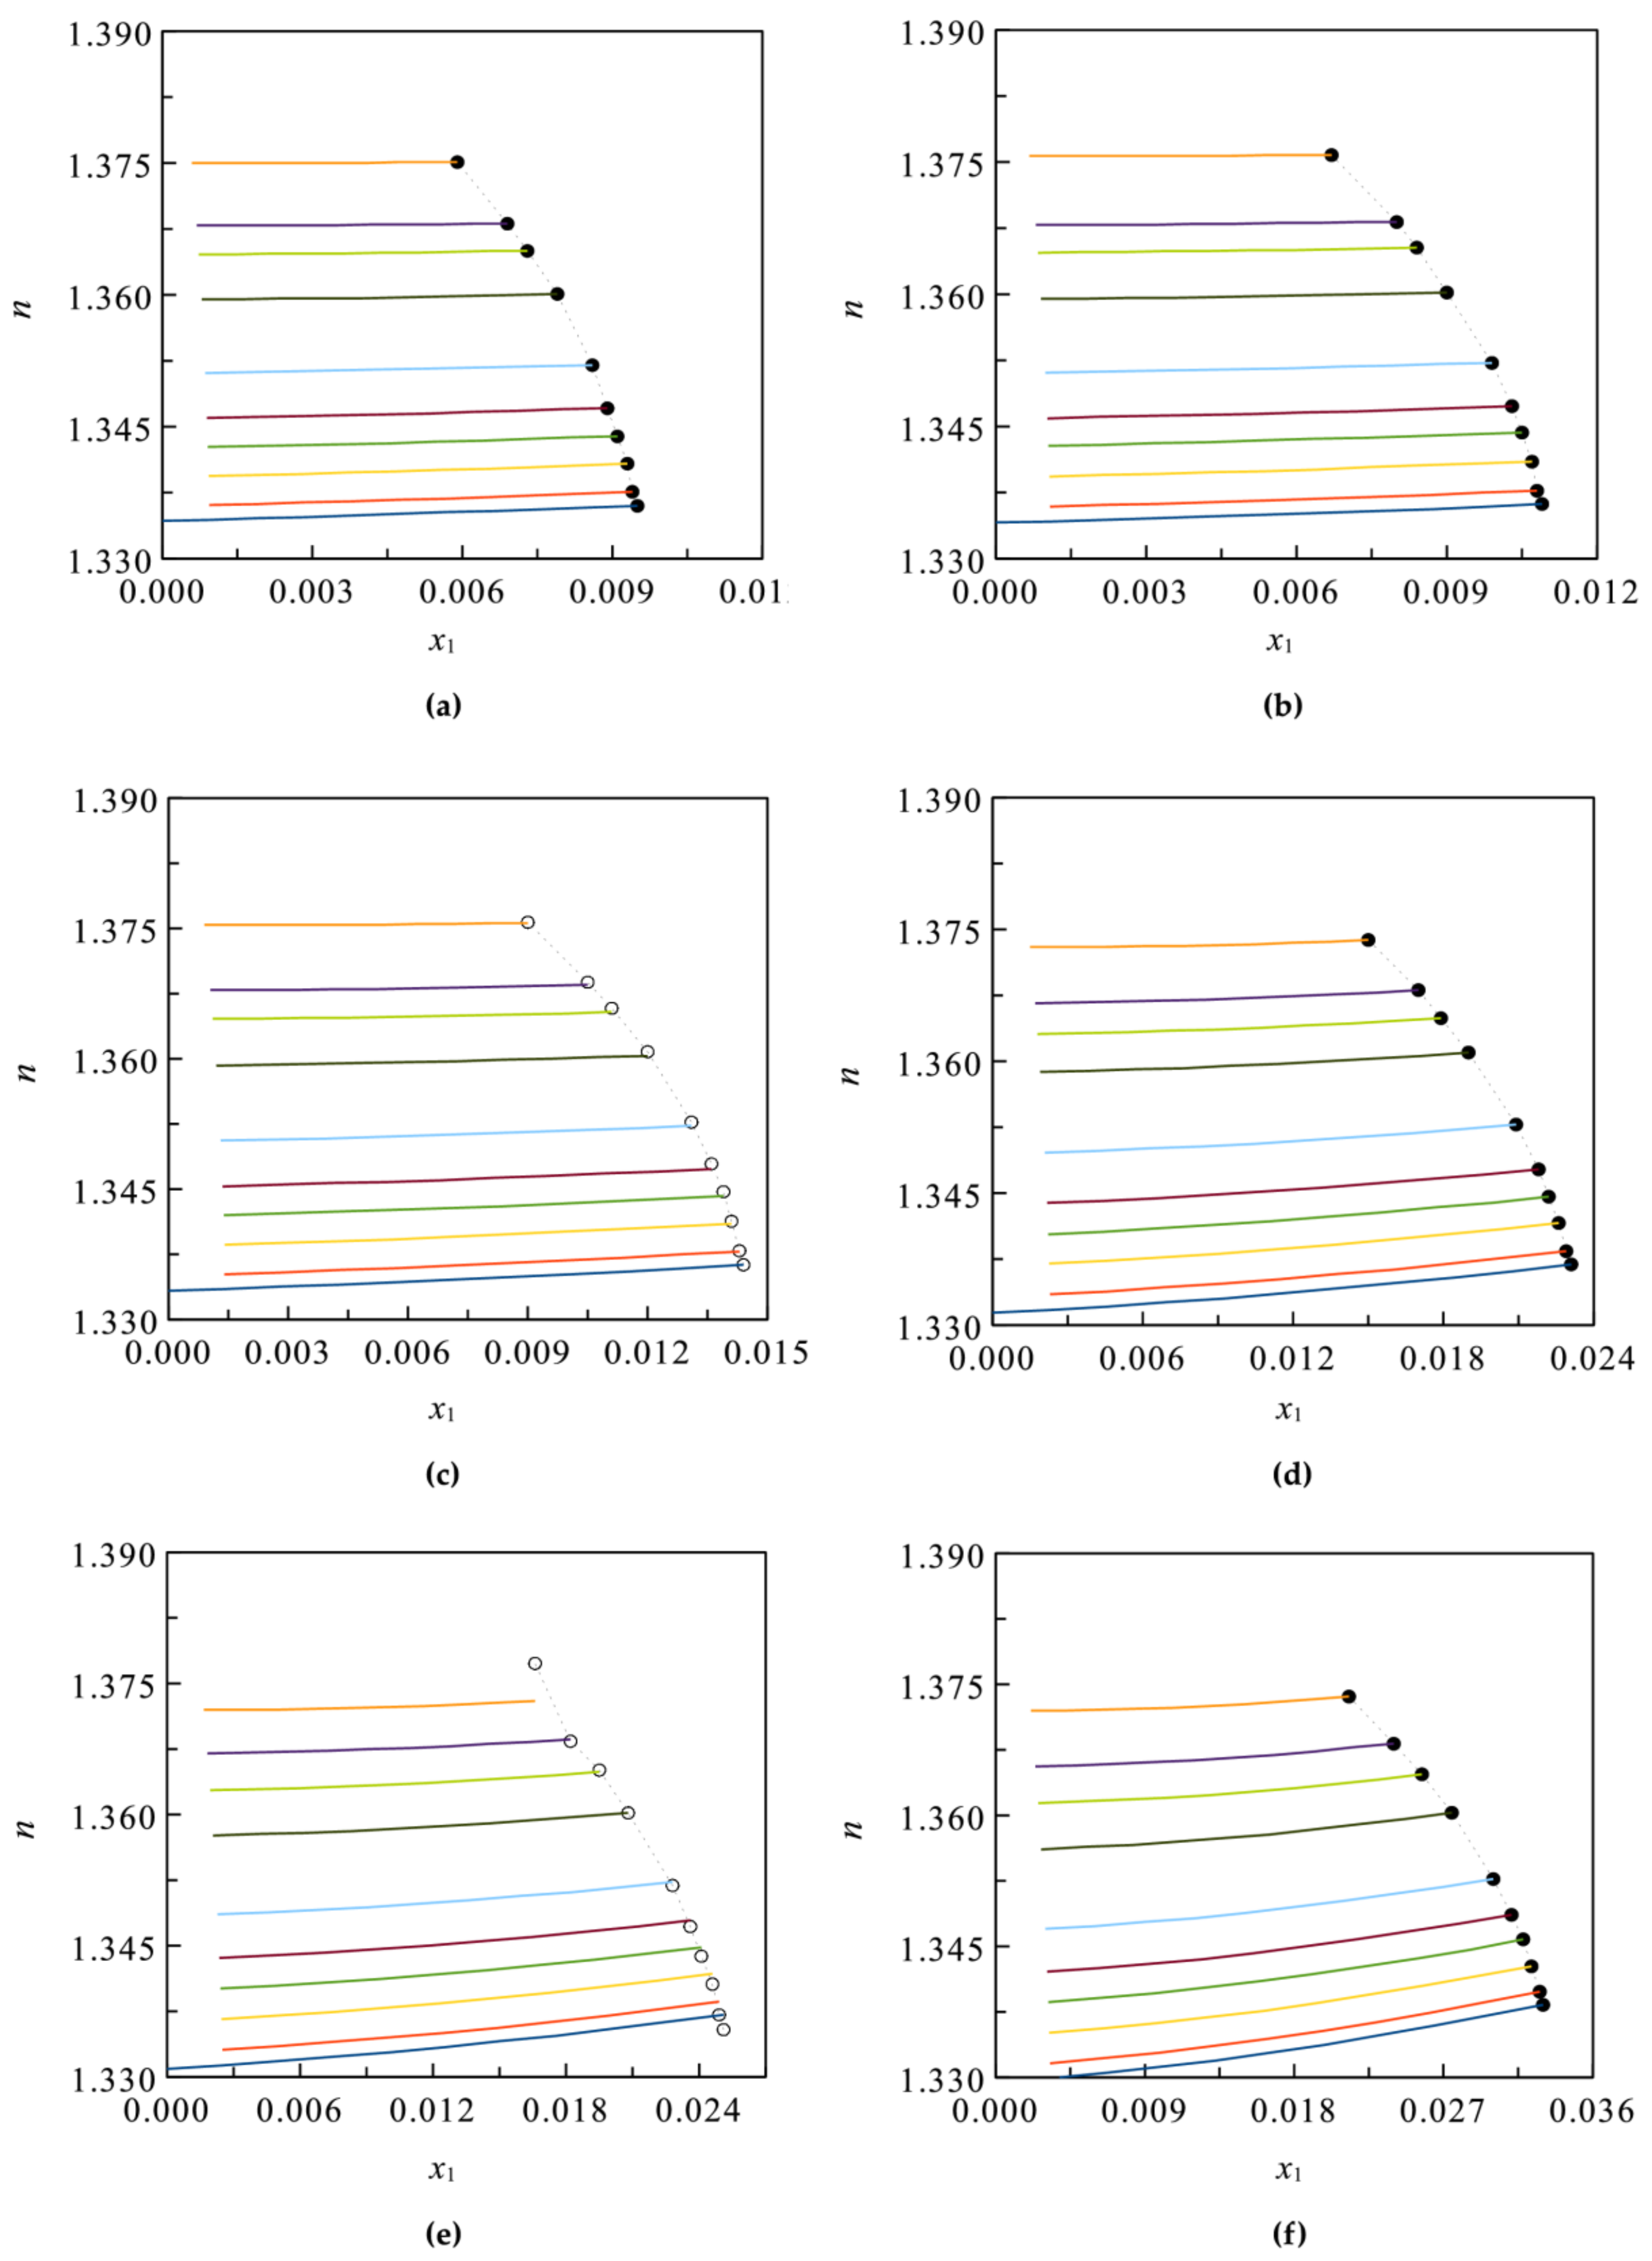
To demonstrate the estimation capabilities of the model within and beyond the range of the fitted experimental data, the molar refraction and refractive index for aqueous solutions of boric acid (1) in presence of lithium sulfate (2) were calculated from Equations (13) and (15), respectively. These properties were estimated from unsaturated to saturated solutions in boric acid at different lithium sulfate concentrations and temperatures between (283.15 and 323.15) K. The results are consistent at all temperatures and concentrations studied, as shown in Figure 17 and Figure 18.
These results and those presented in the previous sections support that the model is robust. The model could be applied to estimate the molar refraction, refractive index, and electrical polarizability coefficient of the solutes of the solutions studied, within and beyond the fitted range. Therefore, the model could provide valuable information to understand and follow the industrial processing of natural brines.
4. Conclusions
- The proposed model represents appropriately the refractive index and molar refraction. It is robust and has interpolation and extrapolation capabilities.
- The method proposed to estimate the electronic polarizability coefficient of the solutes is simple and robust.
- The interactions of boric acid, sodium, potassium, lithium, chloride, and sulfate ions with water molecules are relevant to explain the behaviors of the molar refraction and the refractive index of the binary and ternary systems studied.
- For the binary aqueous solutions of lithium chloride and sodium chloride, the ion–ion interactions are also relevant.
- The solute concentration effect is greater than the temperature effect on the molar refraction and refractive index of the solutions studied.
Supplementary Materials
The following are available online at https://www.mdpi.com/2227-9717/9/3/525/s1, Figure S1: Electric polarization coefficient αe of the system H3BO3+H2O calculated from Equation (25) at different boric acid molar fraction x and temperatures T: ◻, T = 293.15 K, ◇, T = 298.15 K, △, T = 303.15 K; Figure S2: Electric polarization coefficient αe of the system Na2SO4+H2O calculated from Equation (25) at different sodium sulfate molar fraction x and temperatures T: ▽, T = 288.15 K, ◇, T = 298.15 K, ○, T = 308.15 K, ▷, T = 318.15 K; Figure S3: Electric polarization coefficient αe of the system K2SO4 + H2O calculated from Equation (25) at different potassium sulfate molar fraction x and temperatures T: ◁, T = 278.15 K, ◇, T = 298.15 K, ○, T = 308.15 K, ▷, T = 318.15 K; Figure S4: Electric polarization coefficient αe of the system Li2SO4+H2O calculated from Equation (25) at different lithium sulfate molar fraction x and temperatures T: ▽, T = 288.15 K, ◇, T = 298.15 K, △, T = 308.15 K, ▷, T = 318.15 K; Figure S5: Electric polarization coefficient αe of the system NaCl+H2O calculated from Equation (25) at different sodium chloride molar fraction x and temperatures T: ◻, T = 293.15 K, ◇, T = 298.15 K, △, T = 303.15 K, ○, T = 308.15 K, ●, T = 313.15 K, ▷, T = 318.15 K; Figure S6: Electric polarization coefficient αe of the system LiCl+H2O calculated from Equation (25) at different lithium chloride molar fraction x and temperatures T: ◇, T = 298.15 K, ○, T = 308.15 K, ▷, T = 318.15 K; Figure S7: Electric polarization coefficient αe of the system KCl+H2O calculated from Equation (25) at different potassium chloride molar fraction x and temperatures T: ◻, T = 293.15 K, ◇, T = 298.15 K, △, T = 303.15 K.
Author Contributions
Conceptualization, W.A., J.A.L., and I.S.; methodology, W.A., I.S., and J.A.L.; formal analysis, W.A., I.S., and J.A.L.; investigation, W.A. and J.A.L.; writing—original draft preparation, W.A. and J.A.L.; writing—review and editing, W.A., J.A.L., and I.S. All authors have read and agreed to the published version of the manuscript.
Funding
This research was funded by VLmC—Visible Light Mine Communications STICAMSUD Grant 19-STIC-08.
Institutional Review Board Statement
Not applicable.
Informed Consent Statement
Not applicable.
Data Availability Statement
Not applicable.
Conflicts of Interest
The authors declare no conflict of interest.
References
- An, N.; Zhuang, B.; Li, M.; Lu, Y.; Wang, Z.-G. Combined Theoretical and Experimental Study of Refractive Indices of Water–Acetonitrile–Salt Systems. J. Phys. Chem. B 2015, 119, 10701–10709. [Google Scholar] [CrossRef]
- Biradar, U.V.; Dongarge, S.M. Refractive Index of Salt (NaCl) from Aquous Solution. Int. J. Comput. Inf. Sci. 2015, 4, 35–39. [Google Scholar]
- Wang, F.A.; Wang, J.Y.; Zhang, P.; Li, C.W.; Ren, B.Z. Measurement and Modeling of Refractive Indices for Multicomponent Chromium Compound Solutions. Chem. Eng. Technol. 2008, 31, 426–432. [Google Scholar] [CrossRef]
- Garces, I.; Reyes, J. Correlación Generalizada Para Predecir El Indice de Refracción En Soluciones Salinas Naturales. Modelo Predictivo Para El Sistema Na-Cl-SO4 a 1.0 Atm. Inf. Technol. 1997, 8, 189–194. [Google Scholar]
- Takubo, H. Refractive Index as a Measure for Saturation and Supersaturation in Crystal Growth of Water-Soluble Substances. J. Cryst. Growth 1990, 104, 239–244. [Google Scholar] [CrossRef]
- Galleguillos, H.R.; Flores, E.K.; Aguirre, C.E. Density and Refractive Index for Boric Acid + Potassium Chloride + Water and Disodium Tetraborate + Potassium Chloride + Water Systems at (20, 25, and 30) °C. J. Chem. Eng. Data 2001, 46, 1632–1634. [Google Scholar] [CrossRef]
- Tapia, J.; González, R.; Townley, B.; Oliveros, V.; Álvarez, F.; Aguilar, G.; Menzies, A.; Calderón, M. Geology and Geochemistry of the Atacama Desert. Antonie van Leeuwenhoek 2018, 111, 1273–1291. [Google Scholar] [CrossRef]
- Pavlovic-Zuvic, P. La industria del litio en Chile. Rev. Ing. 2014, 209, 24–29. [Google Scholar]
- Peiró, L.T.; Méndez, G.V.; Ayres, R.U. Lithium: Sources, Production, Uses, and Recovery Outlook. JOM 2013, 65, 986–996. [Google Scholar] [CrossRef] [Green Version]
- Alavia, W.; Lovera, J.A.; Cortez, B.A.; Graber, T.A. Solubility, Density, Refractive Index, Viscosity, and Electrical Conductivity of Boric Acid + Lithium Sulfate + Water System at (293.15, 298.15, 303.15, 308.15 and 313.15) K. J. Chem. Eng. Data 2013, 58, 1668–1674. [Google Scholar] [CrossRef]
- Kavanagh, L.; Keohane, J.; Garcia Cabellos, G.; Lloyd, A.; Cleary, J. Global Lithium Sources—Industrial Use and Future in the Electric Vehicle Industry: A Review. Resources 2018, 7, 57. [Google Scholar] [CrossRef] [Green Version]
- Pavlovic-Zuvic, P.; Parada-Frederick, N.; Vergara-Edwards, L. Recovery of potassium chloride, potassium sulfate and boric acid from the salar de atacama brines. In Proceedings of the 6th International Symposium on Salt, Toronto, ON, Canada, 24–28 May 1983; pp. 377–394. [Google Scholar]
- Ossandón, K.; Pinto, P.; Cisternas, L.A. Planning and Scheduling of Salt Harvest in Solar Evaporation Ponds. Comput. Chem. Eng. 2010, 34, 620–630. [Google Scholar] [CrossRef]
- Li, D.; Zeng, D.; Yin, X.; Gao, D.; Fan, Y. Phase Diagrams and Thermochemical Modeling of Salt Lake Brine Systems: IV. Thermodynamic Framework and Program Implementation for Multicomponent Systems. Calphad 2020, 71, 101806. [Google Scholar] [CrossRef]
- Guo, Y.; Song, J.; Zhao, K.; Yu, Y.; Deng, T. Solubilities, Densities and Refractive Indices of the Reciprocal Quaternary Systems (Na+, K+//Cl−, B5O8−-H2O) and (Li+, K+//Cl−, B5O8−-H2O) at 298.15 K and Atmospheric Pressure. Fluid Phase Equilibria 2020, 516, 112594. [Google Scholar] [CrossRef]
- Song, W.; Gang, H.; Ma, Y.; Yang, S.; Mu, B. Migration Behavior of Lithium during Brine Evaporation and KCl Production Plants in Qarhan Salt Lake. Minerals 2017, 7, 57. [Google Scholar] [CrossRef] [Green Version]
- Mohr, S.H.; Mudd, G.M.; Giurco, D. Lithium Resources and Production: Critical Assessment and Global Projections. Minerals 2012, 2, 65. [Google Scholar] [CrossRef]
- Guo, Y.; Li, L.; Cao, L.; Yu, X.; Wang, S.; Deng, T. Solubilities, Densities and Refractive Indices in the Aqueous Quaternary System of Lithium Sulfate, Lithium Metaborate, and Lithium Carbonate at 288.15, 298.15, 308.15 K and 0.1 MPa. J. Chem. Eng. Data 2017, 62, 508–515. [Google Scholar] [CrossRef]
- Alavia, W.; Lovera, J.A.; Graber, T.A.; Azúa, D.; Soto, I. Modeling of the Density, Viscosity and Electrical Conductivity of Aqueous Solutions Saturated in Boric Acid in Presence of Lithium Sulfate or Sodium Sulfate at 293.15 to 313.15 K. Fluid Phase Equilibria 2021, 532, 112864. [Google Scholar] [CrossRef]
- Pacak, P. Molar Refractivity and Interactions in Solutions. 1. Molar Refractivity of Some Monovalent Ions in Aqueous and Dimethyl Sulfoxide Solutions. Chem. Pap. 1989, 43, 489–500. [Google Scholar]
- Pacak, P. Molar Refractivity and Interactions in Solutions. 2. Molar Refractivity of Tetraalkylammonium Salts in Aqueous and Dimethyl Sulfoxide Solutions. Chem. Pap. 1989, 43, 501–505. [Google Scholar]
- Deosarkar, S.D.; Pandhare, V.V.; Kattekar, P.S. Densities and Refractive Indices of Potassium Salt Solutions in Binary Mixture of Different Compositions. J. Eng. 2012, 2013, 368576. [Google Scholar] [CrossRef] [Green Version]
- Li, M.; Zhuang, B.; Lu, Y.; Wang, Z.-G.; An, L. Accurate Determination of Ion Polarizabilities in Aqueous Solutions. J. Phys. Chem. B 2017, 121, 6416–6424. [Google Scholar] [CrossRef]
- Wang, C.C.; Tan, J.Y.; Liu, L.H. Wavelength and Concentration-Dependent Optical Constants of NaCl, KCl, MgCl2, CaCl2, and Na2SO4 Multi-Component Mixed-Salt Solutions. Appl. Opt. 2017, 56, 7662–7671. [Google Scholar] [CrossRef]
- Leyendekkers, J.V.; Hunter, R.J. The Tammann-Tait-Gibson Model for Aqueous Electrolyte Solutions: Application to the Refractive Index. J. Phys. Chem. 1977, 81, 1657–1663. [Google Scholar] [CrossRef]
- Leyendekkers, J.V.; Hunter, R.J. Refractive Index of Aqueous Electrolyte Solutions. Extrapolations to Other Temperatures, Pressures, and Wavelengths and to Multicomponent Systems. J. Chem. Eng. Data 1977, 22, 427–431. [Google Scholar] [CrossRef]
- Padova, J. Ion–solvent interaction in mixed solvents: Part III. The molar refraction of electrolytes. Can. J. Chem. 1965, 43, 458–462. [Google Scholar] [CrossRef]
- Li, M.; Lu, Y.; An, L. Ion Polarizabilities in Binary Liquid Mixtures of Water/Organic Solvents. J. Phys. Chem. B 2018, 122, 10023–10030. [Google Scholar] [CrossRef]
- Umaley, K.D.; Pethe, G.B.; Aswar, A.S. Volumetric, Viscometric, Acoustical, and Optical Studies of Glutamic Acid in Aqueous Zinc and Copper Chloride Solutions. Russ. J. Phys. Chem. B 2013, 7, 11–22. [Google Scholar] [CrossRef]
- Tan, C.-Y.; Huang, Y.-X. Dependence of Refractive Index on Concentration and Temperature in Electrolyte Solution, Polar Solution, Nonpolar Solution, and Protein Solution. J. Chem. Eng. Data 2015, 60, 2827–2833. [Google Scholar] [CrossRef]
- Baxter, G.P.; Boylston, A.C.; Mueller, E.; Black, N.H.; Goode, P.B. The refractive power of the halogen salts of lithium, sodium and potassium in aqueous solution. J. Am. Chem. Soc. 1911, 33, 901–922. [Google Scholar] [CrossRef] [Green Version]
- Yu, X.; Wang, H.; Guo, Y.; Deng, T. Phase Equilibrium and Solvation Effect of the Ternary Mixture Solvent System (LiCl + CH3OH + H2O) at 298.15, 308.15 and 318.15 K. J. Solut. Chem. 2019, 48, 515–527. [Google Scholar] [CrossRef]
- Urréjola, S.; Sánchez, A.; Hervello, M.F. Refractive Indices of Sodium, Potassium, and Ammonium Sulfates in Ethanol–Water Solutions. J. Chem. Eng. Data 2010, 55, 2924–2929. [Google Scholar] [CrossRef]
- Silva, R.M.M.; Minim, L.A.; Coimbra, J.S.R.; Rojas, E.E.G.; da Silva, L.H.M.; Minim, V.P.R. Density, Electrical Conductivity, Kinematic Viscosity, and Refractive Index of Binary Mixtures Containing Poly(Ethylene Glycol) 4000, Lithium Sulfate, and Water at Different Temperatures. J. Chem. Eng. Data 2007, 52, 1567–1570. [Google Scholar] [CrossRef]
- Wang, F.A.; Chen, H.S.; Zhu, J.Q.; Song, J.C.; Wang, Z.C. Estimation of Excess Enthalpy for Binary Systems. Chem. Eng. J. 2002, 85, 235–243. [Google Scholar] [CrossRef]
- Stelson, A.W. Urban Aerosol Refractive Index Prediction by Partial Molar Refraction Approach. Environ. Sci. Technol. 1990, 24, 1676–1679. [Google Scholar] [CrossRef]
- Teodorescu, M.; Secuianu, C. Refractive Indices Measurement and Correlation for Selected Binary Systems of Various Polarities at 25 °C. J. Solut. Chem. 2013, 42, 1912–1934. [Google Scholar] [CrossRef]
- Krishna, T.S.; Nain, A.K.; Chentilnath, S.; Punyaseshudu, D.; Munibhadrayya, B. Densities, Ultrasonic Speeds, Refractive Indices, Excess and Partial Molar Properties of Binary Mixtures of Imidazolium Based Ionic Liquid with Pyrrolidin-2-One at Temperatures from 298.15L to 323.15K. J. Chem. Thermodyn. 2016, 101, 103–114. [Google Scholar] [CrossRef]
- Cai, C.; Miles, R.E.H.; Cotterell, M.I.; Marsh, A.; Rovelli, G.; Rickards, A.M.J.; Zhang, Y.; Reid, J.P. Comparison of Methods for Predicting the Compositional Dependence of the Density and Refractive Index of Organic–Aqueous Aerosols. J. Phys. Chem. A 2016, 120, 6604–6617. [Google Scholar] [CrossRef] [Green Version]
- Harvey, A.H.; Gallagher, J.S.; Sengers, J.M.H.L. Revised Formulation for the Refractive Index of Water and Steam as a Function of Wavelength, Temperature and Density. J. Phys. Chem. Ref. Data 1998, 27, 761–774. [Google Scholar] [CrossRef] [Green Version]
- Apelblat, A. A New Two-Parameter Equation for Correlation and Prediction of Densities as a Function of Concentration and Temperature in Binary Aqueous Solutions. J. Mol. Liq. 2016, 219, 313–331. [Google Scholar] [CrossRef]
- Patwardhan, V.S.; Kumar, A. A Unified Approach for Prediction of Thermodynamic Properties of Aqueous Mixed-Electrolyte Solutions: Part I: Vapor Pressure and Heat of Vaporization. AIChE J. 1986, 32, 1419–1428. [Google Scholar] [CrossRef]
- Patwardhan, V.S.; Kumar, A. A Unified Approach for Prediction of Thermodynamic Properties of Aqueous Mixed-Electrolyte Solutions: Part II: Volume, Thermal, and Other Properties. AIChE J. 1986, 32, 1429–1438. [Google Scholar] [CrossRef]
- Cottrel, A.; Lucchetti, R. Gretl: GNU Regression, Econometric and Time-Series Library. 2020. Available online: http://gretl.sourceforge.net/ (accessed on 2 March 2021).
- Tang, I.N.; Munkelwitz, H.R. Water Activities, Densities, and Refractive Indices of Aqueous Sulfates and Sodium Nitrate Droplets of Atmospheric Importance. J. Geophys. Res. Atmos. 1994, 99, 18801–18808. [Google Scholar] [CrossRef]
- Lühdemann, R. Über Die Konzentrationsabhängigkeit Der Äquivalentrefraktion Einiger Salze Und Säuren in Wässeriger Lösung. Zeitschrift für Physikalische Chemie 1935, 29B, 133–149. [Google Scholar] [CrossRef]
- Cheng, F.; Cao, Q.; Guan, Y.; Cheng, H.; Wang, X.; Miller, J.D. FTIR Analysis of Water Structure and Its Influence on the Flotation of Arcanite (K2SO4) and Epsomite (MgSO4·7H2O). Int. J. Miner. Process. 2013, 122, 36–42. [Google Scholar] [CrossRef] [Green Version]
- Pyper, N.C.; Pike, C.G.; Edwards, P.P. The Polarizabilities of Species Present in Ionic Solutions. Mol. Phys. 1992, 76, 353–372. [Google Scholar] [CrossRef]
- Conte, P. Effects of Ions on Water Structure: A Low-Field 1H T1 NMR Relaxometry Approach. Magn. Reson. Chem. 2015, 53, 711–718. [Google Scholar] [CrossRef] [PubMed] [Green Version]
- Chialvo, A.A.; Simonson, J.M. Ion Association in Aqueous LiCl Solutions at High Concentration: Predicted Results via Molecular Simulation. J. Chem. Phys. 2006, 124, 154509. [Google Scholar] [CrossRef]
- Heydweiller, A. Optische Untersuchungen an Wasserigen Elektrolytlosungen. Physikalische Zeitschrift 1925, 26, 526–556. [Google Scholar]
- Pearson, R.G. Absolute Electronegativity and Hardness: Application to Inorganic Chemistry. Inorg. Chem. 1988, 27, 734–740. [Google Scholar] [CrossRef]
- Chattaraj, P.K.; Ayers, P.W.; Melin, J. Further Links between the Maximum Hardness Principle and the Hard/Soft Acid/Base Principle: Insights from Hard/Soft Exchange Reactions. Phys. Chem. Chem. Phys. 2007, 9, 3853–3856. [Google Scholar] [CrossRef]
- Molina, J.J.; Lectez, S.; Tazi, S.; Salanne, M.; Dufrêche, J.-F.; Roques, J.; Simoni, E.; Madden, P.A.; Turq, P. Ions in Solutions: Determining Their Polarizabilities from First-Principles. J. Chem. Phys. 2011, 134, 014511. [Google Scholar] [CrossRef] [PubMed]
- Volkov, A.G.; Paula, S.; Deamer, D.W. Two Mechanisms of Permeation of Small Neutral Molecules and Hydrated Ions across Phospholipid Bilayers. Bioelectrochem. Bioenerg. 1997, 42, 153–160. [Google Scholar] [CrossRef]
- Tessman, J.R.; Kahn, A.H.; Shockley, W. Electronic Polarizabilities of Ions in Crystals. Phys. Rev. 1953, 92, 890–895. [Google Scholar] [CrossRef]
- Pearson, R.G. Hard and Soft Acids and Bases, HSAB, Part 1: Fundamental Principles. J. Chem. Educ. 1968, 45, 581. [Google Scholar] [CrossRef]
- Alavia, W.; Lovera, J.; Graber, T.A. Thermodynamic Modeling of the Solubility of Boric Acid in the Systems Boric Acid+lithium Sulfate + water, Boric Acid+sodium Sulfate + water and Boric Acid + potassium Sulfate + water at 293.15–313.15K. Fluid Phase Equilibria 2015, 398, 63–71. [Google Scholar] [CrossRef]
Figure 1.
(a) Refractive index n of the system H3BO3+H2O at different temperatures T and boric acid molar fractions x1. Experimental data from [6] at ◻, T = 293.15 K; △, T = 298.15 K; ◇, T = 303.15 K; ─, calculated from Equation (15). (b) Molar refraction R of the system H3BO3+H2O. Data calculated from Equations (1) and (19) using density and refractive index from [6] at ◻, T = 293.15 K; △, T = 298.15 K; ◇, T = 303.15 K; ─, calculated from Equation (21) at T = 303.15 K. (c) Excess molar refraction REx of the system H3BO3+H2O calculated from Equation (9) at T = 303.15 K.

Figure 2.
(a) Refractive index n of the system Na2SO4+H2O at different temperatures T and sodium sulfate molar fractions x1. Experimental data from [33] at ▽, T = 288.15 K; ◇, T = 298.15 K; ○, T = 308.15 K; ▷, T = 318.15 K; ─, calculated from Equation (15). (b) Molar refraction R of the system Na2SO4+H2O. Data calculated from Equations (1) and (19) using density from [41] and refractive index from [33] at ▽, T = 288.15 K; ◇, T = 298.15 K; ○, T = 308.15 K; ▷, T = 318.15 K; ─, calculated from Equation (21) at T = 318.15 K. (c) Excess molar refraction REx of the system Na2SO4+H2O calculated from Equation (9) at T = 318.15 K.

Figure 3.
(a) Refractive index n of the system Li2SO4+H2O at different temperatures T and lithium sulfate molar fractions x1. Experimental data from [34] at ◁, T = 278.15 K; ◇, T = 298.15 K; ○, T = 308.15 K; ▷, T = 318.15 K; ─, calculated from Equation (15). (b) Molar refraction R of the system Li2SO4+H2O: data calculated from Equations (1) and (19) using density and refractive index from [34] at ◁, T = 278.15 K; ◇, T = 298.15 K; ○, T = 308.15 K; ▷, T = 318.15 K; ─, calculated from Equation (21). (c) Excess molar refraction REx of the system Li2SO4+H2O calculated from Equation (9) at T = 318.15 K.

Figure 4.
(a) Refractive index n of the system K2SO4+H2O at different temperatures T and potassium sulfate molar fractions x1. Experimental data from [33] at ▽, T = 288.15 K; ◇, T = 298.15 K; △, T = 308.15 K; ▷, T = 318.15 K; ─, calculated from Equation (15). (b) Molar refraction R of the system K2SO4+H2O. Data calculated from Equations (1) and (19) using density from [41] and refractive index from [33] at ▽, T = 288.15 K; ◇, T = 298.15 K; △, T = 308.15 K; ▷, T = 318.15 K; ─, calculated from Equation (21) at T = 318.15 K. (c) Excess molar refraction REx of the system K2SO4+H2O calculated from Equation (9) at T = 318.15 K.

Figure 5.
(a) Refractive index n of the system NaCl+H2O at different temperatures T and NaCl molar fractions x1. Experimental data from [30] at ◻, T = 293.15 K; ◇, T = 298.15 K; △, T = 303.15 K; ○, T = 308.15 K; ●, T = 313.15 K; ▷, T = 318.15 K; ─, calculated from Equation (15). (b) Molar refraction R of the system NaCl+H2O. Data calculated from Equations (1) and (19) using density from [41] and refractive index from [30] at ◻, T = 293.15 K; ◇, T = 298.15 K; △, T = 303.15 K; ○, T = 308.15 K; ●, T = 313.15 K; ▷, T = 318.15 K; ─, calculated from Equation (21) at T = 318.15 K. (c) Excess molar refraction REx of the system NaCl+H2O calculated from Equation (9) at T = 318.15 K.

Figure 6.
(a) Refractive index n of the system LiCl+H2O at different temperatures T and LiCl molar fractions x1. Experimental data from [31,32] at ◇, T = 298.15 K; ○, T = 308.15 K; ▷, T = 318.15 K; ─, T = 298.15 K; ◻, T = 308.15K; △, T = 318.15 K calculated from Equation (15). (b) Molar refraction R of the system LiCl+H2O. Data calculated from Equations (1) and (19) using density and refractive index from [31,32] at ◇, T = 298.15 K; ○, T = 308.15 K; ▷, T = 318.15 K; ─, T = 298.15 K; ◻, T = 308.15 K; △, T = 318.15 K calculated from Equation (21). (c) Excess molar refraction REx of the system LiCl+H2O calculated from Equation (9) at T = 298.15 K.

Figure 7.
(a) Refractive index n of the system KCl+H2O at different temperatures and potassium chlorides molar fractions x1. Experimental data from [6] at ◻, T = 293.15 K; ◇, T = 298.15 K; △, T = 303.15 K; ─, calculated from Equation (15). (b) Molar refraction R of the systems KCl+H2O. Data calculated from Equations (1) and (19) using density and refractive index from [6] at ◻, T = 293.15 K; ◇, T = 298.15 K; △, T = 303.15 K; ─, calculated from Equation (21). (c) Excess molar refraction REx of the system KCl+H2O calculated from Equation (9) at T = 303.15 K.

Figure 8.
Comparison of the physicochemical properties of the systems: ◻, Na2SO4+H2O; ◇, K2SO4+H2O; and o, Li2SO4+H2O for different salt molar fraction x1 at 298.15 K. (a) Refractive index n estimated from Equation (15). (b) Molar refraction R calculated from Equation (21). (c) Molar volume Vm calculated from Equation (19) using density from [41]. (d) Electronic polarizability coefficient αe calculated from Equation (25). (e) Molar refraction to molar volume ratio R/Vm calculated dividing the values obtained in (a,c). (f) Excess molar refraction REx calculated from Equation (9).

Figure 9.
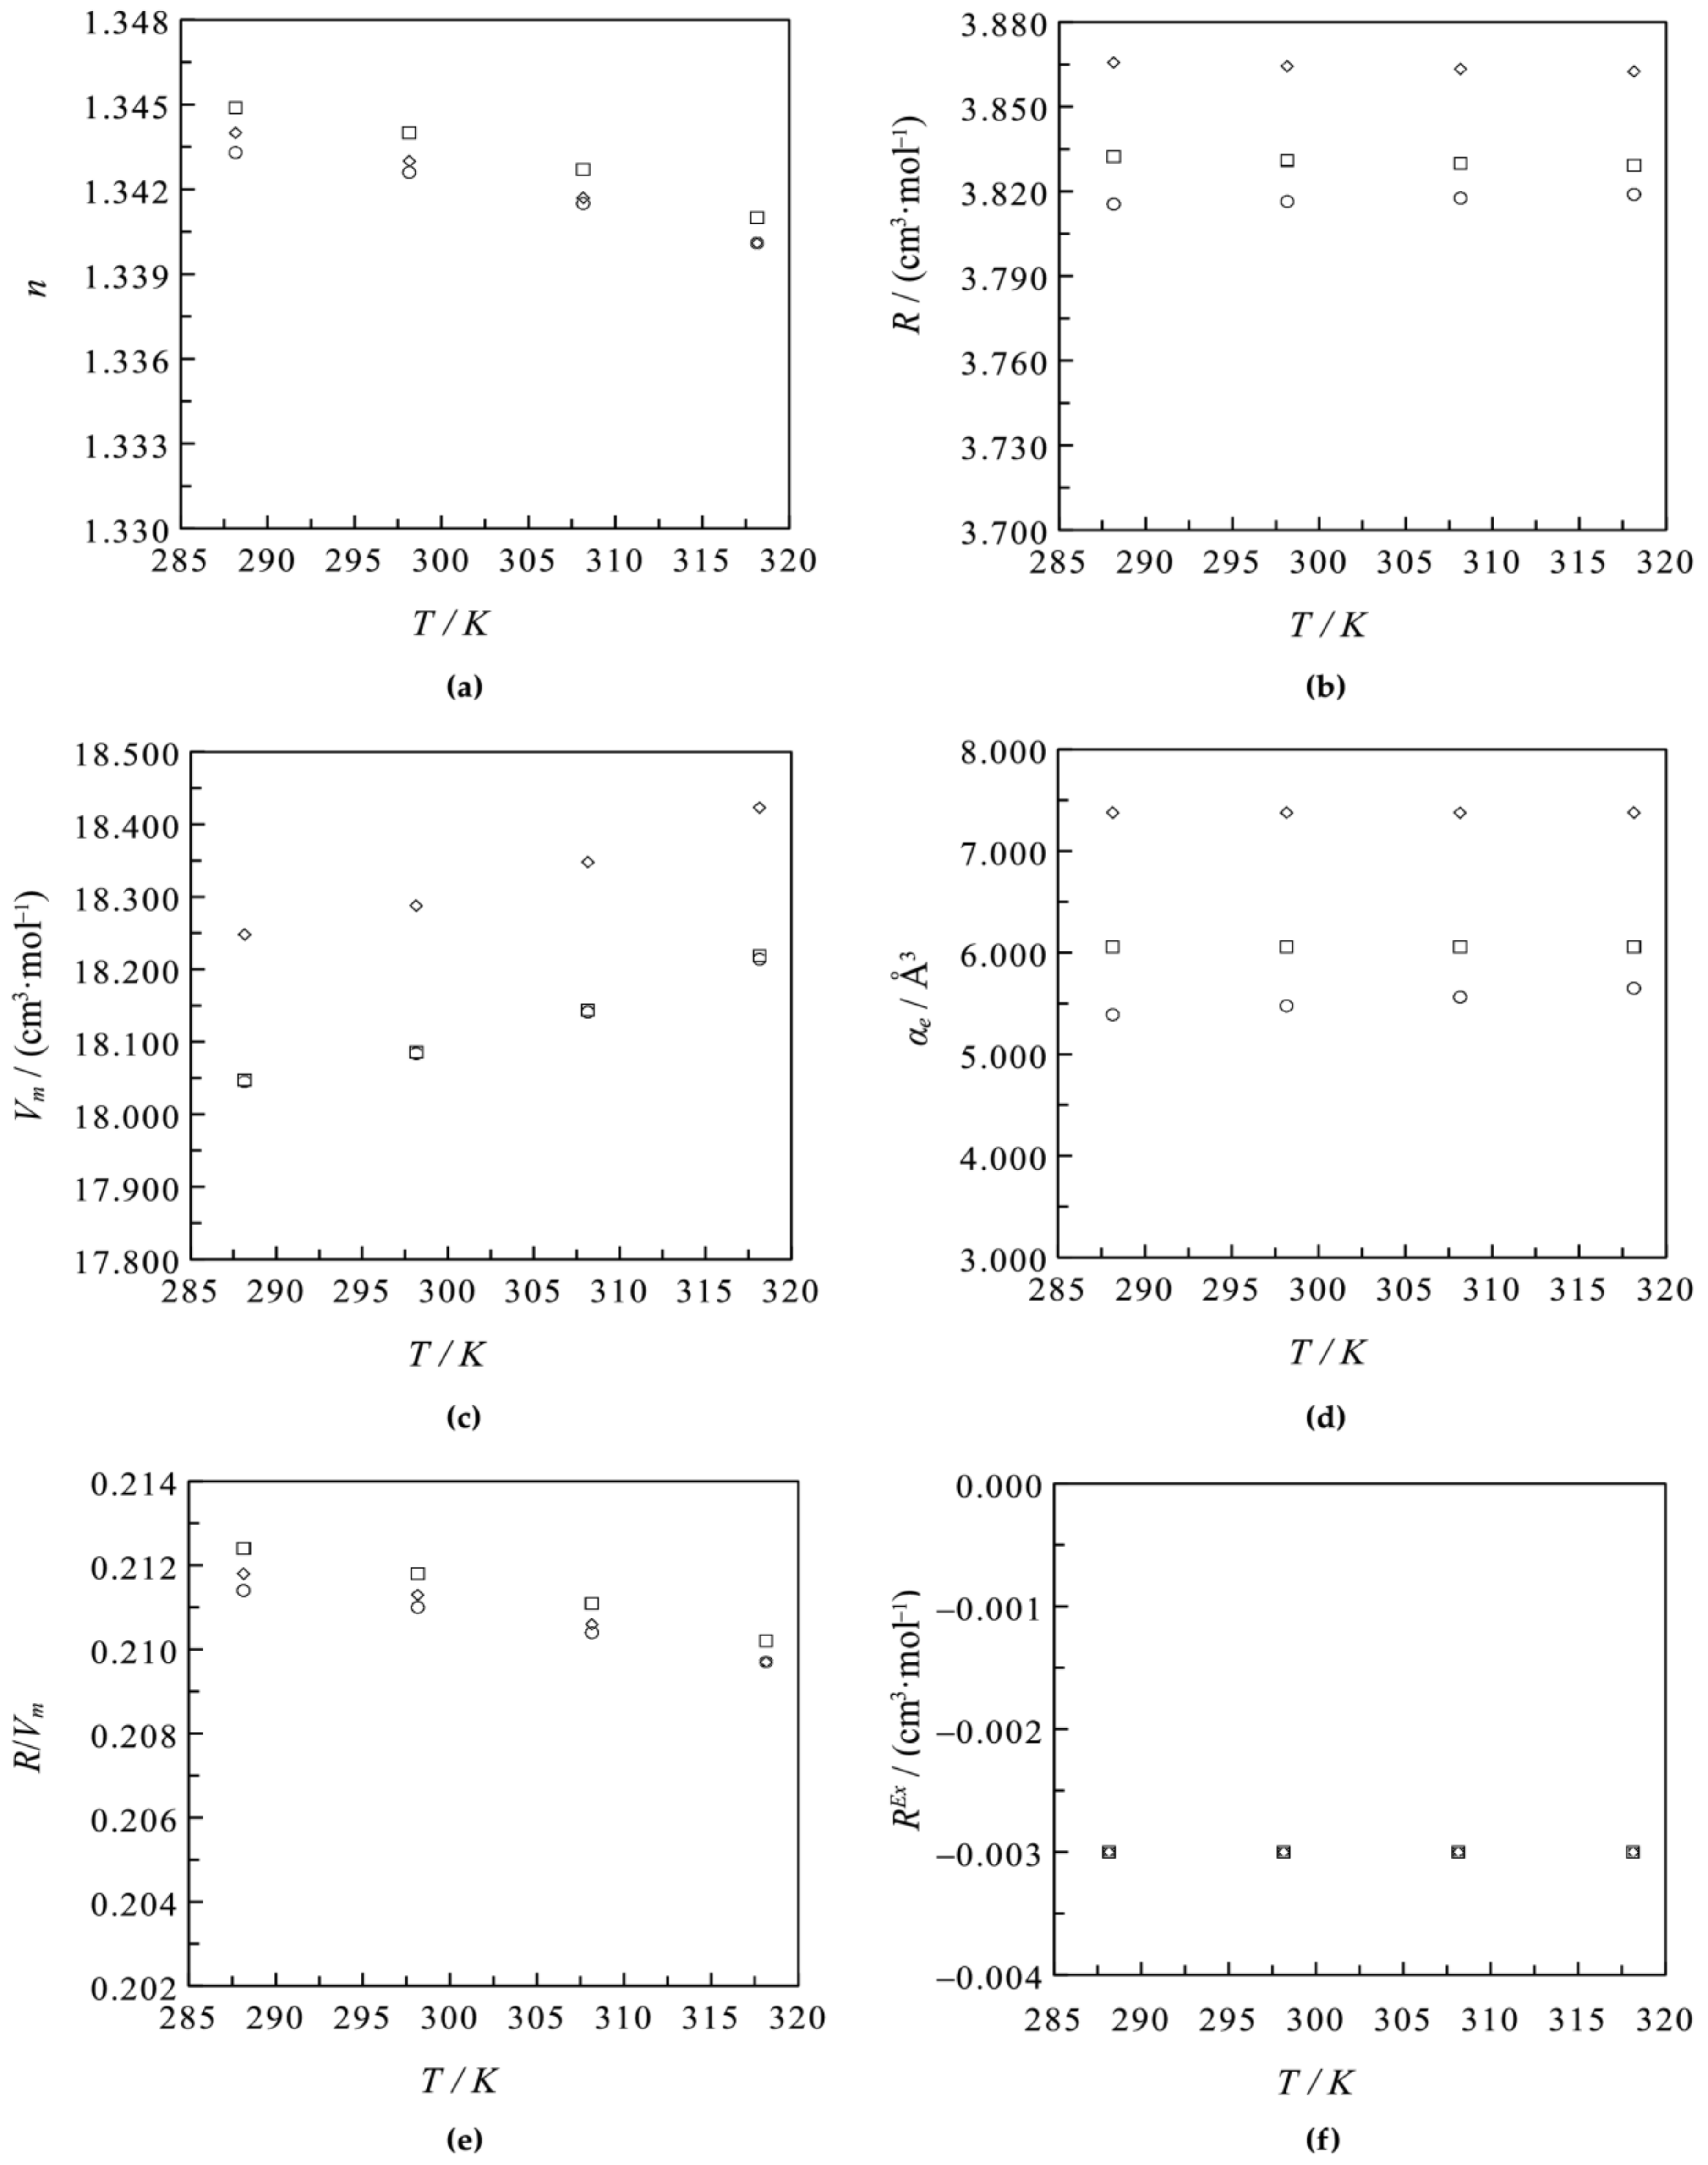
Comparison of the physicochemical properties of the systems: ◻, Na2SO4+H2O; ◇, K2SO4+H2O; and o, Li2SO4+H2O for different temperatures T at salt molar fraction x1 = 0.06. (a) Refractive index n estimated from Equation (15). (b) Molar refraction R calculated from Equation (21). (c) Molar volume Vm calculated from Equation (19) using density from [41]. (d) Electronic polarizability coefficient αe calculated from Equation (25). (e) Molar refraction to molar volume ratio R/Vm calculated dividing the values obtained in (a,c). (f) Excess molar refraction REx calculated from Equation (9).
Figure 9.
Comparison of the physicochemical properties of the systems: ◻, Na2SO4+H2O; ◇, K2SO4+H2O; and o, Li2SO4+H2O for different temperatures T at salt molar fraction x1 = 0.06. (a) Refractive index n estimated from Equation (15). (b) Molar refraction R calculated from Equation (21). (c) Molar volume Vm calculated from Equation (19) using density from [41]. (d) Electronic polarizability coefficient αe calculated from Equation (25). (e) Molar refraction to molar volume ratio R/Vm calculated dividing the values obtained in (a,c). (f) Excess molar refraction REx calculated from Equation (9).

Figure 10.
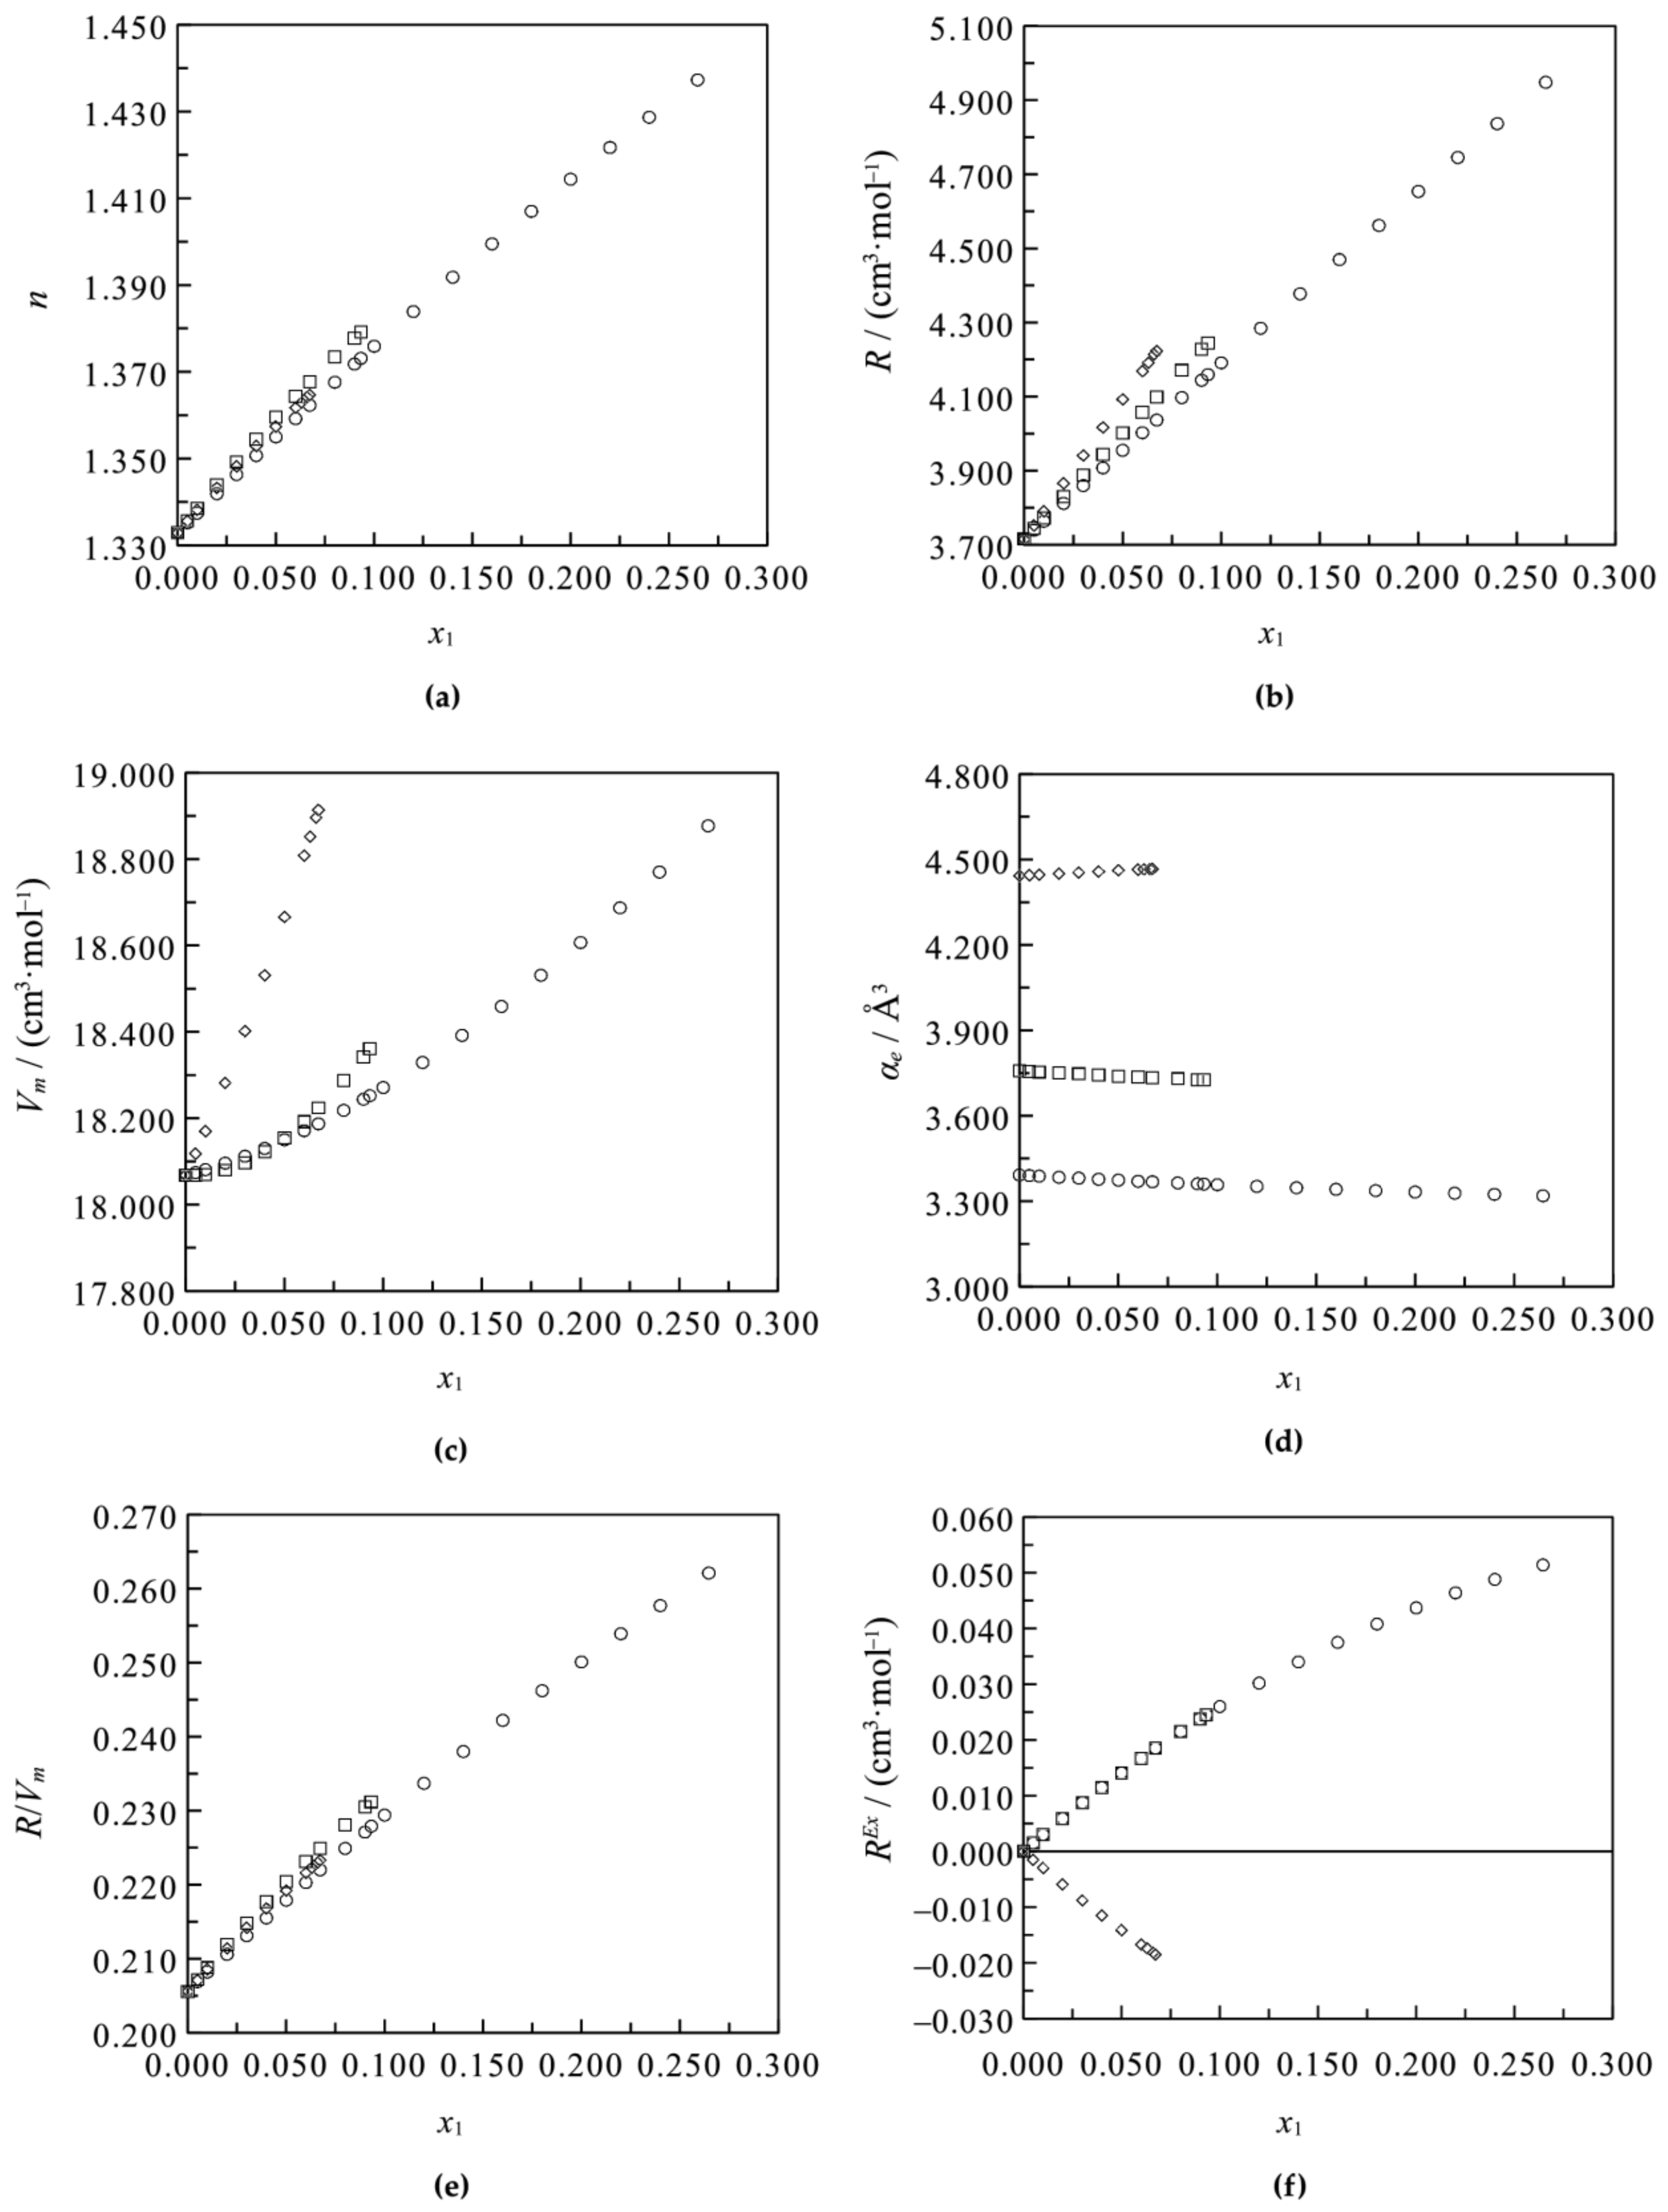
Comparison of the physicochemical properties of the systems: ◻, NaCl+H2O; ◇, KCl+H2O; and o, LiCl+H2O for different salt molar fraction x1 at 298.15 K. (a) Refractive index n estimated from Equation (15). (b) Molar refraction R calculated from Equation (21). (c) Molar volume Vm calculated from Equation (19) using density from [41]. (d) Electronic polarizability coefficient αe calculated from Equation (25). (e) Molar refraction to molar volume ratio R/Vm calculated dividing the values obtained in (a,c). (f) Excess molar refraction REx calculated from Equation (9).
Figure 10.
Comparison of the physicochemical properties of the systems: ◻, NaCl+H2O; ◇, KCl+H2O; and o, LiCl+H2O for different salt molar fraction x1 at 298.15 K. (a) Refractive index n estimated from Equation (15). (b) Molar refraction R calculated from Equation (21). (c) Molar volume Vm calculated from Equation (19) using density from [41]. (d) Electronic polarizability coefficient αe calculated from Equation (25). (e) Molar refraction to molar volume ratio R/Vm calculated dividing the values obtained in (a,c). (f) Excess molar refraction REx calculated from Equation (9).

Figure 11.
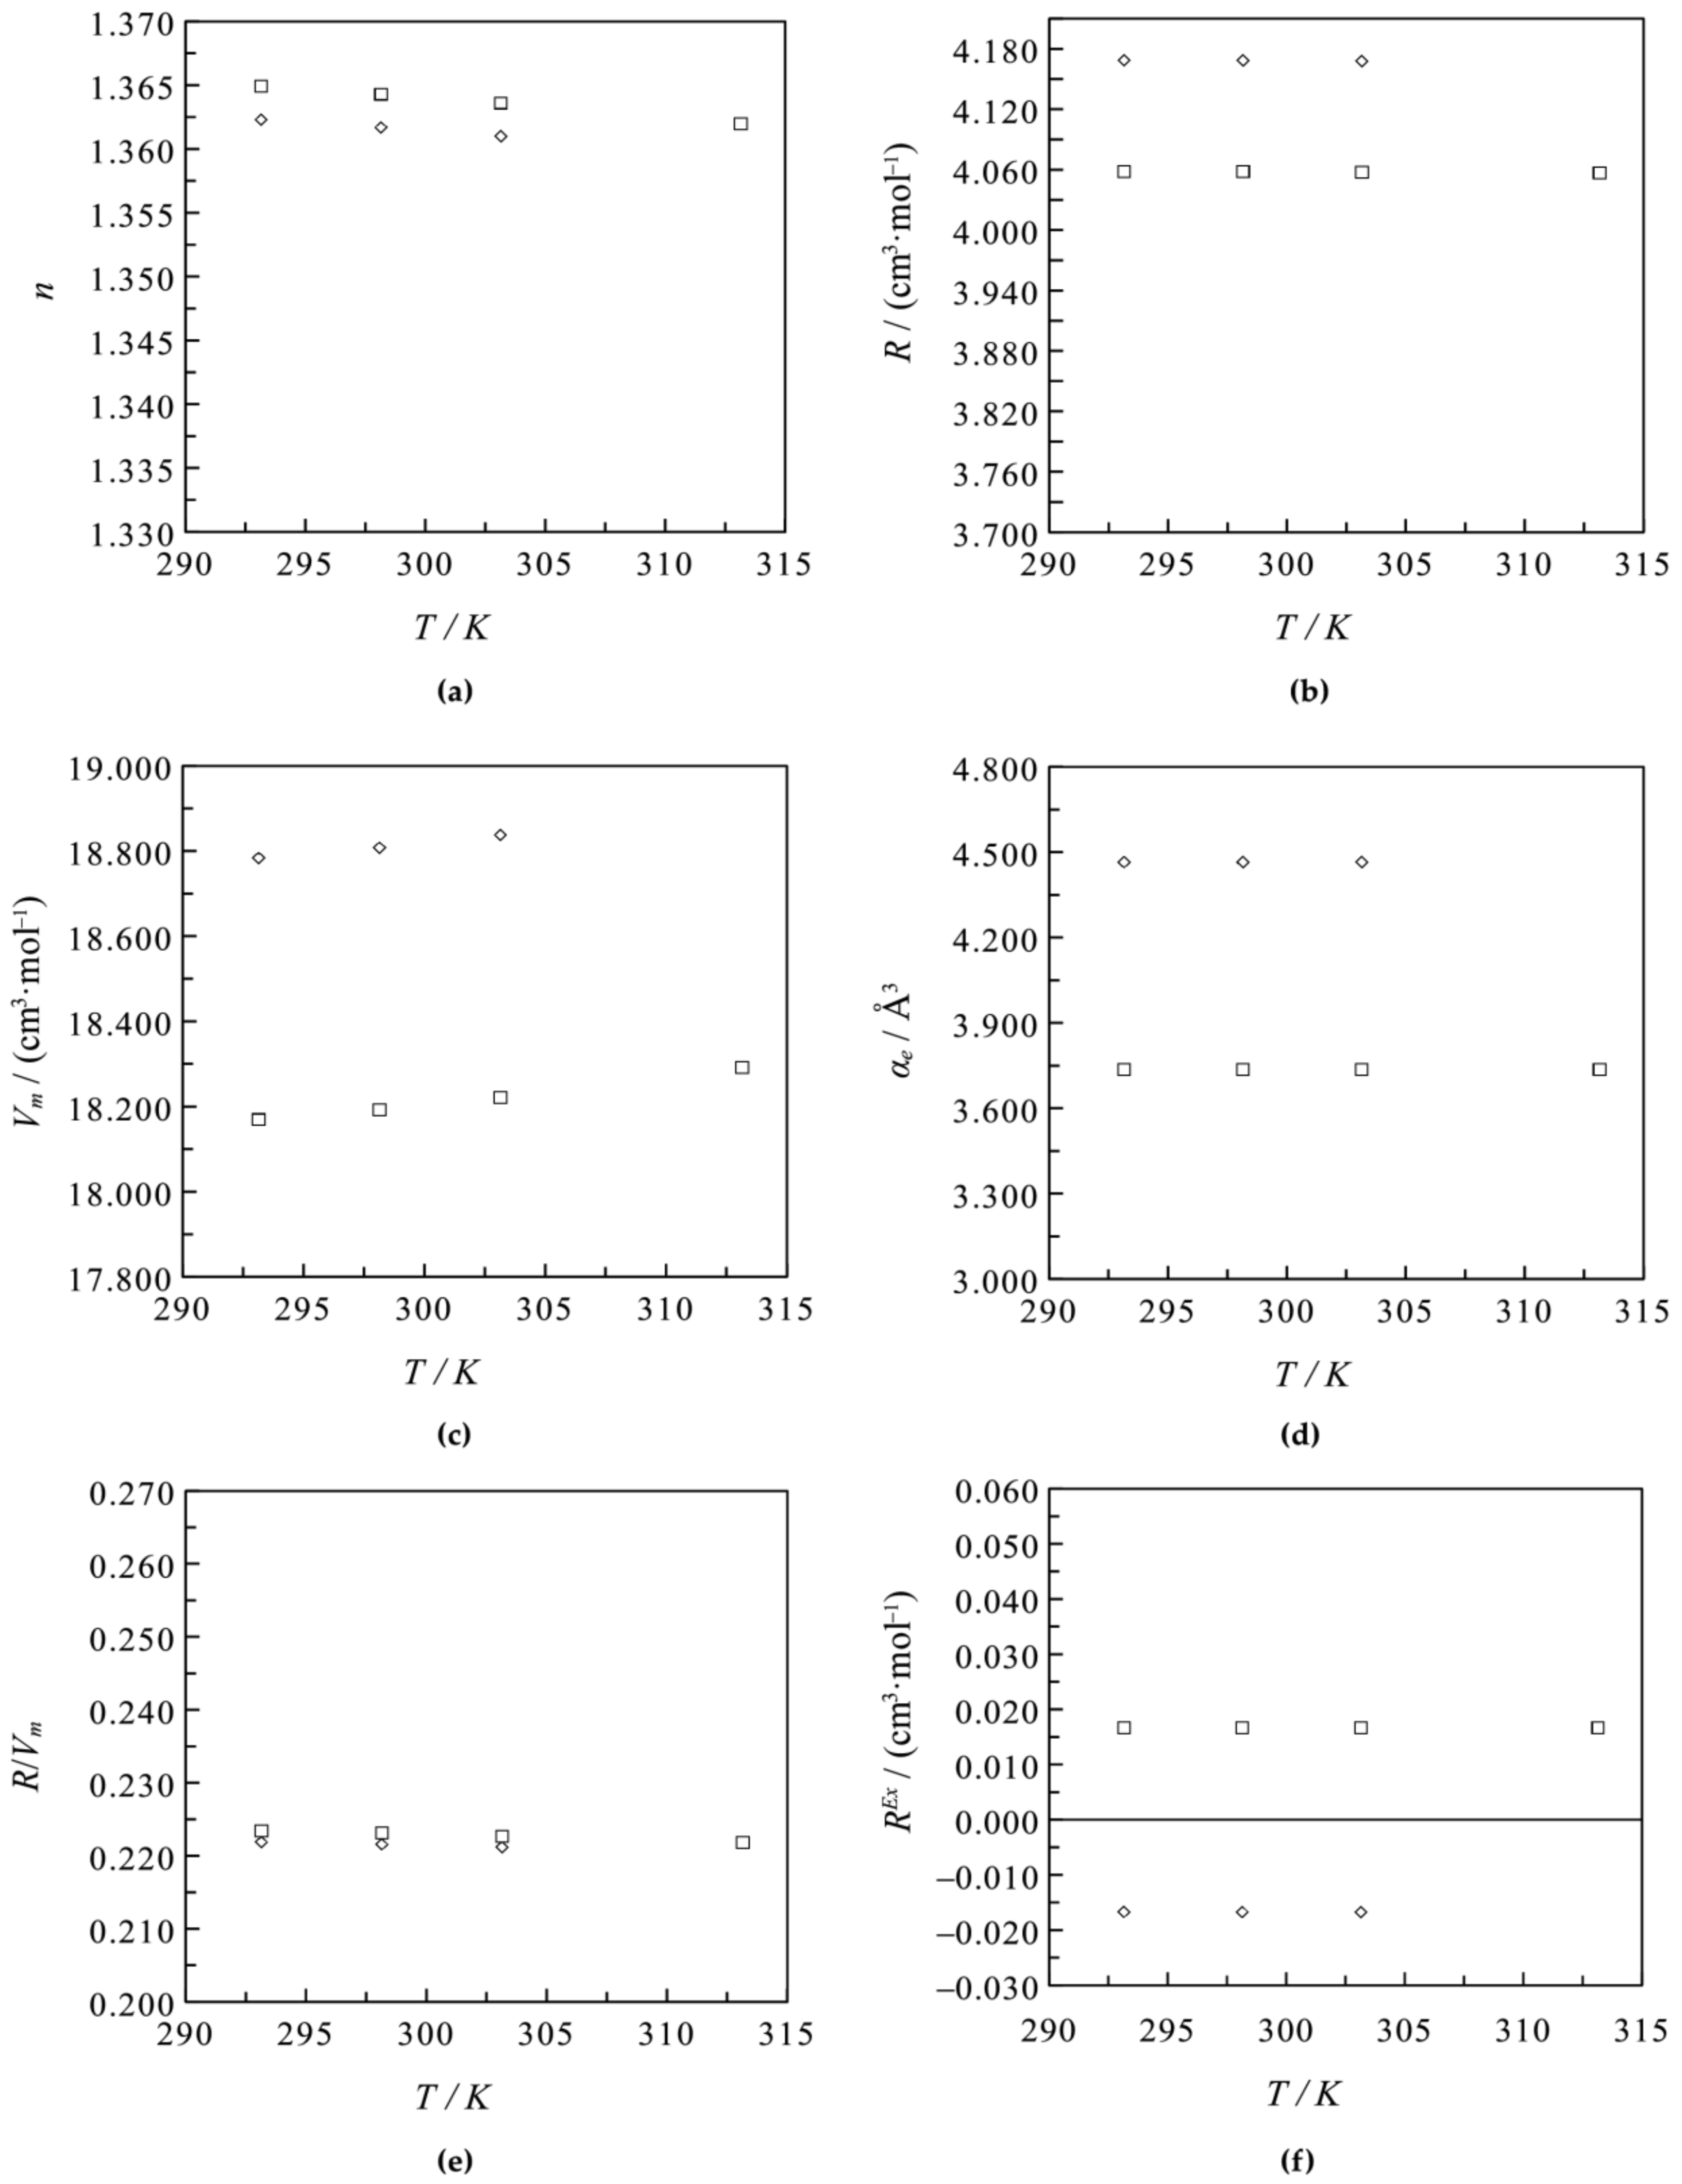
Comparison of the physicochemical properties of the systems: ◻, NaCl+H2O and ◇, KCl+H2O for different temperatures T at salt molar fraction x1 = 0.06. (a) Refractive index n estimated from Equation (15). (b) Molar refraction R calculated from Equation (21). (c) Molar volume Vm calculated from Equation (19) using density from [41]. (d) Electronic polarizability coefficient αe calculated from Equation (25). (e) Molar refraction to molar volume ratio R/Vm calculated dividing the values obtained in (a,c). (f) Excess molar refraction REx calculated from Equation (9).
Figure 11.
Comparison of the physicochemical properties of the systems: ◻, NaCl+H2O and ◇, KCl+H2O for different temperatures T at salt molar fraction x1 = 0.06. (a) Refractive index n estimated from Equation (15). (b) Molar refraction R calculated from Equation (21). (c) Molar volume Vm calculated from Equation (19) using density from [41]. (d) Electronic polarizability coefficient αe calculated from Equation (25). (e) Molar refraction to molar volume ratio R/Vm calculated dividing the values obtained in (a,c). (f) Excess molar refraction REx calculated from Equation (9).

Figure 12.
Refractive index n at different temperatures T and salt molar fraction x2 of the systems saturated in boric acid: (a) H3BO3+Na2SO4+H2O and (b) H3BO3+Li2SO4+H2O. Experimental data from [19] for (a) and from [10] for (b) at ◻, T = 293.15 K; ◇, T = 298.15 K; △, T = 303.15 K; o, T = 308.15 K; ●, T = 313.15 K; ─, calculated from Equation (15) at T = 308.15 K. Molar refraction R at different temperatures T and salt molar fraction x2 of the systems saturated in boric acid: (c) H3BO3+Na2SO4+H2O and (d) H3BO3+Li2SO4+H2O. Data calculated from Equations (1) and (2) using density and refractive index from [19] for (c) and from [10] for (d) at ◻, T = 293.15 K; ◇, T = 298.15 K; △, T = 303.15 K; o, T = 308.15 K; ●, T = 313.15 K; ─, calculated from Equation (13). Excess molar refraction REx of the systems saturated in boric acid: (e) H3BO3+Na2SO4+H2O and (f) H3BO3+Li2SO4+H2O calculated from Equation (23) at ─, T = 293.15 K; ─, T = 298.15 K; ─, T = 303.15 K; ─, T = 308.15 K; ─, T = 313.15 K.

Figure 13.
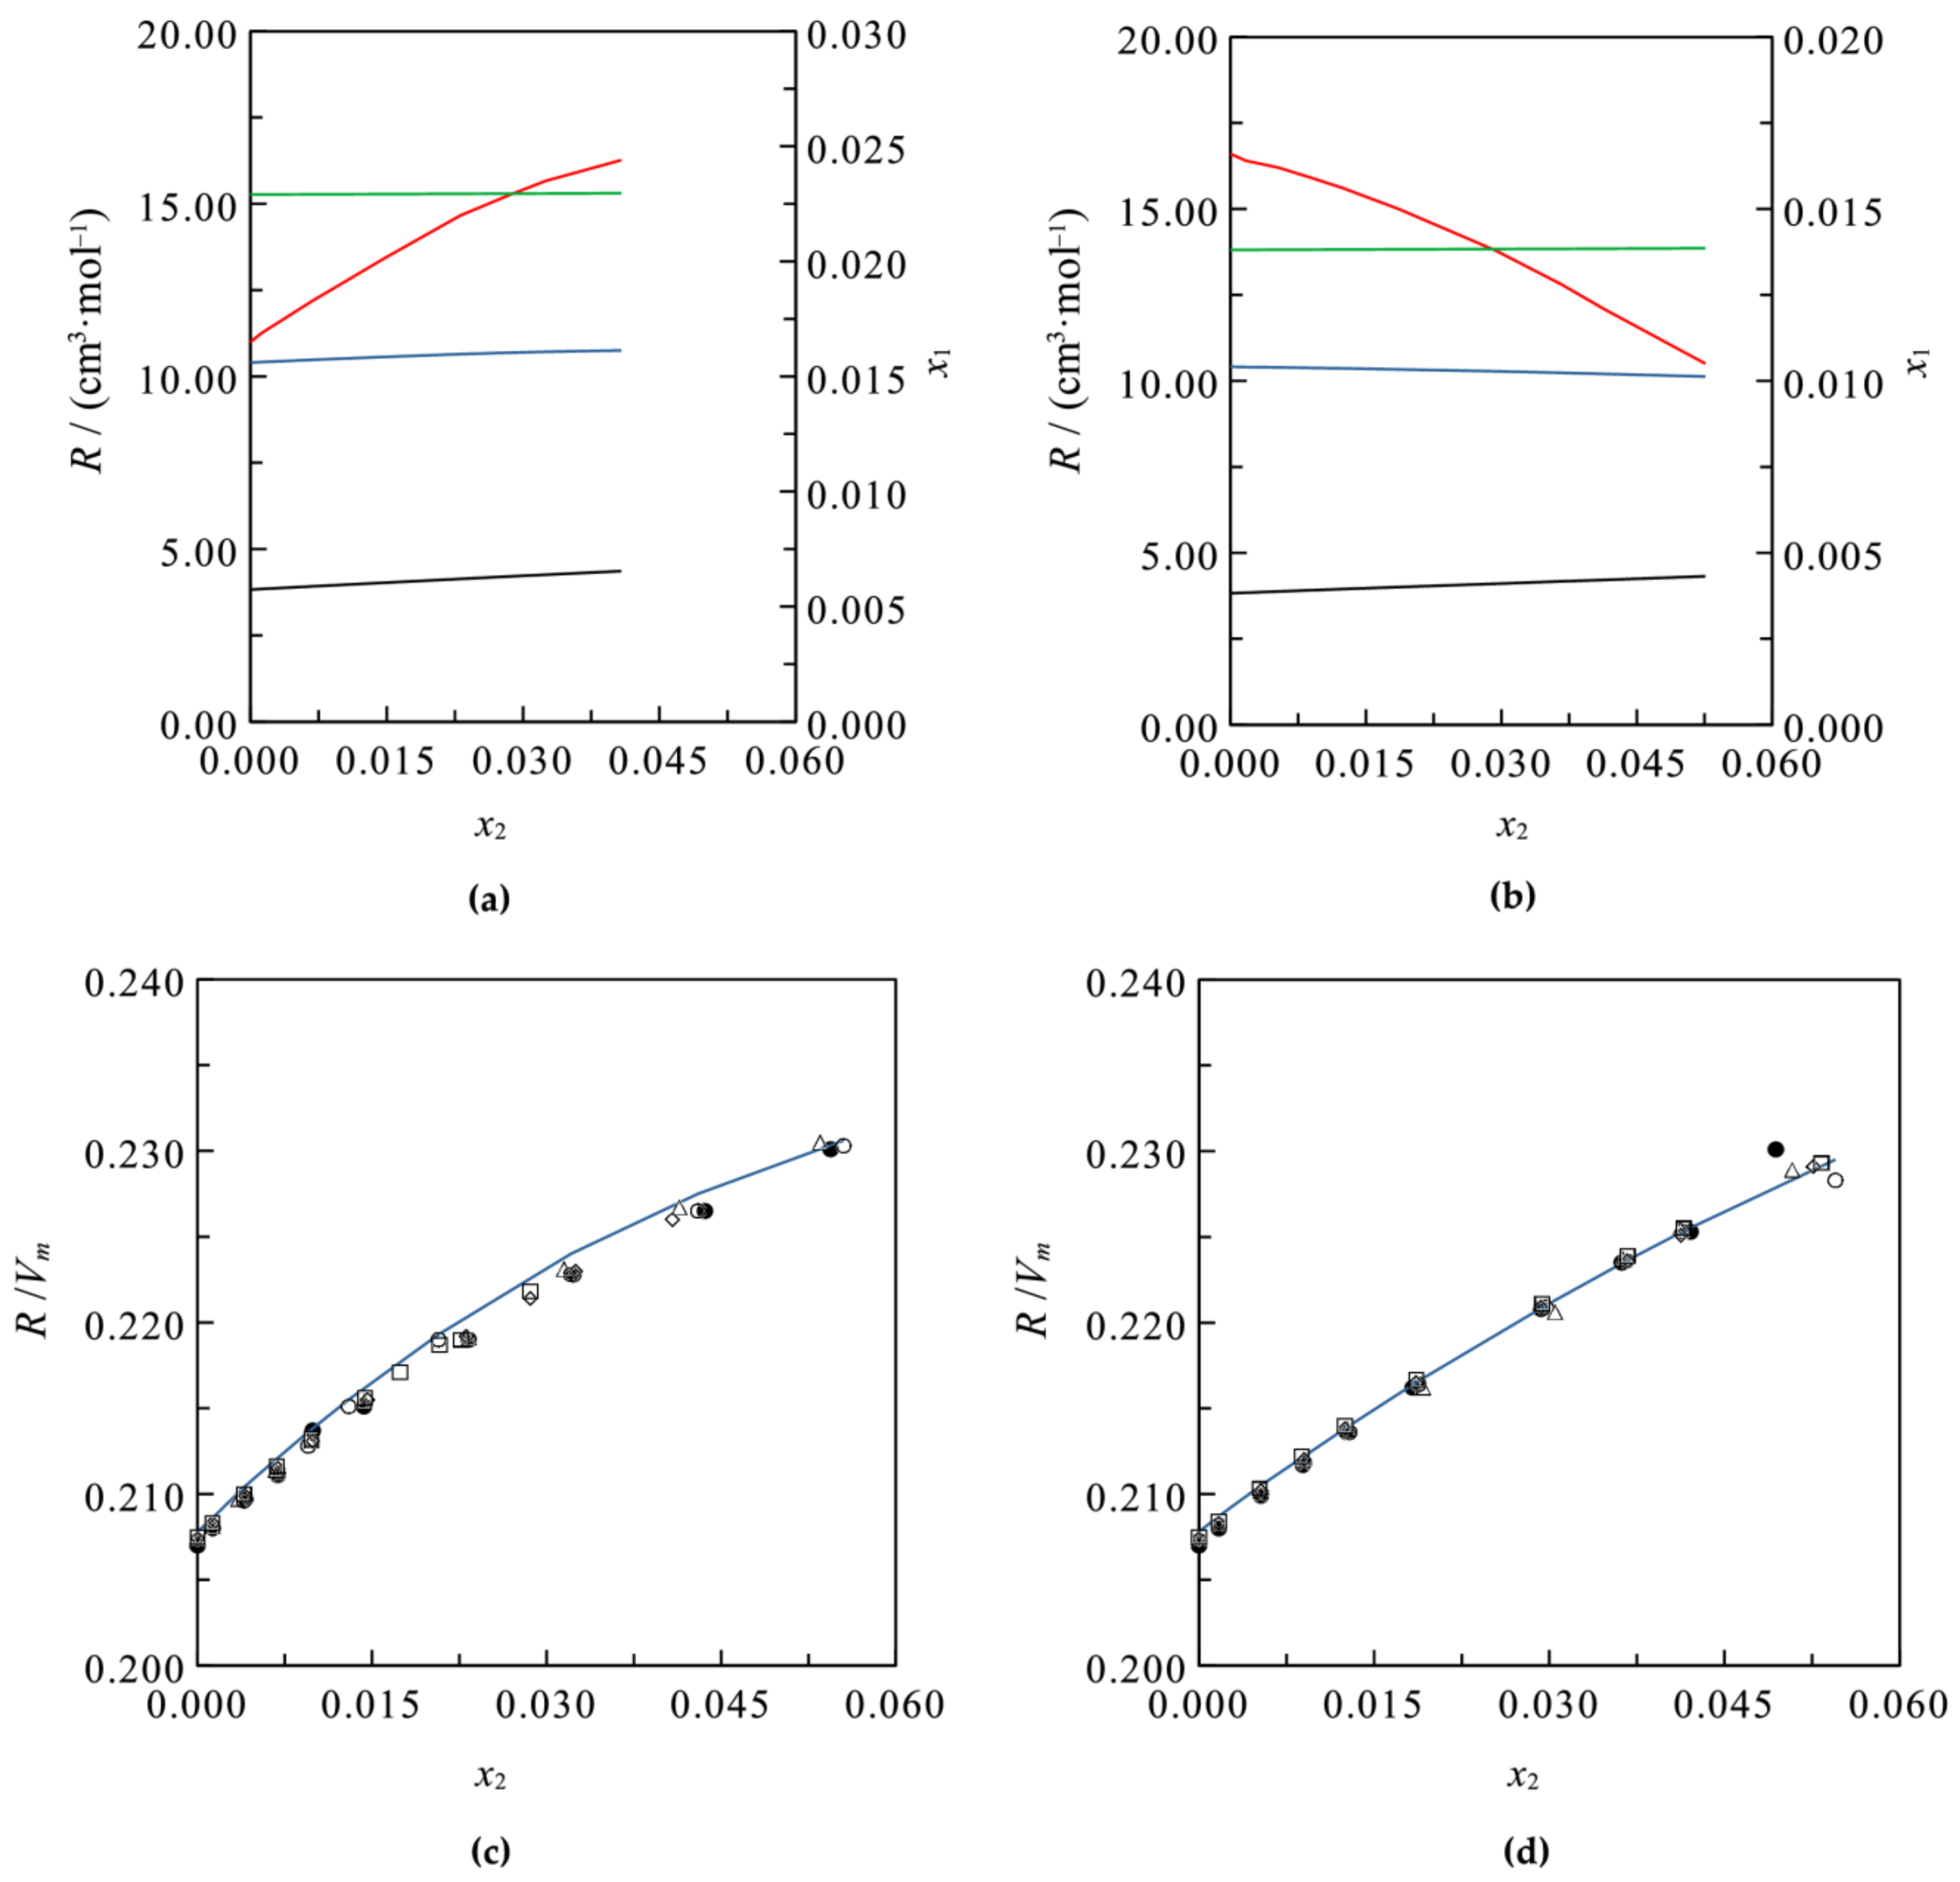
(a) Boric acid solubility x1, ─, and and molar refraction R of: ─, H3BO3; ─, Na2SO4; ─, H3BO3+Na2SO4+H2O; in sodium sulfate aqueous solutions saturated in boric acid and (b) boric acid solubility x1, ─, and and molar refraction R of: ─, H3BO3; ─, Li2SO4; ─, H3BO3+Li2SO4+H2O; in lithium sulfate aqueous solutions saturated in boric acid; at T = 298.15 K and different molar fractions of salt sulfate x2. R was calculated from Equation (12) for H3BO3, Na2SO4 and Li2SO4; and from Equation (13) for H3BO3+Na2SO4+H2O and H3BO3+Li2SO4+H2O. x1 was calculated from [58]. Ratio R/Vm of the systems saturated in boric acid: (c) H3BO3+Na2SO4+H2O and (d) H3BO3+Li2SO4+H2O. Data calculated from Equations (1) and (2) using density and refractive index from [19] for (c) and from [10] for (d) at ◻, T = 293.15 K; ◇, T = 298.15 K; △, T = 303.15 K; o, T = 308.15 K; ●, T = 313.15 K; ─, calculated dividing Equation (13) by Equation (2) at T = 308.15 K.
Figure 13.
(a) Boric acid solubility x1, ─, and and molar refraction R of: ─, H3BO3; ─, Na2SO4; ─, H3BO3+Na2SO4+H2O; in sodium sulfate aqueous solutions saturated in boric acid and (b) boric acid solubility x1, ─, and and molar refraction R of: ─, H3BO3; ─, Li2SO4; ─, H3BO3+Li2SO4+H2O; in lithium sulfate aqueous solutions saturated in boric acid; at T = 298.15 K and different molar fractions of salt sulfate x2. R was calculated from Equation (12) for H3BO3, Na2SO4 and Li2SO4; and from Equation (13) for H3BO3+Na2SO4+H2O and H3BO3+Li2SO4+H2O. x1 was calculated from [58]. Ratio R/Vm of the systems saturated in boric acid: (c) H3BO3+Na2SO4+H2O and (d) H3BO3+Li2SO4+H2O. Data calculated from Equations (1) and (2) using density and refractive index from [19] for (c) and from [10] for (d) at ◻, T = 293.15 K; ◇, T = 298.15 K; △, T = 303.15 K; o, T = 308.15 K; ●, T = 313.15 K; ─, calculated dividing Equation (13) by Equation (2) at T = 308.15 K.

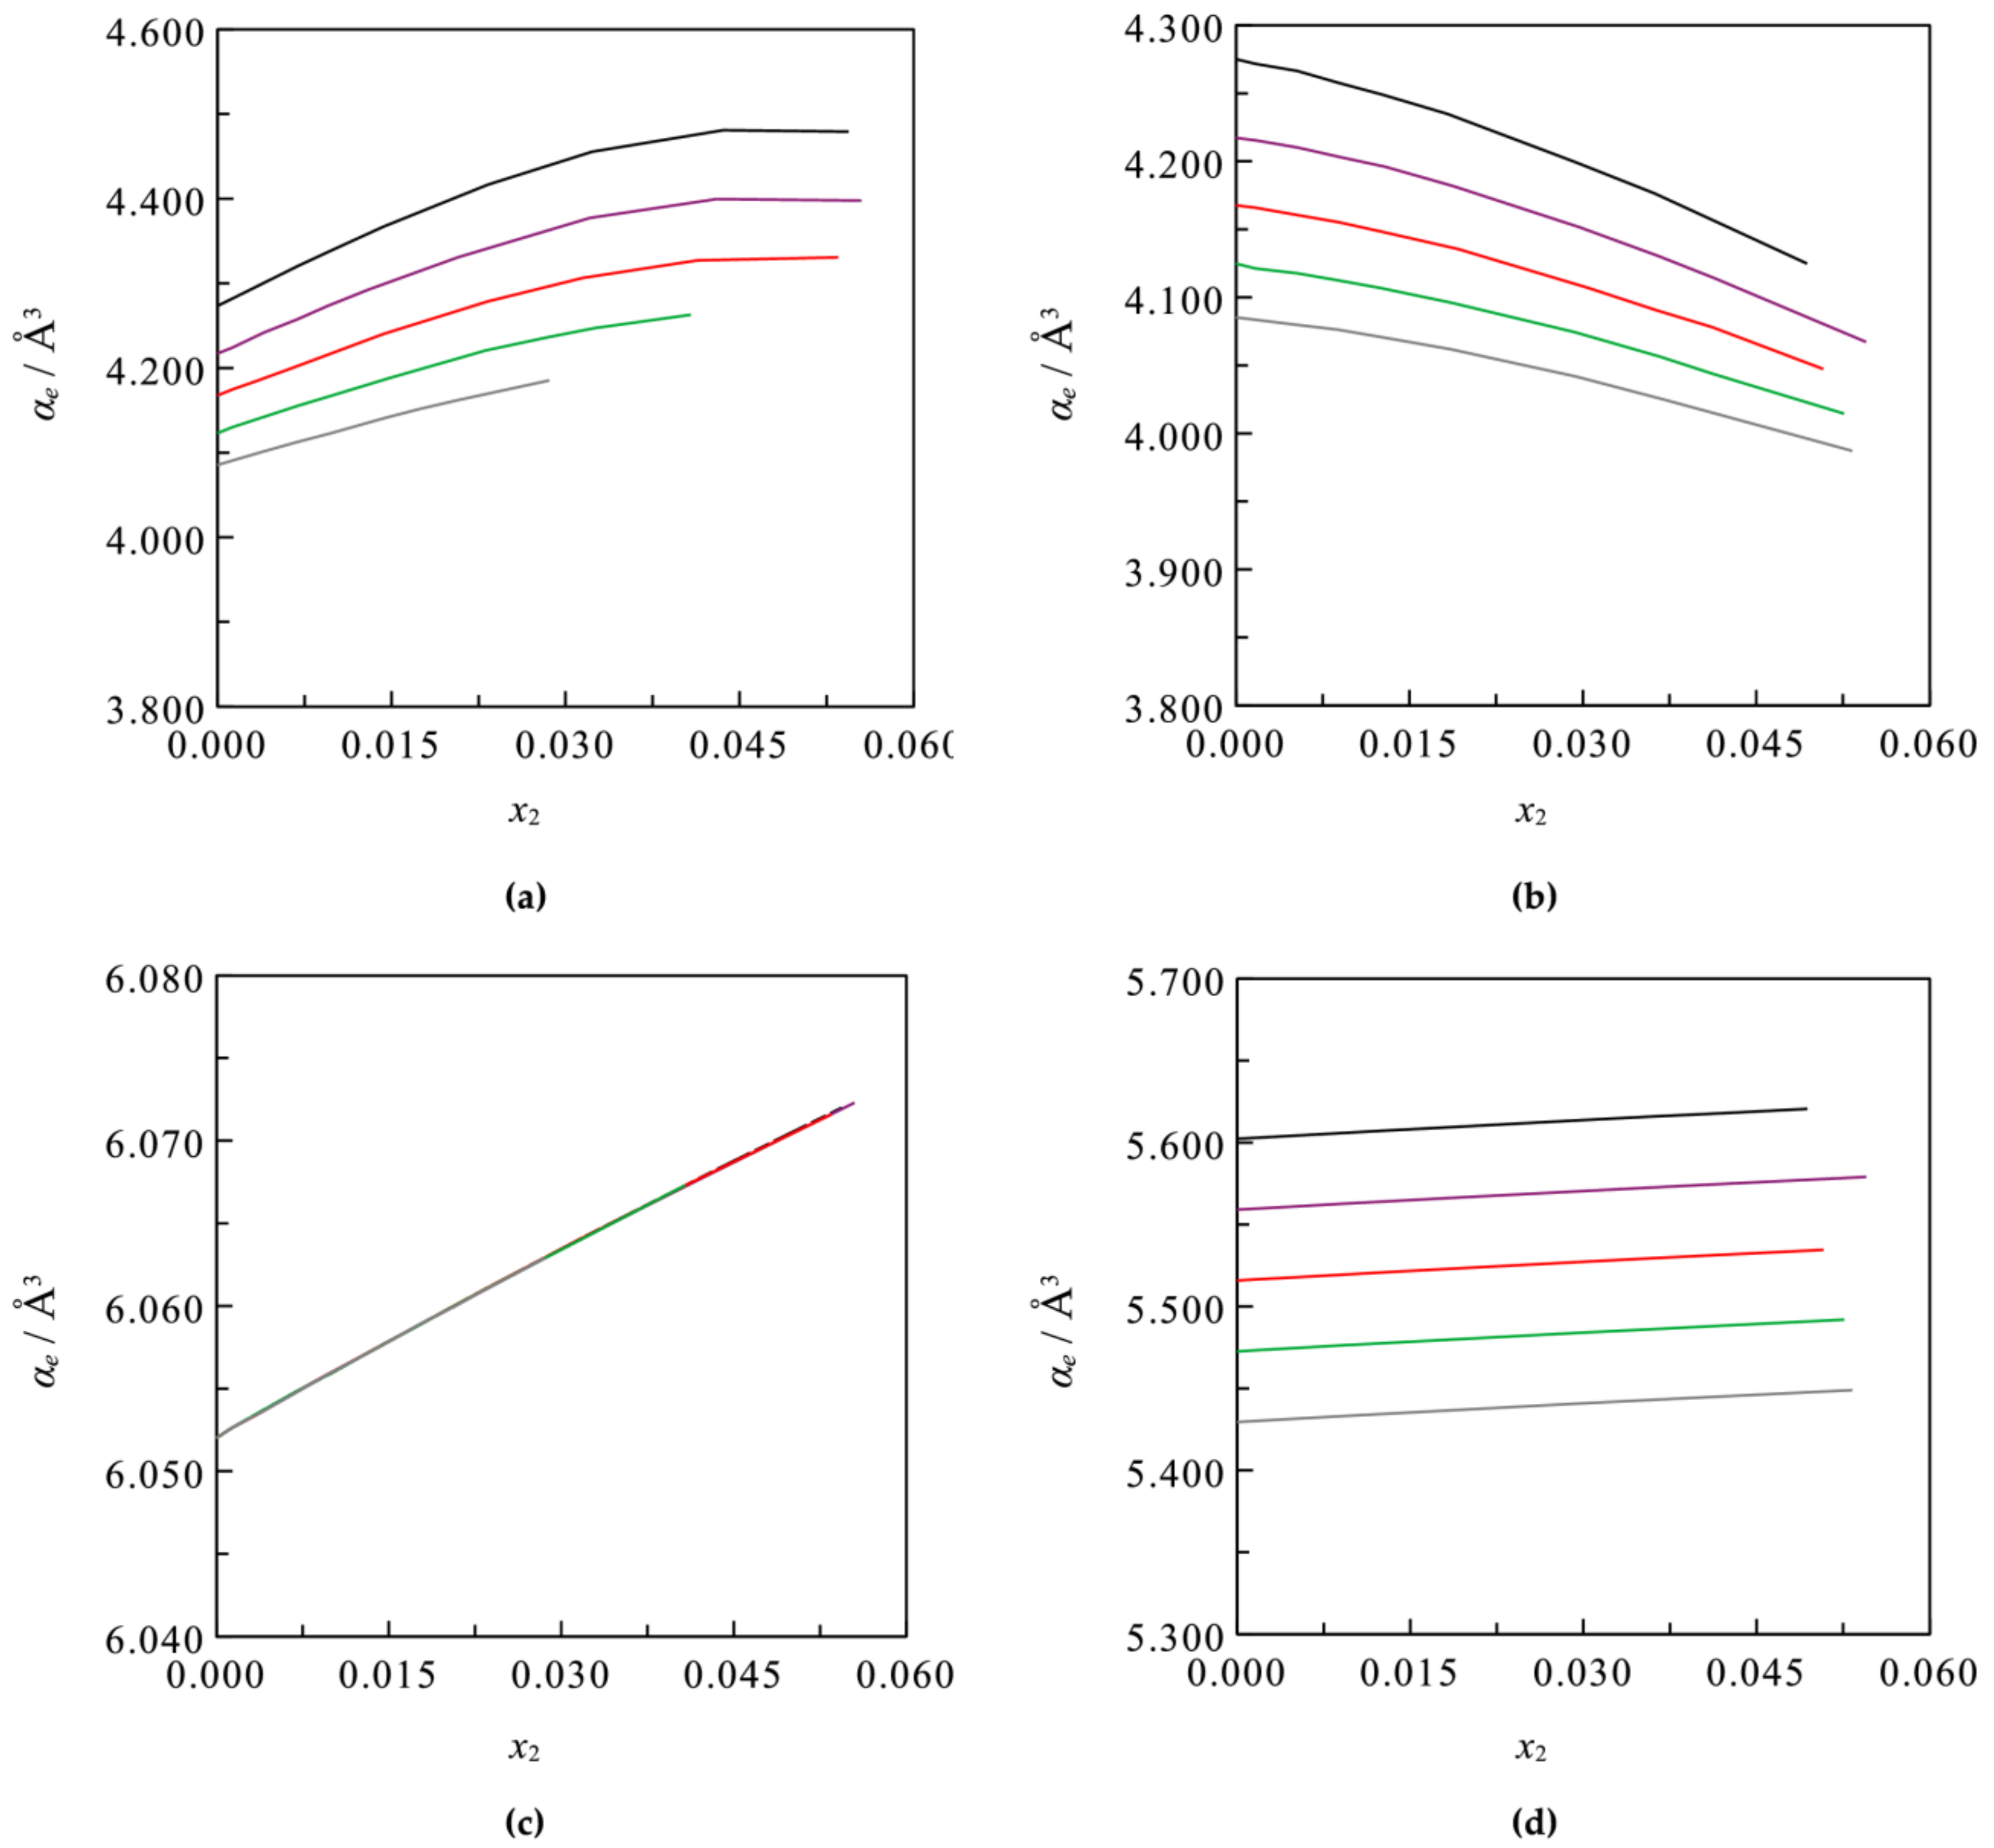
Figure 14.
Electric polarization coefficient αe of boric acid (a,b) sodium sulfate in sodium sulfate aqueous solutions saturated in boric acid and (c) boric acid and (d) lithium sulfate in lithium sulfate aqueous solutions saturated in boric acid, calculated from Equation (25), at different salt molar fraction x2 and temperatures: ─, T = 293.15 K; ─, T = 298.15 K; ─, T = 303.15 K; ─, T = 308.15 K; ─, T = 313.15 K.

Figure 15.
(a) Refractive index n of the system H3BO3+KCl+H2O. Experimental data from [6] at ◻, T = 293.15 K; ◇, T = 298.15 K; △, T = 303.15 K; ─, calculated from Equation (15). (b) Molar refraction R of the system H3BO3+KCl+H2O at different temperatures T and potassium chloride molar fraction x2. Data calculated from Equations (1) and (2) using density and refractive index from [6] at ◻, T = 293.15 K; ◇, T = 298.15 K; △, T = 303.15 K; ─, calculated from Equation (13) at T = 303.15 K. (c) Excess molar refraction REx of the system H3BO3+KCl+H2O calculated from Equation (23) at T = 303.15 K. The color of the markers and lines indicate the total solutes molar fractions xT at which the properties are given or calculated: black, xT = 0.0045 ± 0.0001, green color xT = 0.0090 ± 0.0001, red color xT = 0.0136. The markers filled in black color and long dotted lines are for xT = 0.0182 ± 0.0001.

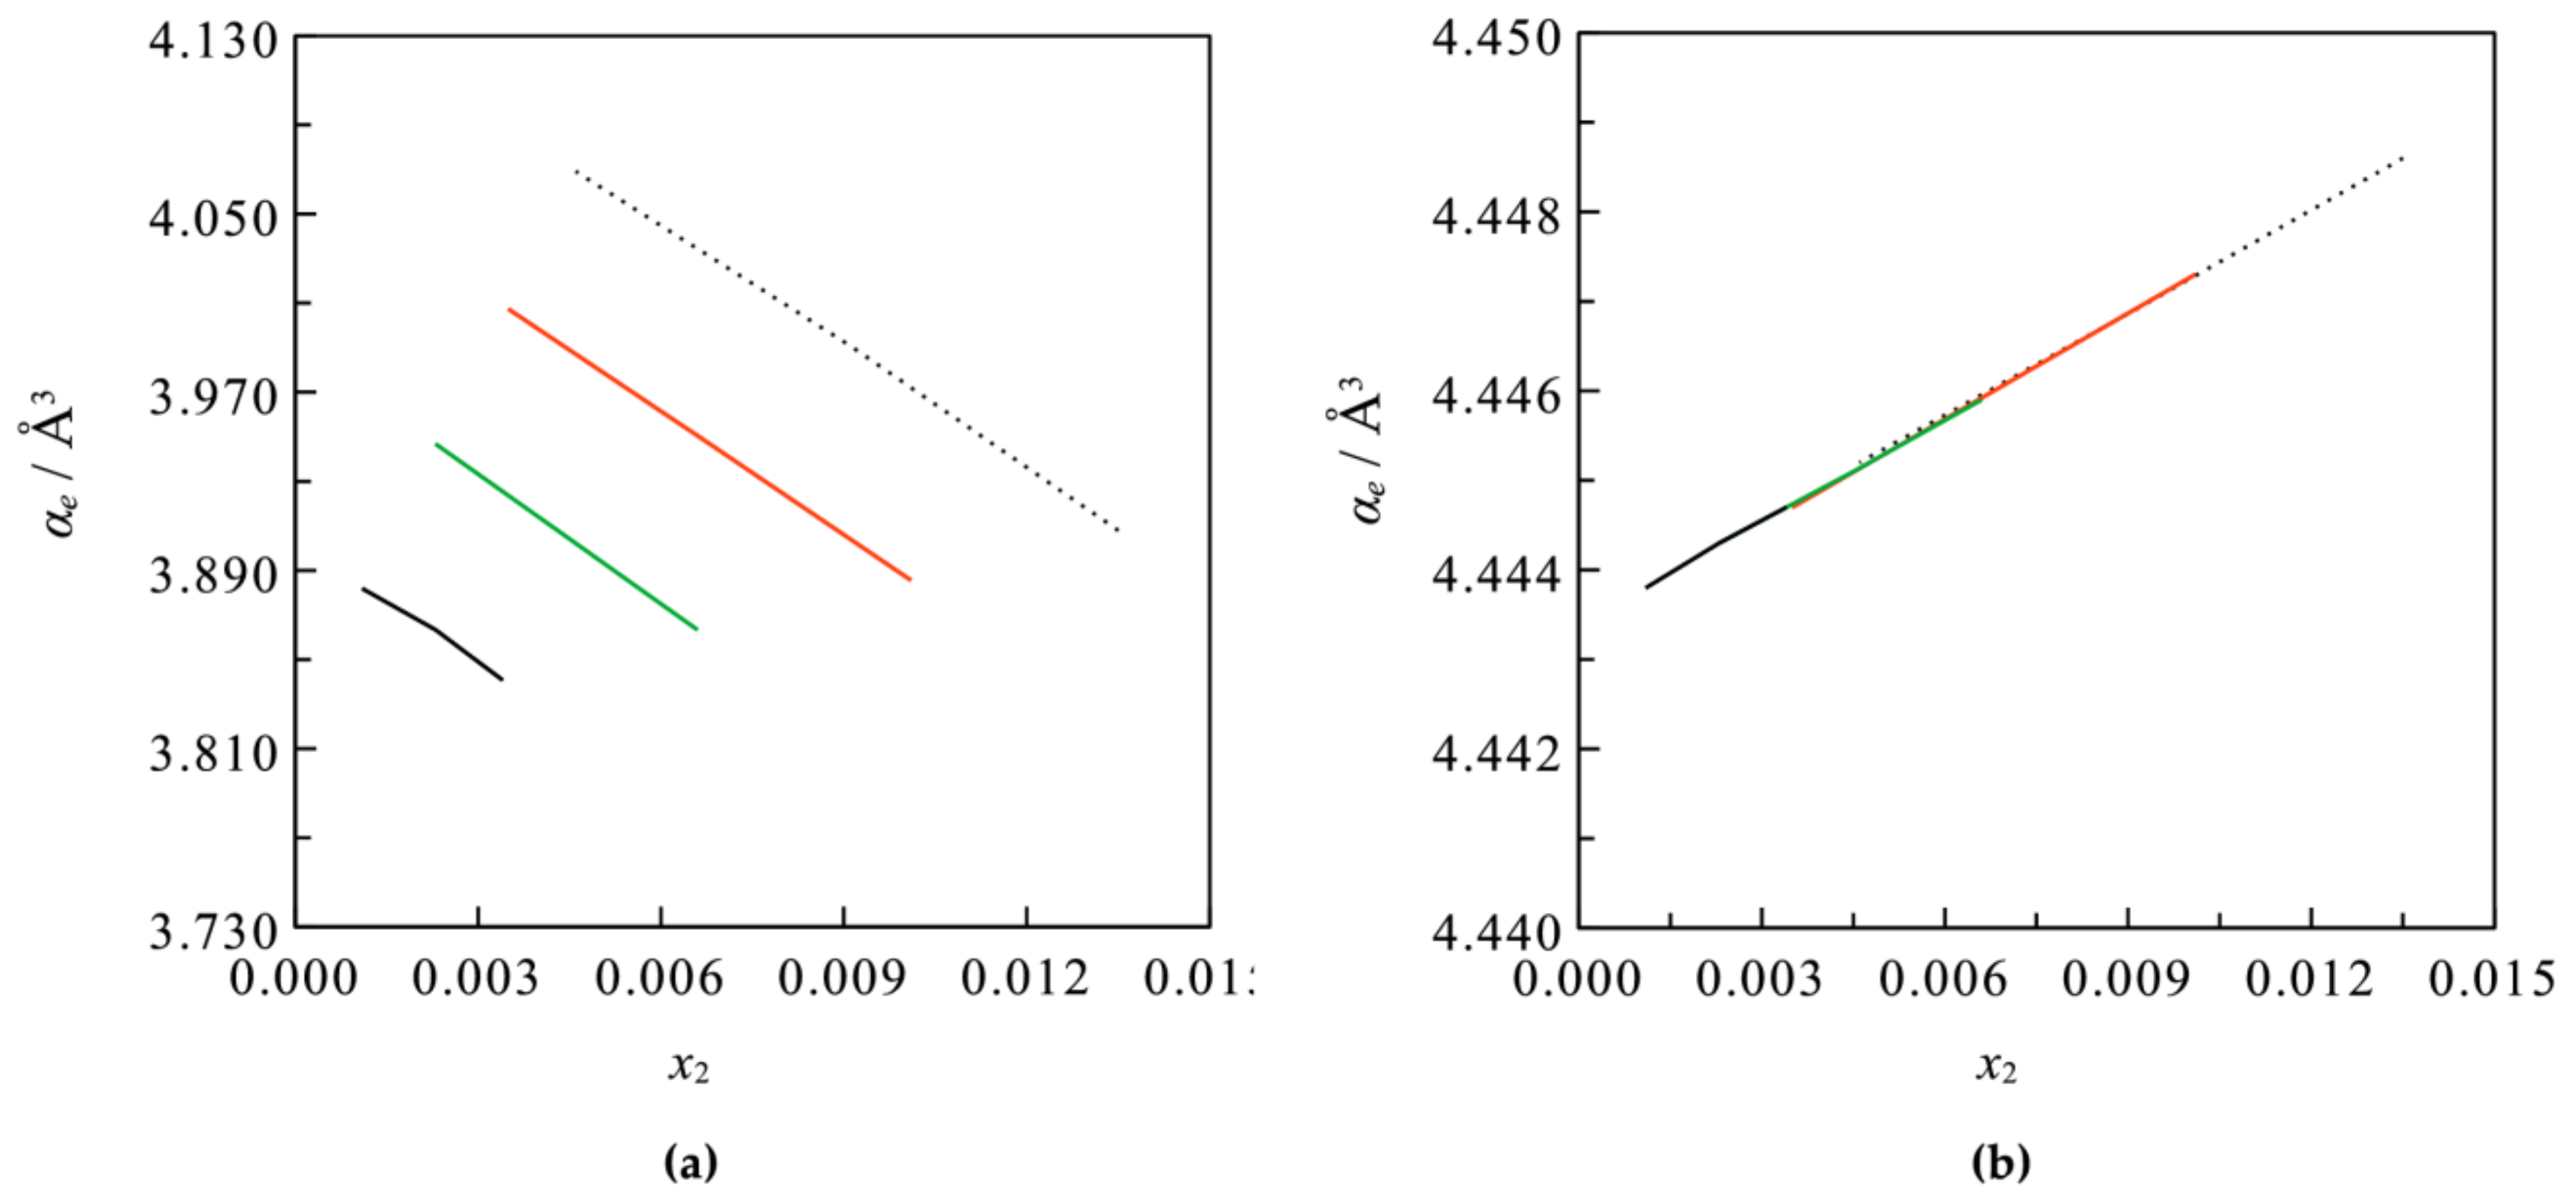
Figure 16.
Electric polarization coefficient αe of (a) boric acid and (b) potassium chloride, in potassium chloride and boric acid aqueous solutions, ─, calculated from Equation (25) at different potassium chloride molar fraction x2 at T = 303.15 K. The color of the lines indicate the total solutes molar fractions xT at which the properties are calculated: black, xT = 0.0045 ± 0.0001, green color xT = 0.0090 ± 0.0001, red color xT = 0.0136. The long dotted lines are for xT = 0.0182 ± 0.0001.

Figure 17.
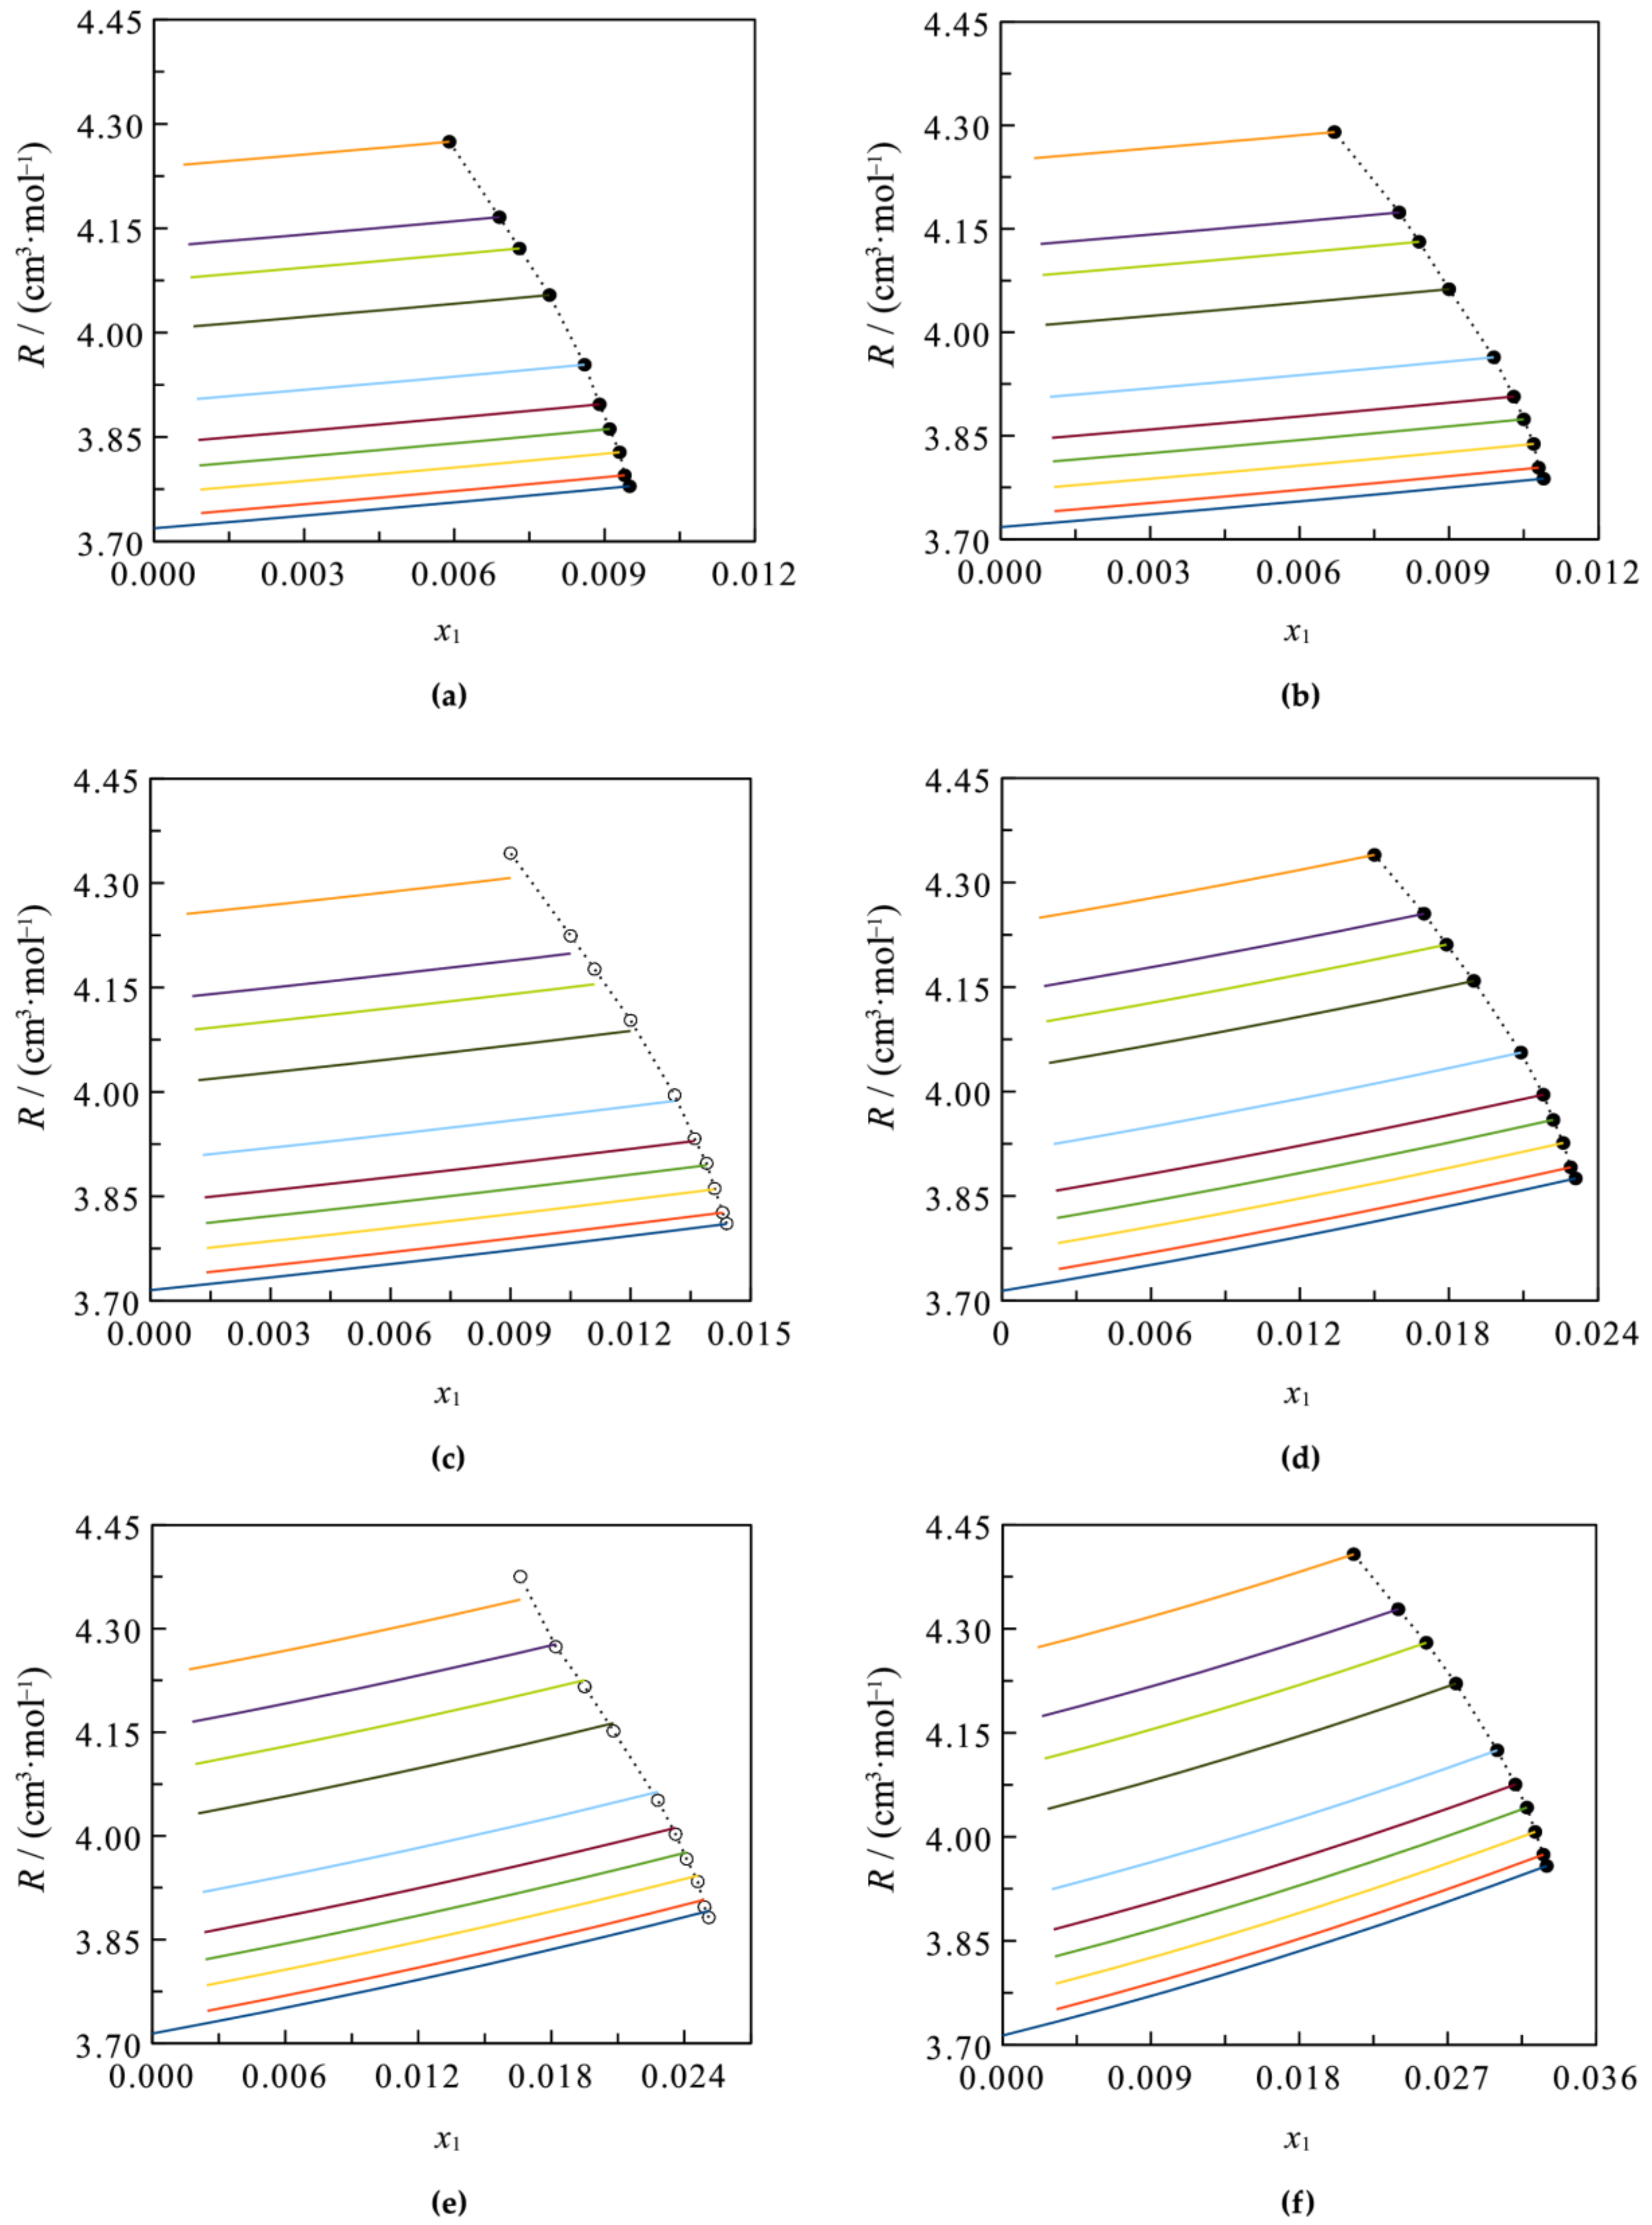
Refractive index n of the system H3BO3+Li2SO4+H2O calculated from Equation (15) at (a) T = 278.15 K, (b) T = 283.15 K, (c) T = 293.15 K, (d) T = 310.15 K, (e) T = 313.15 K, and (f) T = 323.15K; different boric acid molar fraction x1 and lithium sulfate molar fraction x2: ─, 0; ─, 0.0017; ─, 0.0052; ─, 0.0088; ─, 0.0125; ─, 0.0186; ─, 0.0294; ─, 0.0367; ─, 0.0415; ─, 0.0533; ⸳⸳●⸳⸳, at saturation in boric acid. ⸳⸳o⸳⸳, experimental data from refractive index from [10] and with values of solubility of boric acid in lithium sulfate aqueous solutions estimated from [58].
Figure 17.
Refractive index n of the system H3BO3+Li2SO4+H2O calculated from Equation (15) at (a) T = 278.15 K, (b) T = 283.15 K, (c) T = 293.15 K, (d) T = 310.15 K, (e) T = 313.15 K, and (f) T = 323.15K; different boric acid molar fraction x1 and lithium sulfate molar fraction x2: ─, 0; ─, 0.0017; ─, 0.0052; ─, 0.0088; ─, 0.0125; ─, 0.0186; ─, 0.0294; ─, 0.0367; ─, 0.0415; ─, 0.0533; ⸳⸳●⸳⸳, at saturation in boric acid. ⸳⸳o⸳⸳, experimental data from refractive index from [10] and with values of solubility of boric acid in lithium sulfate aqueous solutions estimated from [58].

Figure 18.
Molar refraction R of the system H3BO3+Li2SO4+H2O calculated from Equation (13) at (a) T = 278.15 K, (b) T = 283.15 K, (c) T = 293.15 K, (d) T = 310.15 K, (e) T = 313.15 K, and (f) T = 323.15 K. Different boric acid molar fraction x1 and lithium sulfate molar fraction x2: ─, 0; ─, 0.0017; ─, 0.0052; ─, 0.0088; ─, 0.0125; ─, 0.0186; ─, 0.0294; ─, 0.0367; ─, 0.0415; ─, 0.0533; ⸳⸳●⸳⸳, at saturation in boric acid. ⸳⸳o⸳⸳, data calculated from Equation (13) with values of solubility of boric acid in lithium sulfate aqueous solutions estimated from [58] and refractive index and density from [10].


Table 1.
Binary and ternary systems studied.
| System | Temperature Range (K) | Refractive Index | Density | ||
|---|---|---|---|---|---|
| Maximum Concentration (Mol·kg−1) | Reference | Maximum Concentration (Mol·kg−1) | Reference | ||
| H3BO3+H2O | 293.15, 298.15, 303.15 | 1.0000 | [6] | 1.0000 | [6] |
| Na2SO4+H2O | 288.15, 298.15, 308.15, 318.15 | 3.42297 | [33] | 2.2250 (273.15–372.15) K | [41] |
| Li2SO4+H2O | 278.15, 298.15, 308.15, 318.15 | 2.2740 | [34] | 2.2740 | [34] |
| K2SO4+H2O | 288.15, 298.15, 308.15, 318.15 | 0.90485 | [33] | 0.71 | [41] |
| NaCl+H2O | 293.15, 298.15, 303.15, 308.15, 313.18, 318.15 | 6.0190 | [30] | 6.0111 (273.15–368.15) K | [41] |
| LiCl+H2O | 298.15, 308.15, 318.15 | 3.5557 Saturation | [31] [32] | 3.315 | [31] [32] |
| KCl+H2O | 293.15, 298.15, 303.15 | 4.0000 | [6] | 4.0000 | [6] |
| H3BO3+Na2SO4+H2O | 293.15, 298.15, 303.15, 308.15, 313.15 | 3.3242 | [19] | 3.3242 | [19] |
| H3BO3+Li2SO4 +H2O | 293.15, 298.15, 303.15, 308.15, 313.15 | 3.14720 | [10] | 3.14720 | [10] |
| H3BO3+KCl+H2O | 293.15, 298.15, 303.15 | 1.0269 a | [6] | 1.0269 a | [6] |
a Total molality = molality of boric acid + molality of potassium chloride.
Table 2.
Parameters of the model of the refractive index of the systems H3BO3+H2O, MX+H2O, and M2X+H2O. M = K+, Na+, or Li+ and X = Cl− or SO42−.
Table 2.
Parameters of the model of the refractive index of the systems H3BO3+H2O, MX+H2O, and M2X+H2O. M = K+, Na+, or Li+ and X = Cl− or SO42−.
| System | bj/ (cm3·mol−1) | R∞,0ja/ (cm3·Mol−1) | R∞,1j/ (cm3·Mol−1·K−1) | R∞j/ (cm3·Mol−1) | SE/ (cm3·Mol−1) | r2 |
|---|---|---|---|---|---|---|
| H3BO3+H2O | −47.4674 ± 10.7813 a | 9.6379 ± 0.1494 | 0 | 0.0002 | 0.9866 | |
| Na2SO4+H2O | −1.0000 | 15.2688 ± 0.0298 | 0 | 15.34 ± 0.09 c [36] 15.13 ± 0.04 d [45] | 0.00064 | 0.9981 |
| Li2SO4+H2O | −1.0000 | 13.8070 ± 0.1329 | 0.0218 ± 0.0089 b | 12.81 e | 0.00136 | 0.9825 |
| K2SO4+H2O | −1.0000 | 18.6035 ± 0.0851 | 0 | 19.55 ± 0.21 c [36] | 0.00046 | 0.9894 |
| NaCl+H2O | 1.0000 | 9.4808 ± 0.0221 | 0 | 9.20 ± 0.18 c [36] 9.26 [46] | 0.0007 | 0.9977 |
| LiCl+H2O | 1.0000 | 8.5582 ± 0.0098 | 0 | 8.74 [46] | 0.0005 | 0.9999 |
| KCl+H2O | −1.0000 | 11.2102 ± 0.0280 | 0 | 11.25 ± 0.06 [36] | 0.0005 | 0.9985 |
a Statistically significant with a confidence level of 0.99; b statistically significant with a confidence level 0.95.; c average molar refraction at infinite dilution; d molar refraction at infinite dilution at 298.15 K; e estimated from the molar refraction values at infinite dilution of Li+ from [20] and SO42− from [36].
Table 3.
Solute electronic polarizability coefficient in aqueous solutions at 298 K.
| Compound | αe (Å3) a | αe (Å3) b | αe (Å3) c | αe (Å3) d |
|---|---|---|---|---|
| H3BO3 | 3.820 | |||
| Na2SO4 | 5.988 | 4.907 ± 0.083 | 3.978 | 5.921 |
| Li2SO4 | 5.473 | 4.528 ± 0.052 | 3.734 | 5.544 |
| K2SO4 | 7.374 | 6.224 ± 0.128 | ||
| NaCl | 3.758 | 3.532 ± 0.034 | 2.391 | 3.65 |
| LiCl | 3.392 | 3.271 ± 0.033 | 2.262 | 3.462 |
| KCl | 4.443 | 4.126 ± 0.024 | 2.931 | 4.465 |
Table 4.
Ions’ polarizability coefficient αe in aqueous solutions at 298.15 K. HSAB, hard and soft bases concept.
Table 4.
Ions’ polarizability coefficient αe in aqueous solutions at 298.15 K. HSAB, hard and soft bases concept.
| Ion | rbare (Å) a | αe (Å3) | αe (Å3) b | αe (Å3) cryst c | η d | HSAB Classification e |
|---|---|---|---|---|---|---|
| Li+ | 0.94 | 0.03 | 0.03 | 0.03 | 35.12 | Hard acid |
| Na+ | 1.17 | 0.4 | 0.279 ± 0.001 | 0.41 | 21.08 | Hard acid |
| K+ | 1.49 | 1.08 | 0.873 ± 0.009 | 1.33 | 13.64 | Hard acid |
| Cl− | 1.64 | 3.36 | 3.253 ± 0.033 | 2.96 | 4.70 | Hard base |
| SO42− f | 5.28 | 4.432 ± 0.110 | Hard base |
Publisher’s Note: MDPI stays neutral with regard to jurisdictional claims in published maps and institutional affiliations. |
© 2021 by the authors. Licensee MDPI, Basel, Switzerland. This article is an open access article distributed under the terms and conditions of the Creative Commons Attribution (CC BY) license (http://creativecommons.org/licenses/by/4.0/).
Share and Cite
MDPI and ACS Style
Alavia, W.; Soto, I.; Lovera, J.A. Modeling of the Refractive Index for the Systems MX+H2O, M2X+H2O, H3BO3+MX+H2O, and H3BO3+M2X+H2O. M = K+, Na+, or Li+ and X = Cl− or SO42−. Processes 2021, 9, 525. https://doi.org/10.3390/pr9030525
AMA Style
Alavia W, Soto I, Lovera JA. Modeling of the Refractive Index for the Systems MX+H2O, M2X+H2O, H3BO3+MX+H2O, and H3BO3+M2X+H2O. M = K+, Na+, or Li+ and X = Cl− or SO42−. Processes. 2021; 9(3):525. https://doi.org/10.3390/pr9030525
Chicago/Turabian StyleAlavia, Wilson, Ismael Soto, and Jorge A. Lovera. 2021. "Modeling of the Refractive Index for the Systems MX+H2O, M2X+H2O, H3BO3+MX+H2O, and H3BO3+M2X+H2O. M = K+, Na+, or Li+ and X = Cl− or SO42−" Processes 9, no. 3: 525. https://doi.org/10.3390/pr9030525
Note that from the first issue of 2016, this journal uses article numbers instead of page numbers. See further details here.