Article

Non-Immersion Ultrasonic Cleaning: An Efficient Green Process for Large Surfaces with Low Water Consumption

by
Jon Ander Sarasua Miranda
1,*,
Leire Ruiz-Rubio
2,3,
Estibaliz Aranzabe Basterrechea
1 and
Jose Luis Vilas-Vilela
2,3
1
Fundación Tekniker, Iñaki Goenaga 5, 20600 Eibar, Spain
2
Grupo de Química Macromolecular (LQM) Dpto. Química Física, Facultad de Ciencia y Tecnología, Universidad del País Vasco (UPV/EHU), 48940 Leioa, Spain
3
BCMaterials, Basque Center for Materials, Applications and Nanostructures, UPV/EHU Science Park, 48940 Leioa, Spain
*
Author to whom correspondence should be addressed.
Processes 2021, 9(4), 585; https://doi.org/10.3390/pr9040585
Submission received: 19 February 2021 / Revised: 15 March 2021 / Accepted: 24 March 2021 / Published: 26 March 2021

Abstract

:
Ultrasonic cleaning is a developed and widespread technology used in the cleaning industry. The key to its success over other cleaning methods lies in its capacity to penetrate seemingly inaccessible, hard-to-reach corners, cleaning them successfully. However, its major drawback is the need to immerse the product into a tank, making it impossible to work with large or anchored elements. With the aim of revealing the scope of the technology, this paper will attempt to describe a more innovative approach to cleaning large area surfaces (walls, floors, façades, etc.) which involves applying ultrasonic cavitation onto a thin film of water, which is then deposited onto a dirty surface. Ultrasonic cleaning is an example of the proliferation of green technology, requiring 15 times less water and 115 times less power than conventional high-pressurized waterjet cleaning mechanisms. This paper will account for the physical phenomena that govern this new cleaning mechanism and the competition it poses towards more conventional pressurized waterjet technology. Being easy to use as a measure of success, specular surface cleaning has been selected to measure the degree of cleanliness (reflectance) as a function of the process’s parameters. A design of experiments has been developed in line with the main process parameters: amplitude, gap, and sweeping speed. Regression models have also been used to interpret the results for different degrees of soiling. The work concludes with the finding that the proposed new cleaning technology and process can reach up to 98% total cleanliness, without the use of any chemical product and with very low water and power consumption.

1. Introduction

Ultrasonic cleaning is based on removing dirt particles through the acoustic cavitation of a liquid. During the process, a great number of gaseous microbubbles implode, releasing strong shockwaves, high-speed microjets, and soaring high temperatures [1]. The physical principles of the cavitation bubbles have been widely studied by many authors, from their nucleation [2] to their collapse [3] and clustering [4].
Acoustic cavitation is the foundation of one of the most sophisticated cleaning methods on the market, [5] “ultrasonic cleaning.” Gallego and Graff [6] acutely reviewed this technology and, in agreement with other authors, such as Fuchs, [7] depending on the size of the bubbles and the implosion intensity, a conclusion was drawn that ultrasounds can remove dirt from a surface but also modify the solid surface, or even the liquid itself. In this sense, there are many other applications which can and do benefit from acoustic cavitation, such as surface modification [8], catalysis [9], adsorbent regeneration [10], plant extraction [11], immobilization [12], and nano-emulsification [13].
Regarding the implementation of this technology for cleaning purposes, the most widespread method is based on adhering one or more ultrasonic transducers (piezoelectric or magnetostrictive) to the base of a metal tank. Some authors, such as Tangsopa and Thongri [14], have tested the distribution of the transducers in the tank in order to reach optimal working conditions. These elements are electrically connected to a signal generator which amplifies the source frequency (50–60 Hz) to the one required for the process (>20 kHz). When the vessel is filled with the solvent liquid (usually water and a surfactant) and the transducer is activated, a high-frequency acoustic field is generated, leading to cavitation throughout the volume of the tank. By introducing a solid object into the vessel, its surface will work as a nucleation area, and, therefore, cavitation will focus on it. The same approach can also improve the efficiency of other processes. For instance, Charee, Tangwarodomnukun, and Dumkum [15] used ultrasonic cavitation to remove the debris formed during the laser micromachining of silicon. From an environmental point of view, ultrasonic cleaning is a “green” alternative to conventional cleaning methods, such as polluted coatings and surfactants [16,17]. Other mechanical approaches, such as brushing, can achieve better cleaning results but can also damage the surface due to friction between solid components [18]. Scratching becomes especially critical when particles to be removed are made from hard materials [19]. Apart from ultrasonic cleaning, high-pressurized waterjets provide the only mechanical and noncontact solution. This technology is widely used in the cleaning industry and can handle nonregular surfaces, but, as we will soon find out, it consumes a great amount of power and water. Therefore, the key to this technology is nozzle geometry itself [20,21]. In places where water scarcity is a major problem, the use of pressurized water is not only an economical issue, but also an environmental one [18].
Ultrasonic cleaning is a very interesting alternative for this reason; but the need for this technology to fully immerse the body makes errant the cleaning of large-sized or anchored surfaces, such as floors, walls, ceilings, tables, cars, planes, etc. Certain developments and improvements can be used to try to find a solution to the aforesaid constraints. "Ultrasonically Activated Stream", or “UAS”, techniques, for instance, are based on applying ultrasonic vibration through a waterjet mechanism. This is the case for the so-called StarStream UAS®, developed by Offin and Leighton [22], which uses a waterjet that flows through a 23 kHz transducer. Studies performed by Howlin et al. [23] show that the UAS device is able to effectively remove various types of biofilms from dental plaque (Streptococcus mutans, Actinomyces naeslundii, and Streptococcus oralis). In the semiconductor industry, megasonic cleaning is very widespread. Due to the needs of on-line manufacturing, researchers from Honda, such as Chen et al. [24], have developed a method of transferring megasonic cavitation through waterjets. In cases where the component to be cleaned exceeds the dimensions of the waterjet, the same company has managed to develop certain curtain and waterfall configurations to circumvent this issue.
By analyzing how the same principle at ultrasonic frequency is applied to non-submersible surfaces, this paper suggests a radically different approach by introducing ultrasonic vibration into a thin liquid layer, which is then deposited onto a dirty surface. The main problem with this procedure, however, is that liquids tend to atomize when high ultrasonic energy is applied [25]. Each liquid presents a different atomization threshold [26] that must be adjusted to avoid loss of mass. However, vibration can dramatically increase wettability between solid and liquid phases [27] owing to the vibration-induced force on the surface [28]. This phenomenon helps to form a stable capillary bridge between the vibrating surface and the dirty one. The capillary bridge assumes the same function as the conventional tank but obviates the need for immersing the dirty surface in a confined volume.
With the aim of shedding light on this novel approach, a thorough understanding of the effect of the main process parameters on non-immersion ultrasonic cleaning is needed. For the sake of producing a justifiable evaluation of cleaning results, specular surfaces (mirrors) have been selected. This is because many authors, such as Fernandez-Garcia et al. [29], demonstrate that relative reflectance measurement is directly proportional to levels of cleanliness.

2. Working Principle

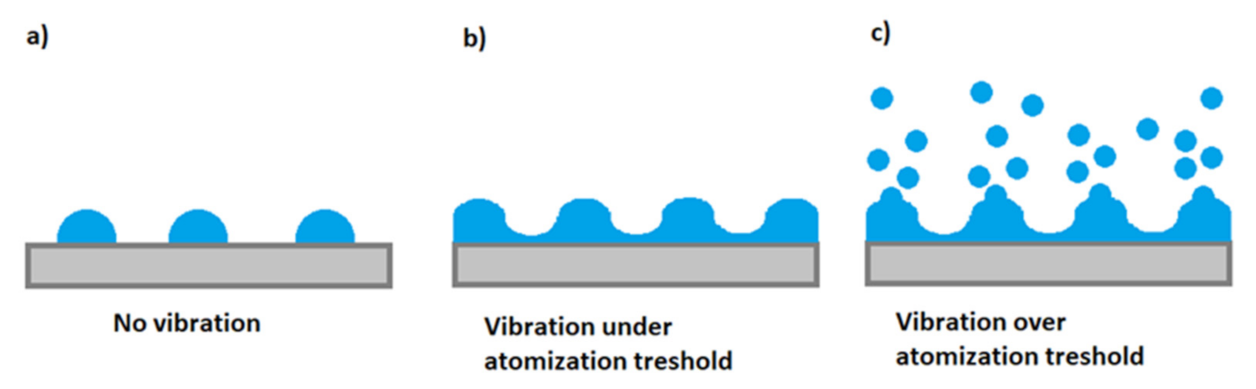
A key concept in understanding the mechanism which generates cavitation in a thin film of liquid is the atomization threshold. According to the work of Lozano et al. [26], when ultrasound is applied to a small volume of liquid, the fluid will atomize depending on the amplitude and frequency of the sound, and, moreover, the physical properties of the liquid itself. Thus, for each combination of liquid and frequency, a cavitation amplitude threshold can be established, as shown in Figure 1.
In order to clean a surface, the vibration amplitude should, ideally, be close to the atomization limit, but never exceed it. By doing this, two critical conditions are satisfied: first, it is possible to generate as much cavitation as possible without atomization, which proves decisive for the resulting level of cleanliness. Second, the wettability between the surface, the liquid, and the vibrating element can be increased. This dramatically enhances the liquid layer volume between solid elements.
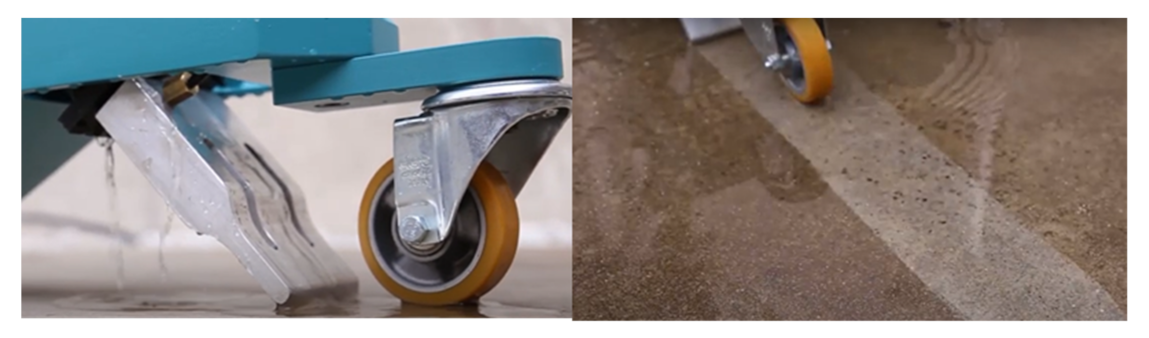
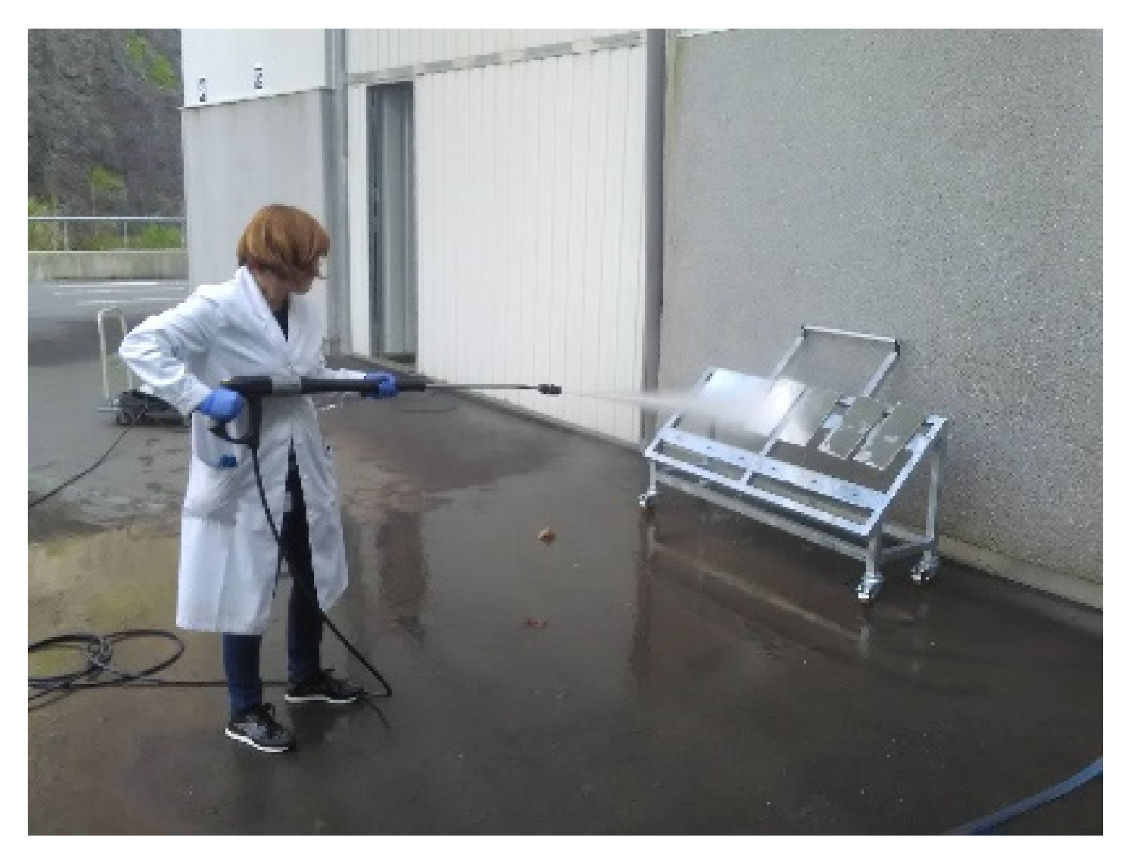
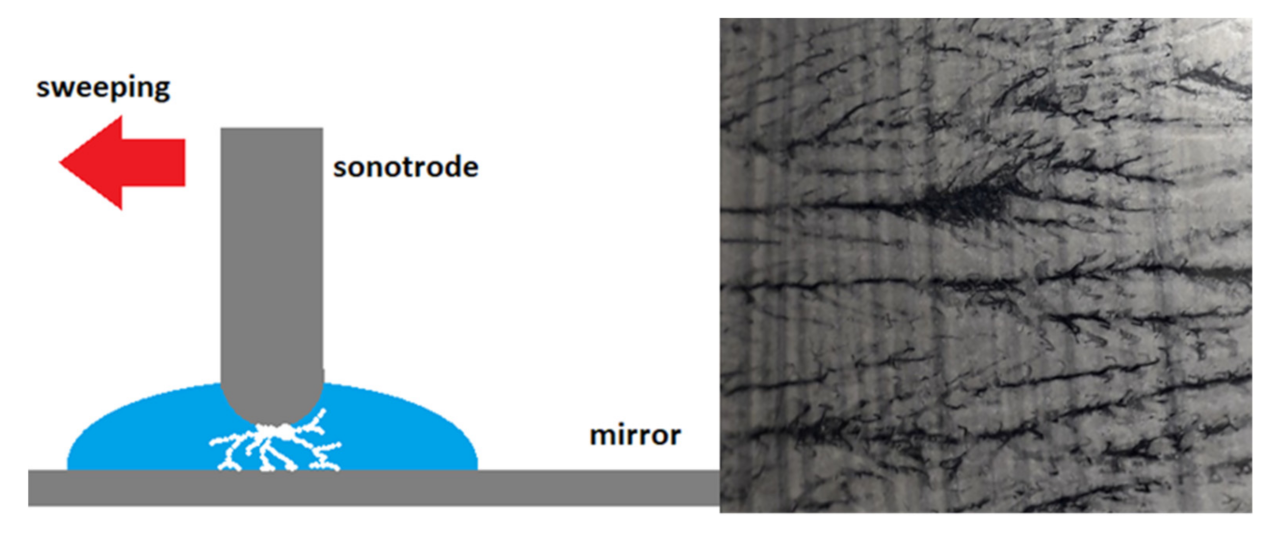
As shown in Figure 2, the cleaning procedure is based on sweeping the resonating element (sonotrode) over the dirty surface, always ensuring the presence of the liquid film between the two solid elements. In this case, the cleaning device has been assembled on a trolley that sweeps the tip of the sonotrode while the floor is being soaked by means of a 5mm diameter hose. Depending on the physical properties of both the surface and the dirt, some liquids will remain behind the sonotrode. To guarantee a constant film, two strategies can be adopted:
-
Wetting the dirty surface prior to sweeping.
-
Renewing the liquid interface continuously by means of a hose.

3. Experimental Procedure

3.1. Equipment

The main commercial devices used during the experimentation were as follows:
-
Ultrasonic generator and transducer: Bandelin Sonoplus (Berlin, Germany) ® HD 2200 60W 20 kHz homogenization equipment. The horn or sonotrode was modified.
-
Three-axis machine: Kondia Maxim (Elgoibar, Spain) ® CNC milling machine (X 750 mm; Y 1000 mm; Z 500 mm).
-
High pressure water cleaner: Kärcher (Winnenden, Germany) HD 9/20 4 M (200 bar, 6.9 kW, 15 L min−1).
-
Reflectance measuring device: 15R Devices & Services (Dallas, TX, USA) ® high intensity red light emitting diode (660 nm) reflectometer.

3.2. Experimental Set-Up

Commercial and specific components were assembled for experimental characterization. Regarding the ultrasonic cleaning system, the main difference lies in the sonotrode or ultrasonic horn, which was designed and manufactured for the present purpose of cleaning. The equipment consisted of the following:
-
commercial Bandelin ultrasonic generator: it transformed the electric signal from 50Hz to 20kHz and increased the output voltage. It autotuned the frequency, and output power could be manually adjusted from 10 to 100%.
-
commercial Bandelin piezoelectric transducer: it turned the high-frequency output of the generator into a vibration by means of piezoelectric rings. The whole thing resonated at about 20 kHz so that the vibration was maximized.
-
sonotrode: this was the working tool that came into contact with the liquid layer. It amplified the output of the booster and resonated at about 20 kHz. Being specifically designed for this purpose and manufactured using aluminium, it was mechanically attached (screwed) to the transducer. The main difference to other standard sonotrodes is its rounded tip, which increases the attaching surface and eases the sweeping operation, as shown in (Figure 3).
With the aim of controlling the sweeping speed and gap between the sonotrode and the dirty surface, the whole device was assembled on the 3-axis Kondia Maxim CNC milling machine, as shown in Figure 4. A specific holder was manufactured to attach the transducer and the sonotrode to the machine header. The cleaning experiments were performed on a DIN A4 mirror, whose reflectance was measured before and after the cleaning by means of 15R Devices and Services Reflectometer, which was placed on the mirror surface and measured the reflectance through the emission and reception of a laser spot. The mirror was soiled artificially with a mixture of real desert dust and tap water, and then left to dry. In this way, the dust was cemented and could not be removed by blowing or the force of gravity.

3.3. Design of Experiment

The main factors governing the non-immersion ultrasonic cleaning process were as follows:
-
acoustic power P [W] of the sonotrode tip: it was modulated through the power limitation of the generator. Its upper limit is 60 W, since, above this value, the cleaning liquid (water) is atomized. Working at said power, the tip of the sonotrode vibrated at 15 μm.
-
sweeping speed V [mm min−1]: it was the equivalent of exposure time per length unit, programmed by means of the numerical control of the 3-axis machine.
-
gap H [mm] between the sonotrode and mirror surface: it was limited by the stability of the maximum water layer thickness. In the experiment, the upper limit was about 5 mm.
The output of the experiment was the cleanliness factor, which was indirectly measured through the relative reflectance. Relative reflectance Rrel (1) or cleanliness was the ratio between its absolute value, measured by the reflectometer, and the maximum value (Rmax) that the clean mirror could achieve. The obtention of the maximum values will be explained later on. A perfectly clean mirror would reach value 1 in terms of relative reflectance.
R rel = R abs ·   R max 1
Due to the inhomogeneity of the dirt, 5 measurement points were considered for each cleaning experiment. The sample’s size was a standard DIN A4 (210 × 297 mm). The maximum power consumption of the device is 60 W. As for water consumption, a 1 mm layer on the whole mirror sample, equivalent to 0.06237 L, would do in the worst-case scenario.
The procedure of characterizing and soiling the mirrors started with measuring the absolute maximum reflectance of each mirror under perfect cleaning conditions (Rmax). All the mirrors were cleaned with deionized water, soap and a microfibre cloth. After cleaning and rinsing the mirrors, ethanol and a hot air dryer were used to remove the remaining water residue. Once the mirrors were perfectly clean, the absolute reflectance of each one was measured on 5 different points, and the average value was then calculated.
After consolidating on the degree to which perfect cleanliness was achieved, the mirrors were artificially soiled. For this reason, real desert sieved dust from Almeria (Spain) was used. The maximum particle size after sieving was 150 µm. In order to increase the adhesion between the dust and the mirror, the dust was moistened with tap water at the same volume proportion (Figure 5). The mixture was applied to the surface of the mirrors and dried with hot air. This lead to a cementation process which significantly increased adhesion. This kind of soil cannot be removed by simply blowing or pouring water on it. However, to distinguish between the different degrees of soiling, the present procedure will be denominated “slight” or “soft” soiling. Table 1 shows the results of all the measurements before and after the slight soiling procedure.
With the aim of understanding not only the isolated effect of each variable, but also the interaction between them, the experiments were based on a 2k + 1 factorial model. This design was based on a linear regression model which included the cross and triple interaction of certain factors. It included a central point that determined if quadratic factors were relevant or not. Considering the three variables (factors) mentioned, it required at least 9 experiments to saturate the equations (Figure 6). The response function was the relative reflectance (cleaning factor) measured after each experiment. Table 2 summarizes the factors to be included in the experimental design and the limitations. As will be shown later on, the 9-point experiment was focused on understanding the general behavioral process under slight and intense soiling conditions. Once the influence of each parameter was known, an optimized experimental design was performed.
As a way of evaluating the cleaning efficiency for harder soil, the whole experiment was repeated for intensively soiled mirror samples. The sample preparation procedure was the same for the slightly soiled ones, but, this time, the mirrors were dried and soiled twice. In this way, the number of particles on the surface was visibly higher, reaching cleanliness values between 0.13 and 0.06. Table 3 shows the reflectance values for each mirror sample.
The results of the non-immersion ultrasonic cleaning were compared with pressurized waterjets. This technology is based on pressurizing a water flow and releasing it into the atmosphere at a very high speed. The strong turbulence in output mixes the water with the air and expands the jet in a conical shape. If the surface to be cleaned is too far from the nozzle, particle removal will be lower, making the process dependent on the working distance instead. The experiment was based on testing the cleaning at different distances between the mirror and the nozzle (Figure 7). The mirrors were cleaned for 5 s (equivalent to 3.6 m min−1), consuming 1.25 L per probe.

4. Results and Discussion

The experiments were each repeated three times, in every soiling scenario, in order to accurately assess and evaluate the validity of the results. Since reflectance is measured on a single point, it was measured in three different locations after each cleaning experiment. The results from the experimentation are summarized in Table 4 (slightly soiled) and Table 5 (intensively soiled). All the factors are represented in their codified value (1, −1 or 0). The output for each experiment is the absolute average in relation to relative reflectance (cleanliness factor, CF). The table also includes the standard deviation (SD) for each set of experiments.
The data above make obvious the great sensitivity and care involved in the process. With the proper selection of power, gap, and speed, the cleaning factor reaches up to 0.94, while an improper combination turns into a cleaning factor below 0.2, in the worst-case scenario. 
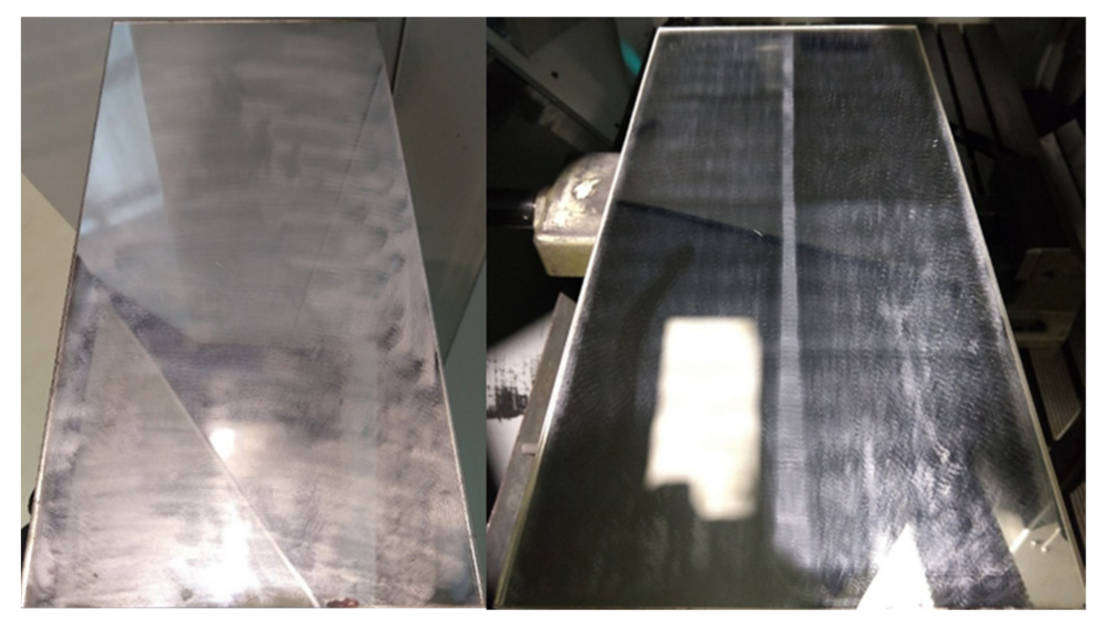
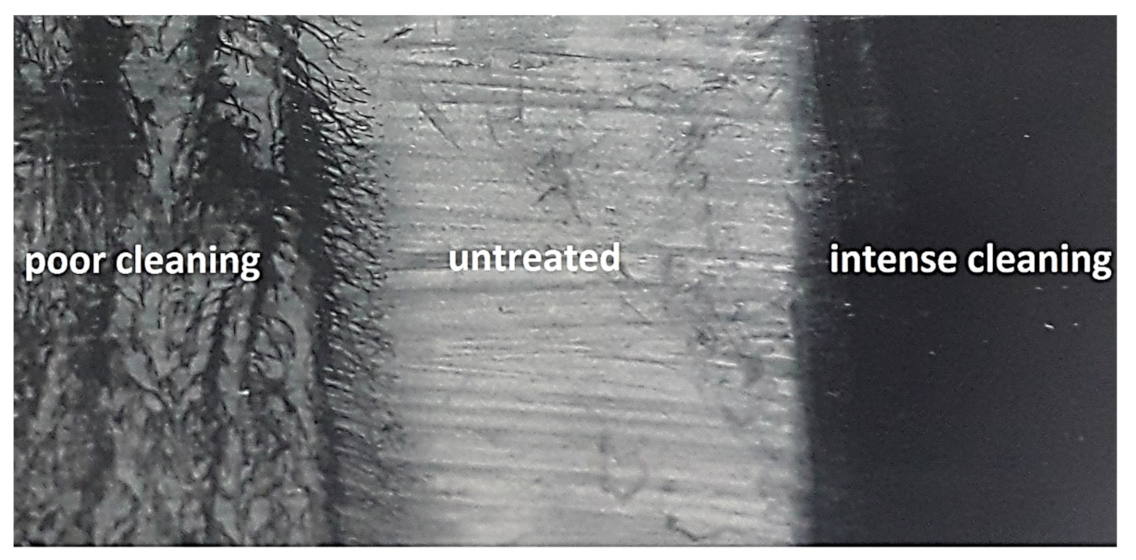
Figure 8 shows the cleaning results for experiments 4 and 5, where the difference can be visually appreciated due to the intensive soiling. Both experiments represent the best and worst cleaning conditions.
The intense cleaning conditions (experiment 5) allow for a cleanliness factor of up to 0.968, where few particles remain on the surface. The reason for not reaching the maximum values could be related to the limitations of the ultrasonic cleaning mechanism itself and/or to the rinsing process.
Compared to the intensive cleaning process, poor cleaning shows a nonhomogeneous finishing. In spite of the undesirable results, poor cleaning conditions provide an important clue about the cleaning mechanics. Insufficient cleaning occurs in a branched shape (Figure 8), the so-called “streamed cavitation”, similarly described by Lauterborn. The areas affected by the streamers show similar cleaning results to the intensely cleaned area, but the streamers do not cover the whole surface and the cleaning is, therefore, insufficient for its intended purpose.
Another very interesting point about Figure 8 is the fact that the distribution of the branches presents a well-defined periodic distribution, which should be studied in more detail. This branched cleaning does not only affect visual appearance, but, also, the dispersion of results. As mentioned before, the measurement of the reflectance is taken on several points. Consequently, a nonhomogeneous cleaning approach leads to a greater dispersion of cleaning results. This is especially significant in the case of the intensively soiled mirrors, where the difference between clean and dirty areas is easily visible to the naked eye. It could explain why the standard deviation reaches its highest values in the worst cleaning conditions. This first result, together with the visual appearance of the mirrors, concludes that the main mechanism for the removal of particles is cavitation itself. If there are no bubbles collapsing on the surface of the mirror, the particles do not detach from the surface. In this sense, collateral cleaning mechanisms, such as dissolution or turbulence of the aqueous medium, are discarded. The ideal cleaning occurs when the aforesaid cavitation streamers cover the whole surface of the mirror seamlessly.
From Mason’s [5] theoretical point of view, for a given sound frequency, cavitation intensity is related to acoustic power. This fact is clearly reflected in the cleaning factors in Table 4 and Table 5. However, the results also show that lower gaps lead to significantly better results than large ones. In terms of sound propagation theories, this does not match with the theoretical approach. The acoustic impedance of water is relatively low, and, as such, cleaning efficiency should be almost the same with a gap of 5 mm or 2 mm. It may be that cavitation bubbles can nucleate more easily on solid surfaces. In ultrasonic cleaning baths, it is very common to see how the cavitation streamers are formed close to the ultrasonic transducer. In this case, two solid surfaces come into play: the mirror and the sonotrode tip. If a gap of 5 mm is enough to reduce cleaning effects, most parts of the cavitation must be nucleating directly onto the surface of the sonotrode tip, as shown in Figure 9. Only the largest streamers reach the surface of the mirror, resulting in a branched and inhomogeneous cleaning. If the gap is reduced to 2 mm, more streamers will reach the mirror surface, resulting in a more homogeneous cleaning. As can be deduced from Figure 8 and Figure 9, cleaning must ensure that the streamers reach the mirror surface and that the scanning speed is, at the same time, slow enough to allow the streamers to cover the whole dirty area. In case the speed does not satisfy the productivity criteria, it is possible to increase the power, thus affecting the size and intensity of the streamers. However, the power is restricted by an atomization limitation for each liquid.
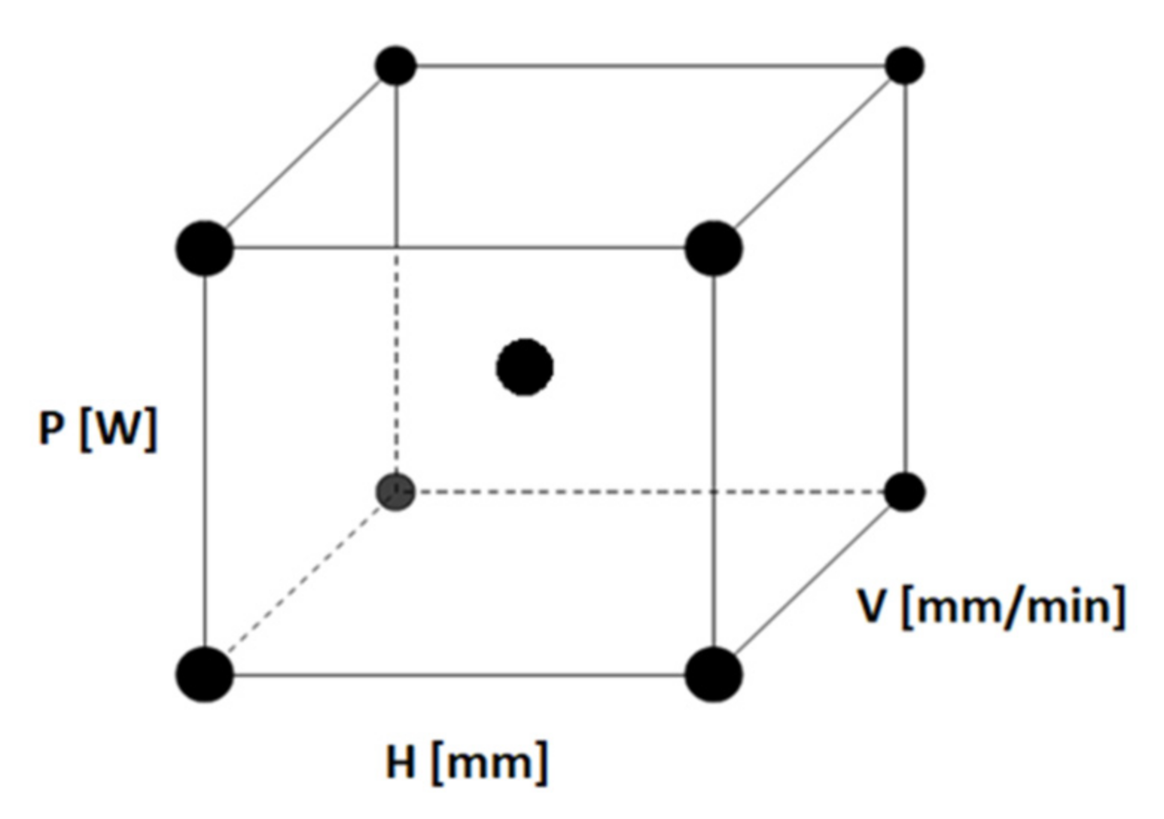
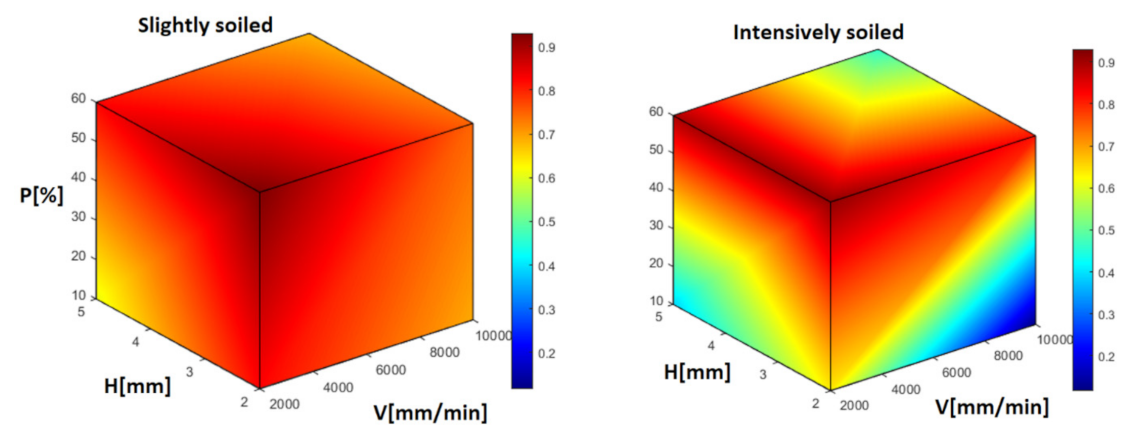
A linear regression model has been used for each scenario so that the results are linearized as a 4-dimensional equation (Figure 10). The value of the determination factor R2 was 75.74% for the first set of slightly soiled mirrors, and 83.67% for the intensively soiled ones, with each one taking into account the contribution of each codified factor, summarized in Table 6. Also taking into account that, in both cases, R2 is higher than 75%, it can be ascertained that the global behavior of the system is linear enough (quadratic factors are not relevant).
Table 6 shows that the effect of each factor varies according to the intensity of the soiling. It can be observed that, for soft soiling, the most significant factors are the gap (H), the speed (V), and the power (P), with a very similar effect. However, the cleaning behavior in the case of intensively soiled samples depends, firstly, on the power (P), and, secondly, on the gap (H). In fact, the crossed term, VHP, carries more weight than the speed (V) itself. This phenomenon could be linked to the cavitation streamers already mentioned. If they are not powerful enough [P] or they are too separated from the mirror [H], they will not detach the soil particles and the cleaning will always show poor results, regardless of the speed factor [V].
With linear regression models, it can be concluded that cleanliness tends to maximize its value with:
(1)
Higher power (P)
(2)
Lower gap (H)
(3)
Lower speed (V)
The power, P [W], can be increased by up to 60% of its nominal value; otherwise, atomization takes place and the process is no longer stable. The gap can be minimized but it should stay big enough to avoid physical contact (scratching). The minimum gap is defined by the geometrical accuracy of the whole equipment. In this case, values below 1 mm are too risky, as the sonotrode might scratch the mirror. Sweeping speed determines the exposure time of the mirror to the ultrasonic vibration, on one hand, and the productivity of the process, on the other hand. From Table 6, it can be concluded that the three main process parameters have an optimum operating point which does not depend on the soiling intensity, but, instead, on external constraints. The power must be at maximum output without exceeding the atomization limit. The gap must be at a minimum, without compromising the contact between the surfaces. The sweeping speed must also be at a minimum, without compromising productivity.
Following the previous optimization criteria, the power and the gap have been set to 60% and 1 mm subsequently. The speed has been varied from 1000 to 4000 mm min−1. The procedure for soiling and reflectance measurement is the same as in previous experiments, considering a slightly contaminated mirror and another intensely contaminated one. Table 7 shows the cleanliness factors for each case.
As can be seen, the results are quite similar to each other, in that they are generally quite high. Indeed, up to 0.98% cleanliness can be reached, which is very close to the perfect cleaning result (CF = 1).
It can also be concluded that, once the process’s conditions reach certain thresholds in terms of power and gap, the amount of soil particles does not affect the final cleaning results; but, obviously, the sweeping speed does. This could be explained by the fact that the strong turbulence generated by cavitation can easily remove large particles; however, since the flow speed of the hydrodynamic boundary layer is almost zero, submicron sized particles are much harder to remove.
Regarding water and power savings compared to conventional waterjet cleaning, the results are summarized in Table 8 and Table 9.
Table 8 shows few cleaning differences in pressurized waterjet cleaning when distance is modified. This could be accounted for by the fact that the minimum speed required to remove particles is already obtained at 1.5 m. However, for larger surfaces, a 0.5 m distance would not be realistic enough, as the effective cleaning diameter would be below 50 mm.
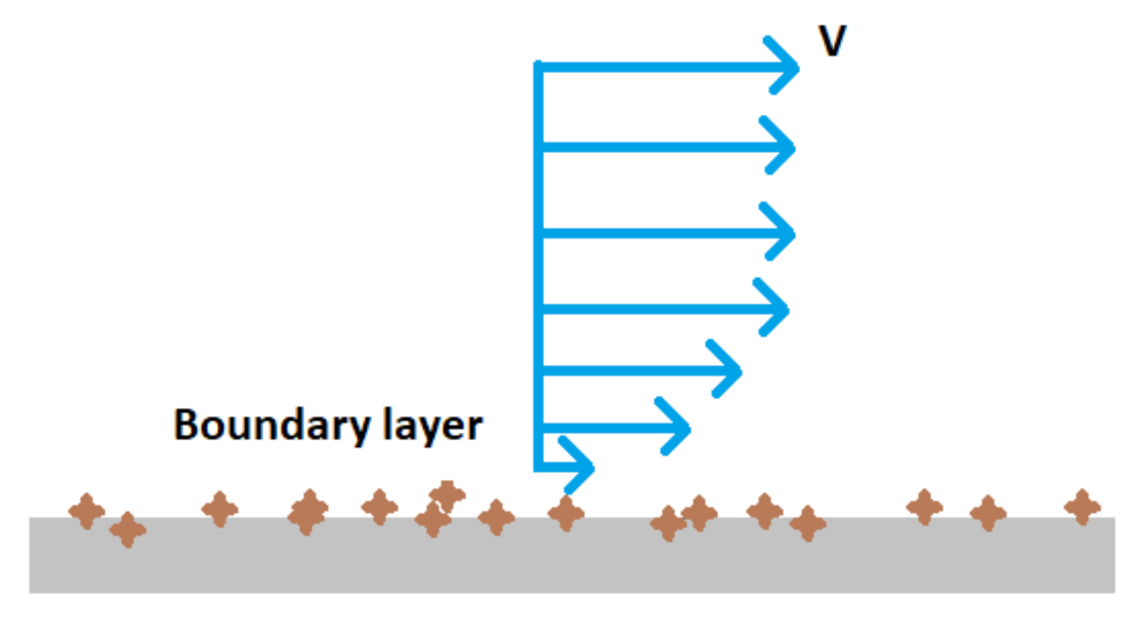
Table 9 concludes that, from an environmental point of view, pressurized waterjet technology cannot compete with non-immersion ultrasonic cleaning, needing 15 times more water and 115 times more electric power than the latter. At first glance, it might seem that the low cleaning speed of the ultrasonic method penalizes the power and water consumption but, as can be observed, both variables are much lower than for pressurized waterjets. Any improvement regarding the sweeping speed would only increase the efficacy of the process. The reason for these highly positive results lies in the particle removing mechanism itself. As demonstrated, ultrasounds use cavitation, while pressurized waterjets are based on hydrodynamic flow. It happens to be that, for small sized particles, the boundary layer between the solid and the liquid elements drastically reduces the flow of speed. As shown in Figure 11, if the particles are smaller than the boundary thickness, they become extremely difficult to remove using the pressurized waterjet method, as the relative speed in this area is almost zero. This is the reason why ultrasonic cavitation is much more effective. However, the present non-immersion ultrasonic cleaning approach is limited to flat surfaces, while pressurized waterjets can handle any kind of surface geometry. Gaps between 2 and 5 mm can easily be controlled for precise surfaces; but for general purposes, such as floor cleaning, adaptative mechanisms, such as pneumatic actuators or springs, should be considered. The main advantages and disadvantages of the ultrasonic method are summarized in Table 10.

5. Conclusions and Outlook

The work presented describes the research performed in the field of non-immersion ultrasonic cleaning for specular surfaces. The process is based on sweeping an ultrasound-emitting sonotrode over a liquid layer without exceeding atomization levels. The effects of gap, power, and sweeping speed have also been studied, and linear regression models have been used to support the following conclusions:
  • Regardless of soiling intensity, the conditions to obtain the maximum relative reflectance of 0.98, at a maximum power of (36 W), without reaching atomization, are to have a minimum gap of 1 mm (no contact) and minimum sweeping speed of 1000 mm min−1.
  • The effect of each process parameter is different depending on the soiling conditions.
  • For soft soiling conditions, power, gap, and sweeping speed affect the process on balance.
  • For hard soiling conditions, power and gap are the most significant factors.
  • Poor cleaning conditions lead to inhomogeneous cleaning because of the formation of cavitation streamers.
  • Once the power and gap are tuned to optimum settings, the relationship between the cleaning factor and the sweeping speed is almost linear. The degree of soiling is not relevant under aforesaid conditions.
  • Compared to pressurized waterjets, the present technology consumes 115 times less power and 15 times less water, even in the most conservative scenarios.
  • A 1 mm gap with a 1000 mm min−1 could account for the main technical and productive constraints of the technology.
This paper has focused on the cleaning of reflective surfaces soiled with cemented desert dust. Obviously, an immediate recommendation would be for the cleaning of optical elements located in desert areas, such as solar concentration plants, photovoltaic panels, or even telescope lenses. However, this technology can also be successfully applied and used in many sectors, e.g., urban floor and wall cleaning, indoor cleaning, vehicle maintenance, industrial machinery, etc. Further research should focus on the implementation of the existing technology and/or further material combinations, such as metal and oil or ceramics and organic matter, per se. On the other hand, the main drawbacks regarding sweeping speed and gap should be addressed in a separate paper. New sonotrode designs, cleaning fluids, and adaptative guidance systems could help increase the productivity and accessibility of the technology under evaluation.

Author Contributions

Conceptualization, E.A.B., J.A.S.M., and L.R.-R.; methodology, J.A.S.M.; formal analysis, E.A.B., J.A.S.M., and L.R.-R.; writing—original draft preparation, E.A.B., J.A.S.M., and L.R.-R.; writing—review and editing, J.L.V.-V. All authors have read and agreed to the published version of the manuscript.

Funding

This research was funded by European Union’s Horizon 2020 research and innovation programme under grant agreement Nº 654479 WASCOP and Nº 792103 SOLWARIS.

Institutional Review Board Statement

Not applicable.

Informed Consent Statement

Not applicable.

Data Availability Statement

Not applicable.

Acknowledgments

The projects leading to this research have received funding from the European Union’s Horizon 2020 research and innovation programme under grant agreement Nº 654479 WASCOP and Nº 792103 SOLWARIS.

Conflicts of Interest

The authors declare no conflict of interest.

References

  1. Supponen, O.; Obreschkow, D.; Kobel, P.; Farhat, M. Detailed jet dynamics in a collapsing bubble. J. Phys. 2015, 656, 12038. [Google Scholar] [CrossRef]
  2. Flynn, H.G. Physics of acoustic cavitation in liquids. Phys. Acoust. 1964, 1, 57–172. [Google Scholar]
  3. Rayleigh, L., VIII. On the pressure developed in a liquid during the collapse of a spherical cavity. Lond. Edinb. Dublin Philos. Mag. J. Sci. 1917, 34, 94–98. [Google Scholar] [CrossRef]
  4. Lauterborn, W.; Kurz, T.; Mettin, R.; Ohl, C.D. Experimental and theoretical bubble dynamics. Adv. Chem. Phys. 1999, 110, 295–380. [Google Scholar]
  5. Mason, T.J. Ultrasonic cleaning: An historical perspective. Ultrason. Sonochem. 2016, 29, 519–523. [Google Scholar] [CrossRef] [PubMed]
  6. Gallego-Juárez, J.A.; Graff, K.F. Power Ultrasonics: Applications of High-Intensity Ultrasound; Elsevier: London, UK, 2014. [Google Scholar]
  7. Fuchs, F.J. Ultrasonic cleaning and washing of surfaces. In Power Ultrasonics; Elsevier: London, UK, 2015; pp. 577–609. [Google Scholar]
  8. Chen, X.; Yan, J.; Ren, S.; Wei, J.; Wang, Q. Microstructure and mechanical properties of Ti–6Al–4V/Al1060 joints by ultrasonic-assisted brazing in air. Mater. Lett. 2013, 95, 197–200. [Google Scholar] [CrossRef]
  9. Giannakoudakis, D.A.; Łomot, D.; Colmenares, J.C. When sonochemistry meets heterogeneous photocatalysis: Designing a sonophotoreactor towards sustainable selective oxidation. Green Chem. 2020, 22, 4896–4905. [Google Scholar] [CrossRef]
  10. Alammar, A.; Park, S.-H.; Ibrahim, I.; Arun, D.; Holtzl, T.; Dumée, L.F.; Lim, H.N.; Szekely, G. Architecting neonicotinoid-scavenging nanocomposite hydrogels for environmental remediation. Appl. Mater. Today 2020, 21, 100878. [Google Scholar] [CrossRef]
  11. Voros, V.; Drioli, E.; Fonte, C.; Szekely, G. Process intensification via continuous and simultaneous isolation of antioxidants: An upcycling approach for olive leaf waste. ACS Sustain. Chem. Eng. 2019, 7, 18444–18452. [Google Scholar] [CrossRef]
  12. Sun, T.; Dong, Z.; Wang, J.; Huang, F.-H.; Zheng, M.-M. Ultrasound-Assisted Interfacial Immobilization of Lipase on Hollow Mesoporous Silica Spheres in a Pickering Emulsion System: A Hyperactive and Sustainable Biocatalyst. ACS Sustain. Chem. Eng. 2020, 8, 17280–17290. [Google Scholar] [CrossRef]
  13. Jesser, E.; Yeguerman, C.; Gili, V.; Santillan, G.; Murray, A.P.; Domini, C.; Werdin-González, J.O. Optimization and characterization of essential oil nanoemulsions using ultrasound for new ecofriendly insecticides. ACS Sustain. Chem. Eng. 2020, 8, 7981–7992. [Google Scholar] [CrossRef]
  14. Tangsopa, W.; Thongsri, J. Development of an industrial ultrasonic cleaning tank based on harmonic response analysis. Ultrasonics 2019, 91, 68–76. [Google Scholar] [CrossRef]
  15. Charee, W.; Tangwarodomnukun, V.; Dumkum, C. Ultrasonic-assisted underwater laser micromachining of silicon. J. Mater. Process. Technol. 2016, 231, 209–220. [Google Scholar] [CrossRef]
  16. Ivanković, T.; Hrenović, J. Surfactants in the environment. Arch. Ind. Hyg. Toxicol. 2010, 61, 95–110. [Google Scholar] [CrossRef] [PubMed] [Green Version]
  17. Lopes, D.; Conceição, R.; Silva, H.G.; Aranzabe, E.; Pérez, G.; Collares-Pereira, M. Anti-soiling coating performance assessment on the reduction of soiling effect in second-surface solar mirror. Sol. Energy 2019, 194, 478–484. [Google Scholar] [CrossRef]
  18. Bouaddi, S.; Fernández-Garc\’\ia, A.; Sansom, C.; Sarasua, J.A.; Wolfertstetter, F.; Bouzekri, H.; Sutter, F.; Azpitarte, I. A review of conventional and innovative-sustainable methods for cleaning reflectors in concentrating solar power plants. Sustainability 2018, 10, 3937. [Google Scholar] [CrossRef] [Green Version]
  19. Al Shehri, A.; Parrott, B.; Carrasco, P.; Al Saiari, H.; Taie, I. Impact of dust deposition and brush-based dry cleaning on glass transmittance for PV modules applications. Sol. Energy 2016, 135, 317–324. [Google Scholar] [CrossRef]
  20. Jiang, H.; You, Y.; Hu, Z.; Zheng, X.; Ma, Q. Comparative study on violent sloshing with water jet flows by using the ISPH method. Water 2019, 11, 2590. [Google Scholar] [CrossRef] [Green Version]
  21. Zhang, J.; Wang, Y.; Ge, Z.; Xiao, S.; Zhao, H.; Huang, X. Calculation model of high-pressure water jet slotting depth for coalbed methane development in underground coal mine. Appl. Sci. 2019, 9, 5250. [Google Scholar] [CrossRef] [Green Version]
  22. Birkin, P.R.; Offin, D.G.; Leighton, T.G. An activated fluid stream--New techniques for cold water cleaning. Ultrason. Sonochem. 2016, 29, 612–618. [Google Scholar] [CrossRef] [Green Version]
  23. Howlin, R.P.; Fabbri, S.; Offin, D.G.; Symonds, N.; Kiang, K.S.; Knee, R.J.; Yoganantham, D.C.; Webb, J.S.; Birkin, P.R.; Leighton, T.G.; et al. Removal of dental biofilms with an ultrasonically activated water stream. J. Dent. Res. 2015, 94, 1303–1309. [Google Scholar] [CrossRef]
  24. Chen, X.; Yam, P.; Keswani, M.; Okada, N.; Zanelli, C.I. Characterization of Cavitation in a Single Wafer or Photomask Cleaning Tool. Solid State Phenom. 2016, 255, 207–212. [Google Scholar] [CrossRef]
  25. Lang, R.J. Ultrasonic atomization of liquids. J. Acoust. Soc. Am. 1962, 34, 6–8. [Google Scholar] [CrossRef]
  26. Lozano, A.; Garcia, J.A.; Alconchel, J.; Barreras, F.; Calvo, E.; Santolaya, J.L. Influence of liquid properties on ultrasonic atomization. In Proceedings of the ILASS2017-28th European Conference on Liquid Atomization and Spray Systems, Valencia, Spain, 6–8 September 2017. [Google Scholar]
  27. Trapuzzano, M.; Tejada-Mart\’\inez, A.; Guldiken, R.; Crane, N. Volume and Frequency-Independent Spreading of Droplets Driven by Ultrasonic Surface Vibration. Fluids 2020, 5, 18. [Google Scholar] [CrossRef] [Green Version]
  28. Manor, O.; Dentry, M.; Friend, J.R.; Yeo, L.Y. Substrate dependent drop deformation and wetting under high frequency vibration. Soft Matter 2011, 7, 7976–7979. [Google Scholar] [CrossRef]
  29. Fernández-Garcia, A.; Álvarez-Rodrigo, L.; Martinez-Arcos, L.; Aguiar, R.; Márquez-Payés, J.M. Study of different cleaning methods for solar reflectors used in CSP plants. Energy Procedia 2014, 49, 80–89. [Google Scholar] [CrossRef] [Green Version]
Figure 1. Ultrasonic atomization cases: (a) no vibration, (b) vibration under the atomization threshold (no atomization occurs), and (c) atomization.
Processes 09 00585 g001
Figure 2. This illustrates non-immersion floor cleaning using the cleaning device. The picture on the left shows the sonotrode tips assembled on a trolley. The picture on the right shows the same device cleaning a dirty floor by sweeping the sonotrode. The difference between the dirty and clean areas is clearly visible to the naked eye.
Processes 09 00585 g002
Figure 3. This shows the interaction between the sonotrode and water in different scenarios. The water was treated with blue colorant to allow for a better visualization. (a) No ultrasonic vibration. (b) Ultrasonic vibration at 20 kHz and 10-micron amplitude. (c) Non-immersion cleaning on a dirty surface. 5 mm gap.
Processes 09 00585 g003
Figure 4. Cleaning equipment (left) and assembly on 3-axis machine (right).
Processes 09 00585 g004
Figure 5. From left to right: dirty mirror and cleaning results after different experiments.
Processes 09 00585 g005
Figure 6. Factorial design of experiments with 9 points. P is the ultrasonic power; H is the gap and V the sweeping speed.
Processes 09 00585 g006
Figure 7. High pressure water jet cleaning at 1.5 m distance.
Processes 09 00585 g007
Figure 8. Different cleaning results. From left to right: poor cleaning, untreated reference area, and intense cleaning.
Processes 09 00585 g008
Figure 9. Inhomogeneous cleaning under low cleaning conditions for an intensively soiled mirror. The figure on the left shows the way that cavitation streamers concentrate on the tip of the sonotrode. The figure on the right shows the way that the streamers remove the soil particles.
Processes 09 00585 g009
Figure 10. Response volume for slightly soiled mirror (left) and intensively soiled one (right). P is the ultrasonic power; H is the gap and V the sweeping speed.
Processes 09 00585 g010
Figure 11. Boundary layer effect in pressurized waterjets. V is the flow speed.
Processes 09 00585 g011
Table 1. Reflectance of perfectly cleaned and slightly soiled mirrors.
Perfectly Cleaned Mirror (Rmax)
Point 1Point 2Point 3Point 4Point 5Average Cleanliness (Rrel)
M1 94.994.794.194.594.594.541
M294.394.394.094.594.194.241
M395.395.695.295.495.495.381
Slightly Soiled Mirror (Rabs)
M1 58.259.566.145.072.960.340.63
M243.452.557.943.860.851.680.54
M347.558.634.563.472.255.240.57
Table 2. Limit values for each factor.
Variable Minimum Medium Maximum
P-Acoustic Power [%]103560
H-Gap [mm] 23.55
V-Sweeping Speed [mm min−1]2000600010,000
Table 3. Absolute reflectance (Rabs) [%] of intensively soiled mirror.
Absolute Reflectance Point 1 Point 2 Point 3 Point 4 Point 6 Average Cleanliness (Rrel)
M17.97.63.56.15.46.10.06
M22.05.71.67.02.63.780.04
M32.619.66.328.55.912.580.13
Table 4. Absolute reflectance after cleaning [%] for slightly soiled mirrors.
N H V HV P HP VP VHP CF Rep1 CF Rep2 CF Rep3 Aver. SD
1−1−11−111−10.8050.8460.8050.8190.0011
21−1−1−1−1110.7170.6640.7170.6990.0019
3−11−1−11−110.6710.5460.7080.6420.0144
4111−1−1−1−10.7230.6950.6070.6750.0073
5−1−111−1−110.9190.9400.9660.9420.0011
61−1−111−1−10.6870.8050.8580.7830.0154
7−11−11−11−10.7860.8620.9060.8510.0073
811111110.6840.6770.8200.7270.0129
900000000.7310.6000.7720.8190.0032
(P = vibration amplitude, V = sweeping speed, and H = gap).
Table 5. Absolute reflectance after cleaning [%] for intensively soiled mirrors.
N H V HV P HP VP VHP CF Rep1 CF Rep2 CF Rep3 Aver. SD
1−1−11−111−10.6750.6010.7800.6850.0163
21−1−1−1−1110.1660.0680.4040.2130.0598
3−11−1−11−110.4270.3460.6960.4900.0670
4111−1−1−1−10.3970.1480.2400.2620.0316
5−1−111−1−110.9340.8950.9680.9320.0027
61−1−111−1−10.8260.8010.8110.8120.0003
7−11−11−11−10.9200.8680.9580.9160.0041
811111110.5610.3600.6830.5340.0532
900000000.8160.7740.7500.6850.0022
(P = vibration amplitude, V = Sweeping speed, and H = gap).
Table 6. Effect of factors for codified experiments.
H V HV P HP VP VHP Intercept
Slightly soiled−0.045−0.0460.0340.043−0.0370.004−0.024−0.045
Intensively soiled−0.146−0.0590.0090.2090.012−0.035−0.092−0.146
Table 7. Cleaning results for 60% power with a 1 mm gap.
V [mm min−1] 1000 2000 3000 4000
Slightly soiled0.9810.9720.9600.955
Intens. soiled0.9750.9760.9660.95
Table 8. Water pressure cleaning results at different distances.
Distance [m] Cleanliness Factor
1.50.97
0.50.98
Table 9. Comparison between technologies.
Ultrasonic Water Jet
Max power [W]366900
Energy consumption per sample [J]128234,500
Max water [l probe−1]0.06231.5
Max cleaning [%]0.980.98
Table 10. The main advantages and disadvantages of non-immersion ultrasonic cleaning.
Advantages Disadvantages
Low power consumptionLow cleaning speed
Low water consumptionLow working gap
Non-contact cleaningLimited to flat surfaces
No use of chemicalsSophisticated equipment
Publisher’s Note: MDPI stays neutral with regard to jurisdictional claims in published maps and institutional affiliations.

