Bank Competition in India: Some New Evidence Using Risk-Adjusted Lerner Index Approach

1
Institute of Rural Management Anand, Anand 388001, India
2
Vinod Gupta School of Management, Indian Institute of Technology, Kharagpur 721302, India
3
Department of Financial Studies, University of Delhi, New Delhi 110021, India
4
Indian Institute of Management Indore, Indore 453556, India
*
Author to whom correspondence should be addressed.
Risks 2019, 7(2), 44; https://doi.org/10.3390/risks7020044
Submission received: 17 February 2019
/
Revised: 9 April 2019
/
Accepted: 10 April 2019
/
Published: 18 April 2019
(This article belongs to the Special Issue Financial Risks and Regulation)
Abstract
:Banks in India have been gone through structural changes in the last three decades. The prices that bank charge depend on the competitive levels in the banking sector and the risk the assets and liabilities carry in banks’ balance sheet. The traditional Lerner Index indicates competitive levels. However, this measure does not account for the risk, and this study introduces a risk-adjusted Lerner Index for evaluating competition in Indian banking for the period 1996 to 2016. The market power estimated through the adjusted Lerner Index has been declining since 1996, which indicates an improvement in competitive condition for the overall period. Further, as indicated by risk-adjusted Lerner Index, the Indian banking system exerts much less market power and hence are more competitive contrary to what is suggested by traditional Lerner index.
1. Introduction
Market structure, market power, and competition have been independent fields of research in both theoretical and empirical literature. While theoretical studies in the extant literature primarily focused on discovering novel measures of market structure, power, and efficiency, empirical research concentrated on testing the efficacy of various measures in assessing the degree of competition, particularly in the banking sector. With the adoption of Basel Committee recommendations on the capital structure and risk management, banking has undergone significant changes. Financial liberalization, worldwide integration of financial markets, and banking harmonization have led to an increased interest in assessing the state of competition in the global banking industry. As a result, studies have attempted to investigate competition in the banking industry documenting a general view that bank competition promotes economic growth. Lerner Index (Lerner 1934) provides a measure of competition; we introduce a risk-adjusted Lerner Index, which is the major contribution of this study.
In a pre-reform era of 1991, Indian banks functioned in a tightly regulated environment characterized by controlled interest rates, state-directed credit policy, high Statutory Liquidity Ratio (SLR), and Cash Reserve Ratio (CRR) thereby exerting pressure on competitive efficiency and financial stability of banks. Amidst fast growing bank deposits, the profitability of banks was abysmally low, and the survival of the Indian banking sector was frowned upon due to the erosion of core capital. This situation led to the constitution of Committee on the Financial System (CFS) by the then finance minister in the year 1991. Based on the suggestions of the committee, various initiatives were undertaken to develop competitive efficiency and stability of the Indian banking sector. The Indian banking system has since then witnessed dramatic changes in its competitive structure with ensuing diversification of ownership of state-owned banks and easing entry requirements for private and foreign banks. This ever-increasing competition among banks has led to nurturing of financial innovation, improved customers’ services, and newer ways of doing business.
While Lerner Index has been a popular standard measure of assessing market power and competition in the extant literature with its theoretical and empirical underpinnings, the measure does suffer from various drawbacks. Spierdijka and Zaourasa (2018) explained the need for scale correction in the Lerner Index. Studies have talked about the effect of risk on performance and competition. Maheshwari and Sarantsev (2018) evaluated risk in a bank and its effect on banks’ business through a financial model. Traditional Lerner Index based measure does not account for the risk, particularly NPA (Non-Performing Assets) provision and cost for capital adequacy in the pricing process. This study, therefore, proposes a new risk-adjusted Lerner Index to look at the competitive structure in the Indian banking sector. The new measure (risk-adjusted Lerner Index) adjust for the risk cost, particularly NPA provision and cost for capital adequacy while assessing competition in the context of the Indian banking sector.
The findings of our study document that the market power estimated through the adjusted Lerner Index has been continuously declining, particularly post-2008, which indicates an improvement in competitive condition for the overall period. Furthermore, as indicated by the adjusted Lerner Index, the Indian banking system exerts much less market power contrary to what is suggested by traditional Lerner index. This has implications for regulators and policymakers as there may be a plausible underestimation of the degree of competition prevailing in the Indian banking system, if assessed through the lens of traditional Lerner Index. In effect, the prevailing market dynamics and reforms undertaken by the regulator over the years have successfully increased the competitive rivalry in the Indian banking system.
This study estimates the degree of market power in the Indian banking sector by proposing a Lerner Index which is adjusted for risk. By assessing market power which is adjusted for risk, this study provides policymakers an insight into the effect of risk on the market power as there is a considerable shift in the market power index. This would help in designing policies for social welfare, easier entry norms, management of risk, and balanced development of the banking system.
The remainder of the paper is organized in the following manner. Section 2 discusses the literature review; Section 3 lays down the Indian banking scenario; Section 4 outlines the empirical design; Section 5 discusses the empirical results; Section 6 concludes with findings and implications for policymakers.
2. Literature Review
A structural approach for measuring competition is based on the Structure Conduct Performance (SCP) paradigm that frames a causal relationship between market structure and pricing behavior of firms. SCP is based on twin hypothesis: structure leads to conduct and conduct, in turn, leads to performance. This implies that in the concentrated banking industry, banks may gain sufficient banking power that can lead to a reduction in deposit rates and an increase in lending rates to earn monopolistic profits.
Bresnahan (1982), Lau (1982), and Panzar and Rosse (1987) developed two popular techniques for evaluating the level of competition in the market, known as contestability. Breshanan’s model follows a general equilibrium model based on the notion that firms, which maximize profits, will choose those prices and quantities where marginal cost equals marginal revenue. This is similar to demand price under perfect competition or the industry’s marginal revenue when firms collude. The model suggested by Bresnahan (1982) and Lau (1982) needed to estimate a simultaneous equation model based on aggregate industry data with a variable for the degree of market power. The association between change in factor input price and revenue of a bank is examined using the Panzar Rosse model, which, in turn, rests on the proposition that banks deploy varied pricing strategies as a consequence of changes in input costs, given the market structure in which they operate. The key merit of this model is that it uses bank-specific data and accounts for the peculiar characteristics of each bank.
The Lerner Index measures the mark-up as a percentage of prices. The mark-up is the price charged from customers above the marginal costs. Consequently, the higher the value of the Lerner Index, lower shall be the competition among banks. Fernandez de Guevara et al. (2005) estimated the Lerner Index in major European countries for the 1990s and found no significant decline in market power irrespective of three sequential market liberalization measures. Maudos and Guevara (2007) determined the loss of social welfare due to market power using the Lerner Index. These studies have found the worsening competitive conditions over a period of time in European banking during the 1990s using the Lerner Index.
Rezitis (2010) studied the impact of mergers and acquisition on competition in the context of Greek banking industry and found that mergers and acquisition have made banking system less competitive and the purpose of mergers and acquisition has been to acquire market power. The SCP paradigm contends that high concentration leads to collusive behavior, which was critiqued by an economist (Baumol et al. 1982) who argued that even in highly concentrated markets, the absence of entry and exit barriers would lead to higher competition. However, there are studies that have contradicted this assertion and concluded that higher competition leads to lower concentration. Claessens and Laeven (2004) found no empirical support of the sustained increasing relationship between market power and market concentration. Bikker (2004) used Hall-Roeger model along with Panzar-Rosse and Bresnahan-Lau model to evaluate competitive levels and found that in the event of a small number of banks, the concentration indices become unreliable and tend to overstate the competition. It was the first time that Hall-Roeger model, which was popular in manufacturing industries, was used in the banking industry. He found that there was a decrease in competition post-merger, and the purpose of mergers is to magnify profits in short-run through attainment of higher market power rather than by augmenting efficiency.
Bikker and Haaf (2002) used the PR model for the empirical analysis and Herfindahl Index and K-bank concentration ratios for analyzing the structure of the banking industry in 23 countries using structural and non-structural model, and empirically tested the relationship between competition and concentration by segmenting banking industry into small and local banks, medium-sized national banks, and large international banks. He concluded that banking markets in industrialized countries are characterized by monopolistic competition; there is higher competition in larger banks as compared to smaller banks; few large banks have the power to restrict competition while smaller banks are unable to do so.
Olivero et al. (2010) studied competition in banking and its consequences on monetary policy of a country and found that monetary tightening by the government would have no significant impact on large banks rendering it ineffective; however, it would have the impact of a larger magnitude on small banks. The customers of smaller banks would be affected in the presence of information asymmetries and transaction cost of moving from one bank to another.
Shaffer (1989) applied Bresnahan model to time series of US banking industry’s aggregate data from 1941 to assess competition, and his estimates strongly refuted monopoly and supported perfect competition. Jeon et al. (2011) in their study scrutinized the effect of penetration of foreign bank on the competition and banking structure in emerging Asia and Latin America during the period 1997 to 2008. The results indicated a positive link between foreign bank penetration and banking competition in the domestic banking sector.
Park (2009) analyzed both market concentration and competition in the Korean banking system during the period 1992–2004. While the results indicated a decrease in market concentration during the pre-crisis period (on account of financial deregulation), the post-crisis period showed a significant increase. The study further documented no effect on bank competition on account of consolidation due to the increase in foreign ownership of domestic banks.
Ariss (2010) attempted to study the banking structures prevailing in both Islamic and conventional global markets (using a sample of Islamic banks across 13 different countries) so as to understand the possible differences in profitability for the period 2000–2006. The study documented that the Islamic banks are better capitalized as compared to conventional banks while allocating a larger share of their assets to financing activities. Anzoategui et al. (2010) compared the level of competition in the Russian banking system with similar economies like India, Brazil, and China. The article used the Herfindahl Index, Panzar Rosse H-statistic, and the Lerner Index to assess concentration. Authors opined that concentrated banking sectors could be competitive as long as they are contestable. The paper further analyzed contestability by looking at the entry and exit policies in the Russian banking system. Empirical results from the Lerner index and PRH statistic suggest that Russian banking is more competitive than India and China and less competitive than Brazil. Carbó et al. (2009) opined that when competition is measured across countries using different measures of competition, it may give different results on account of the influence of country-specific factors thereby questioning the reliability of measures of competition. The authors argued that concentration increased in the European banking sector during the period 1995 to 2001, and as the relationship between market power and concentration was unclear, it was important to accurately assess competition, the effects of deregulation, and likely impacts of mergers. Lerner Index suggested that competition had reduced in the European banking sector, contrary to the general perception of an increase in the competitive rivalry. The reason for the difference was attributed to the Lerner Index looking at only traditional sources of income, that is, loans and investments and ignoring other sources of income.
Maudos and Solís (2011) studied competition structure in the Mexican banking system for the period 1993–2005. This period witnessed deregulation, bank liberalization, and consolidation of banks in Mexico. Using PRH statistic and Lerner Index, the authors found that market power led to social inefficiencies which meant a considerable social loss for the society. Hamza and Kachtouli (2014) in their study investigated the competitive conditions and market power using a dataset of conventional and Islamic banks from Middle East and North Africa and Southeast Asia over the period 2004–2009. The study used various structural and non-structural measures to assess competition and market power and reported low concentration for both the markets under the Herfindahl-Hirschman index (HHI). The study further documented evidence of monopolistic competition and a high degree of market power in both markets.
Spierdijka and Zaourasa (2018) in their study analyzed the market power of the US banking sector for the period 2000–2014 using a scale corrected and uncorrected Lerner Index. Their findings suggested significant market power for US banks using the scale adjusted Lerner Index (for 60–85% of the bank years) as compared to the uncorrected index. Mirzaei (2019) in a study analyzed the impact of the global financial crisis on market power across various banks in the UAE using the Lerner Index. The results suggested a loss of market power during the global financial crisis on the sample banks. The results further varied depending upon the bank level characteristics, such as capitalization and efficiency.
3. Competition in Banking—The Indian Experience
The Indian banking system has been going through constant changes since the liberalization of the Indian economy. Roland (2008) explained that Indian banking systems have gone through different levels of repressive policies and tried to assess the intensity by looking at interest rate control, statutory pre-emptions, and directed credit. Financial repression increased steadily between 1960 and 1980, and there has been a steady decline since the financial liberalization in 1990. Even though there is a high degree of financial repression, the findings of the study do not find any evidence against its effects on savings, capital formation, and financial development. Saha and Ravisankar (2000) estimated the performance of public sector banks in India using the efficiency approaches. The study found that there was an improvement in the efficiency of public sector banks between 1992 and 1995. Performance of Indian banks was found to be comparable with banks across the world by Sathye (2003). The efficiency of public sector banks and foreign banks was found to be higher than private banks in India. Ownership did not affect return on assets significantly, and net interest margins were higher in significant periods for public sector banks compared to other banks. Evaluation of the revenue side of banking revealed inefficiencies in Indian banks, as demonstrated by Das and Ghosh (2006). The study applied a non-parametric approach, namely, data envelopment analysis for the study. Indian banks were not affected by the entry of foreign banks in the Indian banking system (Sathye 2003). The late 1990s saw increased activity in merger and acquisitions, but it did not affect the concentration in Indian banking system significantly (Bhattacharya and Das 2003). Conjectural variation approach was applied by Varma and Saini (2011) to understand the effect of banks’ size on their behavior in the market. The study found that the large banks had lower price mark-ups signifying that efficient banks captured markets through their efficient conduct in the market. Deregulation had a positive impact on Indian banks and led to better performance and efficiency (Zhao et al. 2010).
Though studies on Indian banking system have tried to look at the overall performance of banks in India, studies have not tried to look at risk and the adjustment of risk to find risk-adjusted performance and competitive measures. Post-2008, with increased risk in the financial system, this study covers the gap of risk adjustment in competition measurement.
4. Empirical Design
Lerner Index is an estimate of market power which is measured by the charge of price over marginal cost. Studies have applied the Lerner Index for providing stylized facts on competitive levels over time. In the case of banking firms, an imperfect competition model is used to obtain the below expressions of the Lerner Index.
where p = average price or income of a bank (total revenues/total assets; proxy for average price) and MC = marginal cost.
Marginal cost is calculated by estimating the trans-logarithmic costs function. There are three input price factors, that is, labor, physical capital, and deposits on which total cost is dependent. It is also dependent upon the volume of production, total assets, and on technical change which is proxied by a Trend.
Risks are inherent in the banking business. In a complete risk-based pricing model, risk price is reflected in the form of opportunity cost and absorbed as per probability of default. However, in the Indian context, complete risk-based pricing model has not been implemented by banks. As a result, the price of a loan product does not contain the risk premium. Banks in India have been partially ignoring the risk price in the loan pricing process. This has influenced the competitive condition to some extent during the short-run. However, during the medium and long-run, due to the crystallization of risk, banks lose their competitive strength. Lerner Index does not factor risk in measuring market power; hence this study would try to factor the same for assessing the competition. It is generally found that banks rarely adjust the risk cost, particularly NPA provision and cost for capital adequacy. The study has factored these costs so as to arrive at a new adjusted cost. NPA provisions amount is added to other operating costs of each bank. The cost of capital adequacy is added to the fund cost, and trans-log function is estimated.
5. Empirical Estimations
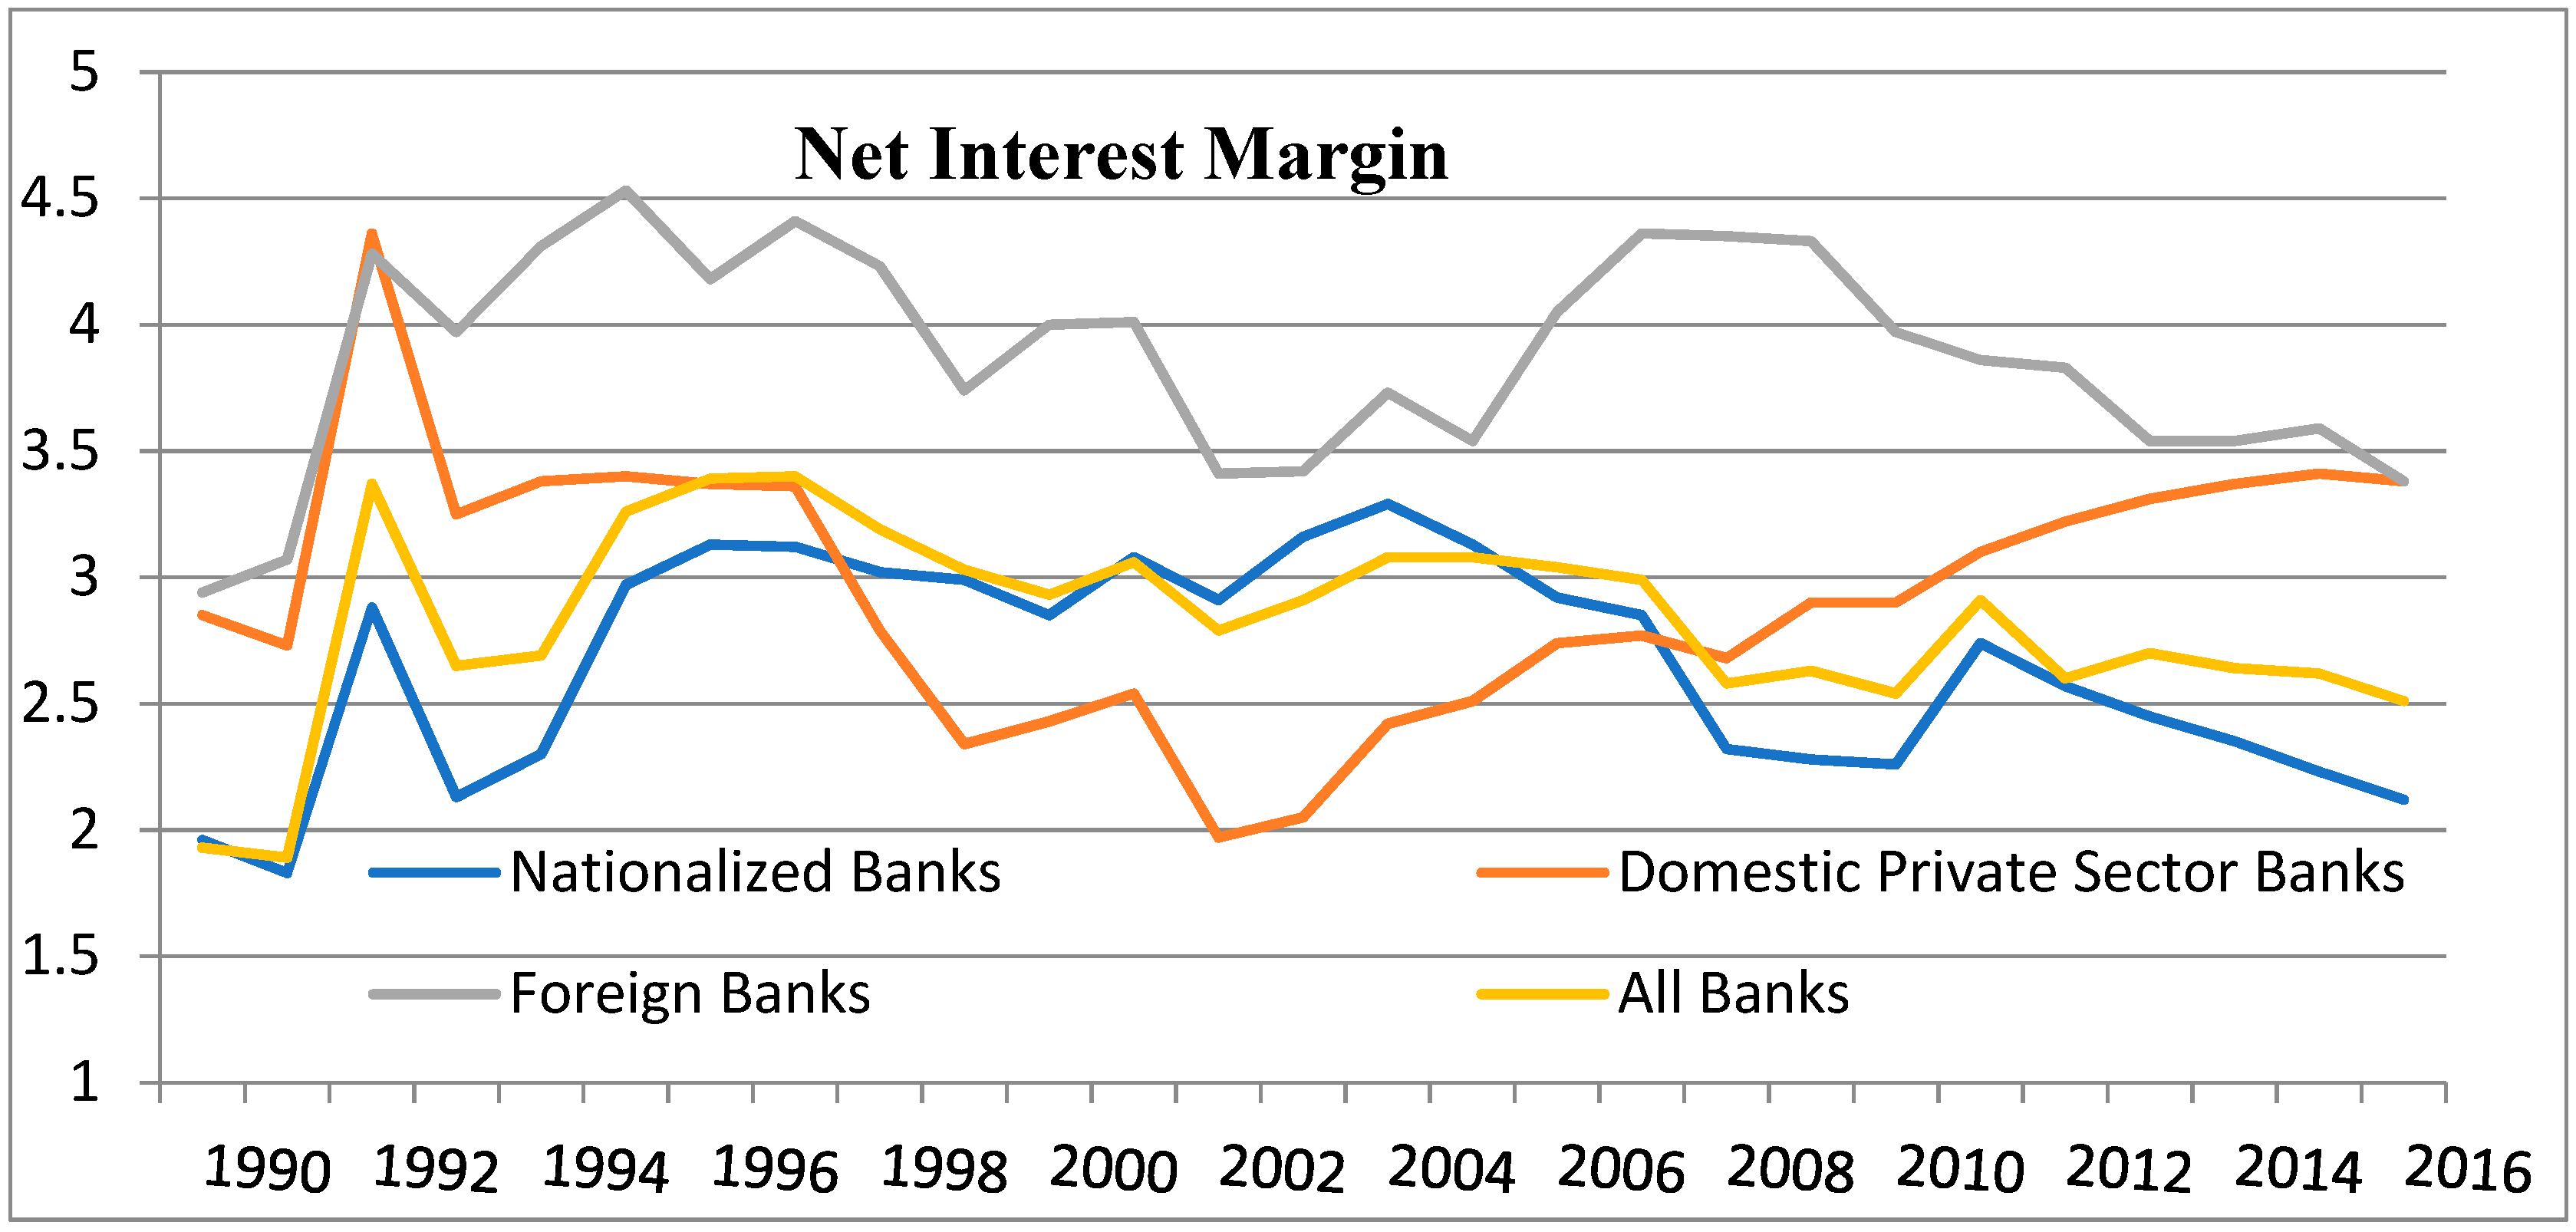
To look at market power intuitively, profitability parameters are presented in Figure 1. The wide gap between the price and cost of funds intuitively convey the presence of market power in the banking system.
The study estimates price as the ratio of interest earned to total assets. The estimation of Marginal cost is done by applying the trans-logarithmic cost function. The expression for trans-logarithmic cost function is given below:
where Ci is the cost of product i, qi is the output of product i, Wji represents the three-factor input costs, that is, labor, capital, and administrative expenses.
The derived form of marginal cost from trans-logarithmic cost function is given below:
The study estimates traditional Lerner Index for the periods between 1996–2016 and estimates the level of market power. The period post-1994 started the phase of banking sector deregulation. This was followed by the Indian banking sectors’ initiation into BASEL II implementation and consolidation for the reforms.
The study applies unit cost prices for funds, labor, and administrative expenses as factor inputs. The unit costs are defined as follows:
- Fund cost: Interest paid to total funds
- Administrative expenses: Administrative expenses to total assets
- Labor cost: Employee salaries and provisions to total assets
The study estimates the marginal cost by applying the trans-logarithmic costs function. In the estimation of the cost function, three input prices are taken as the dependent variable in the trans-logarithmic cost function: labor, physical capital, and administrative expenses. The other dependent variables are the bank’s volume of production (total assets) and technical change (proxied by a Trend). The study introduces a panel data structure of 46 banks, and the sample represents more than 80% of the banking system in terms of total assets. Table 1 provides descriptive statistics for the variables used in our study.
The panel diagnostic tests in Table 2 provide results in favor of pooled Ordinary Least Square model. Fixed effects estimates are consistent as against random effects. Given below are the estimates of Lerner cost function.
Marginal cost is estimated from the first order derivative of the total cost function. The study estimates marginal cost for each bank and for each year during the period 1994–2016. Lerner Index is estimated from the results in the above expression and by applying Equation (1). The results of the Lerner Cost function is presented above in Table 3.
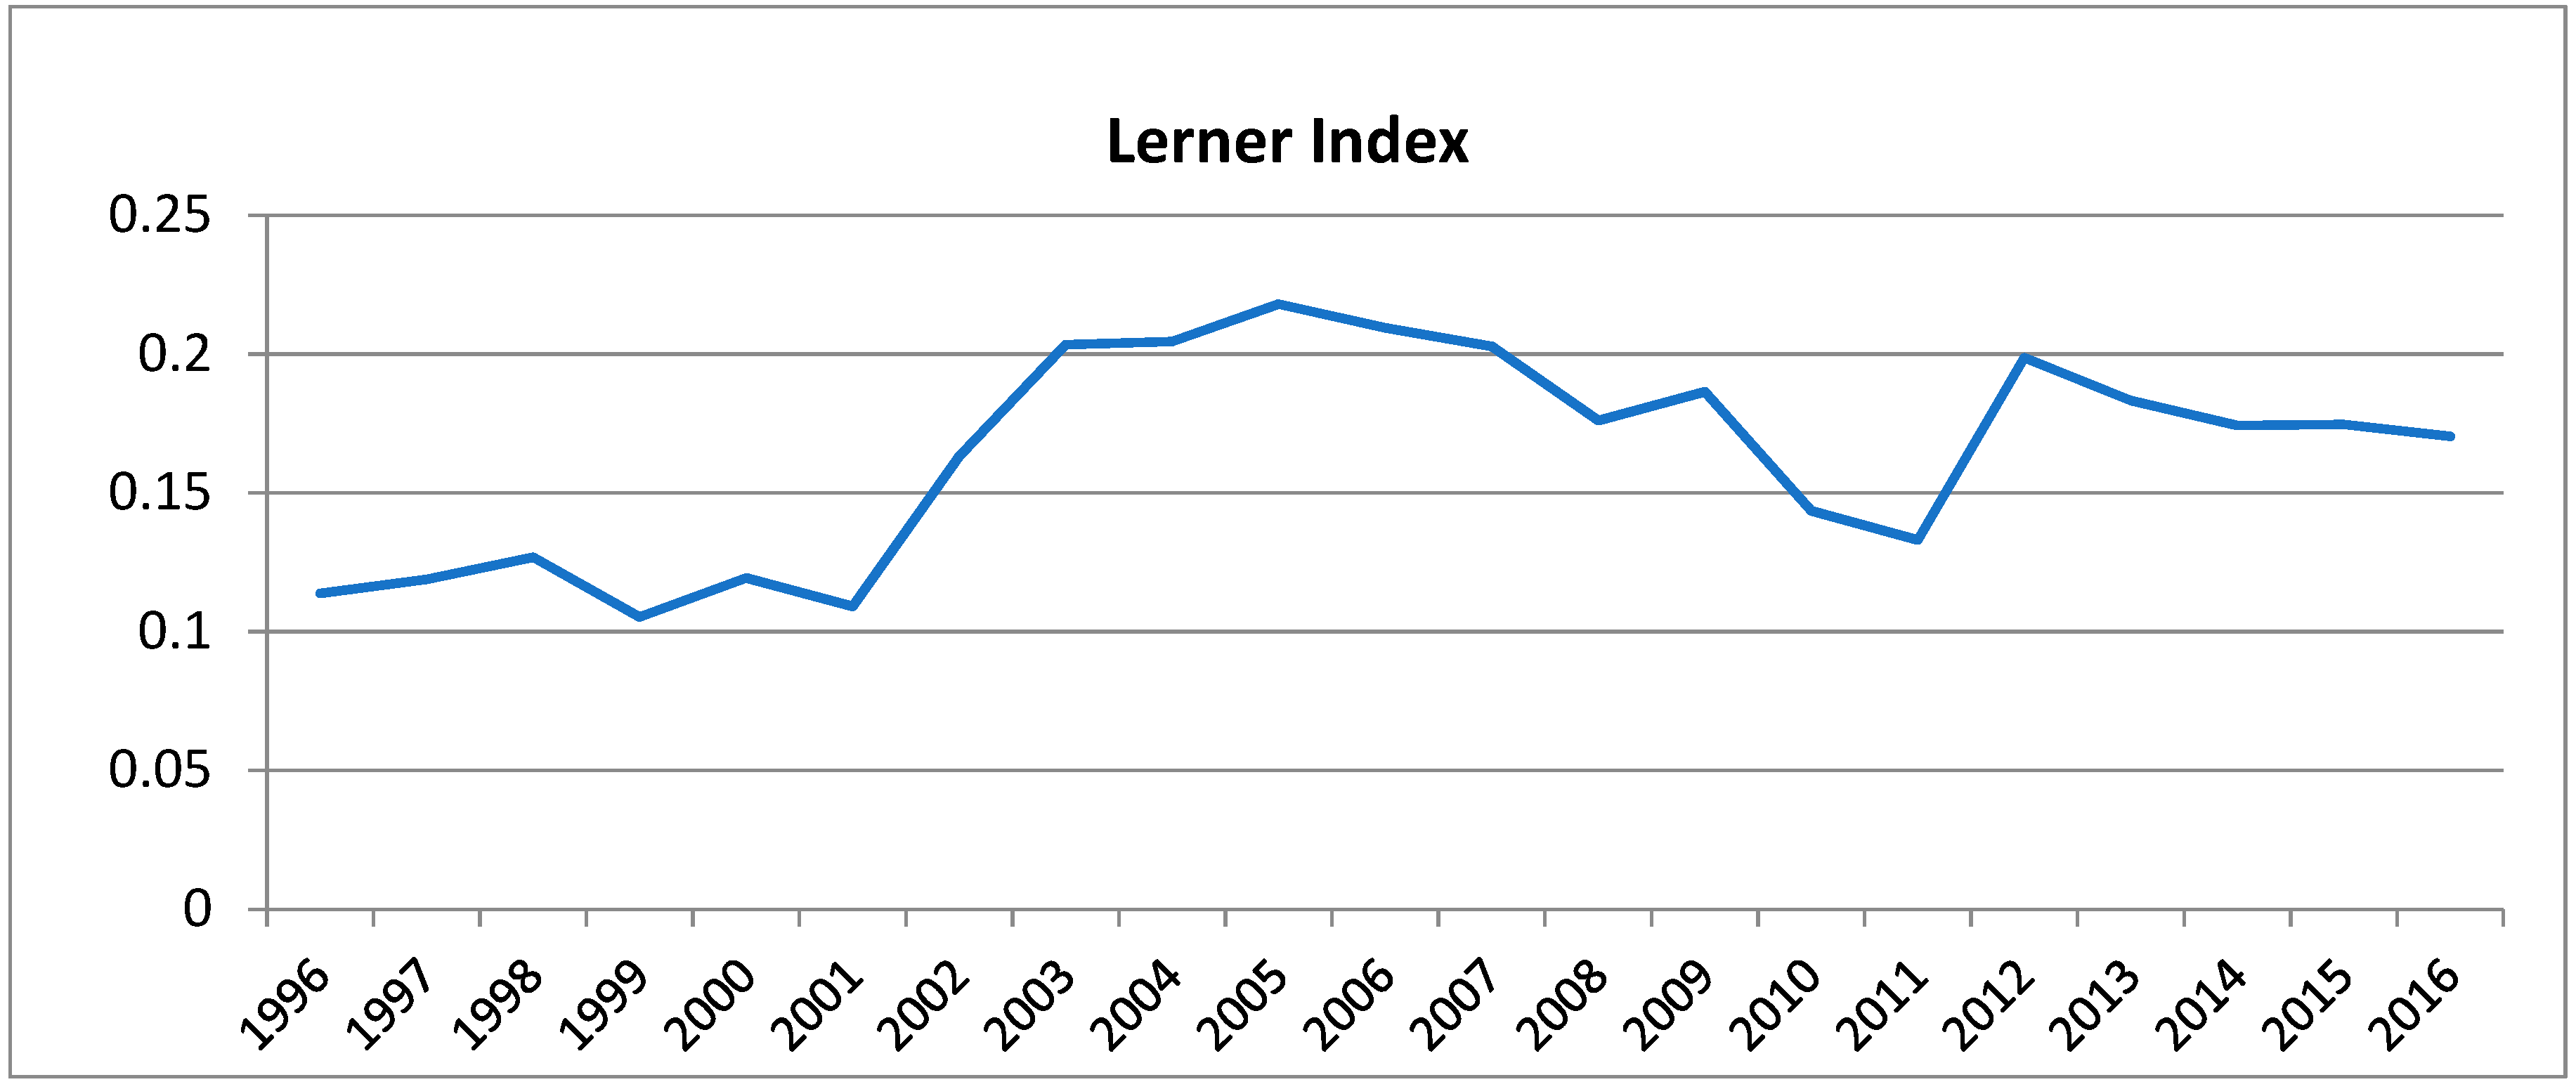
The estimates of the Lerner Index are given in Table 4. Lerner Index averages around 11% during the period 1996 to 2001. There is a steady increase in market power during the reregulation period (2000–2005) with central bank bringing regulations measures. However, the price has been declining steadily over the years from 1996 to 2016. While there was a considerable increase in the Lerner Index during the period of reregulation phase, during the period of post-financial crises, the Lerner index fell indicating the improved competitive levels in the banking sector.
Adjusted Lerner Estimates
It is generally argued that banks rarely factored their risk cost, particularly NPA provision and cost for capital adequacy in the pricing process. The study has factored these costs so as to come at a new adjusted cost basis. To factor in the same, NPA provision amount has been added to the operating cost of each bank. Similarly, the cost of capital adequacy is added to the fund cost, and the trans-log cost function is estimated again.
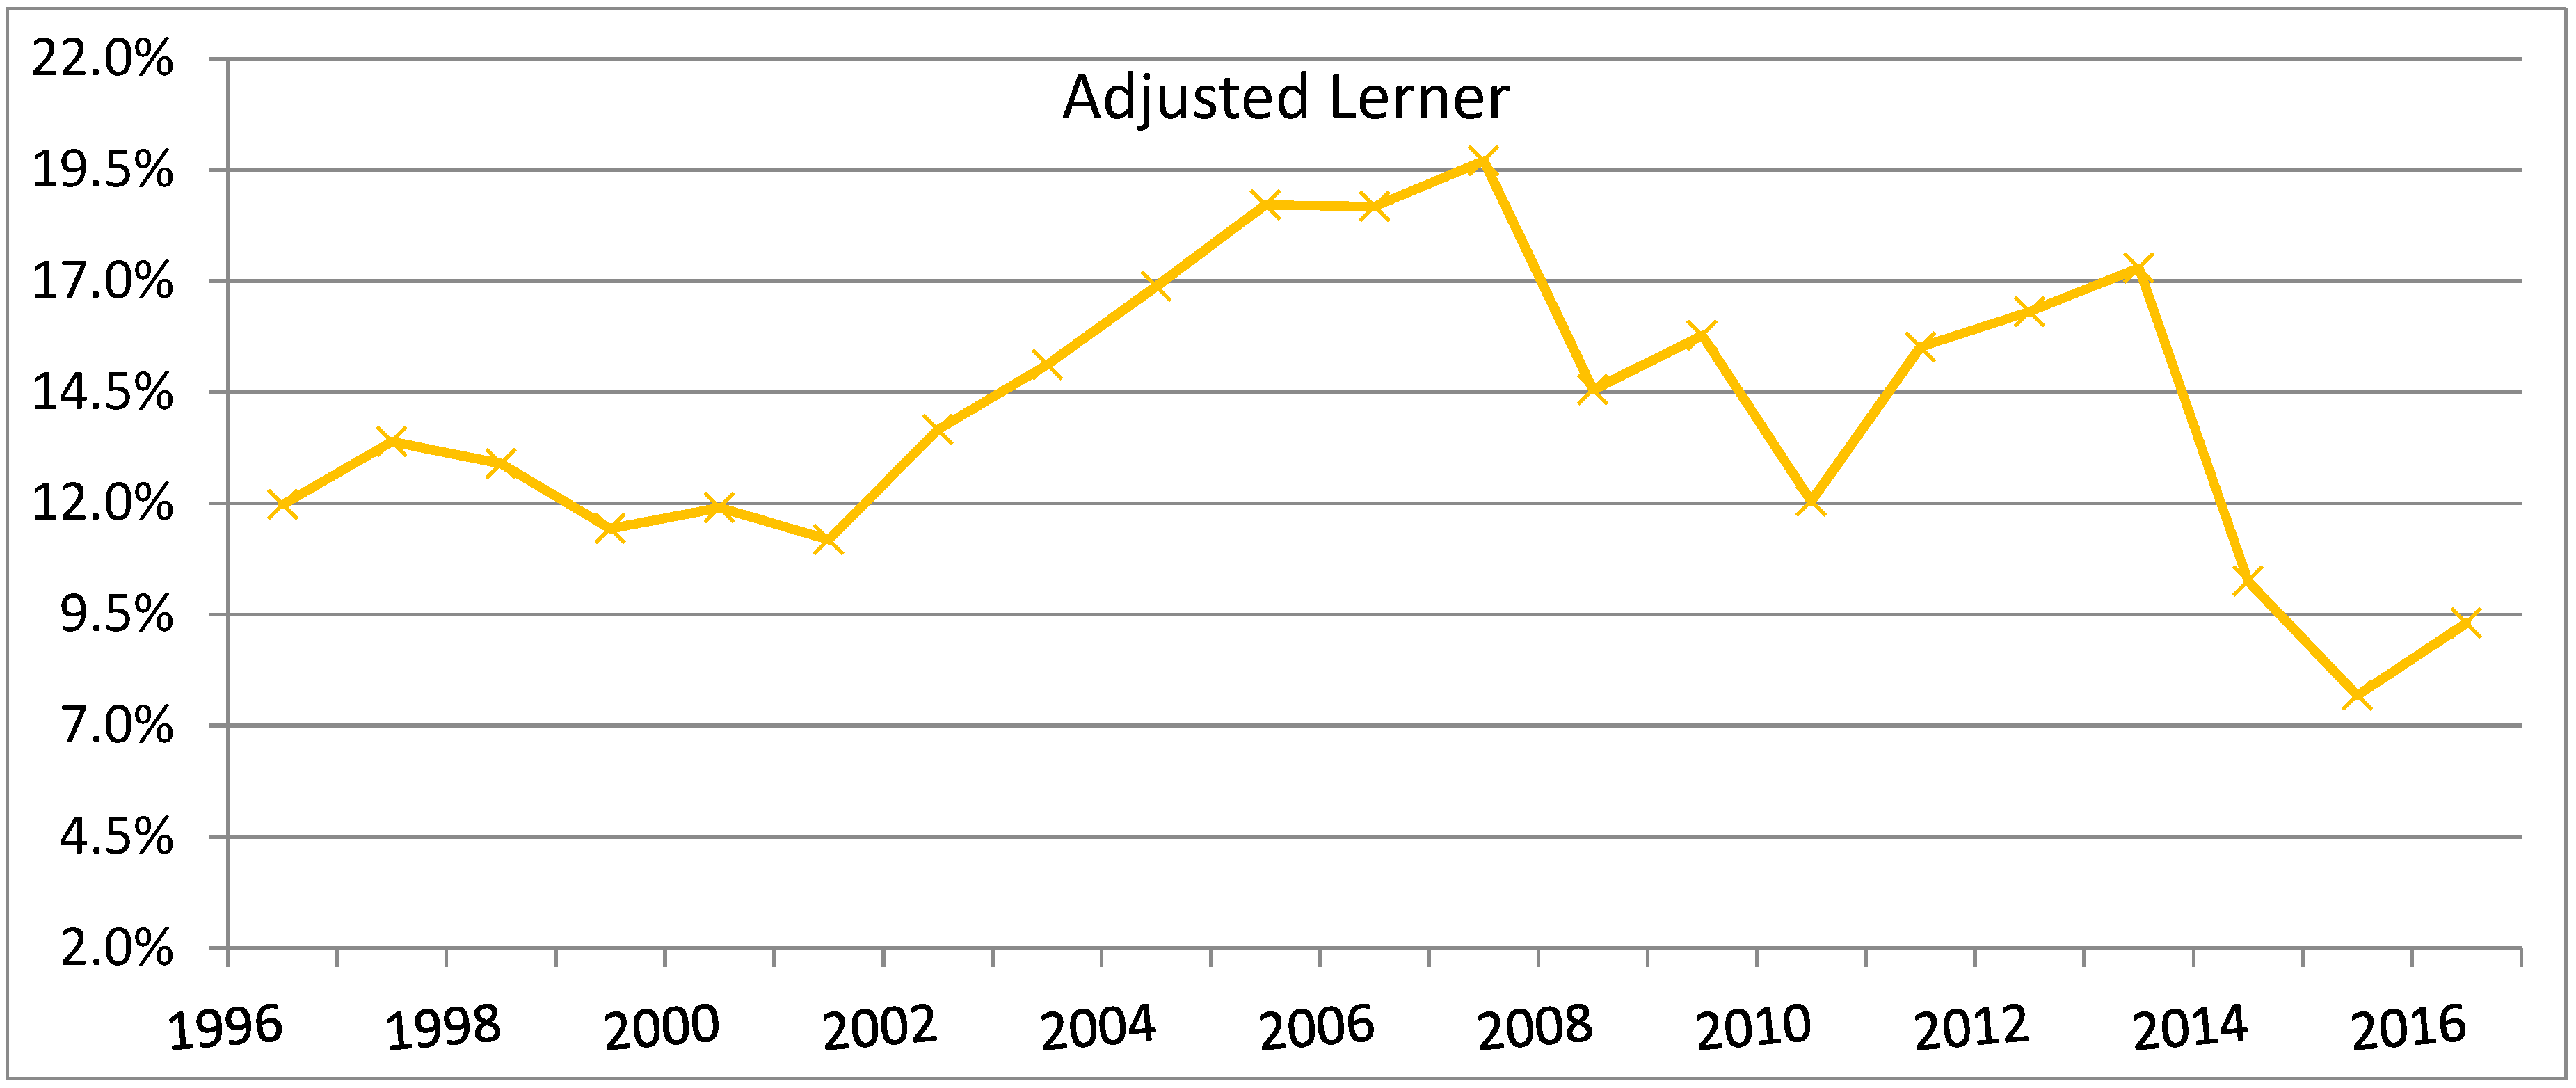
Table 5 presents the panel diagnostics for adjusted Lerner estimates and are consistent for fixed effects. The results of the Lerner estimation are presented above in Table 6 and Table 7. We can see that the Lerner index presented in Figure 2 is, in general, higher than the adjusted Lerner index, which shows that adjusting for risk leads to considerable adjustment in the levels of Lerner index. Adjusted Lerner Index, presented in Figure 3, has declined from 11.97% in 1996 to 9.30% in 2016. After 2001, the index increased to 19.70% in 2007 followed by a decline to 15.51% in 2011. However, the marginal cost, adjusted for NPA and capital adequacy cost, has been declining steadily over the years from 1996 to 2016. Adjusting for risk, maximum market power is exerted the 2008 financial crises. Risk adjustment leads to higher mark-up during this period compared to other periods.
The study shows higher competition during the period of liberalization (1996–1999) followed by an increase in market power during the phase of consolidation and reregulation (2000–2005). The later phase witnessed a revival of competitive conditions post the 2008 financial crises. Despite reforms in the Indian banking industry, banks in India, on an average, are exercising market power ranging between 10% and 15%.
6. Conclusions and Policy Implications
In this study, we examine the degree of market power in the Indian banking sector post the financial sector reforms. In recent years, while an increasing number of articles have investigated competition in the banking industry (majorly in developed markets), empirical assessment of the same is sparse in emerging markets like India thereby raising a valid question on the level of competition and efficiency of the Indian banking sector. Consequently, this study contributes in filling a critical gap in the literature by providing regulators and policymakers in India with new evidence on the link between competition and efficiency in the Indian banking system using a novel theoretical measure of risk-adjusted Lerner Index. The traditional Lerner Index based measure fails to account for the risk, particularly NPA (Non-Performing Assets) provision and cost for capital adequacy in the pricing process. In effect, the traditional Lerner Index tends to overstate the market power exerted (or understate the degree of competition) in the Indian banking system on account of unadjusted risk.
Our study first applies the traditional Lerner Index for assessing the degree of competition in the Indian banking system. However, looking at the drawback of the Lerner Index, a risk-adjusted Lerner Index has been designed to look at the competitive structure in the Indian banking sector. The findings of our study document that the market power estimated through the adjusted Lerner Index has been continuously declining, particularly post-2008, which indicates an improvement in competitive condition for the overall period. Furthermore, as indicated by the risk-adjusted Lerner Index, the Indian banking system exerts much less market power contrary to what is suggested by the traditional Lerner index. This has implications for regulators and policymakers as there may be a plausible underestimation of the degree of competition prevailing in the Indian banking system, if looked through the lens of traditional Lerner Index. In effect, the prevailing market dynamics and reforms undertaken by the regulator over the years have successfully increased the competitive rivalry in the Indian banking system.
Author Contributions
Conceptualization: R.A. and A.M.; Methodology: R.A.; Validation: V.D. and R.A.; Formal Analysis: R.A.; Investigation: R.A. and V.D.; Resources: A.M.; Data Curation: R.A.; Writing—Original Draft Preparation: R.A. and A.M.; Writing—Review & Editing: D.M. and V.D.; Visualization: D.M. and R.A.
Funding
This research received no external funding.
Conflicts of Interest
The authors declare no conflict of interest.
References
- Anzoategui, Diego, Maria Soledad Martinez Peria, and Martin Melecky. 2010. Banking Sector Competition in Russia. Working Paper WPS5449. Washington, DC, USA: The World Bank, October. [Google Scholar]
- Ariss, Rima Turk. 2010. Competitive conditions in Islamic and conventional banking: A global perspective. Review of Financial Economics 19: 101–8. [Google Scholar] [CrossRef]
- Baumol, William J., John C. Panzar, and Robert D. Willig. 1982. Contestable Markets and the Theory of Industry Structure. New York: Harcourt Brace Jovanovich. [Google Scholar]
- Bhattacharya, Kaushik, and Abhiman Das. 2003. Dynamics of Market Structure and Competitiveness of the Banking Sector in India and its Impact on Output and Prices of Banking Services. Working Paper, Reserve Bank of India Occasional Papers 24: 123–59. [Google Scholar]
- Bikker, Jacob A. 2004. Competition and Efficiency in a Unified European Banking Market. Cheltenham: Edward Elgar. [Google Scholar]
- Bikker, Jacob A., and Katharina Haaf. 2002. Competition, Concentration and their Relationship: An Empirical Analysis of Banking Industry. Journal of Money, Credit and Banking 35: 2191–214. [Google Scholar] [CrossRef]
- Bresnahan, Timothy F. 1982. The Oligopoly Solution Concept Identified. Economic Letters 10: 87–92. [Google Scholar] [CrossRef]
- Carbó, Santiago, David Humphrey, Joaquin Maudos, and Philip Molyneux. 2009. Cross-country comparisons of competition and pricing power in European banking. Journal of International Money and Finance 28: 115–34. [Google Scholar] [CrossRef]
- Claessens, Stijn, and Luc Laeven. 2004. What drives bank competition? Some international evidence. Journal of Money, Credit and Banking 36: 563–83. [Google Scholar] [CrossRef]
- Das, Abhiman, and Saibal Ghosh. 2006. Financial deregulation and efficiency: An empirical analysis of Indian banks during the post reform period. Review of Financial Economics 15: 193–221. [Google Scholar] [CrossRef]
- Fernandez de Guevara, Juan, Joaquin Maudos, and Francisco Perez. 2005. Market Power in European Banking Sectors. Journal of Financial Services Research 27: 109–37. [Google Scholar] [CrossRef]
- Hamza, H., and S. Kachtouli. 2014. Competitive conditions and market power of Islamic and conventional commercial banks. Journal of Islamic Accounting and Business Research 5: 29–46. [Google Scholar] [CrossRef]
- Jeon, Bang Nam, María Pía Olivero, and Ji Wu. 2011. Do foreign banks increase competition? Evidence from emerging Asian and Latin American banking markets. Journal of Banking and Finance 35: 856–75. [Google Scholar] [CrossRef]
- Lau, Lawrence J. 1982. On Identifying the Degree of Competitiveness from Industry Price and Output Date. Economic Letters 10: 93–99. [Google Scholar] [CrossRef]
- Lerner, Abba. 1934. The Concept of Monopoly and the Measurement of Monopoly Power. The Review of Economic Studies 1: 157–75. [Google Scholar] [CrossRef]
- Maheshwari, Aditya, and Andrey Sarantsev. 2018. Modeling Financial System with Interbank Flows, Borrowing, and Investing. Risks 6: 131. [Google Scholar] [CrossRef]
- Maudos, Joaquin, and Juan Fernandez de Guevara. 2007. The cost of market power in banking: Social welfare loss vs. cost inefficiency. Journal of Banking & Finance 31: 2103–25. [Google Scholar]
- Maudos, Joaquín, and Liliana Solís. 2011. Deregulation, liberalization and consolidation of the Mexican Banking system: Effects on competition. Journal of International Money and Finance 30: 337–53. [Google Scholar] [CrossRef]
- Mirzaei, Ali. 2019. Market power among UAE banks: The 2008 financial crisis and its impact. The Quarterly Review of Economics and Finance 71: 56–66. [Google Scholar] [CrossRef]
- Olivero, María Pía, Yuan Li, and Bang Nam Jeon. 2010. Competition in Banking and the lending channel: Evidence from bank-level data in Asia and Latin American. Journal of Banking and Finance 35: 560–71. [Google Scholar] [CrossRef]
- Panzar, John C., and James N. Rosse. 1987. Testing for Monopoly Equilibrium. Journal of Industrial Economics 25: 443–56. [Google Scholar] [CrossRef]
- Park, Kang H. 2009. Has bank consolidation in Korea lessened competition? The Quarterly Review of Economics and Finance 49: 651–67. [Google Scholar] [CrossRef]
- Rezitis, Anthony N. 2010. Evaluating the State of Competition of Greek Banking Industry. Journal of International Financial Markets, Institutions and Money 20: 68–90. [Google Scholar] [CrossRef]
- Roland, Christian. 2008. Banking Sector Liberalization in India: Evaluation of Reforms and Comparative Perspectives on China. Heidelberg: Physica-Verlag Heidelberg. [Google Scholar]
- Saha, Asish, and T. S. Ravisankar. 2000. Rating of Indian Commercial Banks: A DEA Approach. European Journal of Operations and Research 124: 187–203. [Google Scholar] [CrossRef]
- Sathye, Milind. 2003. Efficiency of Banks in a Developing Economy: The Case of India. European Journal of Operations and Research 148: 662–71. [Google Scholar] [CrossRef]
- Shaffer, Sherrill. 1989. Competition in the U.S. Banking Industry. Economic Letters 29: 321–23. [Google Scholar] [CrossRef]
- Spierdijka, Laura, and Michalis Zaourasa. 2018. Measuring banks’ market power in the presence of economies of scale: A scale-corrected Lerner index. Journal of Banking & Finance 87: 40–48. [Google Scholar]
- Varma, Satish, and Rohit Saini. 2011. Impact of Bank Size on Conduct of Commercial Banks in India. Paper presented at Conference on Money and Finance in the Indian Economy, Mumbai, India, February 25–26; Available online: http://www.igidr.ac.in/money/mfc-12/Impact%20of%20bank%20size_satish%20verma_rohit.pdf (accessed on 15 April 2017).
- Zhao, Tianshu, Barbara Casu, and Alessandra Ferrari. 2010. The impact of regulatory reforms on cost structure, ownership and competition in Indian banking. Journal of Banking & Finance 34: 246–54. [Google Scholar]
Figure 1.
Net Interest Margin for Banks; Source: Reserve Bank of India.

Figure 2.
Lerner Index for the Period 1996–2016.

Figure 3.
Adjusted Lerner Index for the Period 1996–2016.


Table 1.
Descriptive Statistics.
| Variable | lnCi | lnw1 | lnw2 | lnw3 | lnq | Price |
|---|---|---|---|---|---|---|
| Mean | 7.11 | −4.273 | −2.779 | −4.859 | 10.012 | 0.084 |
| Median | 7.36 | −4.197 | −2.174 | −4.943 | 9.995 | 0.080 |
| Minimum | 1.38 | −6.562 | −3.954 | −5.524 | 6.122 | 0.016 |
| Maximum | 11.18 | −3.442 | −2.242 | −3.47 | 13.779 | 0.768 |
| Standard Deviation | 1.77 | 0.455 | 0.244 | 0.3914 | 1.190 | 0.0461 |
| Coefficient of Variation | 0.249 | 0.106 | 0.088 | 0.081 | 0.118 | 0.545 |
| Skewness | −0.721 | −1.05 | −0.794 | 1.639 | 0.008 | 11.151 |
| Ex. Kurtosis | 0.623 | 2.19 | 0.863 | 2.623 | 0.351 | 150.45 |
Table 2.
Panel Diagnostic Tests for Lerner Estimates. Panel Period: 1994–2016.
| Null Hypothesis | Test Statistic | Accepted/Rejected |
|---|---|---|
| Breusch Pagan Test | LM = 22.31 p-value [chi-square(1) > 22.31] = 2.3e−6 | Rejected |
| Hausman Test | H = −54.01 with p-value = prob [chi-square(15) > 54.01] = 1.03e−6 | Rejected |
Table 3.
Lerner Cost Function Estimate Fixed Effect with 1081 Observations. Dependent Variable: Ln_Cost. R-sq: 0.9923, F(16, 1018) = 3603.24, corr(u_i, Xb) = −0.3421, Prob > F = 0.0000.
Table 3.
Lerner Cost Function Estimate Fixed Effect with 1081 Observations. Dependent Variable: Ln_Cost. R-sq: 0.9923, F(16, 1018) = 3603.24, corr(u_i, Xb) = −0.3421, Prob > F = 0.0000.
| Ln_Cost | Coef. | Std. Err. | t | P > |t| |
|---|---|---|---|---|
| s0 | 1.040556 | 0.0467663 | 22.25 | 0.000 |
| s1 | 0.003285 | 0.0035503 | 0.93 | 0.355 |
| c1 | 0.2917555 | 0.1232543 | 2.37 | 0.018 |
| c2 | 0.4761976 | 0.129985 | 3.66 | 0.000 |
| c3 | 1.892738 | 0.2059796 | 9.19 | 0.000 |
| s2 | 0.0145117 | 0.0071255 | 2.04 | 0.042 |
| s3 | −.0341892 | 0.0077822 | −4.39 | 0.000 |
| s4 | 0.0132786 | 0.0116099 | 1.14 | 0.253 |
| c4 | −.216361 | 0.0194822 | −11.11 | 0.000 |
| c5 | 0.0797388 | 0.0261179 | 3.05 | 0.002 |
| c6 | 0.0123539 | 0.029548 | 0.42 | 0.676 |
| c7 | 0.0563359 | 0.0154541 | 3.65 | 0.000 |
| c8 | 0.089171 | 0.0050249 | 17.75 | 0.000 |
| c9 | 0.1517861 | 0.0291339 | 5.21 | 0.000 |
| c14 | −1.168254 | 0.5419256 | −2.16 | 0.031 |
| c15 | 0.0002897 | 0.0001351 | 2.14 | 0.032 |
| _cons | 1181.941 | 543.5089 | 2.17 | 0.030 |
F test that all u_i = 0: F(46, 1018) = 4.85; Prob > F = 0.0000.
Table 4.
Lerner Index: 1996–2016.
| Year | Price | MC | Lerner |
|---|---|---|---|
| 1996 | 10.79% | 9.56% | 11.38% |
| 1997 | 11.21% | 9.88% | 11.89% |
| 1998 | 10.64% | 9.29% | 12.68% |
| 1999 | 10.43% | 9.33% | 10.53% |
| 2000 | 10.30% | 9.07% | 11.93% |
| 2001 | 10.12% | 9.02% | 10.91% |
| 2002 | 9.72% | 8.13% | 16.32% |
| 2003 | 10.12% | 8.06% | 20.34% |
| 2004 | 9.34% | 6.99% | 20.45% |
| 2005 | 8.26% | 6.33% | 21.80% |
| 2006 | 7.92% | 6.26% | 20.95% |
| 2007 | 7.98% | 6.37% | 20.27% |
| 2008 | 8.53% | 7.03% | 17.60% |
| 2009 | 8.82% | 7.17% | 18.64% |
| 2010 | 8.37% | 7.96% | 14.35% |
| 2011 | 8.10% | 7.88% | 13.30% |
| 2012 | 8.62% | 6.91% | 19.87% |
| 2013 | 8.92% | 7.29% | 18.33% |
| 2014 | 8.75% | 7.22% | 17.43% |
| 2015 | 8.64% | 7.13% | 17.46% |
| 2016 | 8.92% | 7.40% | 17.03% |
Table 5.
Panel Diagnostic Tests for Adjusted Lerner Estimates. Panel Period: 1996–2016.
| Null Hypothesis | Test Statistic | Accepted/Rejected |
|---|---|---|
| Breusch Pagan Test | LM = 116.10 p-value [chi-square(1) > 116] = 4.5e−27 | Rejected |
| Hausman Test | H = 98.15 with p-value = prob [chi-square(6) > 98.15] = 1.08e−14 | Rejected |
Table 6.
Adjusted Lerner Cost Function Estimate Fixed Effect with 848 Observations. Dependent Variable: Ln_Cost. R-sq: 0.9980, F(16, 1018) = 3603.24, Prob > F = 0.0000.
Table 6.
Adjusted Lerner Cost Function Estimate Fixed Effect with 848 Observations. Dependent Variable: Ln_Cost. R-sq: 0.9980, F(16, 1018) = 3603.24, Prob > F = 0.0000.
| Lncost | Coef. | Std. Err. | t | P > |t| |
|---|---|---|---|---|
| s0 | 0.737 | 0.105 | 7.01 | 0.000 |
| s1 | 0.017 | 0.0104 | 1.66 | 0.095 |
| c1 | 1.242 | 0.219 | 5.66 | 0.000 |
| c2 | 1.052 | 0.278 | 3.78 | 0.000 |
| c3 | 1.72 | 0.177 | 9.73 | 0.000 |
| s2 | −0.016 | 0.102 | −0.16 | 0.872 |
| s3 | −0.026 | 0.012 | −2.091 | 0.036 |
| s4 | 0.022 | 0.012 | 1.92 | 0.055 |
| c4 | 0.064 | 0.0378 | 1.226 | 0.220 |
| c5 | 0.188 | 0.0204 | 9.21 | 0.000 |
| c6 | 0.150 | 0.043 | 3.455 | 0.000 |
| c7 | 0.0521 | 0.015 | 3.438 | 0.000 |
| c8 | 0.089171 | 0.0050249 | −2.05 | 0.041 |
| c9 | 0.105 | 0.019 | 5.32 | 0.000 |
| _cons | 6.6719 | 0.958 | 6.95 | 0.000 |
F test that all u_i = 0: F(52, 1018) = 5.07, Prob > F = 0.0000.
Table 7.
Adjusted Lerner: 1996–2016.
| Year | Price | MC | Lerner |
|---|---|---|---|
| 1996 | 9.33% | 8.21% | 11.97% |
| 1997 | 9.81% | 8.50% | 13.39% |
| 1998 | 9.21% | 8.02% | 12.89% |
| 1999 | 9.13% | 8.09% | 11.43% |
| 2000 | 8.95% | 7.89% | 11.90% |
| 2001 | 8.84% | 7.86% | 11.18% |
| 2002 | 8.24% | 7.11% | 13.66% |
| 2003 | 8.31% | 7.05% | 15.12% |
| 2004 | 7.36% | 6.12% | 16.87% |
| 2005 | 6.78% | 5.51% | 18.71% |
| 2006 | 6.70% | 5.45% | 18.67% |
| 2007 | 6.91% | 5.55% | 19.70% |
| 2008 | 7.19% | 6.15% | 14.56% |
| 2009 | 7.46% | 6.29% | 15.77% |
| 2010 | 7.06% | 6.21% | 12.05% |
| 2011 | 7.01% | 5.93% | 15.51% |
| 2012 | 7.47% | 6.25% | 16.31% |
| 2013 | 7.73% | 6.39% | 17.29% |
| 2014 | 7.58% | 6.80% | 10.25% |
| 2015 | 7.49% | 6.91% | 7.68% |
| 2016 | 7.73% | 7.01% | 9.30% |
© 2019 by the authors. Licensee MDPI, Basel, Switzerland. This article is an open access article distributed under the terms and conditions of the Creative Commons Attribution (CC BY) license (http://creativecommons.org/licenses/by/4.0/).
Share and Cite
MDPI and ACS Style
Arrawatia, R.; Misra, A.; Dawar, V.; Maitra, D. Bank Competition in India: Some New Evidence Using Risk-Adjusted Lerner Index Approach. Risks 2019, 7, 44. https://doi.org/10.3390/risks7020044
AMA Style
Arrawatia R, Misra A, Dawar V, Maitra D. Bank Competition in India: Some New Evidence Using Risk-Adjusted Lerner Index Approach. Risks. 2019; 7(2):44. https://doi.org/10.3390/risks7020044
Chicago/Turabian StyleArrawatia, Rakesh, Arun Misra, Varun Dawar, and Debasish Maitra. 2019. "Bank Competition in India: Some New Evidence Using Risk-Adjusted Lerner Index Approach" Risks 7, no. 2: 44. https://doi.org/10.3390/risks7020044
Note that from the first issue of 2016, this journal uses article numbers instead of page numbers. See further details here.