
The Impact of the Development of Society on Economic and Financial Crime. Case Study for European Union Member States
by
Monica Violeta Achim
1,*, 
Viorela Ligia Văidean
1, 
Sorin Nicolae Borlea
2,3,4 and
Decebal Remus Florescu
5 1
Faculty of Economics and Business Administration, Babeș-Bolyai University, 400591 Cluj-Napoca, Romania
2
Institute of European Research, Babeș-Bolyai University, 400591 Cluj-Napoca, Romania
3
Doctoral School of Economics, University of Oradea, 410087 Oradea, Romania
4
Faculty of Economics, Computer Science and Engineering, Vasile Goldis “Western” University of Arad, 310414 Arad, Romania
5
College of Political, Administrative and Communication Science, Babeș-Bolyai University, 400132 Cluj-Napoca, Romania
*
Author to whom correspondence should be addressed.
Risks 2021, 9(5), 97; https://doi.org/10.3390/risks9050097
Submission received: 19 April 2021
/
Revised: 9 May 2021
/
Accepted: 11 May 2021
/
Published: 18 May 2021
(This article belongs to the Special Issue Economic and Financial Crimes)
Abstract
:Economic and financial crime is closely related to the changes and the development of societies. In this paper, we question whether the types of economic and financial crimes change as the society develops or not. For our purpose, we use the sample of 27 European Union member countries, for the 2005–2020 time period, which forms an unbalanced panel dataset. The main econometric method is represented by the Pooled OLS method for panel data. Our findings highlight that higher economic and sustainable development determines a reduction in the levels of corruption, shadow economy, and cybercrime. Additionally, we find that increased economic and sustainable development is related to higher levels of money laundering. These findings help governments to understand the way in which various types of economic and financial crimes unfold within different contexts of economic development, in order to implement specific policies for reducing the general level of crimes.
1. Introduction
Economic and financial crime is closely related to the changes and the development of societies and it may actually rise in the shape of individuals’ innovation for adapting to the changes in society (Merton 1968; Achim and Borlea 2020, p. 3). In a society that evolves by itself through perpetual changes, the adaptation of individuals to the new socio-economic conditions may be achieved in a differentiated manner. Economic development and economic crises that trigger major social changes stimulate criminals as well, through the reflux effects created by legislation breaks and the time elapsed until new laws are promulgated. Thus, business people are able to invent different forms of white-collar crimes, such as tax evasion, money laundering, and other types of fraud, while poor people may engage in illegal activities, such as prostitution, gambling, and drugs (Aniţei and Lazăr 2016, pp. 17–18).
According to Durkheim (1974), a well-known sociologist, “crime is part of society just as natural as birth and death, and a society without crime would be over-controlled pathologically”, so that “theoretically, crime could disappear completely only if all society members would have the same values, but such a standardization is neither possible nor desirable” (cited by Amza 2002, p. 420).
The study of Achim et al. (2018b) points out the main differences between developed and emerging countries and highlights the specific patterns of developing countries which are commonly recognized to alter the major drivers of the economy. Thus, the privatization process, the law framework, public influence, or export orientation represent factors that create specific conditions in which the very same factors produce different effects than within developed countries (Earnhart and Lizal 2007). The level of compliance with rules is also related to the level of society’s development, while research findings highlight the fact that a higher level of development generates a higher level of compliance to the rules and therefore a better capacity of paying and collecting taxes (Torgler 2004; Torgler et al. 2010). Thus, the shadow economy and tax noncompliance could represent potential expressions of the people’s discontent regarding the provision of public goods and insurance of welfare by the state, according to Brosio et al. (2002).
Based on the aforementioned facts, we focus our research on the following research question: What is the impact of development upon crime? There are enough reasons to investigate if there is an impact of economic and sustainable development upon economic and financial crime or not. In addition, we question whether the types of economic and financial crimes change as the society develops. The goal of our paper is to estimate the effect of development upon economic and financial crime typologies. For our purpose, we use the sample of 27 European Union countries, for the 2005–2020 period, which forms an unbalanced panel dataset. The main econometric method is represented by the Pooled OLS method for panel data. Our results are robust, and our findings highlight that higher economic and sustainable development determines a reduction in the level of corruption, shadow economy, and cybercrime. In addition, we find that a higher level of economic and sustainable development is related to higher levels of money laundering. Our paper is important because it comes with accurate estimations and strong results that provide the effects of economic and sustainable prosperity upon European corruption, shadow economy, money laundering, and cybercrime phenomena.
The remainder of this research paper is organized as follows: the next section contains a detailed literature review on the main determinants of economic and financial crimes, with an emphasis on the role played by economic and sustainable development upon crimes. Section 3 describes the methodology and data, while Section 4 contains our main results. Section 5 briefly discusses our estimations, interpreting their drawbacks. Section 6 concludes our study.
2. Literature Review
The results validated by the specialized literature on the influence exerted by economic and social development on the propensity of economic and financial crimes may be grouped into two main categories.
As such, the first and the largest category of studies (Husted 1999; Treisman 2000; Paldam 2001, 2002; Kirchler 2007; De Rosa et al. 2010; Achim et al. 2018a, 2018b; PricewaterhouseCoopers 2018; Mauro 1995; Gundlach and Paldam 2009; Elgin and Erturk 2019) validates an indirect relation between economic and social development on the one hand and the volume of corruption and shadow economy on the other. The explanation for these results resides in the fact that an increased living standard may lead to improved compliance with the laws. Therefore, the incentives to pay bribes are decreased and underground phenomena are diminished. In contrast, corruption crimes, shadow economy, and cybercrime emerge as a result of low standards of living, low financial and cyber education, and low cybersecurity, which significantly characterizes emerging countries (Achim et al. 2021b).
Regarding the shadow economy, various studies (Chelliah 1971; Torgler 2004; Torgler et al. 2010; Husted 1999; Treisman 2000; Paldam 2001, 2002; Kirchler 2007; De Rosa et al. 2010; Achim et al. 2018b) show that the most increased rates of illegal economic transactions are found in developing and transition countries, while developed states have decreased levels of corruption and shadow economy. In this view, the study conducted by PricewaterhouseCoopers (2018) found a tight link between the economic prosperity of a state and the occurrence of fraud: for developing countries, 15% of the analyzed financial companies expect an important increase of the invested resources for fraud detection over the next two years, compared to only 9% of the companies from developed countries. The study of Mussurov et al. (2019) found that the informal economy characterizes many transition countries belonging to the Eastern part of Europe and to the Central part of Asia. For these countries, they found a percentage that ranges between 20 and 60% of employment to consist of informal jobs.
The mentioned findings confirm that higher levels of economic development of countries generate an improved capacity for tax payments and a higher demand for public goods and services (Chelliah 1971; Torgler 2004; Torgler et al. 2010). For example, Torgler (2004) validates a strong relationship between financial satisfaction and tax payments: households already facing financial difficulties on a daily basis would find it difficult to cover the payment of taxes as well, further inclining towards shadow economy activities.
Furthermore, considering the results obtained by Schneider and his collaborators through several studies (Alm et al. 2004; Schneider and Klinglmair 2004), the largest levels of illegal economic acts are found in developing and transition countries. In Africa and South America, 41% of all economic activities are estimated to be illicit ones. In Europe, for the transition economies, the shadow economy is estimated at 38% of all economic activities. The countries with the lowest levels of shadow economy are Switzerland, USA, and Austria, while Bolivia and Georgia lead with over 66% illicit activities (Kirchler 2007). These findings are also supported by the study by Orviska and Hudson (2003), which state that tax fraud would represent 20% of total income in developed countries, and that percentage is actually larger in developing countries. Similar results are obtained even for the particular case of a country that registers variable development levels by regional areas. Thus, Brosio et al. (2002) investigate tax fraud in different regions of Italy and found that in the poorer areas from the South of Italy, tax fraud is much more developed than in the richer areas from its North. The authors explain that shadow economy engagements and fiscal non-compliance are potential expressions of the population’s discontent with the provision of public goods and welfare on behalf of the government.
In a study on the European Union countries throughout 2007–2013, Achim et al. (2018b) validate the hypothesis that the richer a state is, the less its citizens tend to engage in shadow phenomena. The results are differentiated on samples of old (EU-15) and new European Union member states (EU-13), the regression coefficient of per capita GDP being the highest for the EU-13 sampled member states. This means that the increase of economic development for newly EU joined countries has a great impact upon the downsizing of the shadow economy (although this result is not statistically significant). Later, Achim et al. (2021c) in a study conducted on 182 countries for the 2012–2017 time span, found a negative impact of economic development measured as per capita GDP on an aggregated crime rate for worldwide countries obtained by condensing the main elements of financial and economic crime. A similar paper by Achim et al. (2021a), using data for 185 states over a four-year time period, found that on average, the volume of the economic and financial crime in developing countries is about twice as much as that of developed countries.
Analyzing the relationship between economic development and corruption the studies of Mauro (1995); Treisman (2000); Paldam (2001, 2002); Gundlach and Paldam (2009); De Rosa et al. (2010); and Achim et al. (2018a) prove that low-income countries face the highest levels of corruption. Increased economic development may lead towards a better compliance with the laws, while lower development levels may create opportunities for corruption, as an expression of the population’s disagreement towards the provision of public goods and state ensured welfare. Husted (1999) argues that “because the development level is related to the general level of wealthy resources, it is expected for the corruption phenomenon to be much more common within less developed economies.” In addition, this study sustains that phenomena such as financial satisfaction, tax payments, and corruption are strongly correlated. Similarly, Torgler (2004) concludes that “if a household’s financial situation is flawed, tax payments might be seen as another narrowing of their financial possibilities, which might further reduce their fiscal honesty.” Therefore, paying bribes in order to avoid taxes is an expected situation.
Similarly, the studies carried out by Treisman (2000) and Paldam (2001, 2002) found that the phenomenon of corruption actually is a poverty-driven phenomenon that contracts itself as the country becomes richer. The study of Goel and Ram (2013) substantiated these findings and demonstrated that transition economies have a higher level of corruption than developed countries. Analyzing bilateral causality between income and corruption, Gundlach and Paldam (2009) validated the long-term causal relationship to manifest itself from income towards corruption, and pointed out that the cross-country peculiarities of corruption in states can be explicated by the cross-country characteristics of income of these states. In this regard, De Rosa et al. (2010) found that there exists a strong 0.81 correlation between economic development measured as GDP and the level of corruption.
More recently, the panel data study conducted by Achim et al. (2018a) on a number of 185 worldwide countries, through an eleven-year analysis period, identified a negative influence of economic development on corruption. This may explain why high-income countries face low levels of corruption. The authors point out that the intensity of the contraction in corruption due to the boost in GDP per capita is higher in low-income and transition countries than in high-income ones. Similar findings belong to Treisman (2000) and Paldam (2001, 2002), whose GDP coefficients from corruption evaluation models are higher for developing countries compared to those of developed countries, concluding that poverty eradication might reduce corruption.
Regarding money laundering crimes, low-income states are much more vulnerable to money laundering offenses because of the flaws of their juridical systems regarding the regulation of processes in the financial sector, privatization, or the creation of the securities’ market (see Kroll (1994) on discussions about Bulgarian money laundering and the existing concerns related to the assets’ misplacement through privatized formerly state-owned companies, as Bulgaria evolved towards a market economy). Such economic changes that took place in the former Eastern European communist states created opportunities for unscrupulous individuals to launder money because of the weak regulations for money laundering detection, investigation, and monitoring tools (Schroeder 2001). Indeed, throughout the privatization processes of most emerging markets, the involvement in money laundering offenses had increased dramatically (Schroeder 2001).
Emerging economies also provide evidence for increased cross-border cash transfers towards markets with cash detection and traceability and flagged real estate and business investments of organized crime groups. Thus, considering the transformations undergone by emerging countries throughout their transition periods towards a market economy, the negative effects of money laundering tend to be more pronounced here compared to the situation of developed countries (McDowell 2001).
On the other hand, there is a second group of research findings (Caselli and Michaels (2013) and Achim et al. (2021b), not so numerous as compared to the number of papers belonging to the first group) that supports a direct influence of economic and social development on the volume of economic and financial crime. Basically, these studies support the fact that an increased level of economic and financial development leads to increases in economic and financial crimes. Thus, Caselli and Michaels (2013) found a positive association between economic development and corruption, explaining this correlation through the idea that a high level of wealth could lead to increased opportunities to extract benefits, thus increasing the level of corruption. In the same view, the study of Achim et al. (2021b) conducted on 27 European Union countries, for the 2005–2020 time interval, analyzes the impact of different components of economic and financial crime on economic and sustainable development. They found a positive correlation between money laundering and the economic and sustainable development proxies. In other words, their study proves that money laundering crimes are committed in the context of a highly evolved and technological economy, by individuals with top levels of education and specialization. In the same view, the studies of Ali et al. (2019); Gogolin (2010); McAfee (2018); and Ryman-Tubb et al. (2018) found a positive relationship between high technology economies and the size of the economic and financial crime in terms of cybercrime.
Thus, the boost in information technologies has created a new set of people fond of cyber attacks, the so-called hackers (Achim and Borlea 2020, p. 7). PricewaterhouseCoopers (2018) show that cybercrimes are the third most important type of fraud reported worldwide and these enhance the high concerns of managers regarding this domain. According to the study of McAfee (2018), the cost of global cybercrime went up to $608 billion in 2017 compared to only $445 billion in 2014, as a result of adopting new technologies. According to Nilson Report (2020) in 2021, under the pandemic context of COVID-19, the volume of card losses is projected to be $44,829 trillion, up to 6.12% higher as compared to the previous year. For the final year of 2028, the projection is not optimistic at all, with the value of card fraud losses being projected at $66.188 trillion. Thus, during the 2015–2028 period, the volume of card fraud losses is basically projected to double. Further on, these huge amounts of money are used to finance crimes such as terrorism and the weapon and drug industries (Ryman-Tubb et al. 2018). Thus, the term digital shadow economy, referring to the illegal activities operating in the digital space, has emerged in the literature in the context of society’s development towards a high level of digital economy (Remeikiene et al. 2018).
Based on the above documented ideas, we set our research hypotheses as follows:
Hypothesis 1.
An increase of economic and sustainable development leads to a decrease in corruption.
Hypothesis 2.
An increase of economic and sustainable development leads to a decrease in shadow economy.
Hypothesis 3.
An increase of economic and sustainable development leads to a decrease in money laundering.
Hypothesis 4.
An increase of economic and sustainable development leads to a decrease in cybercrime.
3. Methodology and Data
3.1. Measuring the Variables
3.1.1. Dependent Variables (Economic and Financial Crime)
We considered the most important components of economic and financial crime to be corruption, shadow economy, money laundering, and cybercrime. The presentation of these crimes is realized as follows:
- (a)
- The Corruption proxy comes from the latest report on the Corruption Perceptions Index (CPI) provided by Transparency International (2020). Subjectively perceived levels of corruption in the public sector of worldwide countries are reflected through this index, on a range from 0 (the most corrupt) to 100 (no corruption). This study particularly deals with countries’ CPI rankings, scaled from the bottom level of corruption to the very top.
- (b)
- In order to define shadow economy, we used the narrow definition provided by Schneider and his contributors (Medina and Schneider 2019; Schneider et al. 2010; Schneider and Buehn 2018). According to these researchers, “The shadow economy includes all market-based legal production of goods and services that are deliberately concealed from public authorities for the following: a. to avoid paying income, value added, or other taxes; b. to avoid paying social security contributions; c. to avoid having to meet certain legal labour market standards, such as minimum wages, maximum working hours, and safety standards, and d. to avoid complying with certain administrative procedures, such as completing statistical questionnaires or other administrative forms”. We rely on this narrow definition of the shadow economy and measure it using Medina and Schneider (2019) for the 2005–2017 time interval, in which the shadow economy is estimated as a percentage of official GDPs, for 158 countries, starting from the year 1991.
- (c)
- In order to obtain data on worldwide money laundering, we utilized the Basel AML (Basel Anti-Money Laundering Index), which assesses the risk of money laundering and terrorist financing. This score ranges between 0, which is associated with the lowest risk, to 10, which is associated to the largest risk of money laundering. The Basel AML score is calculated for 141 states from the year 2012 on.
- (d)
- The level of cybercrime is determined with the help of the Cybersecurity index. For this purpose, we used the Global Cybersecurity Index (GCI), belonging to the International Telecommunication Union (2018). This index ranges between 0, meaning the most vulnerable countries in terms of cyber risks (highest level of cybercrime), and 1 for the less vulnerable ones (lowest level of cybercrime). The larger the level of the GCI is, the more reduced the level of cybercrime is.
3.1.2. Measuring the Independent Variables
The independent variable consists of the development of the society, which is measured as economic and social development, separately determined as follows:
- (a)
- For the economic prosperity of a country, we used the Gross Domestic Product representing the market values of all finished goods and services produced by an economy within a certain time frame. At present, GDP has become widely used worldwide (Torgler and Schneider 2007; Medina and Schneider 2019; Hoinaru et al. 2020; World Bank 2020) as an estimator for the development and prosperity level of a nation.
- (b)
- Sustainable development is required by a growing number of studies as an alternative measure of development which is welfare driven (Stiglitz et al. 2010; Aidt 2010; Forson et al. 2017). In our study, we measured sustainable development with the Human Development Index (HDI), which reflects a final criterion for evaluating the development of a country. It is a composite measure provided by UNDP Human Development Reports (2019) and it has been previously used by many authors (Absalyamova et al. 2016; Murshed and Mredula 2018; Hoinaru et al. 2020) as a proxy for sustainable development.
A synthetic presentation of the variables and their proxies is presented in Appendix A.
3.2. Methodology and Data
Our sample consisted of data for the EU-27 member states for a period between 2005 and 2020, subject to availability. A constraint was set by the available data for the shadow economy variable, up to the year 2017 (provided by Medina and Schneider 2019). The money laundering variable also misses some years from the beginning of our analyzed time frame.
Our unbalanced panel data were examined, and in order to check the assumptions of multivariate data analysis, the logarithm data transformations were applied to most variables, except for the money laundering variable. Simple regression modeling was used (Hair et al. 2010) and the Pooled OLS method for panel data was applied for estimating the impact of economic and human development upon the financial and economic crime proxies. Our log-log and linear-log models have the following baseline equation:
where:
Financial and economic crimeit = β0 + β1Developmentit + εit
- Financial and economic crimeit—proxy for the financial and economic crime dimensions of country i in year t (Corruptionit, Shadow Economyit, Money Launderingit, Cybersecurityit);
- β0—intercept;
- β1—linear effect parameter;
- Developmentit—proxy for the development dimensions of country i in year t; it includes:
- GDPit—the per capita current USD gross domestic product of country i in year t and
- HDIit—the human development index of country i in year t;
- —the residual.
4. Results
4.1. Descriptive Statistics
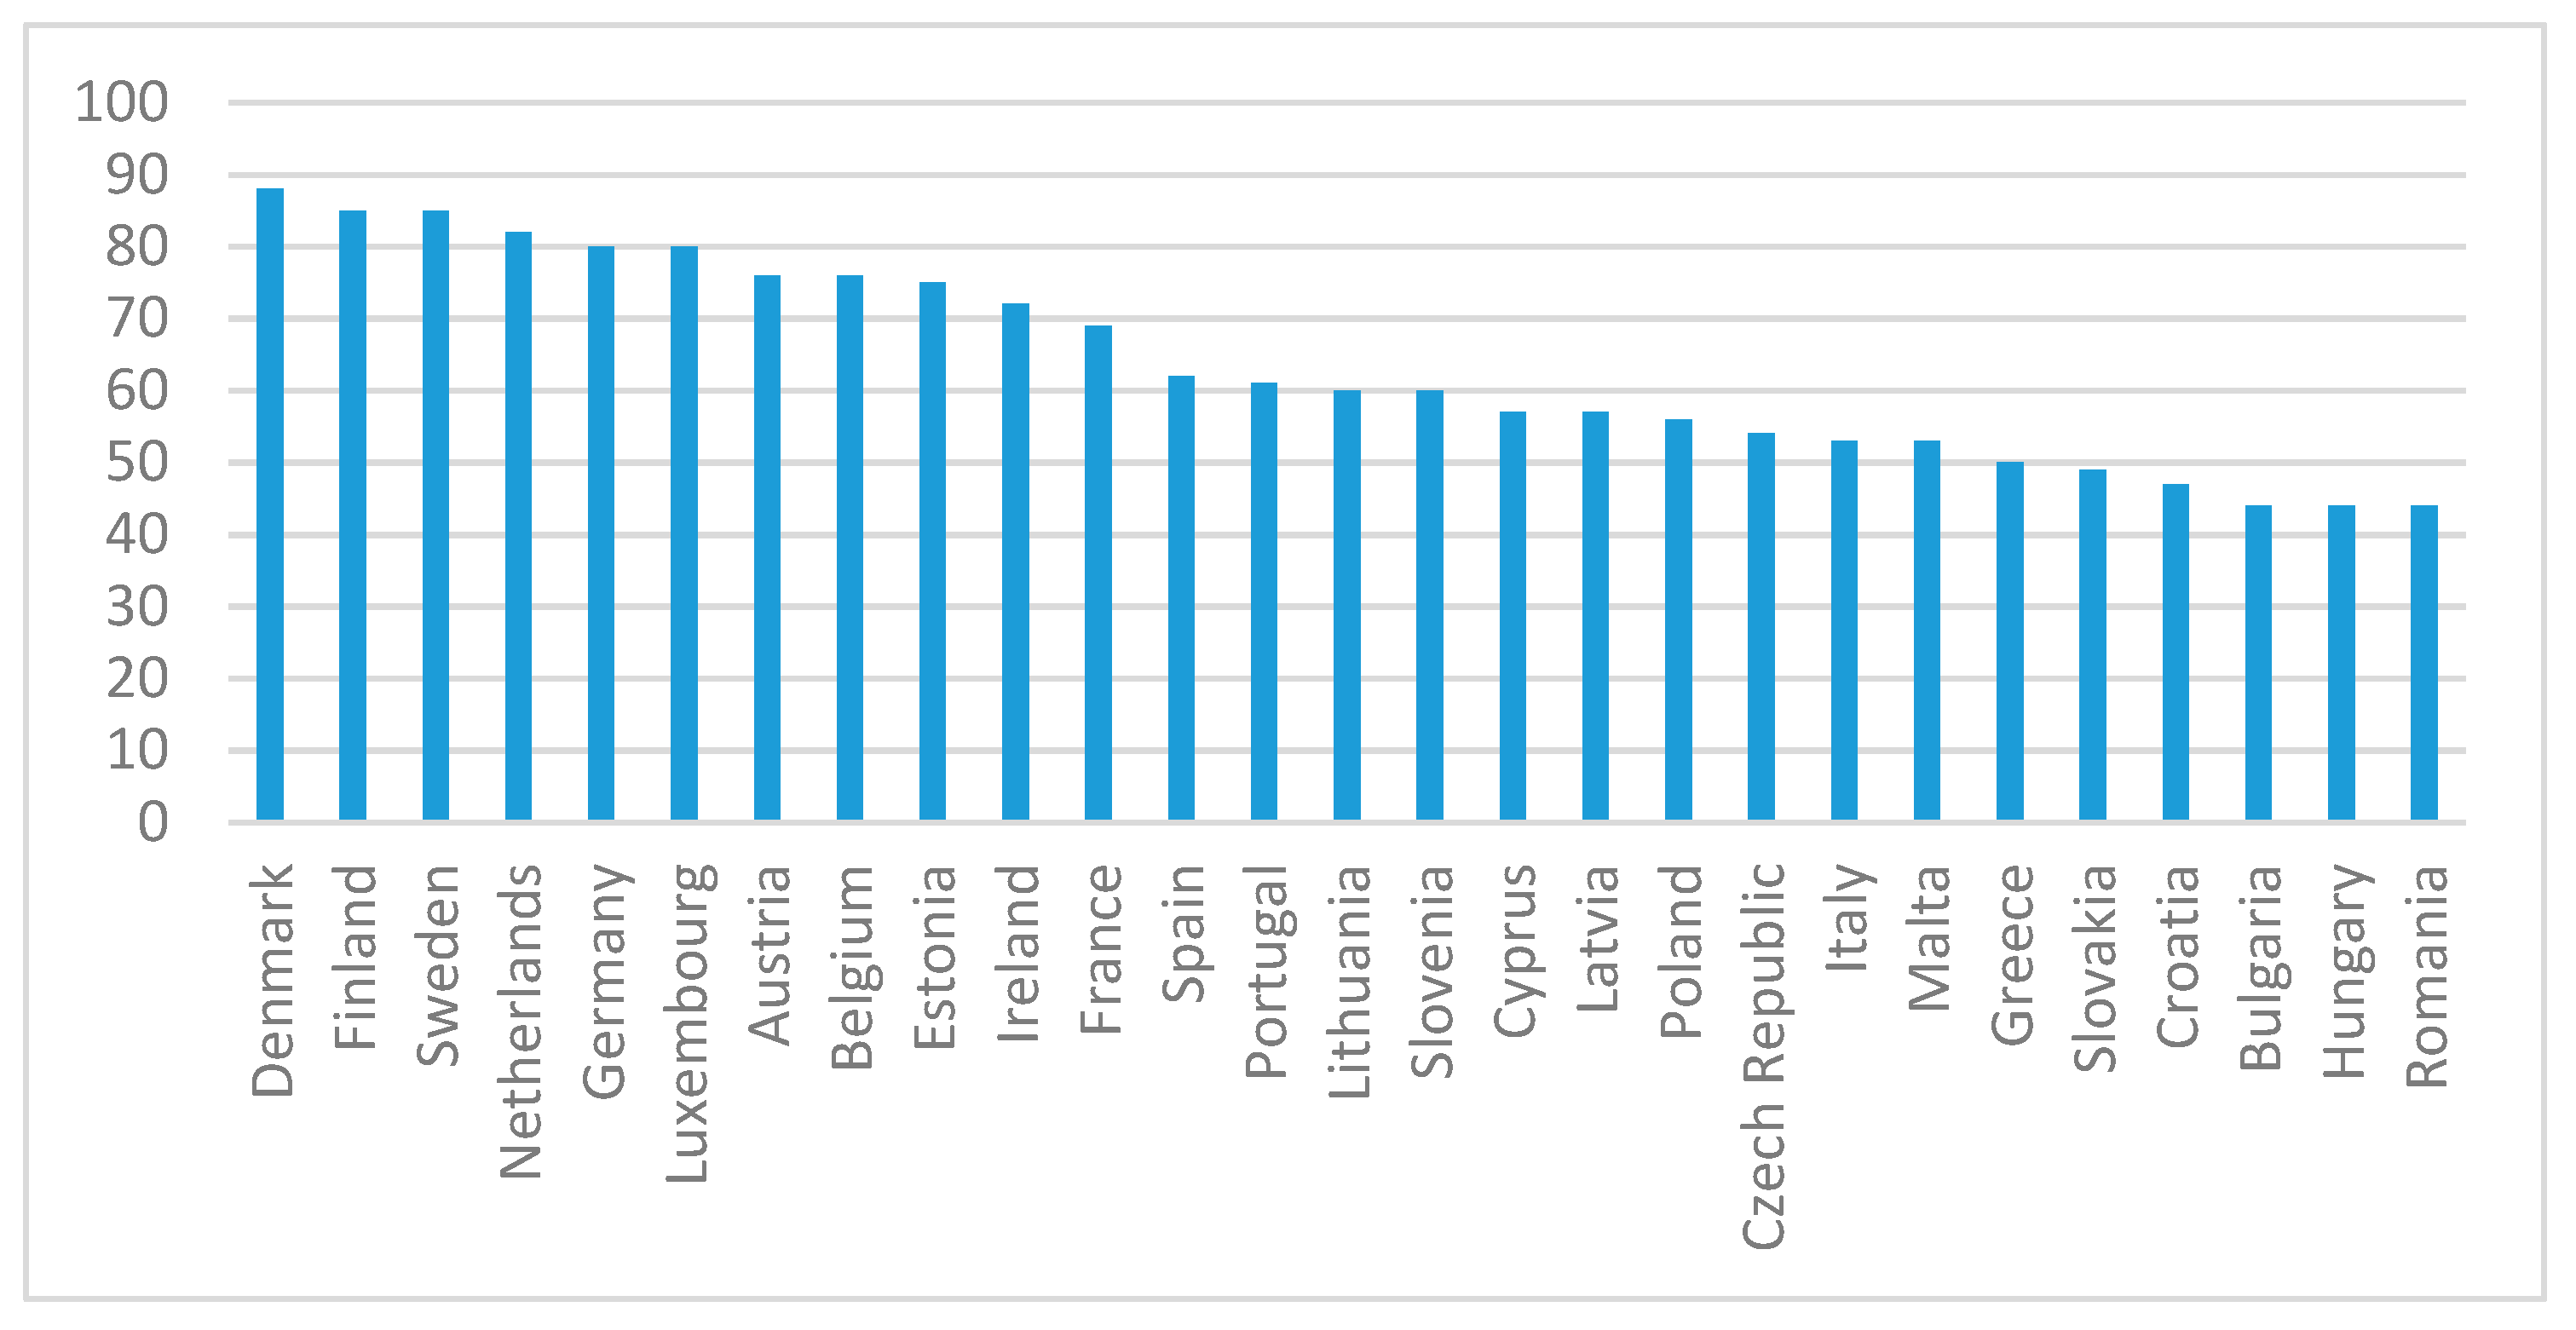
Our study focuses on the peculiarities of EU-27 member states from the point of view of their financial and economic crime phenomena, and their economic and sustainable development levels as well. The graphic analysis of the most recent data for the variables of interest in our study are presented within Figure 1, Figure 2, Figure 3, Figure 4, Figure 5 and Figure 6. Figure 1 contains the latest scores for the Corruption Perceptions Index 2020, in the increasing order of the phenomenon, from left to right. We may easily notice that the Northern countries, as well as the Benelux, have the highest scores, thus their perceived corruption is the lowest among the EU-27 member states. In contrast, the Eastern European countries face the largest corruption, scoring the lowest on their CPIs.
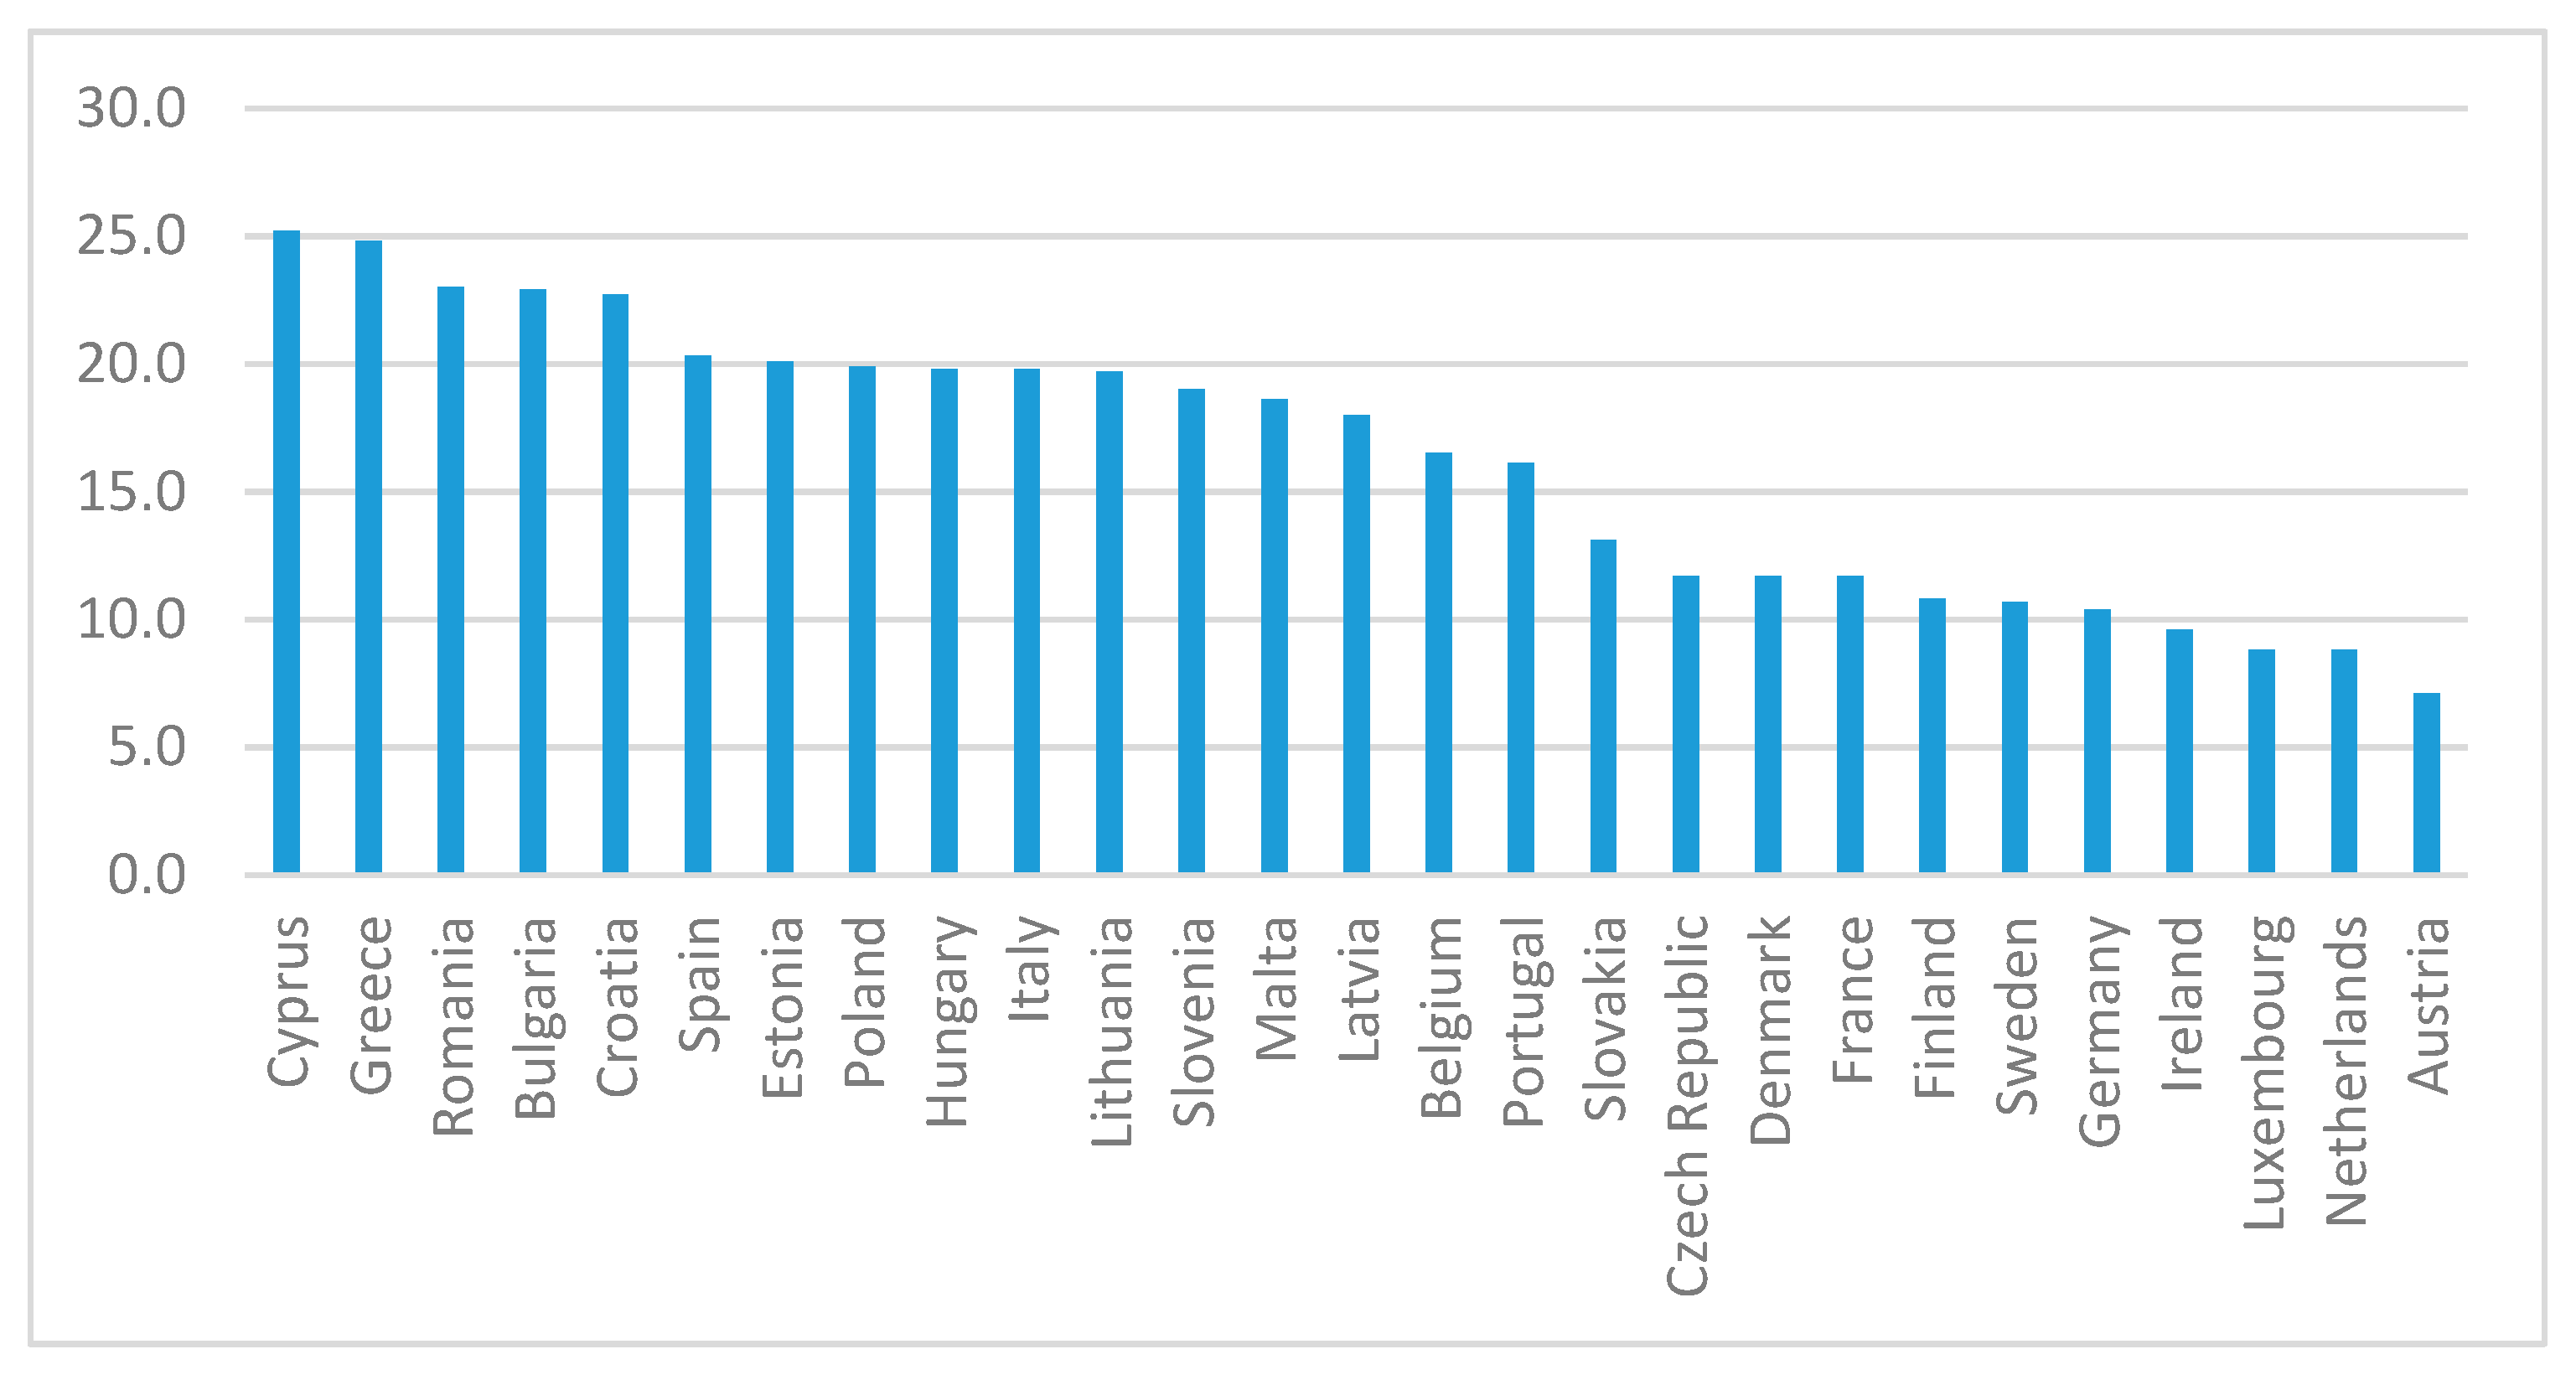
Figure 2 represents the latest available data on the shadow economy for the year 2017. We may notice that countries such as Cyprus, Greece, Romania, and Bulgaria have leading estimations of their shadow economies as a GDP weight among EU-27 member states. In contrast, Austria, Germany, Netherlands, and Luxembourg face the lowest levels of shadow economies as a GDP percentage.
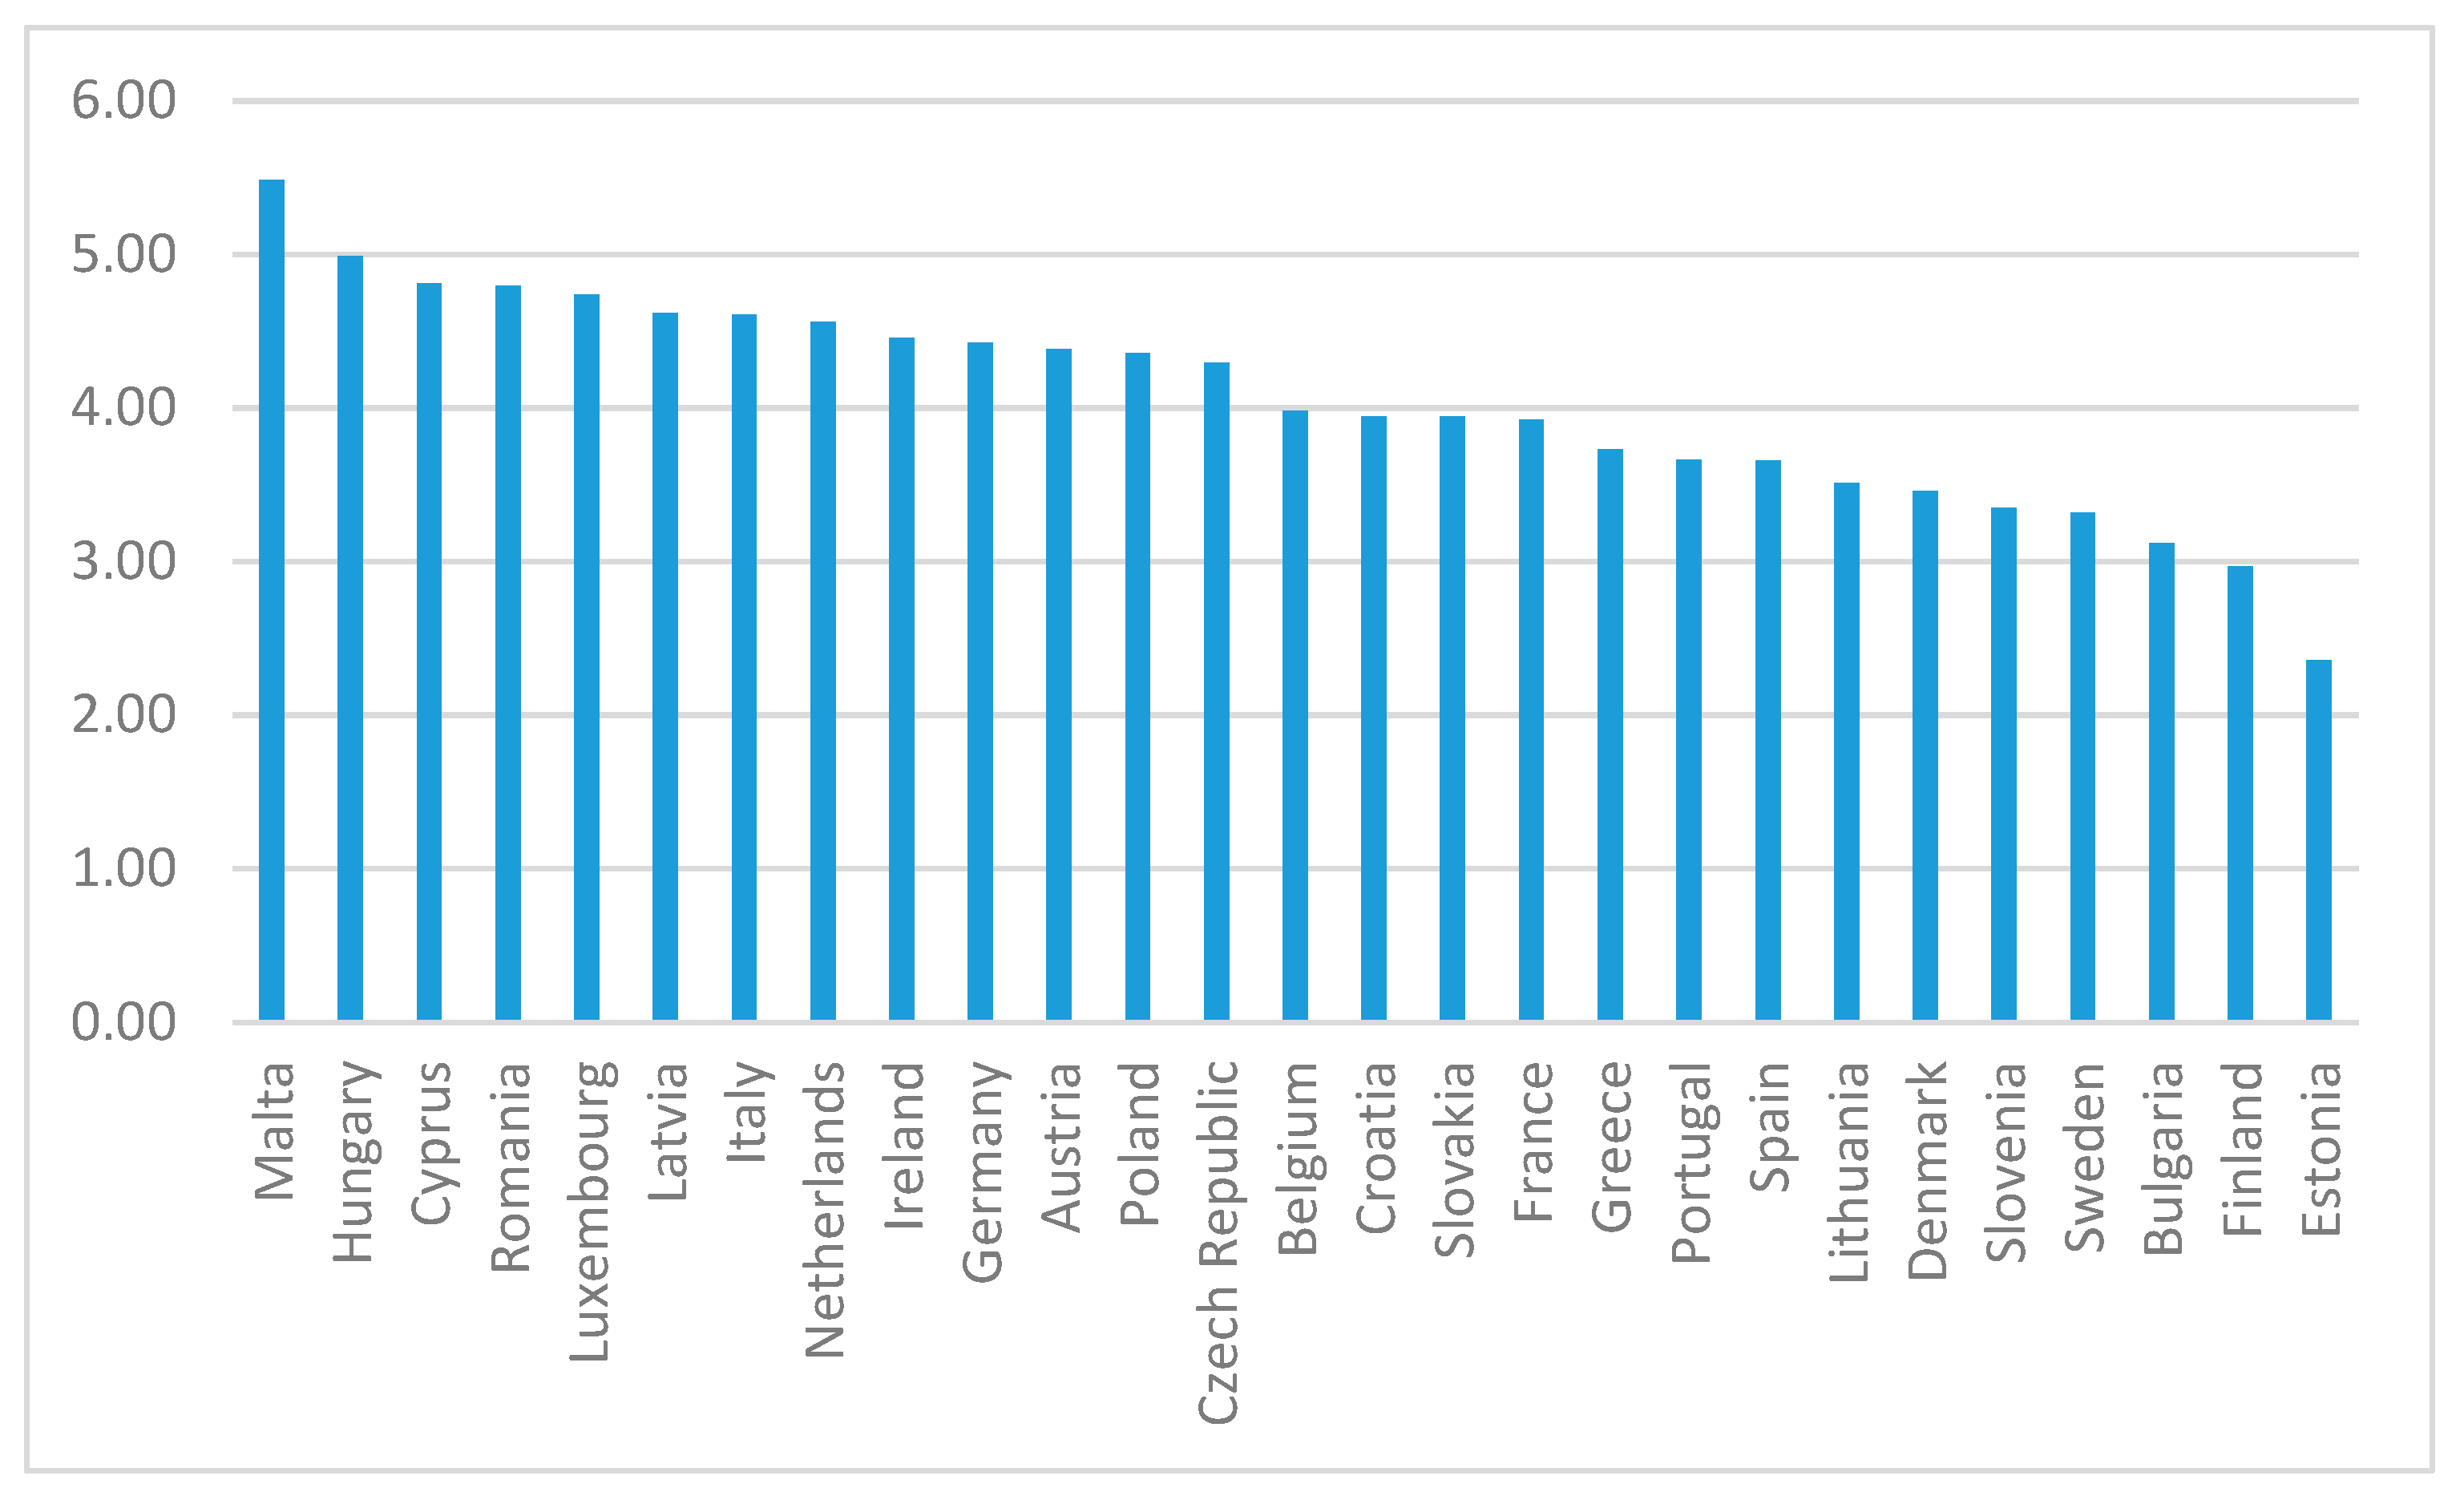
Figure 3 graphically represents the risk of money laundering for EU-27 countries from the Basel Anti Money Laundering Index 2020.
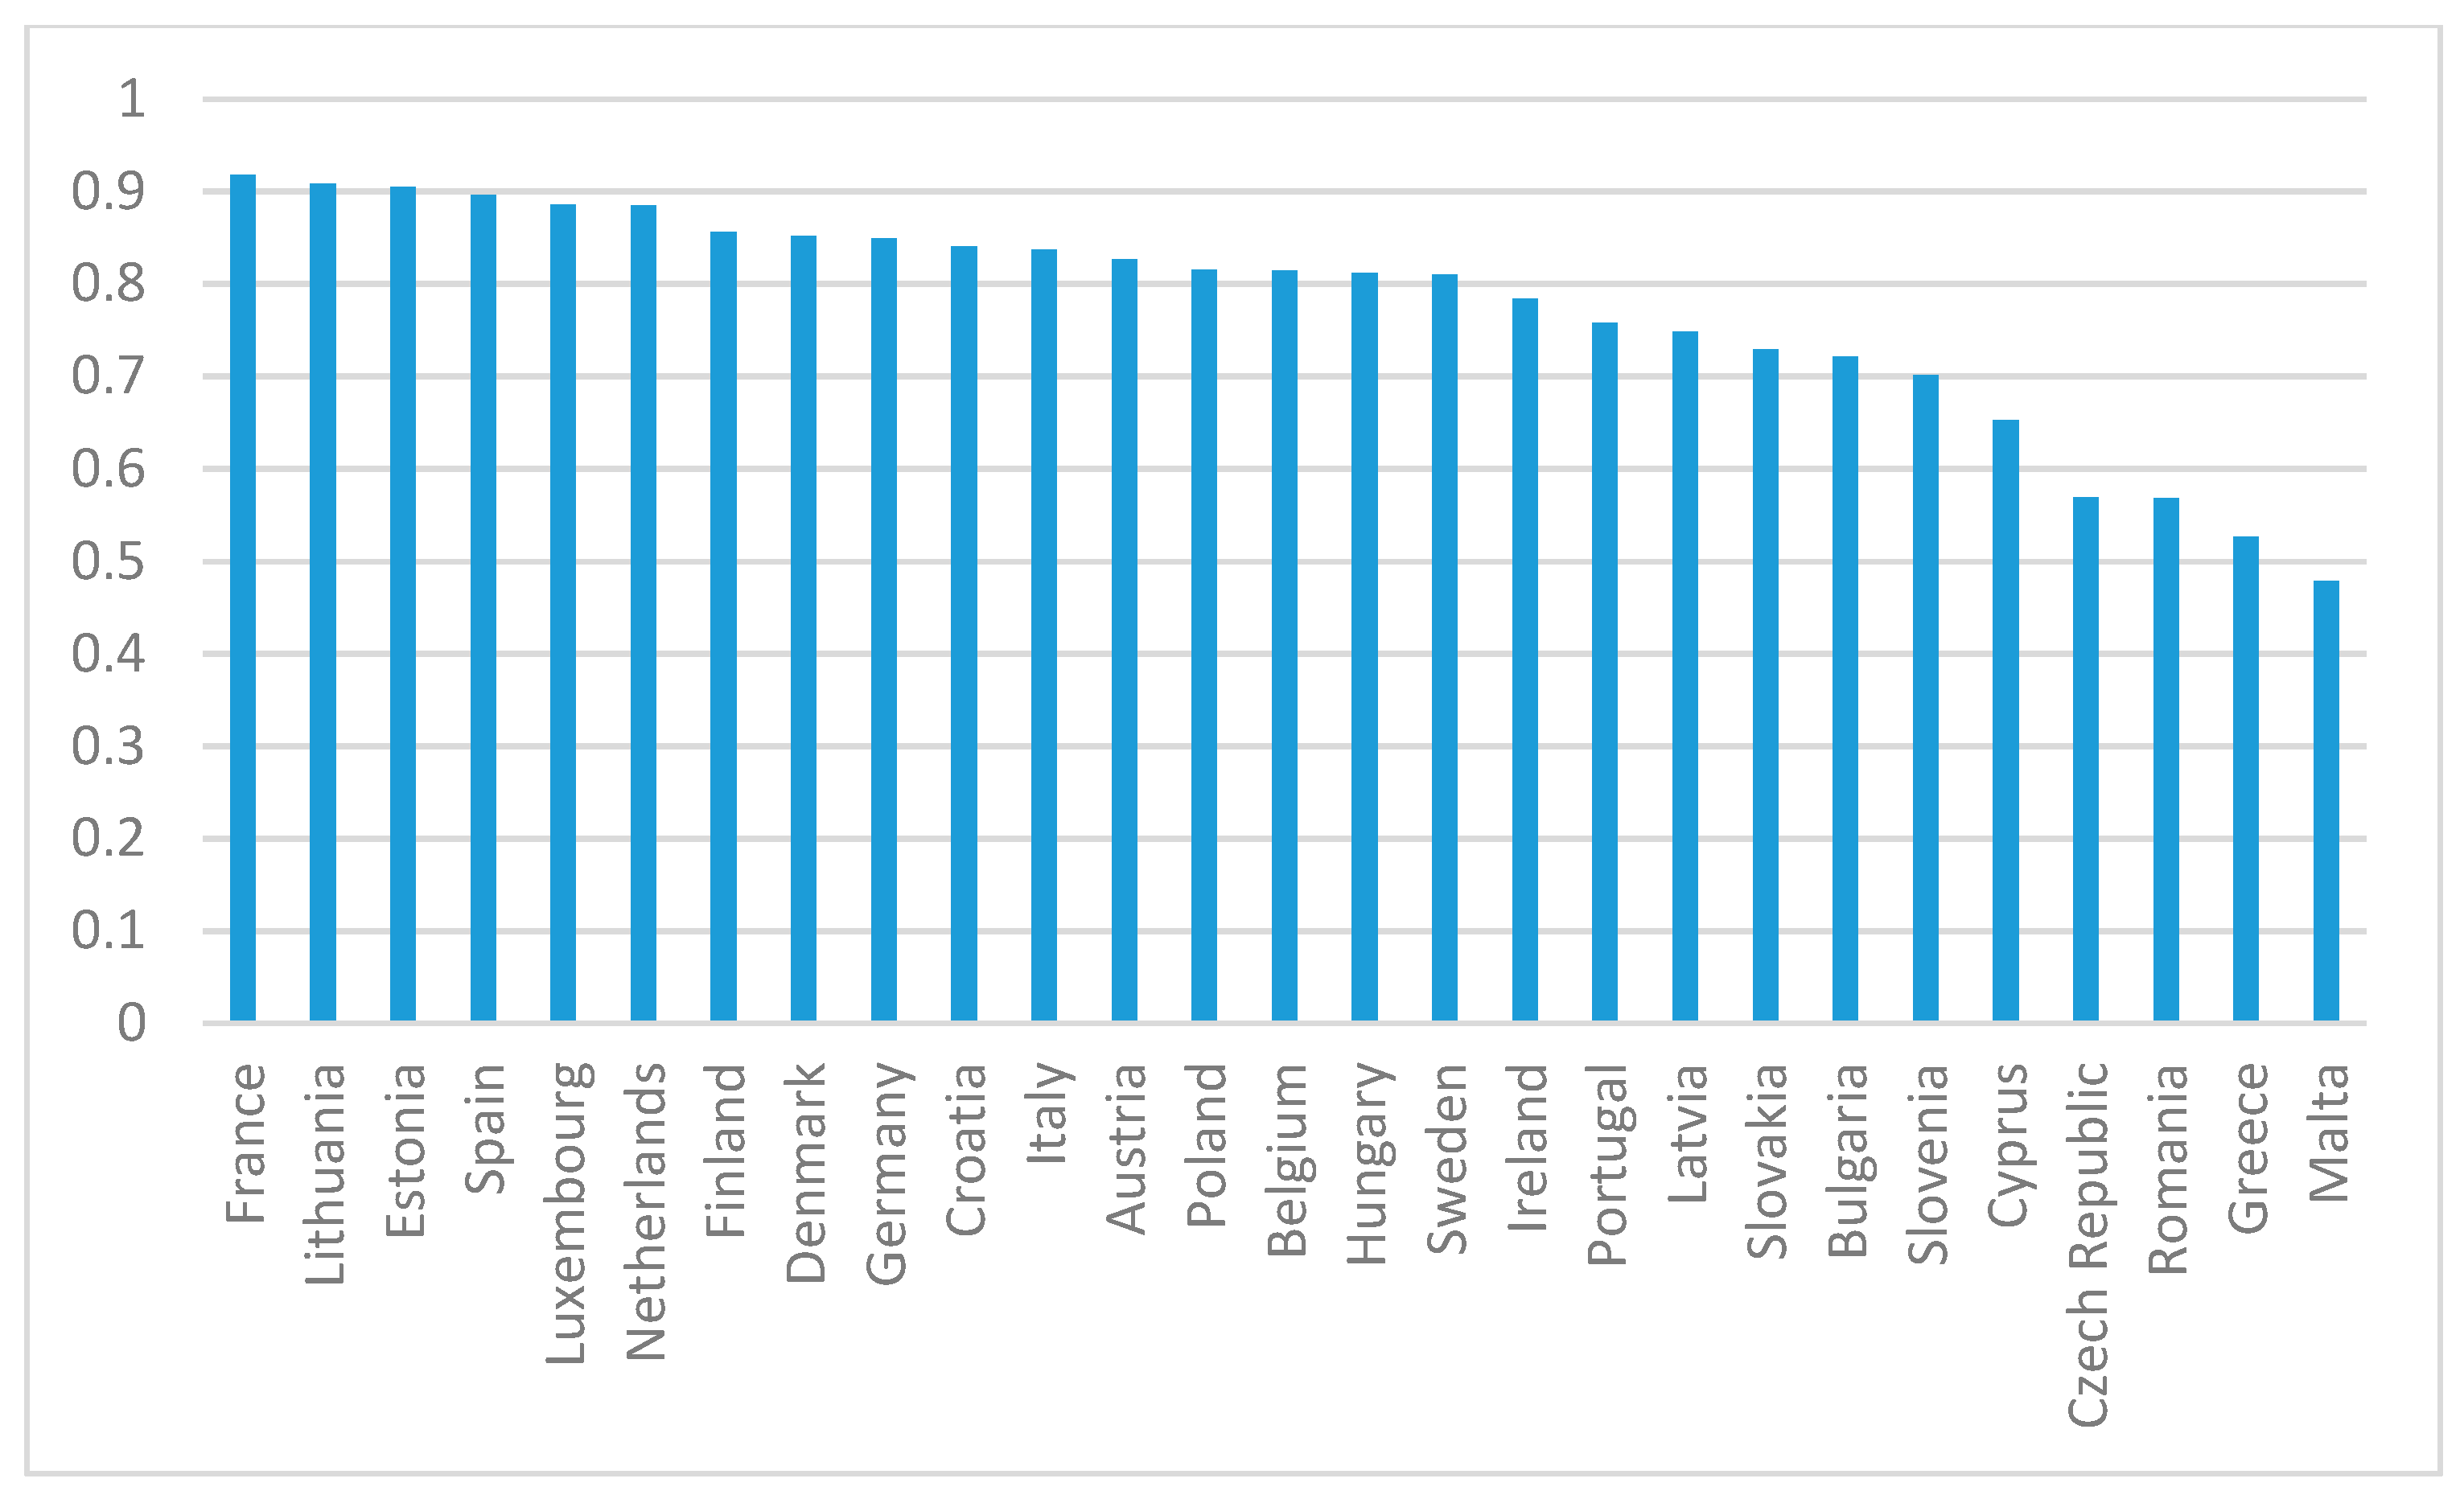
Figure 4 represents the latest available Global Security Index, v3, at the date of writing this paper. Western European countries score great, possessing low global security risks, while most Eastern European countries register low Global Security Indexes, placing their transactions at greater risk.
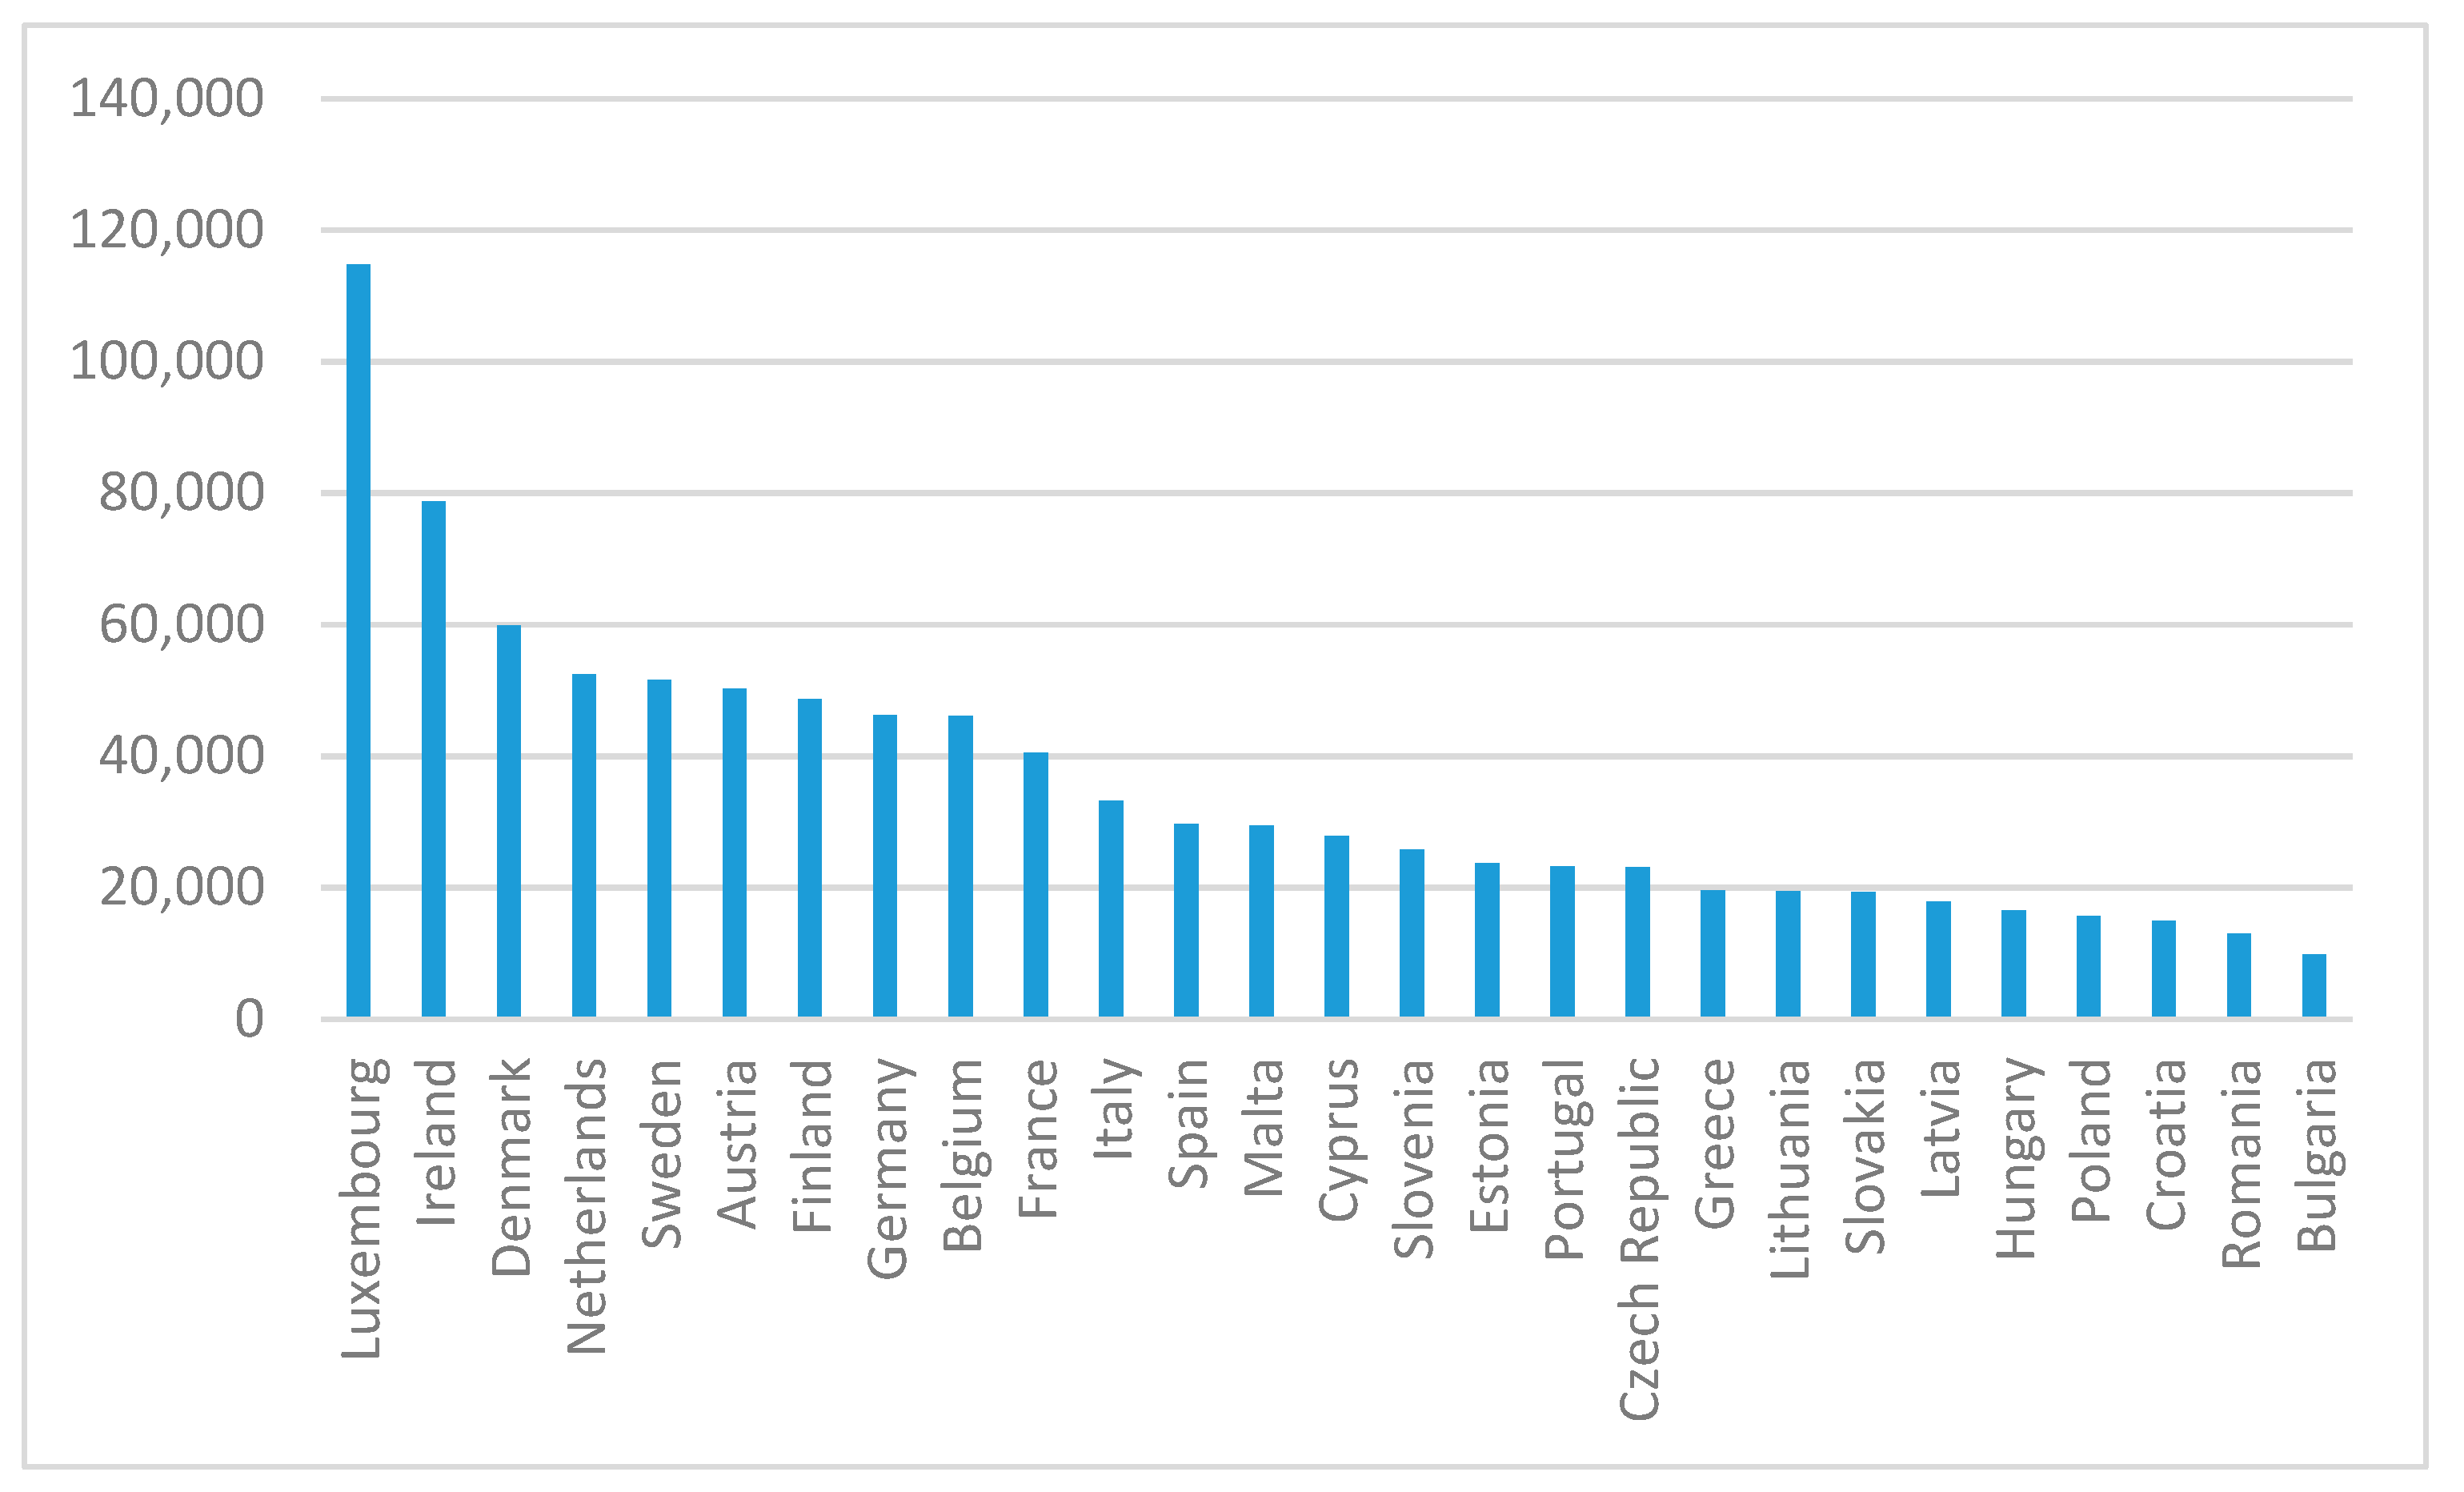
Figure 5 represents per capita GDPs as a prosperity proxy for EU-27 member states, for the year 2019, in current USD. As expected, the North-Western European countries register the highest development levels, with the exception of Austria, which is a Central European country. Then, the Eastern European countries register the lowest economic prosperities, finding themselves below USD 20,000 per capita.
Figure 6 uses the Human Development Index from the most recent report of the United Nations as a proxy for sustainable development. Once again, North-Western European countries register the highest human development levels, while Central and Eastern European countries such as Bulgaria, Hungary, and Romania register the poorest scores among EU-27 member states.
Basically, the South-Eastern EU-27 countries register high levels of corruption, shadow economy, and cybercrime, while their GDPs per capita and HDIs are rather poor. Then, North-Western European countries register the highest development levels and lowest financial and economic crime phenomena. Thus, we expect an indirect relationship between these undesired crimes and countries’ development levels.
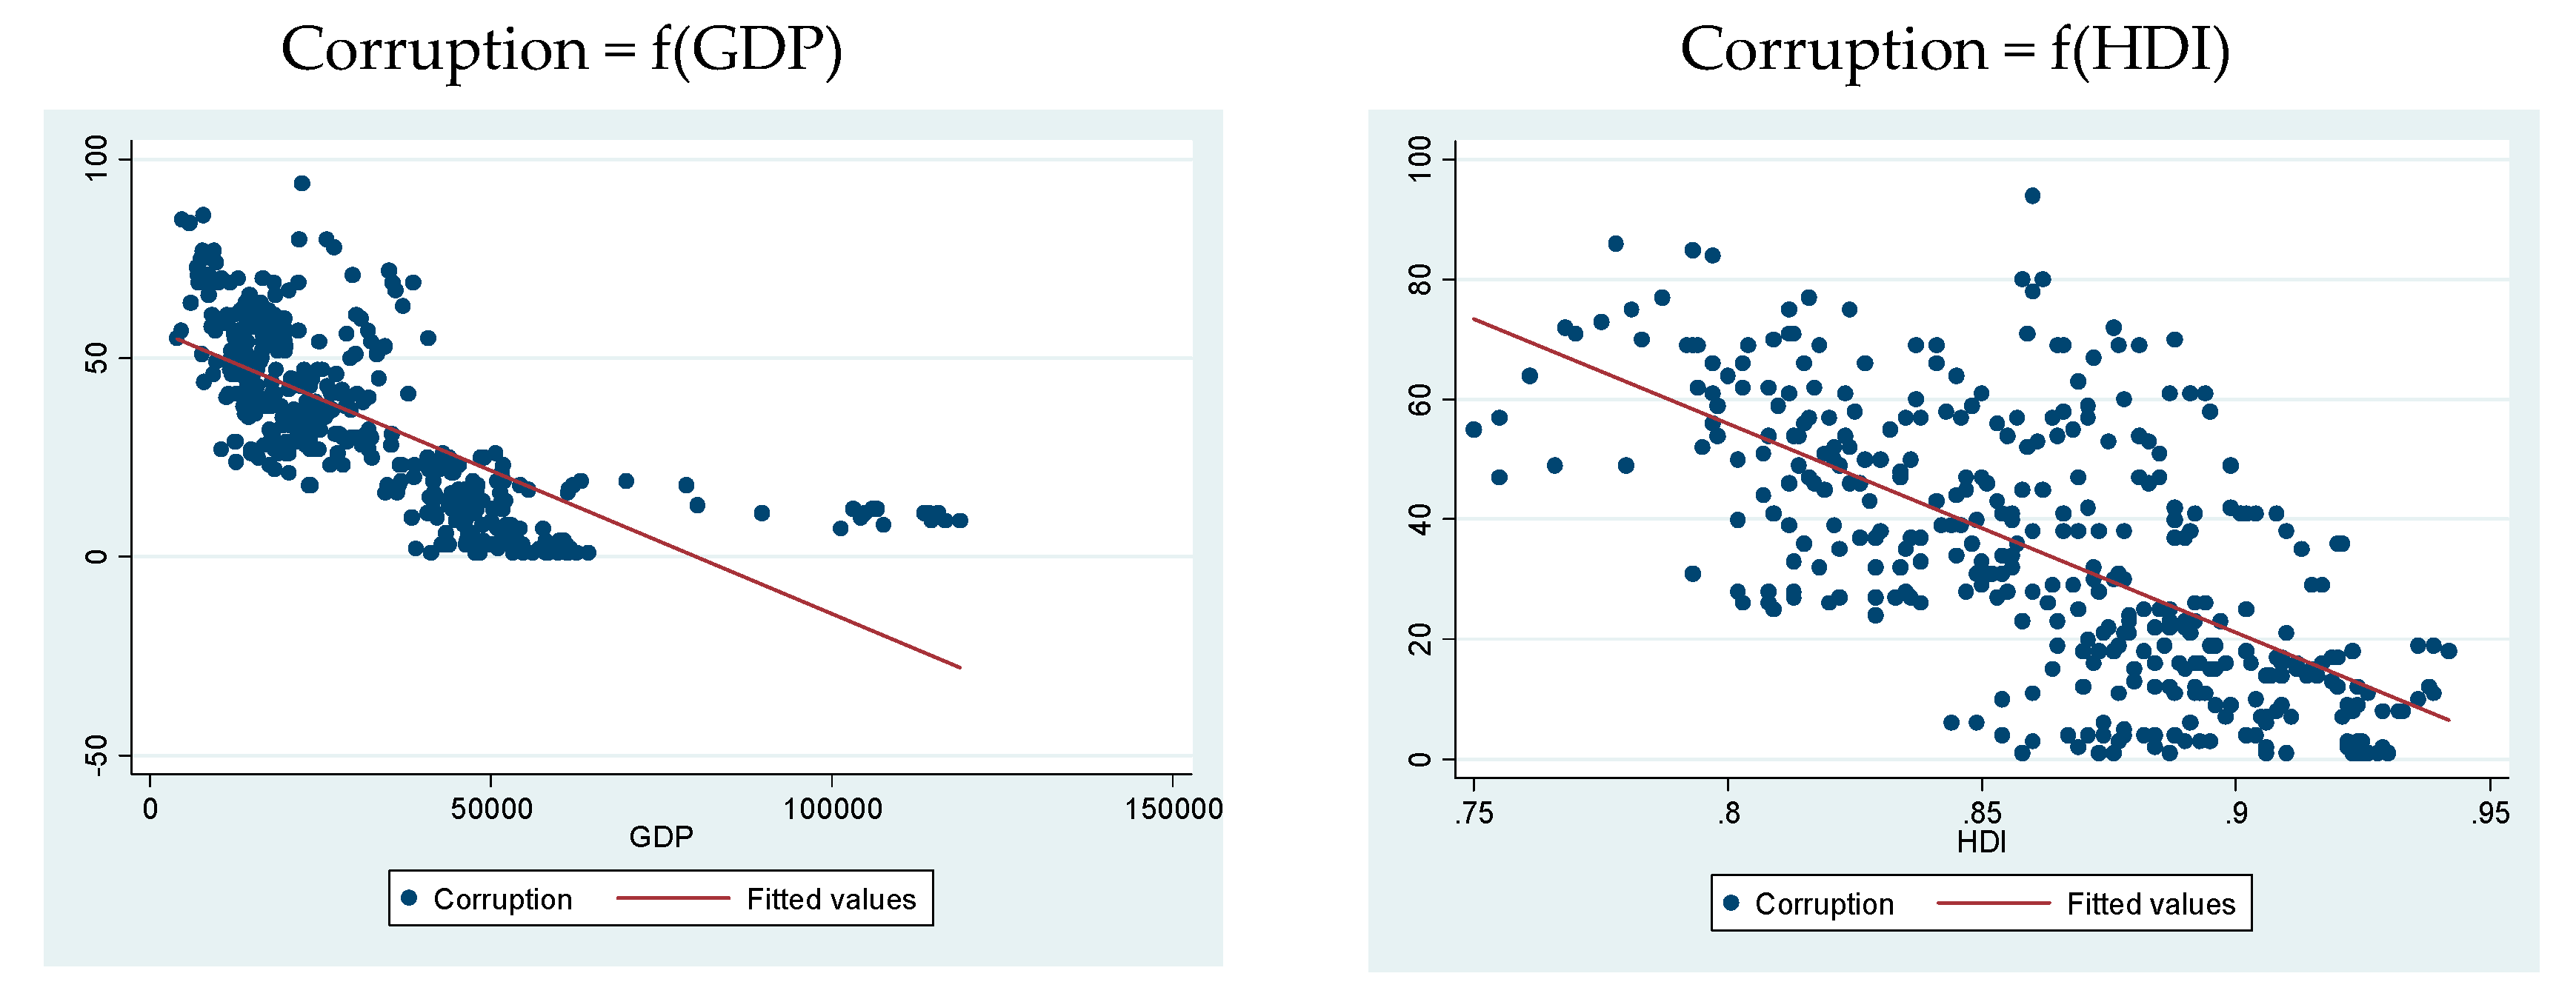
The underlying relationships between the financial and economic crime proxies and the development proxies may be depicted from Figure 7. One may easily notice the negative relation that exists between corruption and the shadow economy on the one hand, and GDP and HDI, respectively, on the other hand. In addition, we see a positive relation between money laundering and cybersecurity on the one hand, and GDP and HDI, respectively, on the other hand.
4.2. Main Results
The results have been synthesized within Table 1. Table 1a contains the estimations of financial and economic crime proxies as a function of GDP as an economic prosperity proxy: the dependent variables are, in turn, corruption in Model (1a), shadow economy in Model (2a), money laundering in Model (3a), and cybercrime in Model (4a). In the same manner, Table 1b contains the estimations of financial and economic crime proxies (Models (1b)–(4b)) as a function of HDI. Log-log modeling is used, except for Models (3a) and (3b), which are linear-log models. As such, Models (1a), (2a), (4a), (1b), (2b), and (4b) are commonly referred to as elastic and the coefficient of LogGDP or LogHDI is referred to as an elasticity, and are interpreted further on according to Benoit (2011).
In terms of effects of changes in GDP on Corruption (both unlogged), multiplying GDP by e will multiply the expected value of Corruption by e−1.1213. The proportional change in Corruption associated with a 1% percent increase in GDP is computed as 0.9889, so we do register a decrease of about 1.1% of the expected Corruption and this indirect relationship is supported by the predictive accuracy of 51.2% for Model (1a), which is actually an average strength relationship.
The same indirect relationship between GDP as an independent variable and shadow economy as a dependent variable is validated by Model (2a): the proportional change in shadow economy associated with a given 5% percent increase in GDP is computed as 0.9784, so once again we register an almost 2.2% decrease of shadow economy given by increased economic prosperity, supported by a predictive accuracy of 59.22%, the highest Adjusted R2 from all our models.
The literal interpretation of the estimated coefficient 0.2165 from Model (3a) is that a one-unit increase in LogGDP will produce an expected increase in Money Laundering of 0.2165 units. In other words, adding 1 to LogGDP means multiplying GDP itself by e = 2.72. The expected change in Money Laundering associated with a given 10% increase in GDP may be determined as 0.020634. Still, the explicative power of this model is extremely reduced.
Model (4a) supports the direct relationship between cybercrime and economic development: multiplying GDP by e will multiply the expected value of Cybercrime by e0.0904.
Further on, Table 1b seems to reinforce the effects of financial and economic crime upon economic and human development, but in a more pronounced manner, everything else unchanged, because all the elasticities of LogHDI (from Table 1b) are up to a couple of times more prominent than the ones for LogGDP (from Table 1a). As such, Model (1b) estimates that the proportional change in Corruption associated with a 1% increase in HDI is 0.8813, i.e., a reduction of the expected corruption by about 12%, thus confirming their indirect relationship. Similarly, Model (2b) confirms the indirect relationship between Shadow Economy and HDI; the proportional change in Shadow Economy associated with a 1% increase in HDI is 0.9519 and the proportional change in Shadow Economy associated with a 5% increase in HDI is 0.7855, i.e., reduces the expected shadow economy by 21.45%. All in all, the desired effect of decreasing the financial and economic crime proxies of corruption and shadow economy through economic and human development are definitely more prominent in the case of using HDI as leverage.
Model (3b) shows that in terms of a change in unlogged HDI, 1.2141 would be the expected change in Money Laundering when HDI increases by 172%. We would obtain an approximately 0.012141 expected increase in Money Laundering from a 1% increase in HDI.
Then, in Model (4b), a 1% increase in HDI would apparently increase cybercrime by 1.21%. Thus, there is a direct relationship between these two variables, evolving in tandem.
4.3. Robustness Checks
Our robustness checks subsection tests the strength of the relationship from Equation (1) on two axes:
- -
- Robustness checks (1), by using other proxy variables for sustainable development, mainly the Environmental Performance Index (EPI) and the Quality of Life Index (QLI);
- -
- Robustness checks (2), by supplementing Equation (1) through the addition of macro controls near the independent variable already in use. As such, Unemployment rate (Dell’Anno and Solomon 2008; Williams and Schneider 2016; Medina and Schneider 2019; Achim et al. 2021c) and Urbanization rate (Elgin and Oyvat 2013; Yuki 2007; Elgin 2020) are added as control variables in our regression results in order to strengthen our main results.
As such, Robustness checks (1) includes EPI as a sustainable development proxy, previously used by Esty et al. (2008), Emerson et al. (2012), Gallego-Álvarez et al. (2014), and Hoinaru et al. (2020). EPI reflects how close nations are to fulfilling environmental policy objectives, mirroring their environmental performance, and providing guidance for states that aspire to be leaders in sustainability (Yale University. Environmental Performance Index (Yale University 2020)). The indicators comprised by EPI focus on the reduction in environmental stresses to human health and the protection of ecosystems and natural resources (Esty et al. 2008; Emerson et al. 2012), basically comprising 24 performance variables. Table 2a estimates the financial and economic crime proxies, in turn, as a function of EPI (Models (1a) up to (4a)), mostly supporting the expected relationships validated as our main results, with the exception of the lack of significance of the estimated coefficient for EPI in Model (3a).
Moreover, Robustness checks (1) also uses another proxy for sustainable development, mainly the QLI provided by Numbeo (2021); available research data not influenced by any governmental organization. Their QLI is an estimation of overall quality of life using a continuously improved empirical formula which takes into account various national indices, such as purchasing power index, pollution index, house price to income ratio, cost of living index, safety index, health care index, traffic commute time index, and climate index. The higher the QLI of a country is, the better its overall living conditions are. Table 2b estimates the financial and economic crime proxies of EU-27 countries, in turn, as a function of their QLIs (Models (1b) up to (4b)), supporting the expected relationships validated as our main results, with the exception of Model (3b).
Robustness checks (2) supplement the estimations of Equation (1) reported as main results in Table 1, with the addition of two macro controls along with the independent variable already in use. The Unemployment rates of EU-27 member states provided by World Bank is used as an added control within Table 3, overestimating our main results and supporting them.
Moreover, the Urbanization rate of EU-27 member states provided by World Bank is also used as an added control within Table 4, overestimating our main results and supporting them, with the exception of Model (3b).
These two macro controls have extremely low correlation coefficients with the GDP and HDI variables already in use through Equation (1), in order to avoid multicollinearity.
5. Discussions
We may clearly notice that the increase of economic and social development imprints diminishing levels of corruption, shadow economy, and cybercrime, but increasing levels of money laundering. Our main results are robust to other dependent variables and the addition of controls.
Basically, the indirect relationship between corruption and shadow economy on the one hand, and GDP and HDI as development proxies on the other hand, is fully supported by Models (1a), (2a), (1b), and (2b) from Table 1 of our main results. Without any exceptions, the corresponding numbered models from Table 2, Table 3 and Table 4 support the negative correlation existing between these variables, at significance levels of at least 5%. Nonetheless, Table 3 and Table 4 support the idea that the decreased corruption and shadow economy are more prominent in the case of using HDI instead of GDI, probably because of the multitude of transmission channels added on top of economic development for the enlarged domain of sustainable development. These results strongly support our Hypothesis 1 and 2, confirming our expectations.
Our findings are in line with the results of Husted (1999), Treisman (2000), Paldam (2001, 2002), Torgler (2004), Kirchler (2007), De Rosa et al. (2010), Achim et al. (2018a, 2018b), PricewaterhouseCoopers (2018), Mauro (1995), and Gundlach and Paldam (2009), which also found that increases in the levels of development of a society are associated with improvements of the tax payment capacity and law compliance as well. These studies also support the idea that higher levels of corruption and shadow economy are results of low financial satisfaction, which characterizes the poor countries. In such a context, tax honesty and compliance with the law of poor people is clearly affected. These will be improved as financial satisfaction will be improved.
Then, the direct relationship between money laundering on the one hand and the GDP and HDI as their explanatory variables on the other, is extremely interesting in itself. Our estimated coefficients for the main results from Table 1, Models (3a) and (3b) are significant for at least 5%, with the exception of Model (3b), where the estimated coefficient for LogHDI is positive but not significant. This direct impact of development upon money laundering seems to be only partly supported through the various dimensions of robustness checks performed. As such, Table 2, which uses EPI and QLI as other proxies for development, estimates a positive but insignificant coefficient of EPI in Model (3a), while the estimated coefficient for QLI from Model (3b) is negative and significant at 10%. Then, Table 3, which adds unemployment to Equation (1) and Table 4, which adds urbanization to Equation (1), estimates positive coefficients for the LogGDP and LogHDI variables, significant for at least 5%, with the exception of Model (3b) from Table 4b, whose coefficient for LogHDI is positive but insignificant. Hypothesis 3 is thus not confirmed.
These findings support the idea that crimes such as money laundering crime are conducted when financial satisfaction is high and belong to the rich people. Indeed, money laundering covers a wide variety of transactions, which include international transfers, dispersions in small amounts, and transfers in the name of other persons benefiting of bank experts, brokers, accountants, notaries, or lawyers (Jurj-Tudoran and Șaguna 2016, p. 4). Thus, money laundering offences are committed by persons with upper societal positions that have top management positions and pose as philanthropic persons because they are involved in acts for the benefit of communities (Leția 2014, p. 14). They are also higher educated people with high-professional knowledge and competences; those who commit such crimes are also called white collars (Sutherland 1940). These white collars are actually those who exploit the gap in economic and social changes of a society and commit crimes which generate innovations so that the society produces new changes (Merton 1968). Thus, businesspeople associate themselves with various forms of white-collar crimes, such as tax evasion and money laundering, and poor people develop illegal acts, such as drugs, gambling, and human trafficking (Aniţei and Lazăr 2016, pp. 17–18; Achim and Borlea 2020, p. 3). Another special category of white collars consists of politically involved people, responsible for the affairs of states, that hold unethical behaviors (e.g., politicians, deputies, ministers). Such fraud is currently investigated by organizations such as the European Anti-Fraud Office (OLAF), which recommended the recovery of EUR 485 million to the EU budget in 2019 only, according to their latest report (The OLAF Report 2019 2020). Regarding white collars, many serious deviations of European politicians regarding the corruption’s affairs, mafia, and drugs are constantly monitored by the European Parliament (Bartoloni 2020).
The direct relationship between cybersecurity and prosperity proxies is supported by the positive and significant coefficients estimated for LogGDP and LogHDI from Table 1 (Models (4a) and (4b)), which show that the developed countries face a higher level of cybersecurity and thus a lower level of cybercrime. Thus, we validated that the more developed a European country is, the less vulnerable to cybercrimes it proves itself to be. Without any exceptions, the corresponding numbered models from Table 2, Table 3 and Table 4 support the positive correlation existing between these variables, at significance levels of 10%. Thus, even when EPI and QLI are used as sustainable development proxies, the more improved the development level of a member state is, the less vulnerable that state is to cybercrime activities (Table 2). Robustness stands strong at a 10% threshold when various macro controls are added as well (Table 3 and Table 4). Our Hypothesis 4 is confirmed, fulfilling our expectations.
Thus, our findings support the idea that the level of cybercrime decreases as the level of economy and society development increases. Indeed, according to the International Telecommunication Union (2018), as the Global Cybersecurity Index suggests, the most vulnerable countries in terms of cybersecurity risk are low-income countries. Thus, within the context of a weak development of the society, including a low level of digitalization and adopted high technologies, the level of cybercrime increases. The results are in line with those of Kshetri (2010), who also found that the level of cybercrime is higher in developing countries compared to developed ones, especially due to the high unemployment rates and low wages. The problem of cybercrime in developing countries was also raised by Świątkowska (2020), who provided multidimensional recommendations—especially for political leaders and policymakers, to reduce this gap compared to developed countries.
6. Conclusions
Economic and financial crime is closely related to the changes and the development of societies. The objective of this paper was to analyze in a detailed manner whether the types of economic and financial crimes change as the society develops. For our purpose, we used the sample of 27 European Union countries, for the 2005–2020 period, forming an unbalanced panel dataset. Our findings support the conclusion that higher economic and sustainable development results in different types of movements in economic and financial crimes. We found that crimes such as corruption, shadow economy, and cybercrime occur especially under the low financial satisfaction of people and may vanish once the financial satisfaction is accomplished. Thus, they generally characterize poor countries. In contrast, the crimes under the form of money laundering require high levels of education and knowledge, and thus these characterize rich countries which are able to conduct such complex schemes of fraud, often realized on a cross-border level.
The main policy implications regard the fact that governments need to consider the effect of society’s development on various types of economic and financial crime in order to understand the main drivers of these acts and, through this way, to adopt the proper decisions. Our results support the positive impact of economic and sustainable development upon most of the studied economic and financial crimes, so all governmental policies that support economic development, such as promoting macroeconomic stability and the development of manufacturing, investments in public services, and an effective tax collection, are expected to have a beneficial effect upon the contraction of corruption, shadow economy, and cybercrimes. Economic and social policies are strongly connected, so the positive impact of decreased financial and economic crimes should reflect upon the lives and wellbeing of people as well. A prosperous and safer economic environment should bring benefits upon the quality of life of nations, and this could be a future research direction of ours. Moreover, our study finds that these economic and financial crimes should be reduced as a result of increasing the sustainable development of countries, attained through poverty reduction measures, public awareness, participation in global environmental efforts, and others. Money laundering management has to take into account the peculiarity of its direct relationship with economic and sustainable development within EU-27, so the prevention policies and procedures for dealing with money laundering should be regularly reviewed and customer acceptance policies and procedures which are sensitive to the risk of money laundering should be adopted, as to always know your customer, especially because of its “white-collar” profile.
Our paper has several limits related to using macroeconomic data or connected to the volume of the sample. Of course, if the data are collected at the individual level, the results may differ. In addition, our results are restricted to using only data available for European Union countries. This data limitation could be diminished by carrying out the estimations on separate subsamples of old and new EU member states. In future studies, we would take these limits into account in order to substantiate our findings. We are also considering estimating these models on larger samples of worldwide countries as well. Nonetheless, multiple regression modeling would be used, and we are also considering a cluster analysis of worldwide countries. Dynamic panel models might also prove useful, as the effect of development upon crimes might happen with a certain time delay.
Author Contributions
Conceptualization, M.V.A. and S.N.B.; formal analysis, V.L.V.; methodology, V.L.V. and M.V.A.; resources, S.N.B., V.L.V., M.V.A., and D.R.F.; writing—original draft, V.L.V. and D.R.F.; writing—review and editing, S.N.B., V.L.V., D.R.F., and M.V.A. All authors have read and agreed to the published version of the manuscript.
Funding
This work was supported by a grant of the Romanian Ministry of Education and Research, CNCS—UEFISCDI, project number PN-III-P4-ID-PCE-2020-2174, within PNCDI III.
Institutional Review Board Statement
Not applicable.
Informed Consent Statement
Not applicable.
Data Availability Statement
Not applicable.
Conflicts of Interest
The authors declare no conflict of interest.
Appendix A. Variables and Data
| Variables | Way of Expressing | Units/Scale | Sources |
| Dependent variable | |||
| Corruption | Corruption is obtained from the Corruption Perceptions Index which measures the subjective levels of perceived corruption in the public sector for the world countries. The score ranges from 0 (highly corrupt) to 100 (very clean). In this study we particularly deal with the countries’ world ranking depending on the level of perceived corruption. | This score ranges from 1, meaning the lowest level of corrupted country in the world, to 180, the highest corrupted countries in the world. | Transparency International (2020) |
| Shadow economy | Shadow economy is determined as a percentage of shadow economy within GDP. | % in GDP | Medina and Schneider (2019) |
| Money laundering | Money laundering is determined as a risk of money laundering and terrorist financing, as it is provided by Basel AML Index. | The score ranges between 0 for the lowest risk to 10, the highest risk level in money laundering/terrorist financing. | Basel Institute of Governance (2020) |
| Cybercrime | Cybercrime is determined with the help of the Global Cybersecurity Index (GCI), as it is provided by International Telecommunication Union. | This index ranges between 0, meaning the most vulnerable countries in terms of cyber risks (highest level of cybercrime), and 1 for the less vulnerable ones (lowest level of cybercrime). | International Telecommunication Union (2018). |
| Independent variables | |||
| Economic development | GDP per capita (GDP) | In US dollars | World Bank (2020) |
| Sustainable development | Human development index (HDI) | The score ranges between 0, meaning the lowest level of human development), and 1, for the highest level of human development. | UNDP Human Development Reports (2019) |
| Environmental performance index (EPI) | The score ranges from 0, meaning the lowest level of environment perfromance, to 100 for the highest level of environment perfromance, | Yale University. Environmental Performance Index (Yale University 2020) | |
| Quality Life Index (QLI) | The score is an estimation of overall quality of life taking into account various national indices, such as purchasing power index, pollution index, house price to income ratio, cost of living index, safety index, health care index, traffic commute time index, and climate index. The higher the QLI of a country is, the better its overall living conditions are. | Numbeo (2021) | |
| Control variables | |||
| Unemployment rate | Total unemployment (modeled ILO estimate). Unemployment refers to the weight of the labor force that is without work but available for and seeking employment. | Percentage of total labor force | World Bank (2020) |
| Urbanization | Urban population (% of total population) refers to people living in urban areas as nationally defined. The data are smoothed by United Nations Population Division. | Percentage of total population | World Bank (2020) |
References
- Absalyamova, Svetlana, Timur Absalyamov, Asiya Khusnullova, and Chulpan Mukhametgalieva. 2016. The impact of corruption on the sustainable development of human capital. Journal of Physics: Conference Series 738: 1–6. [Google Scholar] [CrossRef] [Green Version]
- Achim, Monica Violeta, and Sorin Nicolae Borlea. 2020. Economic and Financial Crime. Corruption, Shadow Economy, and Money Laundering. Cham: Springer. [Google Scholar] [CrossRef]
- Achim, Monica Violeta, Sorin Nicolae Borlea, and Andrei M. Anghelina. 2018a. The impact of fiscal policies on corruption: A panel analysis. South African Journal of Economic and Management Sciences 21: 1–9. [Google Scholar] [CrossRef]
- Achim, Monica Violeta, Sorin Nicolae Borlea, and Viorela Ligia Văidean. 2021a. Does technology matter for combating economic and financial crime? A panel data study. Technological and Economic Development of Economy 27: 223–61. [Google Scholar] [CrossRef]
- Achim, Monica Violeta, Sorin Nicolae Borlea, Lucian Găban, and Ionuț Constantin Cuceu. 2018b. Rethinking the shadow economy in terms of happiness. Evidence for the European Union Member States. Technological and Economic Development of Economy 24: 199–228. [Google Scholar] [CrossRef] [Green Version]
- Achim, Monica Violeta, Sorin Nicolae Borlea, Viorela Ligia Văidean, Decebal Remus Florescu, Eugenia Ramona Mara, and Ionuț Constantin Cuceu. 2021b. Economic and Financial Crimes and the Development of Society. In Standard of Living, Wellbeing, and Community Development. Edited by Ryan Merlin Yonk. London: IntechOpen. [Google Scholar] [CrossRef]
- Achim, Monica Violeta, Viorela Ligia Văidean, Sorin Nicolae Borlea, Alexandra Ioana Rus, and Florin Dobre. 2021c. The impact of intelligence on economic and financial crime: A cross-country study. Singapore Economic Review 31: 1517–26. [Google Scholar] [CrossRef]
- Aidt, Toke S. 2010. Corruption and Sustainable Development; No. CWPE 1061. Cambridge: Faculty of Economics. Available online: https://www.repository.cam.ac.uk/bitstream/handle/1810/242086/cwpe1061.pdf;jsessionid533A12327621029A0EF0B686DD27C5E5C?sequence51 (accessed on 1 January 2021).
- Ali, Mohammed A., Muhammad Ajmal Azad, Mario Parreno Centeno, Feng Hao, and Aad van Moorsel. 2019. Consumer-facing technology fraud: Economics, attack methods and potential solutions. Future Generation Computer Systems 100: 408–27. [Google Scholar] [CrossRef]
- Alm, James, Jorge Martinez-Vazquez, and Friedrich Schneider. 2004. Sizing the problem of the hard-to tax. Contributions to Economic Analysis 268: 11–75. [Google Scholar]
- Amza, Tudor. 2002. Criminologie, Tratat de teorie şi politică criminologică (Criminology, Treatise on Criminological Theory and Policy). Bucharest: Lumina Lex Publishing House. [Google Scholar]
- Aniţei, Nadia Cerasela, and Roxana Elena Lazăr. 2016. Evaziunea fiscală între legalitate și infracţiune (The Tax Evasion between Legality and Crime). Bucharest: Universul Juridic Publishing House. [Google Scholar]
- Bartoloni, M. 2020. Movers and Shakers. August 7. Available online: https://www.theparliamentmagazine.eu/news/article/movers-and-shakers-7-august-2020 (accessed on 8 May 2021).
- Basel AML (Basel Anti-Money Laundering) Index. 2020. Available online: www.baselgovernance.org (accessed on 8 May 2021).
- Benoit, Kenneth. 2011. Linear Regression Models with Logarithmic Transformations. London: Methodology Institute, London: London School of Economics. [Google Scholar]
- Brosio, Giorgio, Alberto Cassone, and Roberto Ricciuti. 2002. Tax Evasion across Italy: Rational Noncompliance or Inadequate Civic Concern? Public Choice 112: 259–73. [Google Scholar] [CrossRef]
- Caselli, Francesco, and Guy Michaels. 2013. Do oil windfalls improve living standards? Evidence from Brazil. American Economic Journal: Applied Economics 5: 208–38. [Google Scholar]
- Chelliah, Raja J. 1971. Trends in taxation in developing countries. Staff Papers, International Monetary Fund 18: 254–331. [Google Scholar] [CrossRef]
- De Rosa, Donato, Nishaal Gooroochurn, and Holger Gorg. 2010. Corruption and Productivity: Firm-Level Evidence from the BEEPS Survey. Policy Research Working Paper, World Bank 5348. Geneva: World Bank. [Google Scholar]
- Dell’Anno, Roberto, and Offiong Helen Solomon. 2008. Shadow economy and unemployment rate in USA: Is there a structural relationship? An empirical analysis. Applied Economics 40: 2537–55. [Google Scholar]
- Durkheim, Emile. 1974. Sociology and Philosophy. New York: The Free Press. [Google Scholar]
- Earnhart, Dietrich, and Lubomir Lizal. 2007. Does Better Environmental Performance Affect Revenues, Cost, or Both? Evidence from a Transition Economy. William Davidson Institute Working Paper Number 856. Ann Arbor: William Davidson Institute. [Google Scholar]
- Elgin, Ceyhun, and Cem Oyvat. 2013. Lurking in the cities: Urbanization and the informal economy. Structural Change and Economic Dynamics 27: 36–47. [Google Scholar] [CrossRef] [Green Version]
- Elgin, Ceyhun, and Ferda Erturk. 2019. Informal economies around the world: Measures, determinants and consequences. Eurasian Economic Review 9: 221–37. [Google Scholar] [CrossRef]
- Elgin, Ceyhun. 2020. Shadow Economies around the World: Evidence from Metropolitan Areas. Eastern Economic Journal 46: 301–22. [Google Scholar] [CrossRef]
- Emerson, John W., Angel Hsu, Marc A. Levy, Alex de Sherbinin, Zachary A. Wendling, Valentina Mara, Daniel C. Esty, and Malanding Jaiteh. 2012. Environmental Performance Index and Pilot Trend Environmental Performance Index. New Haven: Yale Center for Environmental Law and Policy. [Google Scholar]
- Esty, Daniel, Marc A. Levy, Christine Kim, Alex de Sherbinin, Tanja Srebotnjak, and Valentina Mara. 2008. Environmental Performance Index. New Haven: Yale Center for Environmental Law and Policy. [Google Scholar]
- Forson, Joseph Ato, Ponlapat Buracom, Guojin Chen, and Theresa Yaaba Baah-Ennumh. 2017. Genuine Wealth Per Capita as a Measure of Sustainability and the Negative Impact of Corruption on Sustainable Growth in Sub-Sahara Africa. South African Journal of Economics 5: 178–95. [Google Scholar] [CrossRef]
- Gallego-Álvarez, Isabel, Purficacion Vicente-Galindo, Purificacion Galindo-Villardón, and Miguel Rodríguez-Rosa. 2014. Environmental Performance in Countries Worldwide: Determinant Factors and Multivariate Analysis. Sustainability 6: 7807–32. [Google Scholar] [CrossRef] [Green Version]
- Goel, Rajeev K., and Rati Ram. 2013. Economic uncertainty and corruption: Evidence from a large cross-country data set. Applied Economics 45: 3462–68. [Google Scholar] [CrossRef]
- Gogolin, Greg. 2010. The digital crime tsunami. Digital Investigation 3: 3–18. [Google Scholar] [CrossRef]
- Gundlach, Erich, and Martin Paldam. 2009. The transition of corruption: From poverty to honesty. Economic Letters 103: 146–48. [Google Scholar] [CrossRef] [Green Version]
- Hair, Joseph F., Jr., William C. Black, Barry J. Babin, and Rolph E. Anderson. 2010. Multivariate Data Analysis, 7th ed. London: Pearson Prentice Hall. [Google Scholar]
- Hoinaru, Razvan, Daniel Buda, Sorin Nicolae Borlea, Viorela Ligia Văidean, and Monica Violeta Achim. 2020. The impact of corruption and shadow economy on the economic and sustainable development. Do they “sand the wheels” or “grease the wheels”? Sustainability 12: 481. [Google Scholar] [CrossRef] [Green Version]
- Husted, Bryan W. 1999. Wealth, culture, and corruption. Journal of International Business Studies 30: 339–59. [Google Scholar] [CrossRef]
- International Telecommunication Union. 2018. Global Cybersecurity Index (GCI). Available online: https://www.itu.int/en/ITU-D/Cybersecurity/Pages/global-cybersecurity-index.aspx (accessed on 25 March 2021).
- Jurj-Tudoran, Remus, and Dan Drosu Șaguna. 2016. Spălarea Banilor (Money Laundering). Bucharest: C. H. Beck Publishing House. [Google Scholar]
- Kirchler, Erich. 2007. The Economic Psychology of Tax Behavior. Cambridge: Cambridge University Press. [Google Scholar]
- Kroll, Stephen R. 1994. Money laundering. A concept paper prepared for the Government of Bulgaria. International Law 65: 835–69. [Google Scholar]
- Kshetri, Nir. 2010. Diffusion and Effects of Cybercrime in Developing Economies. Third World Quarterly 31: 1057–79. [Google Scholar] [CrossRef] [Green Version]
- Leția, A. A. 2014. Investigarea Criminalităţii de Afaceri (Investigation of Business Criminality). Bucharest: Universul Juridic Publishing House. [Google Scholar]
- Mauro, Paolo. 1995. Corruption and growth. The Quarterly Journal of Economics 110: 681–712. [Google Scholar] [CrossRef]
- McAfee. 2018. The Economic Impact of Cybercrime—No Slowing Down. Available online: https://www.mcafee.com/enterprise/en-us/assets/executive-summaries/es-economic-impact-cybercrime.pdf (accessed on 28 January 2021).
- McDowell, John. 2001. The consequence of money laundering and financial crime. Economic Perspective 6: 6–9. [Google Scholar]
- Medina, Leandro, and Friedrich Schneider. 2019. Shedding Light on the Shadow Economy: A Global Database and the Interaction with the Official One. CESifo Working Papers 7981. New York: CESifo. [Google Scholar]
- Merton, Robert K. 1968. Social Theory and Social Structure, Enlarged ed. New York: Free Press. [Google Scholar]
- Murshed, Muntasir, and Farzana Awlad Mredula. 2018. Impacts of Corruption on Sustainable Development: A Simultaneous Equations Model Estimation Approach. Journal of Accounting, Finance and Economics 8: 109–33. [Google Scholar]
- Mussurov, Altay, Dena Sholk, and Gholamreza Reza Arabsheibani. 2019. Informal employment in Kazakhstan: A blessing in disguise? Eurasian Economic Review 9: 267–84. [Google Scholar] [CrossRef] [Green Version]
- Nilson Report. 2020. Card Fraud Worldwide. Issue 1187. Available online: https://nilsonreport.com/about_us.php (accessed on 11 February 2021).
- Numbeo. 2021. Mladen Adamovic. Available online: https://www.numbeo.com/common/motivation_and_methodology.jsp (accessed on 11 February 2021).
- Orviska, Marta, and John Hudson. 2003. Tax evasion, civic duty and the law abiding citizen. European Journal of Political Economy 19: 83–102. [Google Scholar] [CrossRef]
- Paldam, Martin. 2001. Corruption and religion. Adding to the economic model. Kyklos 54: 383–414. [Google Scholar] [CrossRef]
- Paldam, Martin. 2002. The big pattern of corruption: Economics, culture and the see saw dynamics. European Journal of Political Economy 18: 215–40. [Google Scholar] [CrossRef]
- PricewaterhouseCoopers. 2018. Global Economic Crime and Fraud Survey 2018. A Front Line Perspective on Fraud in Romania. London: PricewaterhouseCoopers. [Google Scholar]
- Remeikiene, Rita, Ligita Gaspareniene, and Friedrich Georg Schneider. 2018. The definition of digital shadow economy. Technological and Economic Development of Economy 24: 696–717. [Google Scholar] [CrossRef] [Green Version]
- Ryman-Tubb, Nick F., Paul Krause, and Wolfgang Garn. 2018. How Artificial Intelligence and machine learning research impacts payment, card fraud detection: A survey and industry benchmark. Engineering Applications of Artificial Intelligence 76: 130–57. [Google Scholar] [CrossRef]
- Schneider, Friedrich, and Andreas Buehn. 2018. Shadow Economy: Estimation Methods, Problems, Results and Open Questions. Open Economics 1: 1–29. [Google Scholar] [CrossRef] [Green Version]
- Schneider, Friedrich, and Robert Klinglmair. 2004. Shadow Economies around the World: What do We Know? Working Paper No. 0403. Linz: Universität Linz. [Google Scholar]
- Schneider, Friedrich, Andreas Buehn, and Claudio E. Montenegro. 2010. New estimates for the shadow economies all over the world. International Economic Journal 24: 443–61. [Google Scholar] [CrossRef]
- Schroeder, William R. 2001. Money laundering: A global threat and the international community’s response. FBI Law Enforcement Bulletin 7: 1–9. [Google Scholar]
- Stiglitz, Joseph E., Sen Amartya, and Jean-Paul Fitoussi. 2010. Mis-Measuring OUR Lives: Why GDP Doesn’t Add Up, Commission on the Measurement of Economic Performance and Social Progress. New York: New Press. [Google Scholar]
- Sutherland, Edwin H. 1940. White-collar criminality. American Sociological Review 5: 1–12. [Google Scholar] [CrossRef]
- Świątkowska, Joanna. 2020. Tackling Cybercrime to Unleash Developing Countries’ Digital Potential. Pathways for Prosperity Commission Background. Oxford: University of Oxford. [Google Scholar]
- The OLAF Report 2019. 2020. Luxembourg: Publications Office of the European Union, ISSN 2315-494.
- Torgler, Benno, and Friedrich Schneider. 2007. The Impact of Tax Morale and Institutional Quality on the Shadow Economy. Journal of Economic Psychology 30: 228–45. [Google Scholar] [CrossRef] [Green Version]
- Torgler, Benno, Friedrich Schneider, and Christoph A. Schaltegger. 2010. Local autonomy, tax morale and the shadow economy. Public Choice 144: 293–321. [Google Scholar] [CrossRef] [Green Version]
- Torgler, Benno. 2004. Tax Morale in Asian Countries. Journal of Asian Economics 15: 237–66. [Google Scholar] [CrossRef] [Green Version]
- Transparency International. 2020. Corruption Perception Index. Available online: www.transparency.org/research/cpi/ (accessed on 10 April 2021).
- Treisman, Daniel. 2000. The causes of corruption: A cross-national study. Journal of Public Economics 76: 399–457. [Google Scholar] [CrossRef] [Green Version]
- UNDP Human Development Reports. 2019. Human Development Report. Beyond Income, beyond Averages, beyond Today: Inequalities in Human Development in the 21st Century. Available online: http://hdr.undp.org (accessed on 25 January 2021).
- Williams, Colin C., and Friedrich Schneider. 2016. Measuring the Global Shadow Economy: The Prevalence of Informal Work and Labor. Northampton: Edward Elgar. [Google Scholar]
- World Bank. 2020. World Bank Indicators. Available online: https://data.worldbank.org/indicator (accessed on 10 February 2021).
- Yale University. 2020. Environmental Performance Index 2020. Available online: https://epi.envirocenter.yale.edu (accessed on 15 October 2020).
- Yuki, Kazuhiro. 2007. Urbanization, informal sector, and development. Journal of Development Economics 84: 76–103. [Google Scholar] [CrossRef]
Figure 1.
Corruption Perceptions Index scores in European Union countries, 2020. Source: Authors’ procedure based on Corruption Perceptions Index 2020 (https://www.transparency.org, accessed on 1 January 2021).
Figure 1.
Corruption Perceptions Index scores in European Union countries, 2020. Source: Authors’ procedure based on Corruption Perceptions Index 2020 (https://www.transparency.org, accessed on 1 January 2021).

Figure 2.
Shadow economy (% of GDP) in European Union countries, 2017. Source: Authors’ procedure based on Medina and Schneider (2019).
Figure 2.
Shadow economy (% of GDP) in European Union countries, 2017. Source: Authors’ procedure based on Medina and Schneider (2019).

Figure 3.
The risk of money laundering in European Union countries, 2020. Source: Authors’ procedure based on data from Basel Institute of Governance (2020).
Figure 3.
The risk of money laundering in European Union countries, 2020. Source: Authors’ procedure based on data from Basel Institute of Governance (2020).

Figure 4.
Global Security Index in European Union countries, 2018. Source: Achim et al. (2021b) based on data from Global Security Index 2018 (www.itu.int, accessed on 1 March 2021).
Figure 4.
Global Security Index in European Union countries, 2018. Source: Achim et al. (2021b) based on data from Global Security Index 2018 (www.itu.int, accessed on 1 March 2021).

Figure 5.
GDP per capita (current USD) in European Union countries, 2019. Source: Authors’ procedure based on World Bank Data.
Figure 5.
GDP per capita (current USD) in European Union countries, 2019. Source: Authors’ procedure based on World Bank Data.

Figure 6.
Human Development Index in European Union countries, 2019. Source: Authors’ processings based on Human Development Report 2019 (http://hdr.undp.org, accessed on 1 February 2021).
Figure 6.
Human Development Index in European Union countries, 2019. Source: Authors’ processings based on Human Development Report 2019 (http://hdr.undp.org, accessed on 1 February 2021).

Figure 7.
Financial and economic crime proxies as a function of economic and sustainable development. Source: Authors’ procedure in Stata.
Figure 7.
Financial and economic crime proxies as a function of economic and sustainable development. Source: Authors’ procedure in Stata.


Table 1.
Simple regression modeling.
| (a) Results of Pooled OLS Estimation of Financial and Economic Crime as a Function of GDP | (b) Results of Pooled OLS Estimation of Financial and Economic Crime as a Function of HDI | |||||||
|---|---|---|---|---|---|---|---|---|
| Variables | Log Corruption Model (1a) | Log Shadow Economy Model (2a) | Money Laundering Model (3a) | Log Cybersecurity Model (4a) | Log Corruption Model (1b) | Log Shadow Economy Model (2b) | Money Laundering Model (3b) | Log Cybersecurity Model (4b) |
| LogGDP | −1.1213 *** | −0.4461 *** | 0.2165 ** | 0.0904 *** | ||||
| LogHDI | −12.6941 *** | −4.9475 *** | 1.2141 | 1.212 *** | ||||
| Constant | 14.5884 *** | 7.3078 *** | 2.1923 ** | −1.1881 *** | 1.2865 *** | 2.0281 *** | 4.5943 *** | −0.0866 *** |
| R squared | 0.5133 | 0.5934 | 0.0294 | 0.1207 | 0.3410 | 0.3655 | 0.0042 | 0.1119 |
| Adjusted R squared | 0.5120 | 0.5922 | 0.0249 | 0.1185 | 0.3393 | 0.3637 | 0.0012 | 0.1096 |
| N | 405 | 351 | 216 | 405 | 378 | 351 | 189 | 378 |
Source: Authors’ estimations. Note: Within parentheses there are the p-values and *** designates the 1% significant coefficients, ** designates the 5% significant coefficients, and * designates the 10% significant coefficients.
Table 2.
Simple regression modeling—Robustness checks (1).
| (a) Results of Pooled OLS Estimation of Financial and Economic Crime as a Function of EPI | (b) Results of Pooled OLS Estimation of Financial and Economic Crime as a Function of QLI | |||||||
|---|---|---|---|---|---|---|---|---|
| Variables | Log Corruption Model (1a) | Log Shadow Economy Model (2a) | Money Laundering Model (3a) | Log Cybersecurity Model (4a) | Log Corruption Model (1b) | Log Shadow Economy Model (2b) | Money Laundering Model (3b) | Log Cybersecurity Model (4b) |
| EPI | −0.0541 *** | −0.0266 *** | 0.0023 | 0.0046 *** | ||||
| QLI | −0.0171 *** | −0.0054 *** | −0.0056 *** | 0.0014 *** | ||||
| Constant | 7.18451 *** | 4.7455 *** | 4.2525 *** | −0.6118 *** | 5.6413 *** | 3.4966 *** | 5.1296 *** | −0.4666 *** |
| R squared | 0.1747 | 0.3082 | 0.0049 | 0.0465 | 0.3864 | 0.3726 | 0.0758 | 0.1311 |
| Adjusted R squared | 0.1725 | 0.3062 | 0.0005 | 0.044 | 0.3830 | 0.3679 | 0.0713 | 0.1269 |
| N | 378 | 351 | 189 | 378 | 183 | 135 | 208 | 208 |
Source: Authors’ processing. Note: Within parentheses there are the p-values and *** designates the 1% significant coefficients, ** designates the 5% significant coefficients, and * designates the 10% significant coefficients.
Table 3.
Simple regression modeling—Robustness checks (2), with Unemployment.
| (a) Results of Pooled OLS Estimation of Financial and Economic Crime as a Function of GDP, with Unemployment as Macro control | (b) Results of Pooled OLS Estimation of Financial and Economic Crime as a Function of HDI, with Unemployment as Macro control | |||||||
|---|---|---|---|---|---|---|---|---|
| Variables | Log Corruption Model (1a) | Log Shadow Economy Model (2a) | Money Laundering Model (3a) | Log Cybersecurity Model (4a) | Log Corruption Model (1b) | Log Shadow Economy Model (2b) | Money Laundering Model (3b) | Log Cybersecurity Model (4b) |
| LogGDP | −1.1219 *** | −0.4465 *** | 0.2005 ** | 0.0912 *** | ||||
| LogHDI | −12.5517 *** | −5.0795 *** | 2.8448 ** | 1.1793 *** | ||||
| Unemployment | 0.0405 *** | 0.0014 | 0.0675 *** | −0.0051 *** | 0.0105 | −0.0098 ** | 0.0757 *** | −0.0024 |
| Constant | 14.2812 *** | 7.3007 *** | 1.8765 ** | −1.1567 *** | 1.2281 *** | 2.0838 *** | 4.2447 *** | −0.0732 ** |
| R squared | 0.5387 | 0.5937 | 0.1615 | 0.1362 | 0.3429 | 0.377 | 0.1591 | 0.1154 |
| Adjusted R squared | 0.5362 | 0.5913 | 0.1525 | 0.1315 | 0.3394 | 0.3735 | 0.1501 | 0.1107 |
| N | 378 | 351 | 189 | 378 | 378 | 351 | 189 | 378 |
Source: Authors’ processing. Note: Within parentheses there are the p-values and *** designates the 1% significant coefficients, ** designates the 5% significant coefficients, and * designates the 10% significant coefficients.
Table 4.
Simple regression modeling—Robustness checks (2) with Urbanization rate.
| (a) Results of Pooled OLS Estimation of Financial and Economic Crime as a Function of GDP, with Urban as Macro control | (b) Results of Pooled OLS Estimation of Financial and Economic Crime as a Function of HDI, with Urban as Macro control | |||||||
|---|---|---|---|---|---|---|---|---|
| Variables | Log Corruption Model (1a) | Log Shadow Economy Model (2a) | Money Laundering Model (3a) | Log Cybersecurity Model (4a) | Log Corruption Model (1b) | Log Shadow Economy Model (2b) | Money Laundering Model (3b) | Log Cybersecurity Model (4b) |
| LogGDP | −1.1072 *** | −0.4455 *** | 0.2341 ** | 0.0897 *** | ||||
| LogHDI | −12.7138 *** | −4.9564 *** | 1.2326 | 1.2119 *** | ||||
| Urbanization | 0.0024 | 0.0007 | 0.0023 | 0.0001 | 0.0033 * | 0.0011 * | 0.0023 | 0.0001 |
| Constant | 14.2868 *** | 7.2567 *** | 1.8928 * | −1.1858 *** | 1.0707 *** | 1.9534 *** | 4.4503 *** | −0.0875 * |
| R squared | 0.5140 | 0.5953 | 0.0375 | 0.1204 | 0.3470 | 0.3705 | 0.0086 | 0.1119 |
| AdjustedR squared | 0.5114 | 0.5930 | 0.0272 | 0.1157 | 0.3435 | 0.3669 | 0.0021 | 0.1072 |
| N | 378 | 351 | 189 | 378 | 378 | 351 | 189 | 378 |
Source: Authors’ processing. Note: Within parentheses there are the p-values and *** designates the 1% significant coefficients, ** designates the 5% significant coefficients, and * designates the 10% significant coefficients.
Publisher’s Note: MDPI stays neutral with regard to jurisdictional claims in published maps and institutional affiliations. |
© 2021 by the authors. Licensee MDPI, Basel, Switzerland. This article is an open access article distributed under the terms and conditions of the Creative Commons Attribution (CC BY) license (https://creativecommons.org/licenses/by/4.0/).
Share and Cite
MDPI and ACS Style
Achim, M.V.; Văidean, V.L.; Borlea, S.N.; Florescu, D.R. The Impact of the Development of Society on Economic and Financial Crime. Case Study for European Union Member States. Risks 2021, 9, 97. https://doi.org/10.3390/risks9050097
AMA Style
Achim MV, Văidean VL, Borlea SN, Florescu DR. The Impact of the Development of Society on Economic and Financial Crime. Case Study for European Union Member States. Risks. 2021; 9(5):97. https://doi.org/10.3390/risks9050097
Chicago/Turabian StyleAchim, Monica Violeta, Viorela Ligia Văidean, Sorin Nicolae Borlea, and Decebal Remus Florescu. 2021. "The Impact of the Development of Society on Economic and Financial Crime. Case Study for European Union Member States" Risks 9, no. 5: 97. https://doi.org/10.3390/risks9050097
Note that from the first issue of 2016, this journal uses article numbers instead of page numbers. See further details here.