Evaluation of Spectral Indices for Assessing Fire Severity in Australian Temperate Forests


1
School of Ecosystem and Forest Sciences, The University of Melbourne, 500 Yarra Boulevard, Richmond, Victoria 3121, Australia
2
Faculty of Environment, Vietnam National University of Agriculture, Ngo Xuan Quang Street, Trauquy, Gialam, Hanoi, Vietnam
3
Department of Geology, Geography and Environment, University of Alcala, C. Colegios 2, 28801 Alcala de Henares, Spain
4
School of Ecosystem and Forest Sciences, The University of Melbourne, 4 Water Street, Creswick, Victoria 3363, Australia
*
Author to whom correspondence should be addressed.
Remote Sens. 2018, 10(11), 1680; https://doi.org/10.3390/rs10111680
Submission received: 4 September 2018
/
Revised: 19 October 2018
/
Accepted: 22 October 2018
/
Published: 24 October 2018
(This article belongs to the Section Forest Remote Sensing)
Abstract
:Spectral indices derived from optical remote sensing data have been widely used for fire-severity classification in forests from local to global scales. However, comparative analyses of multiple indices across diverse forest types are few. This represents an information gap for fire management agencies in areas like temperate south-eastern Australia, which is characterised by a diversity of natural forests that vary in structure, and in the fire-regeneration strategies of the dominant trees. We evaluate 10 spectral indices across eight areas burnt by wildfires in 1998, 2006, 2007, and 2009 in south-eastern Australia. These wildfire areas encompass 13 forest types, which represent 86% of the 7.9M ha region’s forest area. Forest types were aggregated into six forest groups based on their fire-regeneration strategies (seeders, resprouters) and structure (tree height and canopy cover). Index performance was evaluated for each forest type and forest group by examining its sensitivity to four fire-severity classes (unburnt, low, moderate, high) using three independent methods (anova, separability, and optimality). For the best-performing indices, we calculated index-specific thresholds (by forest types and groups) to separate between the four severity classes, and evaluated the accuracy of fire-severity classification on independent samples. Our results indicated that the best-performing indices of fire severity varied with forest type and group. Overall accuracy for the best-performing indices ranged from 0.50 to 0.78, and kappa values ranged from 0.33 (fair agreement) to 0.77 (substantial agreement), depending on the forest group and index. Fire severity in resprouter open forests and woodlands was most accurately mapped using the delta Normalised Burnt ratio (dNBR). In contrast, dNDVI (delta Normalised difference vegetation index) performed best for open forests with mixed fire responses (resprouters and seeders), and dNDWI (delta Normalised difference water index) was the most accurate for obligate seeder closed forests. Our analysis highlighted the low sensitivity of all indices to fire impacts in Rainforest. We conclude that the optimal spectral index for quantifying fire severity varies with forest type, but that there is scope to group forests by structure and fire-regeneration strategy to simplify fire-severity classification in heterogeneous forest landscapes.

1. Introduction
Wildfire is considered an important disturbance agent, with a long history of shaping landscape patterns and ecosystem processes, relating to both vegetation distributions and physical structures [1,2]. Large-area wildfires can affect climate cycles at a global scale [3] while, at landscape scales, wildfires influence vegetation structure by partially or completely removing strata [4], and also influence vegetation patterns [5,6]. Assessment of wildfire effects in natural ecosystems is needed to select remedial post-fire treatments [7], to inform monitoring and planning of vegetation recovery [8], and to provide appropriate baselines for future landscape management [9].
Wildfire severity can be remotely sensed using either active or passive sensors, typically involving techniques such as spectral unmixing, simulation techniques, and spectral indices [10]. Spectral indices based on passive data are popular for providing information on fire severity due to their computational and conceptual simplicity [11]. Such indices often combine information from visible, near-infrared, and mid-infrared portions of the electromagnetic spectrum [7,12,13,14]. These bands are sensitive to variations in soil colour (visible and mid-infrared), soil composition (mid-infrared), and moisture and chlorophyll (near infrared), which are all land and vegetation properties that can be significantly affected by fire [14].
Spectral indices have been extensively tested in boreal forests, temperate conifer and deciduous forests, and Mediterranean forests. The capacity of spectral bands from the red to the mid-infrared spectral regions for fire severity estimation has been proved for different ecosystems such as African savannah [15] or Mediterranean ecosystems [16]. The Normalised Difference Vegetation Index (NDVI) has been among the most popular indices used to estimate fire severity classes within both uni-temporal (post-fire) and bi-temporal (pre-/post-fire difference) approaches [11,17]. The Normalised Burn Ratio (NBR) has also been identified as useful for estimating fire severity across a range of conditions [18]. For example, Epting, et al. [19] tested 13 indices for discriminating fire severity classes across Alaska, and confirmed that post-fire NBR gave the best correlations with field damage, followed by delta NBR (dNBR). In a detailed review, French, et al. [20], documented 41 studies worldwide that utilised moderate and coarse resolution satellite data to extract NBR and dNBR data to assess fire severity, including 26 studies that successfully used Landsat imagery for mapping fire severity. Landsat-derived NBR is used as an operational management tool in the USA through the Burned Area Emergency Rehabilitation (BAER) project that generates fire severity maps across the USA [21]. However, previous research has indicated that the performance of the NBR varies among ecoregions and vegetation types [20,22,23,24,25]. As such, the NBR approach needs to be tested for different areas and ecosystems [22,26,27,28], including its capacity to quantitatively classify different classes of fire severity generally [25], and particularly in previously under-examined ecosystems like temperate evergreen broadleaf forests [11]. In addition, variation of spectral indices with plant fire response traits or post fire regeneration remains under-examined, and there remains scope to examine the utility of thermal bands in discriminating among fire severity levels in a range of ecosystems [29,30,31].
Using the temperate forests of south-eastern Australia as a case study, we examine the capacity of Landsat-derived spectral indices to reliably detect fire severity. Forests in the south-eastern state of Victoria are structurally diverse and dominated by trees with diverse fire-response traits. In addition, about 8.6 million hectares of the south-eastern Australian state of Victoria was burnt by wildfires in the period 1952–2014, with half of that area (4.3 million hectares) burnt by wildfires between 2003 and 2014 [6], providing recent and diverse examples of fire severity/ forest type interactions. We compared the performance of ten Landsat-derived spectral indices to assess fire severity across 13 forest types varying in tree height, canopy cover, and post-fire regeneration strategies. We utilised Landsat 5 TM imagery due to the high spatial resolution (30 m) and the availability of long-term archives [32]. Our study addressed three research questions:
- Do different eucalypt forest types require different optical spectral indices for wildfire severity estimation?
- Do functionally-equivalent eucalypt forest types (i.e., same structure and post-fire regeneration strategy) have a similar spectral response, and thus, is there a single index that could be used for each forest functional group?
- How accurately can we map fire severity when using spectral indices selected by forest type and/ or forest group?
To address these research questions, we first conducted a sensitivity analysis to evaluate the capacity of spectral indices to distinguish fire severity classes by forest types and forest functional groups. We then used a cross-validation approach to quantify the accuracy of the best-performing indices, and to provide recommendations on spectral indices use for fire severity estimation in temperate eucalypt forests.
2. Materials and Methods
2.1. Study Area and Forest Types
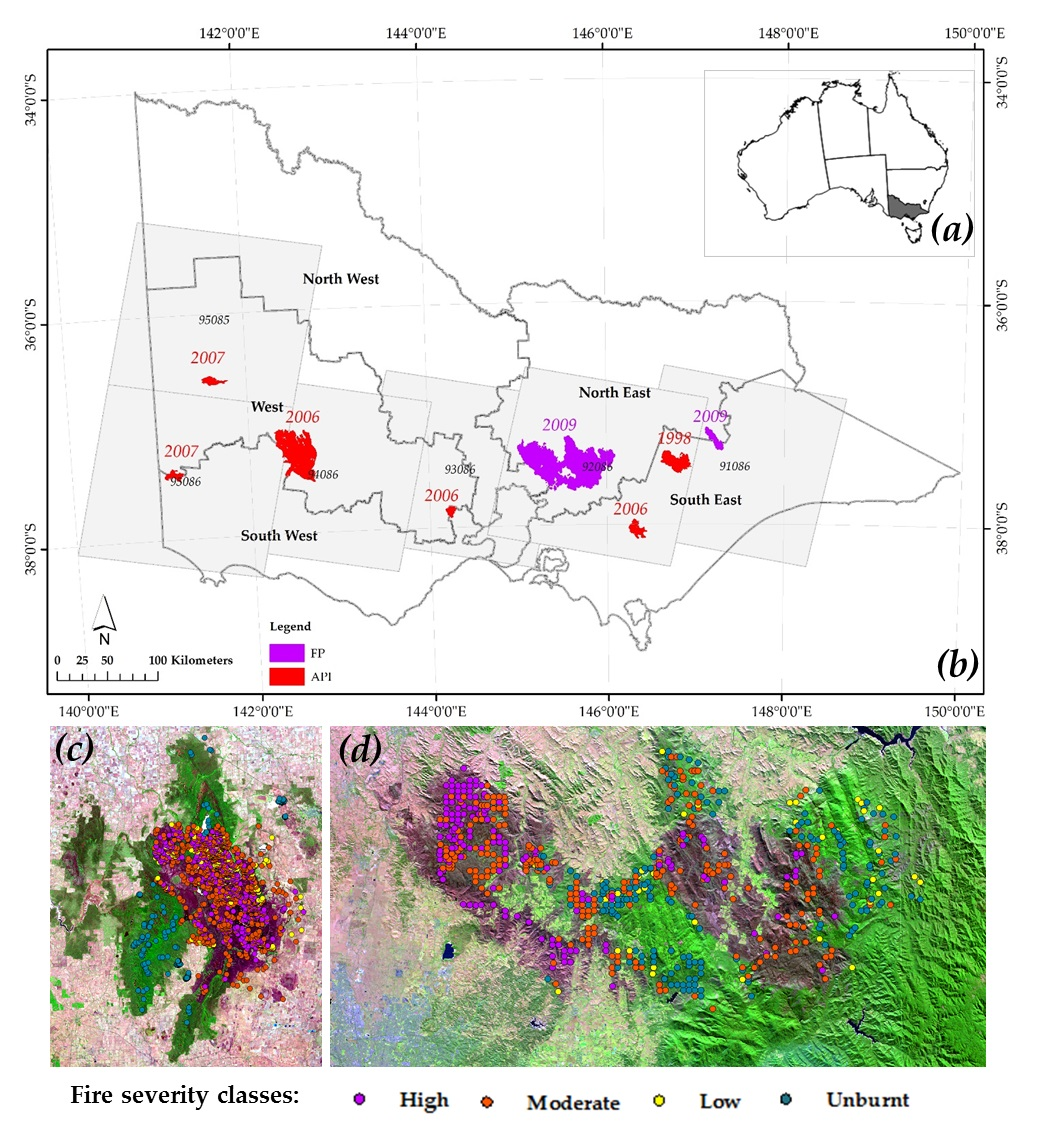
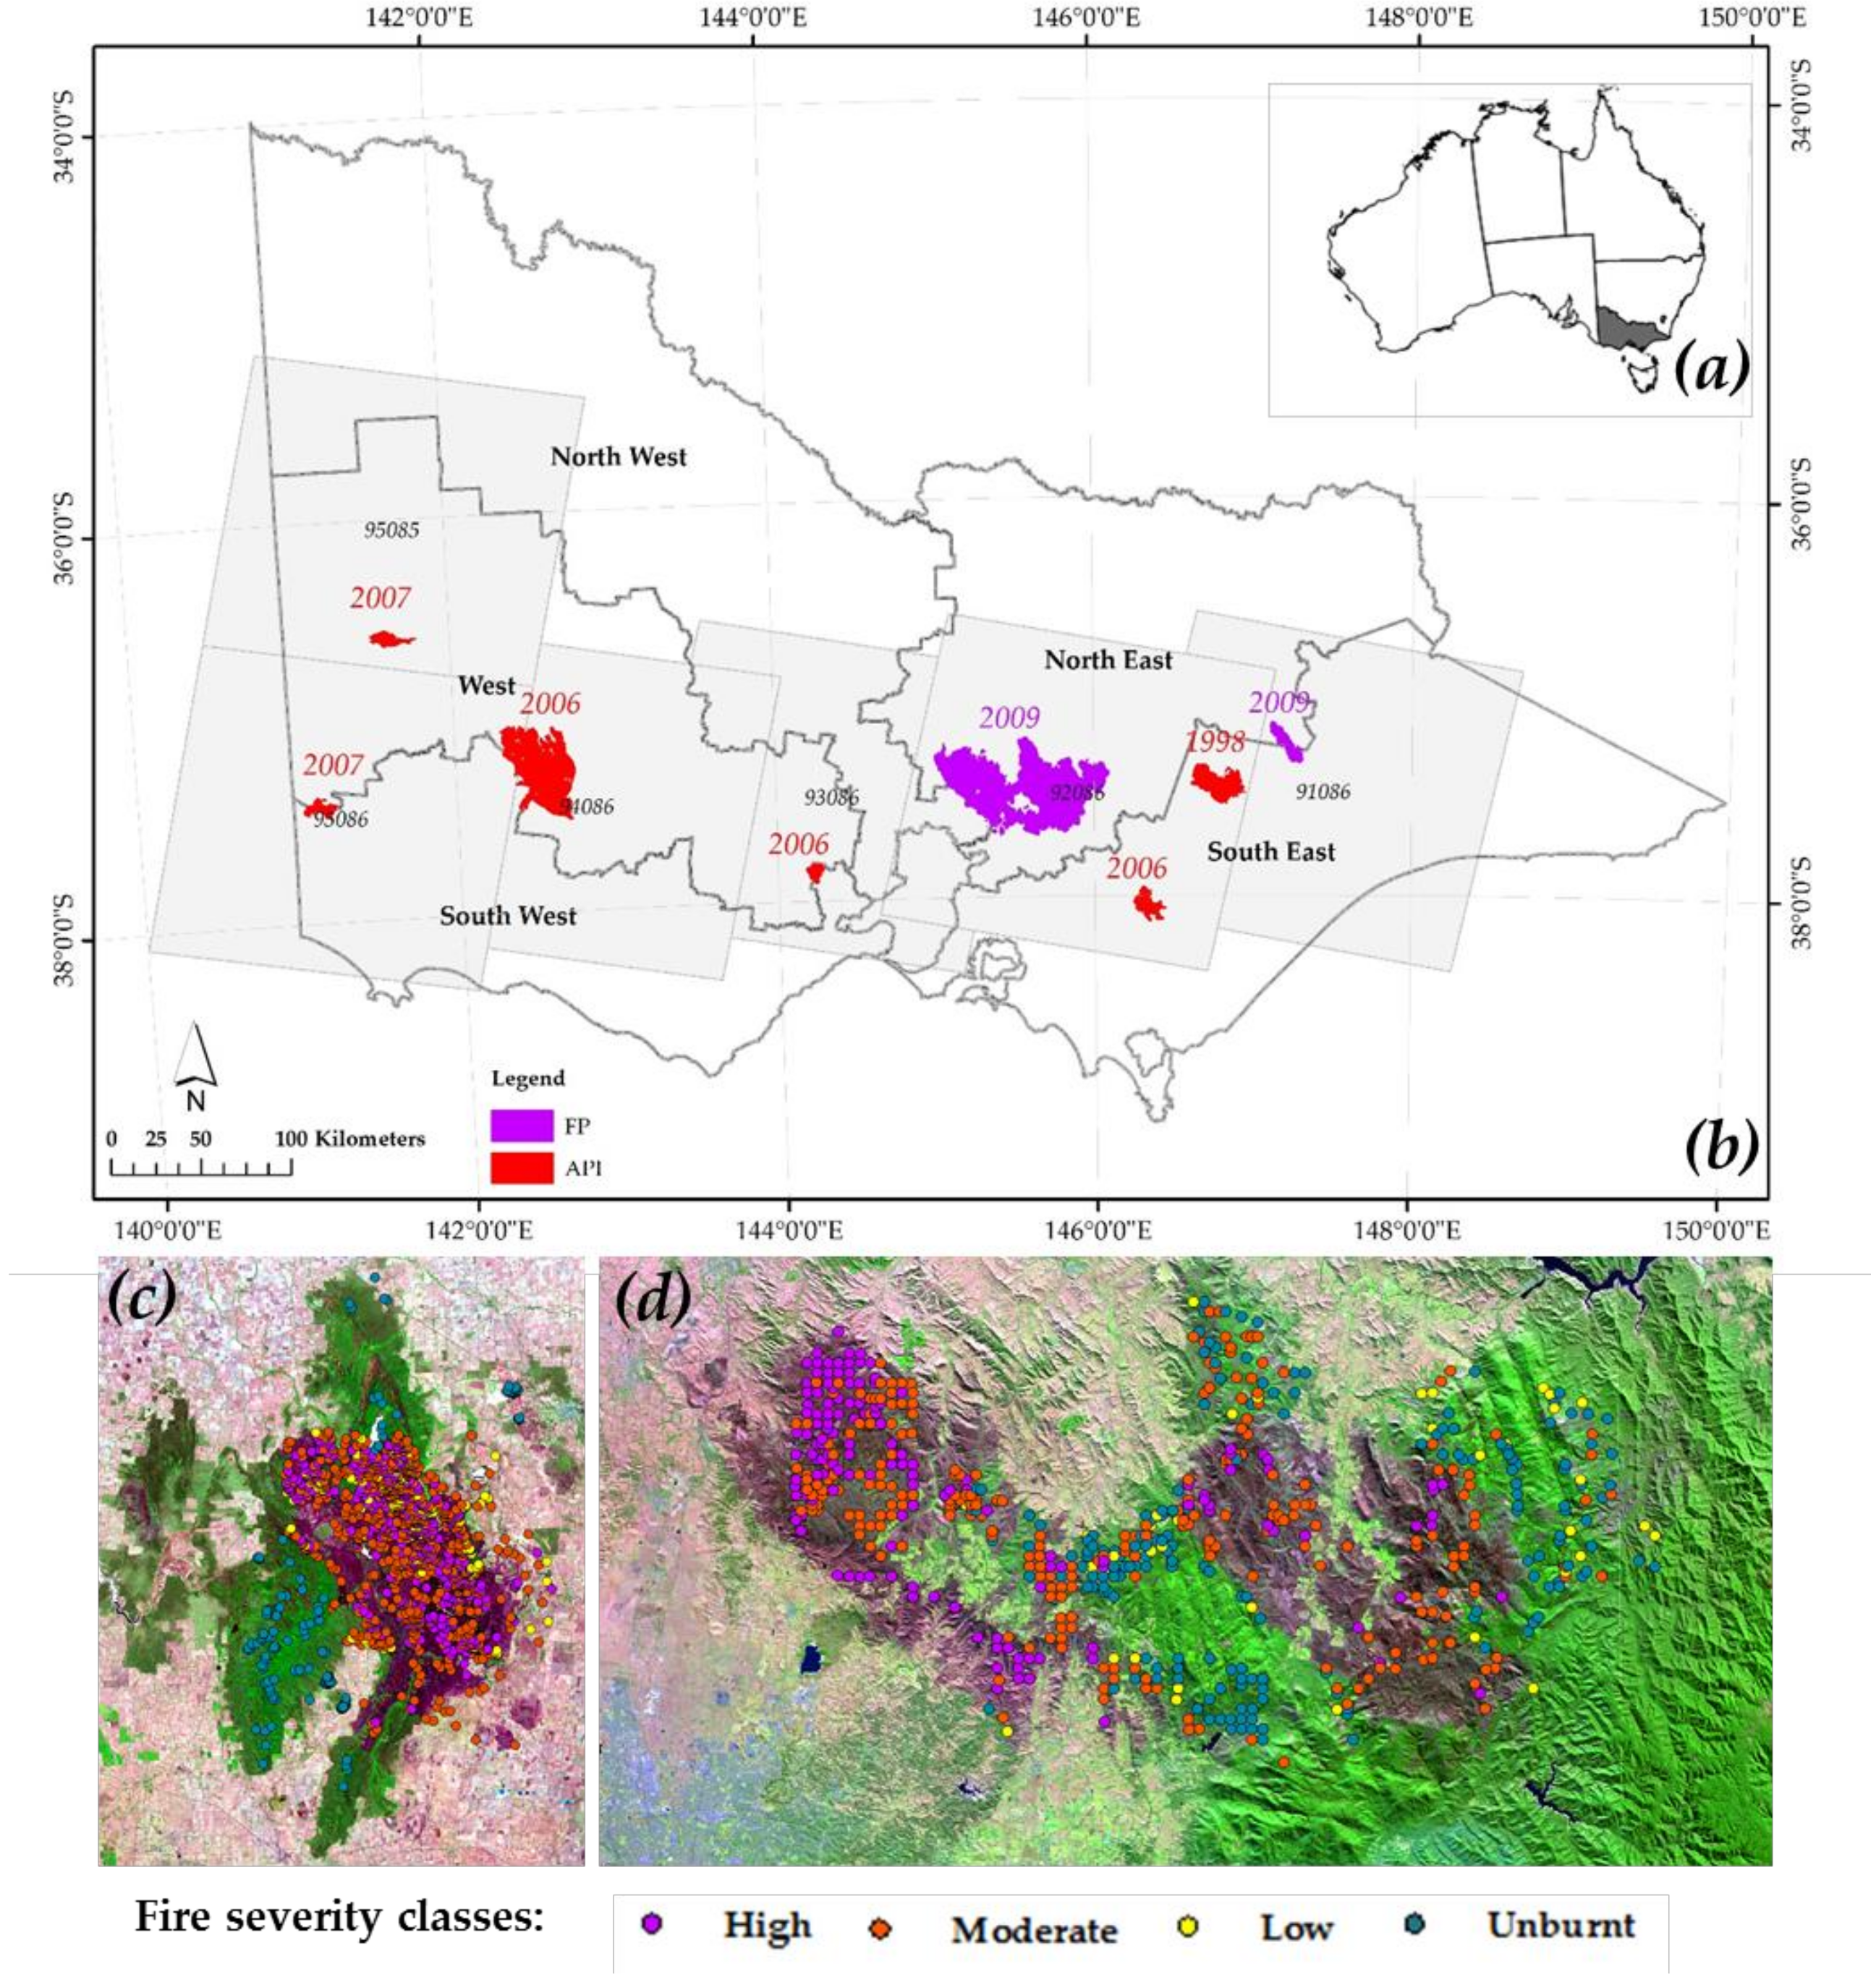
The study area included the state of Victoria, south-eastern Australia (Figure 1). The state’s climate is temperate with mean annual temperatures ranging from 12.6 °C in the South East region to 14.7 °C in the North and North West regions [33]. Annual mean precipitation in Victoria ranges from 300 mm to 2500 mm, and is distributed throughout the year [34]. Australia is one of the most fire-prone countries worldwide [34]. South-eastern Australia is considered to have a regime of infrequent wildfires [34] occurring mainly in summer, but also in spring and autumn [35]. Wildfire-history data indicate that 4.3 million ha of Victoria’s forests were burned by wildfires between 2003 and 2014, which was roughly equal to the total forest area burnt in the preceding 50 years (4.4 million ha) [6].
The study’s wildfire area encompassed up to 17 broad-leaf evergreen forest types, locally known as Ecological Vegetation Divisions [36]. For this study we selected the 13 most extended forest types (Table 1) encompassing 86% of Victoria’s forest area, and representing 60% of the wildfire-burned area in Victoria over the past three decades [37]. The 13 forest types were classified in terms of their structure (namely canopy height and canopy cover, following [38]), and the post-fire regeneration strategy of the dominant tree species (i.e., resprouters -R, obligate seeders -S, and resprouters with obligate seeders -RS). Resprouter species (R) are typically fire-tolerant eucalypts that survive most fires via either basal or epicormic resprouts; Obligate seeder species (S) are fire sensitive and are often wholly-killed by wildfire, and rely on seed to regenerate; and RS forests are co-dominated by both type of species [6,39]. The 13 forest types were classified into six forest ‘functional’ groups: open forest resprouter (OF-R); closed forest resprouter (CF-R); woodland resprouter (WR); low woodland resprouter (LW-R); open forest mixed traits (OF-RS), and closed forest obligate seeder (CF-S).
2.2. Reference Fire-Severity Data
Reference data were comprised of 3826 plots (Figure 1), including (i) 502 field plots, where fire severity was assessed within two months after a large wildfire (258,125 ha) and one smaller wildfire (14,334 ha) in 2009; and (ii) 3324 plots within the boundaries of six other major wildfires (>5000 ha each), where fire severity was estimated through aerial photo interpretation (API). The API severity estimates were available as polygons. A point vector file containing the 3324 plots was generated by taking the centroids of polygons resulting from the intersection of fire severity classes and forest types for each wildfire. All reference data (field and API estimates) were provided by the Victorian Department of Environment, Water, Land, and Planning (DEWLP), which had classified fire severity as Unburnt: less than 1% of eucalypt and non-eucalypt crowns scorched; Low severity: light scorch of 1–35% of eucalypt and non-eucalypt crowns; Moderate severity: 30–65% of eucalypt and non-eucalypt crowns scorched; High severity: 70–100% of eucalypt and non-eucalypt crowns burnt [37]. Overall, reference data included a minimum of 20 plots for each forest type and fire-severity class combination, with ca. 15% of all plots being in each of the Unburnt and Low severity classes, ca. 45% in the Moderate severity class and ca. 25% in the High severity class (Supplementary Table S1).
2.3. Remote Sensing Data
Sixteen Landsat 5 TM scenes (pre- and post-fire images) were obtained from the U.S. Geological Survey (USGS) Earth Explorer [40] to cover the eight fires included in the analysis. When possible, images were selected within two months before and after the fire to minimise effects of differences in forest phenology and atmospheric conditions at the time of acquisition (Supplementary Table S2). The original thermal band spatial resolution of 120 m was resampled at 30 m to match the resolution of the remaining bands. The images were masked for clouds and shadows using the Fmask algorithm [40], which has a proven accuracy of 96.4% [41]. The masked images were atmospherically corrected using Atmospheric Correction for rugged terrain (ACTOR 3) in ERDAS IMAGINE 2014 software [42].
2.4. Spectral Indices
We tested ten spectral indices and the temporal differences (delta versions which calculate the change between pre-fire and post-fire spectral index values) that are commonly used to assess fire severity (Table 2). These indices were computed for each of our 3826 reference plots using a combination of Landsat 5 TM spectral bands 3, 4, 5, 6, and 7. These indices were selected based on their sensitivities to changes in forest ecosystems status and their capacities for fire severity assessment, as demonstrated by previous studies encompassing a wide range of biomes and forest types [11,17,19,20,21,22,30,32,47,48,49,50,51,52,53].
2.5. Data Analysis
2.5.1. Sensitivity Analysis of Spectral Indices
Three lines of evidence were used to analyse the sensitivity of the ten spectral indices to fire severity: (i) analysis of variance (ANOVA) and pairwise comparisons, (ii) the separability index (M), and (iii) the optimality values (O). First, we used a one-way ANOVA per index, with fire severity as a fixed factor, followed by pairwise Tukey Simultaneous comparisons. Second, we calculated the separability index (M) between severity classes for each spectral index as Equation (1).
where and were the mean values of the considered spectral band for the four fire-severity classes, and are the corresponding standard deviations, and n takes the values 1, 2, and 3 when analysing separability between Unburnt to Low, Low to Moderate, and Moderate to High classes [61]. The higher the separability index M, the better the discrimination between two classes. To evaluate the overall spectral index sensitivity across all fire-severity classes, we calculated the average value M for each index per forest type (AVG Mindex) as Equation (2).
with different weights (0.1, 0.3 and 0.6) assigned to reflect the operational importance of distinguishing between fire-severity classes. That is, we considered it more important that an index could distinguish between moderate and high severity wildfire areas (given the greater potential of the latter to influence forest structure and regeneration) than between unburnt and low-severity wildfire areas (since low-severity wildfires, by definition, had minimal influence on tree crowns).
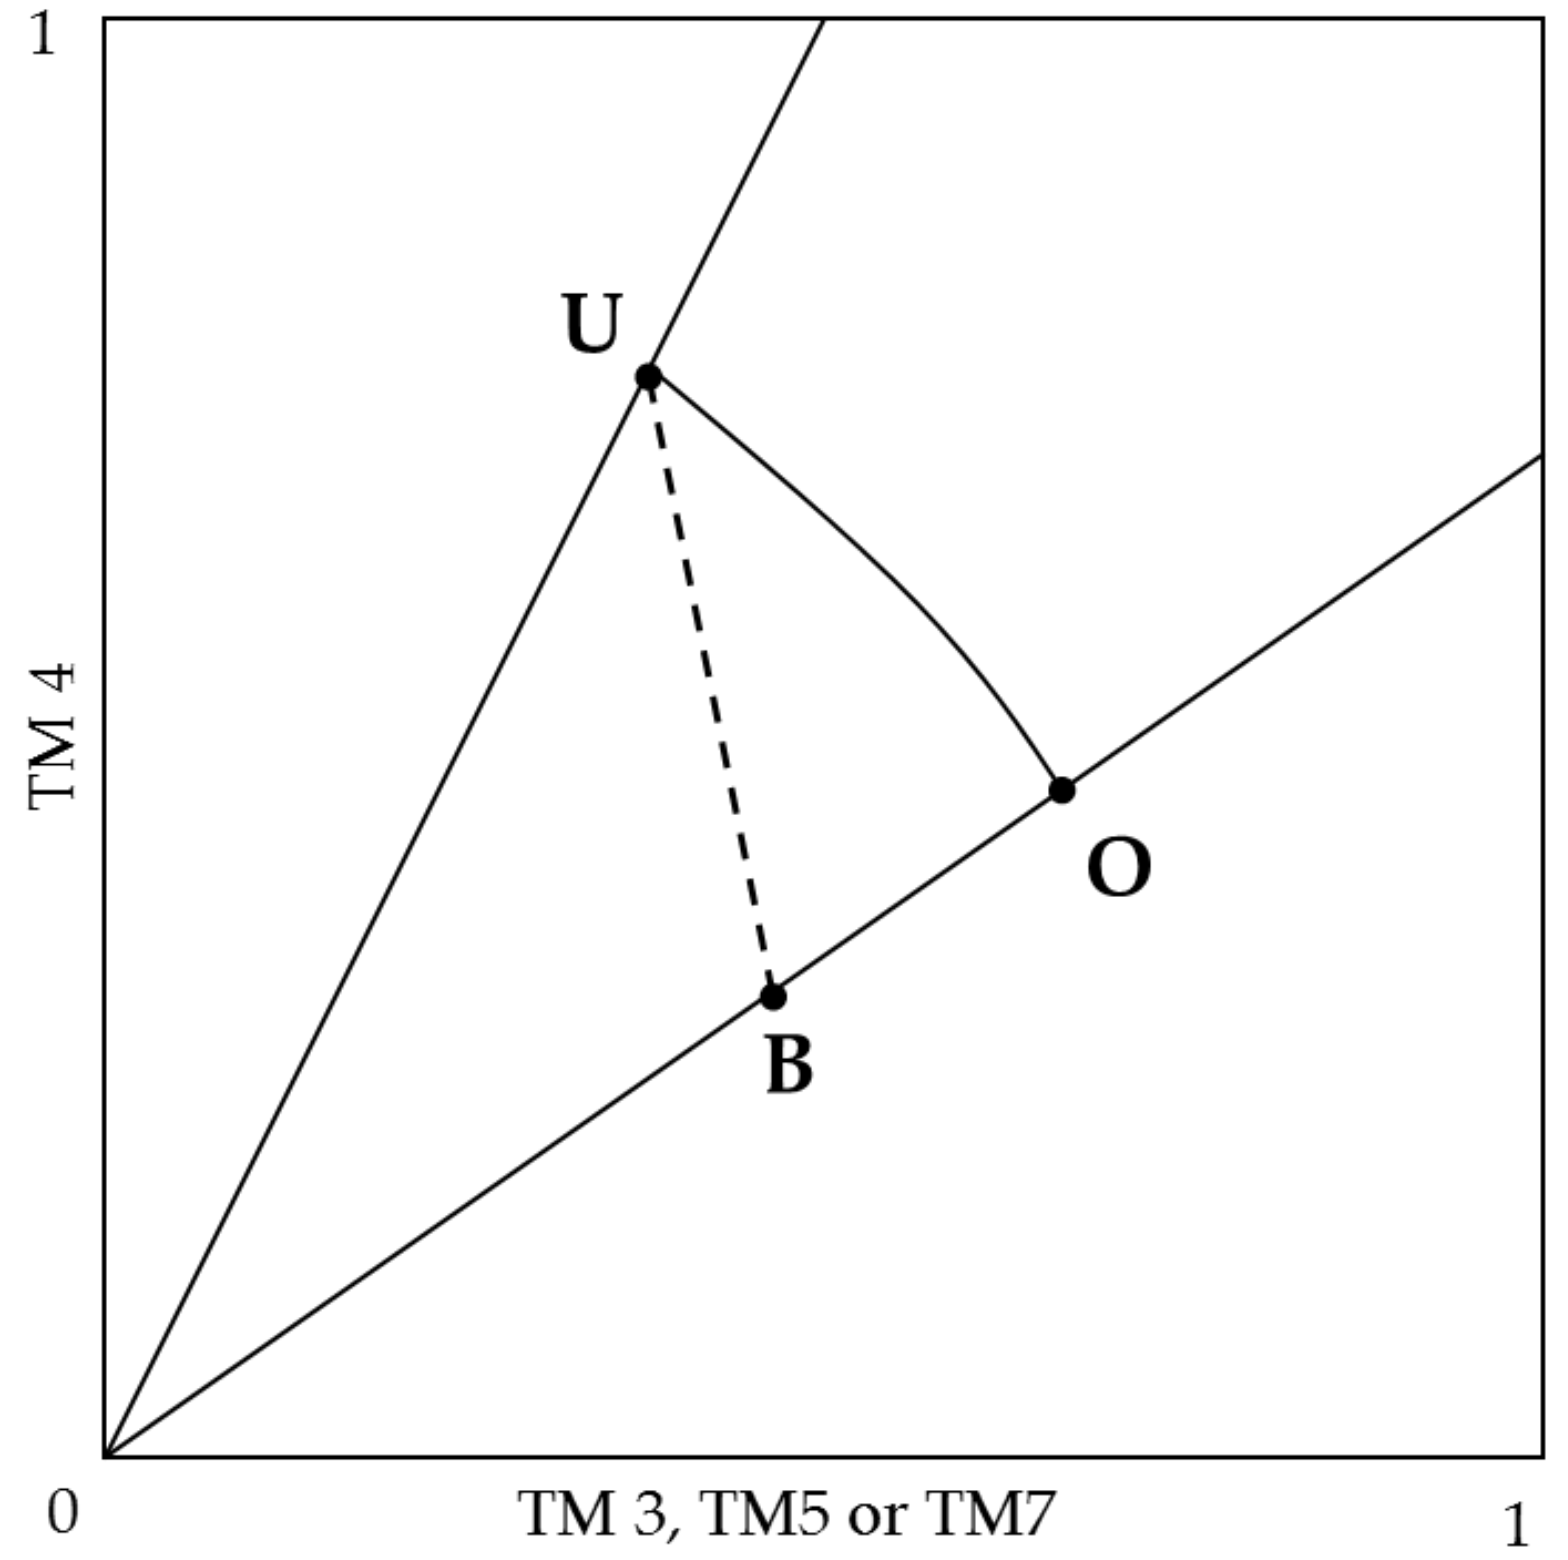
Last, we used the optimality index to evaluate which index was most sensitive to post-fire reflectance changes [11,17,62]. The optimality index is based on the displacement of pixel reflectance values from unburned (U) to burned (B) after a fire (Figure 2). Point O resembles the position of an optimally-sensed burned pixel. An index that is sensitive to a burned pixel would be sensitive to the displacement |UB| and comparatively insensitive to the displacement |OB|, with index optimality calculated as in Equation (3) [17,62].
Because |OB| is never larger than |UB|, the optimality value varies between zero and one. When the optimality value equals 0, the index is completely insensitive to the change of interest. Conversely, when the optimality value equals 1, the index is ideal for quantifying the spectral changes [11,17]. We calculated three optimality values for each index, relating to each of the severity-class comparisons: Unburnt and Low, Low and Moderate, and Moderate and High classes. As for the M analysis, an overall optimality value was computed for each spectral index as a weighted average of the three values (Equation (4)).
where O1, O2, and O3 are optimality median values for low, moderate, and high severity respectively. We chose the median as an estimator of central tendency because it is more robust and less affected by outliers and skewness than the mean [63].
AVG Optimality = 0.1*O1 + 0.3*O2 + 0.6*O3
The capacity of each spectral index to distinguish between fire-severity classes in each analysis was scored using the criteria in Table 3. The overall performance of each index was then indicated as the sum of the three scores (one per analysis) per forest type. The best performing spectral indices were then identified for each forest group by averaging the aggregate scores of the forest types forming that group.
2.5.2. Index Accuracy Assessment
Using the reference data, we assessed the accuracy of the fire severity predicted using the best-performing indices selected for each forest type and each forest functional group. Reference fire severity data were randomly divided into training and validation datasets (60/40) for each fire severity class and forest type or group [64]. Threshold values were estimated by taking the mean of the median index values for each consecutive pair of fire-severity classes, namely: unburnt-low; low-moderate, and moderate-high [65]. In addition, thresholds were also estimated to separate unburned and low-severity classes from moderate and high severity classes. Confusion matrices and error metrics (i.e., overall accuracy–OA, commission errors—CE, and omission errors—OE) were used to characterise fire severity classification errors with the estimated thresholds [66,67]. In addition, Cohen’s kappa statistic, k, was used to assess the agreement between the reference and predicted classes [68]. Kappa values range from 0 (chance level agreement) to 1 (perfect agreement) [69], and were interpreted using the following guidelines [70]: no agreement (k < 0); poor agreement (0–0.20); fair agreement (0.21–0.40); moderate agreement (0.41–0.60); substantial agreement (0.61–0.80); and almost perfect agreement (0.81–1.00).
3. Results
3.1. Sensitivity of Spectral Indices to Fire Severity Classes
Overall, the capacity of spectral indices to distinguish between fire-severity classes varied by forest type and method of evaluation (Supplementary Table S3; Supplementary Figures S2–S4). Nonetheless, there was generally good correspondence between the highest total scores for forest types within the same functional group (Table 4), suggesting that, in most cases, forest types in a group showed similar spectral responses to fire, and thus, that one or two best-performing indices could be selected for each group.
The dNDWI was one of two best-performing spectral indices for three of our six forest groups, encompassing Open forest resprouters (OF-R, average score 1.9), Woodland resprouters (W-R, 1.75), and Closed forest seeders (CF-S, 2.13; Table 4). Similarly, the dNBR also performed well for two resprouter groups (OF-R, 2.2; W-R 2.08). Of the remaining indices, the dMSAVI and the dNBRT were identified as indices that performed well for more than one forest group, although lower average scores (CF-S, 1.63; Low woodland resprouter; LW-R, 1.25) indicated reduced consistency in distinguishing between fire-severity classes. The dMIRBI index performed comparably with dNBRT for the LW-R forest group (i.e., average score 1.25; Table 4), but did not reliably distinguish between fire-severity classes in all other forest types (Supplementary Figure S2). Similarly, average group scores for dNDVI were generally low, peaking at 1.75 for Riparian forest, which, as the only representative of the OF-RS group, had comparatively low total scores (<1.75) across all spectral indices (Table 4). No spectral index successfully distinguished between fire-severity classes in Closed-forest, the sole representative of the Closed forest resprouter group. dVI6T, dBAI, dMSAVI, and dCSI were not among the best-performing indices for any of our forest groups, reflecting relatively poor capacity to distinguish between fire-severity classes in most of the forest types studied (Table 4).
A correlation analysis between scoring resulted from the index sensitivity analysis and the overall accuracies (see below) at the forest functional group level showed a positive and significant agreement between both results (r = 0.87, Supplementary Figure S1), providing support to our scoring system.
3.2. Index Accuracy Assessment
Applying the computed thresholds (Supplementary Table S4) to the best-performing spectral indices per forest group resulted in overall accuracies (OA) ranging from 0.50 (the dNBRT for LW-R) to 0.82 (the dNDVIT for OF-RS; Table 5). The OA did not vary markedly among the two to three best-performing indices for each forest group or type (Table 5), and the OA at the level of forest functional group was closely related with the OA at the level of individual forest type (Supplementary Figure S1).
Kappa (k) values generally reflected OA, and were least for dNBRT for LW-R (0.33) and greatest for dNDVIT for OF-RS (0.77; Table 5). Substantial agreement (k > 0.61) between predicted and reference fire-severity data was indicated for the best-performing indices for OF-RS, both alone and when combined with the Inland Plains Woodland (Table 5). Moderate agreement (k > 0.41) was observed for all other index-forest group combinations, except for forest groups LW-R (0.33–0.36) and CF-S (0.37; Table 5), where kappa values indicated only fair agreement.
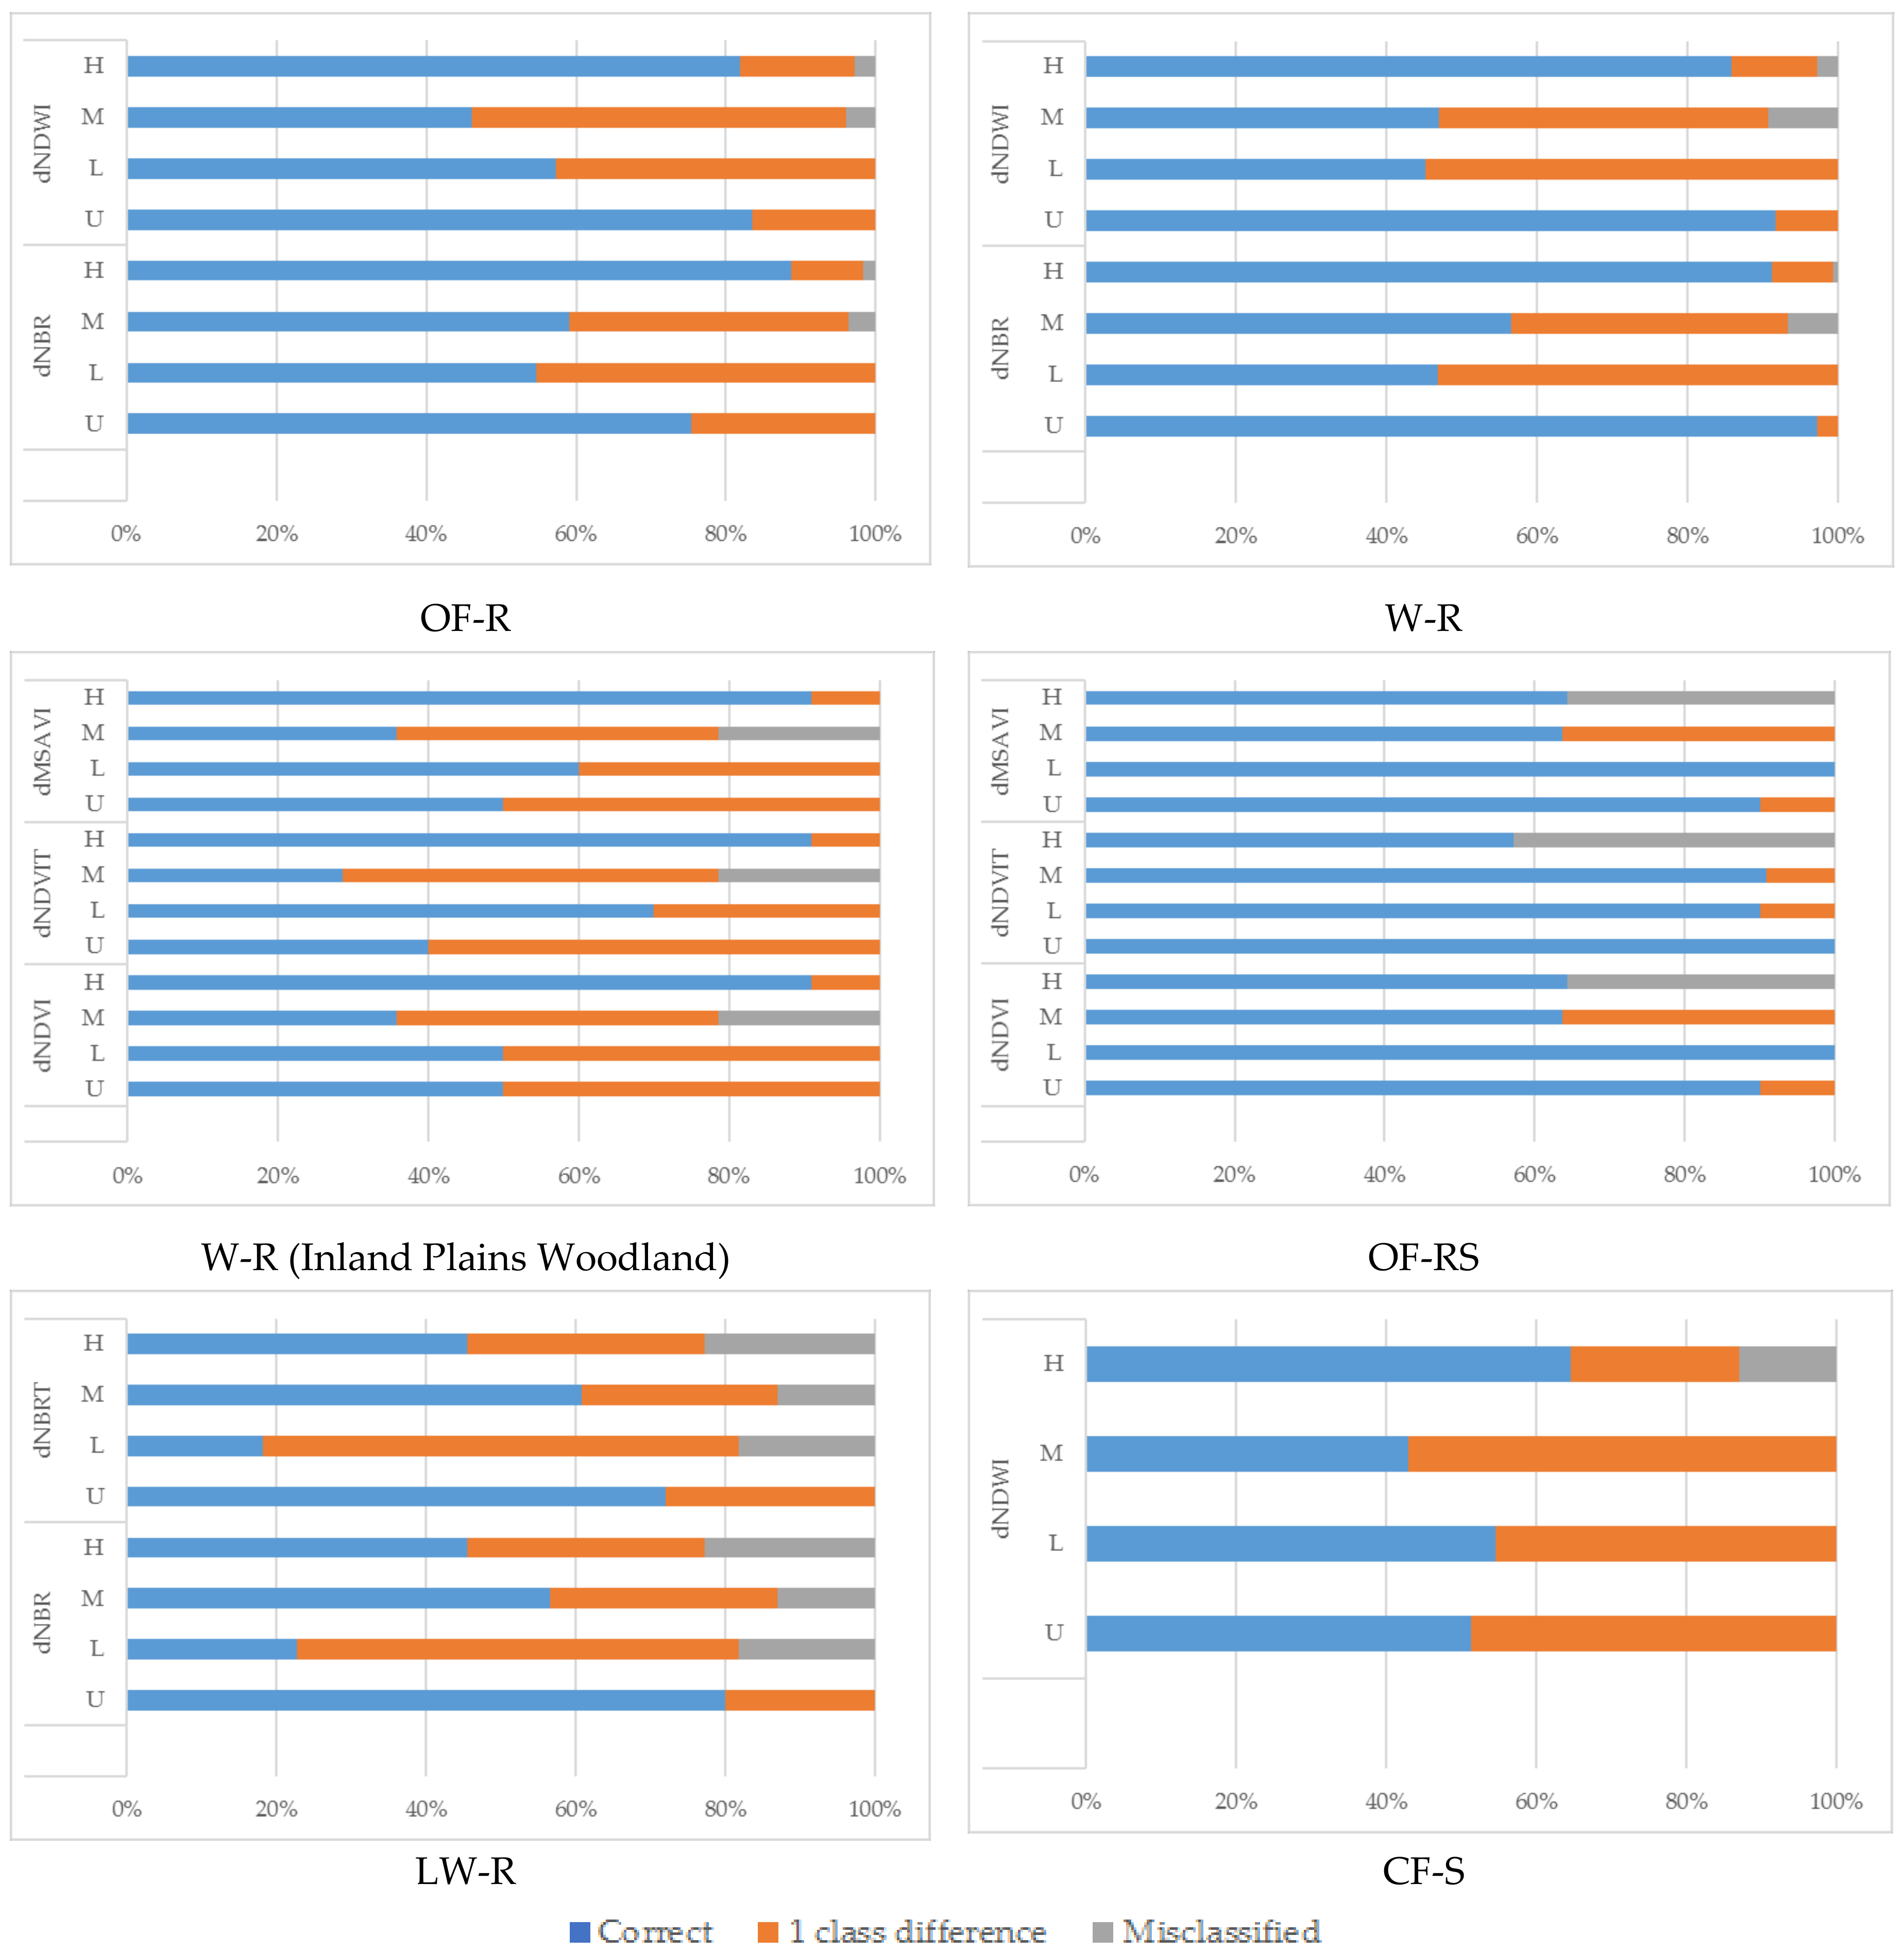
Large misclassification errors (i.e., difference of two or more severity classes between predicted and reference data) from the best-performing indices were generally low (<~10%) for forest groups OF-R, and W-R (Figure 3). Misclassifications by one class only (i.e., difference of only one fire-severity class between predicted and reference data such as an unburnt plot classified as low severity) in these forest groups varied among fire-severity classes, and were greatest for the low- and moderate-severity classes (Figure 3). Correct classification was also generally high (>50%) for OF-RS and CF-S, but varied markedly with index and severity class for Inland Plains Woodland and LW-R, consistent with variable and comparatively low commission and omission error values in these forests (Figure 3, Table 5).
The results of the combined classes (Table 5, lower panel) were comparable to those obtained for individual groups separately (Table 5, upper panel), indicating that the same level of accuracy was achieved when a single set of thresholds were derived for each of the combined groups.
Applying thresholds that combined the transition from unburnt and low severity to moderate and high severity (Supplementary Table S5) markedly increased the accuracy of fire-severity predictions. Overall accuracy (OA) was consistently high for all forest groups or types, ranging from 0.77 to 0.88 (Table 6). Commission errors ranged from 0 to 0.17 for the moderate/high severity combination, indicating low overall incidence of false positives across forest types. In addition, omission errors were universally low (<0.13) for the unburnt/low combination indicating reliable classification of plots, where tree crowns were largely untouched by fire.
4. Discussion
To our knowledge, this study presents one of the most comprehensive analyses of fire severity estimation from remote sensing data in Australia, and is the only one that examines the individual capacity of the most commonly-used optical spectral indices for fire-severity assessment in different forest types in temperate Australia. Our results confirmed that fire severity can be reliably estimated from optical images. However, we also demonstrate that estimation accuracy depends on proper matching of spectral indices with forest types and fire-response traits.
4.1. One Size Doesn’t Fit All: Index Suitability Varies with Forest Type
The results from our index sensitivity analysis indicated that index capacity to separate among the four defined severity classes differed among forest types. This is consistent with understanding that the suitability of different spectral indices to map fire severity varies with the characteristics of the dominant vegetation [71,72]. Nevertheless, our results also indicated that the more sensitive, and thus, best-performing indices were comparable among forest types with similar structure (canopy height and canopy cover) and fire-regeneration strategy. This suggests that functionally-similar forest types have similar spectral responses, and thus, that the same index could be collectively used for those forest types.
The dNBR index was the best performing index for the most extensive resprouter forests (OF-R and W-R), which are characterised by sparse (10–30%) to mid-dense (30–70%) projective foliage cover, and dominated by fire-tolerant resprouter species. This is in agreement with a previous study [31], which indicated that dNBR outperformed other spectral indices (including dNDWI and dNDVI) that were not based on the SWIR2 band (2.08 to 2.35 µm) because of its higher capacity to capture a larger range of variation in post-fire effects. The NBR is based on a relationship between plant and soil reflectance, with plants accounting for much of the NIR reflectance and soils for SWIR2 [62]. The dNBR accurately detects changes in that relationship, as plant-derived reflectance decreases and soil reflectance increases with increasing fire severity. Open forest and woodlands with low to moderate cover would offer a clear and gradual change in plant and soil signal with fire severity. The dNBR index has been identified as a robust index for mapping fire severity over a broad range of forests and shrublands [17,47], and has received support to be used operationally in post-fire land management projects [21].
While robust for the main resprouter forests, dNBR did not perform well for the other forest types, which included those with closed canopies and/or seeder species (CF-R, CF-S, OF-RS). The Normalised Difference Water Index (dNDWI) was the best-performing index for closed forest dominated by obligate seeders, and second best for resprouter open forest and woodlands. Lower overall performance of dNDWI in resprouter forests when compared to dNBR could, as suggested by Veraverbeke et al. [11], be related to the differential responses of SWIR2 (band TM7) and SWIR1 (band TM5), and the capacity of the former to capture a larger range of variation in post-fire effects. This interpretation is consistent with results from Epting et al. [19] for boreal mixed-species forests, from Escuin, Navarro, and Fernandez [17], for the forests of southern Spain, and from Harris et al. [21], for chaparral ecosystems in Southern California.
Three indices, dNDVI, dNDVIT, and dMSAVI were the most sensitive for two forest types of relatively limited distribution: Riparian forest (OF-RS) and Inland Plains Woodland (W-R). These results are in agreement with previous studies in coniferous species [73], temperate rain forests [74] and pine-dominated, cool temperate forests [75], which found the dNDVI outperformed other spectral indices for fire-severity characterisation. Nonetheless, our results supporting the utility of the thermally-enhanced version dNDVIT index are in contrast with findings from Harris et al. [21], who found that the thermally-enhanced version of dNDVI did not improve fire severity assessment in chaparral ecosystems.
None of the evaluated spectral indices were able to discriminate among fire-severity classes in rainforest. This was at least partly due to the low relative occurrence of wildfires in this typically moist and closed forest type, leading to less available reference data. The rainforest also typically occurs in gullies surrounded by steep slopes, and is characterised by complex and sometimes dense understorey strata, all of which could contribute to a more variable reflectance signature at the 30-m resolution of the Landsat data.
Two of the evaluated indices, BAI and MIRBI, were consistently poor performers across all forest types. BAI has been identified as one of the best indices to map burnt areas [58], but our study suggests that it is not suitable for distinguishing fire-severity classes in temperate eucalypt forests. Our results agree with Harris et al. [21], who noted the similarly weak performance of BAI and MIRBI indices in fire severity assessments, but are in contrast to the findings of Lu He and Tong [76] for fire-severity assessments in grasslands.
In agreement with previous studies of fire-severity in coniferous forest, broadleaved forest, shrublands and olive groves forest [11], chaparral ecosystems [21], and temperate rain forests [74], none of the thermal indices performed better than the non-thermal in all forest functional groups within our study. However, their decreased performance may be the results of the reduced spatial resolution of the thermal channel (120 m) which could result in an increased number of mixed-severity pixels.
4.2. Accuracy of Fire Severity Estimates Using Forest-Specific Indices
Our levels of overall accuracy for classifying fire severity ranged from 0.50 to 0.82, with kappa values ranging from 0.33 (fair agreement) to 0.77 (substantial agreement) depending on the forest group and index. Our highest accuracy was comparable with the overall 0.83 accuracy (kappa coefficient = 0.76) for pine-dominated cool temperate forest elsewhere [75], and our forest group accuracies of 0.77 to 0.84 for dNBR were also consistent with those reported elsewhere [19,77,78]. The dNBR overall accuracy in this study also agreed with results for fire severity classification in temperate rain forests (overall accuracy of 78%, kappa 0.59; [73]. Our kappa values also agreed with kappa values (0.38 to 0.64) in a study that evaluated 13 spectral indices derived from Landsat TM and ETM+ data in boreal forests dominated by black spruce or mixed black/white spruce [19]. Higher classification accuracies can be achieved when implementing machine learning techniques to map fire severity [9,79,80]), which is expected, given the difference between multivariate and single index approaches. However, the machine learning tendency to overfit may result in reduced accuracies when classification is implemented out of the set of training data [79]. A single index approach is robust, analytically simple, and it is already implemented operationally by land managers [9]. However, for particular forest types (i.e., close forest), more complex approaches might be needed, as single indices could not provide sufficiently accurate results.
Combining forests with the same best-performing indices did not appreciably change the overall accuracies. This result is highly relevant to land managers, as it reduces the number of indices and thresholds required to map fire severity across heterogeneous forested landscapes, and facilitates the operational use of these indices.
Commission errors indicated that there was tendency to misclassify plots in the moderate severity class, while omission errors suggested that high severity plots tended to be misclassified into other classes. These errors could be partly due to the growth of ground and understory vegetation within the temporal interval between fire and post-fire image acquisition date. Our results showed that in most cases, particularly for the best index per forest functional group, misclassification was typically by one class only, with a smaller percentage of plots misclassified by two or more classes. Misclassification between moderate and high severity classes are not un-common in fire severity estimation from remote sensing data, as has been addressed in previous studies in temperate rain forests, pine-dominated cool temperate forest, and chaparral ecosystems [74,75,78].
As expected, overall accuracies increased to between 0.77 and 0.88 when the four fire severity classes were reduced to two (Unburnt and Low vs. Moderate and High). This indicates significant benefits from our approach, i.e., by identifying the best-performing spectral indices by broad forest groups, managers can confidently distinguish between areas where a high proportion of forest crowns have been scorched or burnt from unburnt or mildly burnt areas, and thereby, identify priorities for forest restoration, recovery, and monitoring.
5. Conclusions
In summary, the aim of the current study was threefold. Firstly, our three methods of evaluation confirmed that there is no single spectral index that will reliably distinguish fire-severity classes in all forest types (although there are some that were unreliable for all forest types). Our findings also indicate that index performance is similar among forest types with similar functional characteristics (structure and regeneration strategy of dominant canopy species). Therefore, the same index could be used for forest types within the same broad functional group.
Second, the dNBR and the dNDWI indices proved to be reliable for classifying fire severity in two of the main forest resprouter forest groups of open to sparse structure (OF-R and W-R), and dNDWI was also identified as the best-performing index for the main closed forest group (CF-S). Of the remaining indices, dNDVI, dNDVIT, and dMSAVI were most useful for less common forest types (Inland Plains Woodland resprouter, W-R, and Riparian forest, OF-RS). We found that none of the tested indices could distinguish fire severity in rainforest, and dMIRBI and dBAI were consistently the worst-performing indicators in all forest groups.
Third, the overall accuracy of indices ranged from fair (OA ~ 0.5) in closed forest types to strong (OA ~ 0.8) in open forests. The percentage of large misclassifications for the best-performing indices was relatively small, with less than 10% of plots misclassified by more than one class in most forest groups. Our findings indicate that three spectral indices (dNBR, dNDWI, and dNDVI), each with a unique set of thresholds, could be used to map fire severity across most forest types that are regularly burnt by wildfire in south eastern Australia.
Supplementary Materials
The following are available online at https://www.mdpi.com/2072-4292/10/11/1680/s1. Figure S1: Scatterplot between overall accuracies (OA) estimated using defined thresholds in the best-performing index by forest type (i.e., mean of multiple forest types per group) and by forest functional group, indicating similar levels of accuracy at the two levels of forest classification, Figure S2: Boxplots of 10 difference indices between pre- and post-fire spectral indices derived from Landsat satellite images at four different fire severity classes (unburnt, low, moderate and high severity) for all individual forest types. (Means that do not share a letter are statistically significant different), Figure S3: M values indicating the capacity of 10 spectral indices to distinguish between fire-severity classes for resprouter (R), obligate seeder (S) and mixed traits (RS) forest types, Figure S4: Bar charts for median values of spectral indices’ optimality derived from Landsat satellite images at four different classes: unburnt to low, moderate and high severity) for the resprouter (R), obligate seeder (S) and mixed traits (RS) forest ecosystems, Table S1: Numbers of reference plots for fire severity analysis by forest type, Table S2: Landsat 5 TM images used to compute spectral indices of the reference plots (bands used: 3 ÷ 7), Table S3: A summary of scores for all ten spectral indices from three methods of evaluation by forest type. Higher values in all cases indicates greater capacity to discriminate between fire-severity classes (i.e., a total score of 3 indicates strong discrimination by all three evaluation methods), Table S4: Thresholds for selected spectral indices for fire severity assessment by forest groups or type, Table S5: Thresholds by forest type for selected spectral indices of the transition from Unburnt and Low (UL) to Moderate and High (MH) fire severity.
Author Contributions
B.N.T. carried out all the reference dataset design, the image processing, analyzed the data and drafted the manuscript text. C.A. and L.T.B. contributed guidance on research methodologies and forest fire response trait classification. M.A.T. supervised the steps of reference plot design, data collecting and processing techniques. All co-authors provided comments and revised the manuscript.
Funding
This research received no external funding.
Acknowledgments
The authors would like to acknowledge the financial support of the Melbourne Research Scholarship and the Vietnam International Education Cooperation Department (VIED) scholarship. We also acknowledge the support of many staffs and students from School of Ecosystem and Forest Sciences at the University of Melbourne, and for their valuable comments and advices to improve this manuscript.
Conflicts of Interest
The authors declare no conflict of interest.
References
- Bond, W.J.; Keeley, J.E. Fire as a global ‘herbivore’: The ecology and evolution of flammable ecosystems. Trends Ecol. Evol. 2005, 20, 387–394. [Google Scholar] [CrossRef] [PubMed]
- Bowman, D.M.J.S.; Balch, J.K.; Artaxo, P.; Bond, W.J.; Carlson, J.M.; Cochrane, M.A.; D’Antonio, C.M.; DeFries, R.S.; Doyle, J.C.; Harrison, S.P.; et al. Fire in the earth system. Science 2009, 324, 481–484. [Google Scholar] [CrossRef] [PubMed]
- Barbosa, P.M.; Stroppiana, D.; Grégoire, J.-M.; Cardoso Pereira, J.M. An assessment of vegetation fire in Africa (1981–1991): Burned areas, burned biomass, and atmospheric emissions. Glob. Biogeochem. Cycles 1999, 13, 933–950. [Google Scholar] [CrossRef] [Green Version]
- Veraverbeke, S.; Gitas, I.; Katagis, T.; Polychronaki, A.; Somers, B.; Goossens, R. Assessing post-fire vegetation recovery using red-near infrared vegetation indices: Accounting for background and vegetation variability. ISPRS J. Photogramm. Remote Sens. 2012, 68, 28–39. [Google Scholar] [CrossRef] [Green Version]
- Collins, B.M.; Kelly, M.; van Wagtendonk, J.W.; Stephens, S.L. Spatial patterns of large natural fires in Sierra Nevada wilderness areas. Landsc. Ecol. 2007, 22, 545–557. [Google Scholar] [CrossRef]
- Fairman, T.A.; Nitschke, C.R.; Bennett, L.T. Too much, too soon? A review of the effects of increasing wildfire frequency on tree mortality and regeneration in temperate eucalypt forests. Int. J. Wildland Fire 2016, 25, 831–848. [Google Scholar] [CrossRef]
- Patterson, M.W.; Yool, S.R. Mapping fire-induced vegetation mortality using Landsat thematic mapper data: A comparison of linear transformation techniques. Remote Sens. Environ. 1998, 65, 132–142. [Google Scholar] [CrossRef]
- Jakubauskas, M.E.; Lulla, K.P.; Mausel, P.W. Assessment of vegetation change in a fire-altered forest landscape. PE RS Photogramm. Eng. Remote Sens. 1990, 56, 371–377. [Google Scholar]
- Brewer, C.K.; Winne, J.C.; Redmond, R.L.; Opitz, D.W.; Mangrich, M.V. Classifying and mapping wildfire severity. Photogramm. Eng. Remote Sens. 2005, 71, 1311–1320. [Google Scholar] [CrossRef]
- Tanase, M.A.; Kennedy, R.; Aponte, C. Fire severity estimation from space: A comparison of active and passive sensors and their synergy for different forest types. Int. J. Wildland Fire 2015, 24, 1062–1075. [Google Scholar] [CrossRef]
- Veraverbeke, S.; Verstraeten, W.W.; Lhermitte, S.; Goossens, R. Evaluating Landsat Thematic Mapper spectral indices for estimating burn severity of the 2007 Peloponnese wildfires in Greece. Int. J. Wildland Fire 2010, 19, 558–569. [Google Scholar] [CrossRef] [Green Version]
- White, J.D.; Ryan, K.C.; Key, C.C.; Running, S.W. Remote sensing of forest fire severity and vegetation recovery. Int. J. Wildland Fire 1996, 6, 125–136. [Google Scholar] [CrossRef]
- Chuvieco, E.; Englefield, P.; Trishchenko, A.P.; Luo, Y. Generation of long time series of burn area maps of the boreal forest from NOAA-AVHRR composite data. Remote Sens. Environ. 2008, 112, 2381–2396. [Google Scholar] [CrossRef]
- Miller, J.D.; Thode, A.E. Quantifying burn severity in a heterogeneous landscape with a relative version of the delta Normalized Burn Ratio (dNBR). Remote Sens. Environ. 2007, 109, 66–80. [Google Scholar] [CrossRef]
- Trigg, S.; Flasse, S. An evaluation of different bi-spectral spaces for discriminating burned shrub-savannah. Int. J. Remote Sens. 2001, 22, 2641–2647. [Google Scholar] [CrossRef]
- Pereira, J.M.C.; Pereira, B.S.; Barbosa, P.; Stroppiana, D.; Vasconcelos, M.J.P.; Grégoire, J.-M. Satellite monitoring of fire in the EXPRESSO study area during the 1996 dry season experiment: Active fires, burnt area, and atmospheric emissions. J. Geophys. Res. Atmos. 1999, 104, 30701–30712. [Google Scholar] [CrossRef] [Green Version]
- Escuin, S.; Navarro, R.; Fernandez, P. Fire severity assessment by using NBR (Normalized Burn Ratio) and NDVI (Normalized Difference Vegetation Index) derived from LANDSAT TM/ETM images. Int. J. Remote Sens. 2008, 29, 1053–1073. [Google Scholar] [CrossRef]
- Key, C.; Benson, N. Landscape Assessment: Ground Measure of Severity, the Composite Burn Index; and Remote Sensing of Severity, the Normalized Burn Ratio; USDA Forest Service, Rocky Mountain Research Station: Ogden, UT, USA, 2006; pp. LA 1–LA 51. [Google Scholar]
- Epting, J.; Verbyla, D.; Sorbel, B. Evaluation of remotely sensed indices for assessing burn severity in interior Alaska using Landsat TM and ETM+. Remote Sens. Environ. 2005, 96, 328–339. [Google Scholar] [CrossRef]
- French, N.H.F.; Kasischke, E.S.; Hall, R.J.; Murphy, K.A.; Verbyla, D.L.; Hoy, E.E.; Allen, J.L. Using Landsat data to assess fire and burn severity in the North American boreal forest region: An overview and summary of results. Int. J. Wildland Fire 2008, 17, 443–462. [Google Scholar] [CrossRef]
- Harris, S.; Veraverbeke, S.; Hook, S. Evaluating spectral indices for assessing fire severity in chaparral ecosystems (Southern California) using MODIS/ASTER (MASTER) airborne simulator data. Remote Sens. 2011, 3, 2403–2419. [Google Scholar] [CrossRef]
- Van Wagtendonk, J.W.; Root, R.R.; Key, C.H. Comparison of AVIRIS and Landsat ETM+ detection capabilities for burn severity. Remote Sens. Environ. 2004, 92, 397–408. [Google Scholar] [CrossRef]
- Chuvieco, E. Using cluster analysis to improve the selection of training statistics in classifying remotely sensed data. Photogramm. Eng. Remote Sens. 1988, 54, 1275–1281. [Google Scholar]
- De Santis, A.; Asner, G.P.; Vaughan, P.J.; Knapp, D.E. Mapping burn severity and burning efficiency in California using simulation models and Landsat imagery. Remote Sens. Environ. 2010, 114, 1535–1545. [Google Scholar] [CrossRef]
- Murphy, K.A.; Reynolds, J.H.; Koltun, J.M. Evaluating the ability of the differenced Normalized Burn Ratio (dNBR) to predict ecologically significant burn severity in Alaskan boreal forests. Int. J. Wildland Fire 2008, 17, 490–499. [Google Scholar] [CrossRef]
- Díaz-Delgado, R.; Lloret, F.; Pons, X. Influence of fire severity on plant regeneration by means of remote sensing imagery. Int. J. Remote Sens. 2003, 24, 1751–1763. [Google Scholar] [CrossRef] [Green Version]
- Veraverbeke, S.; Hook, S.J. Evaluating spectral indices and spectral mixture analysis for assessing fire severity, combustion completeness and carbon emissions. Int. J. Wildland Fire 2013, 22, 707–720. [Google Scholar] [CrossRef]
- Kokaly, R.F.; Rockwell, B.W.; Haire, S.L.; King, T.V.V. Characterization of post-fire surface cover, soils, and burn severity at the Cerro Grande Fire, New Mexico, using hyperspectral and multispectral remote sensing. Remote Sens. Environ. 2007, 106, 305–325. [Google Scholar] [CrossRef]
- Holden, Z.A.; Smith, A.M.S.; Morgan, P.; Rollins, M.G.; Gessler, P.E. Evaluation of novel thermally enhanced spectral indices for mapping fire perimeters and comparisons with fire atlas data. Int. J. Remote Sens. 2005, 26, 4801–4808. [Google Scholar] [CrossRef]
- Smith, A.M.S.; Drake, N.A.; Wooster, M.J.; Hudak, A.T.; Holden, Z.A.; Gibbons, C.J. Production of Landsat ETM+ reference imagery of burned areas within Southern African savannahs: Comparison of methods and application to MODIS. Int. J. Remote Sens. 2007, 28, 2753–2775. [Google Scholar] [CrossRef]
- Veraverbeke, S.; Harris, S.; Hook, S. Evaluating spectral indices for burned area discrimination using MODIS/ASTER (MASTER) airborne simulator data. Remote Sens. Environ. 2011, 115, 2702–2709. [Google Scholar] [CrossRef]
- Chu, T.A.; Guo, X.L. Remote sensing techniques in monitoring post-fire effects and patterns of forest recovery in boreal forest regions: A review. Remote Sens. 2014, 6, 470–520. [Google Scholar] [CrossRef]
- Timbal, B.; Ekström, M.; Fiddes, S.; Grose, M.; Kirono, D.; Lim, E.-P.; Lucas, C.; Wilson, L. Climate Change Science and Victoria; Bureau Research Report No. 014; Bureau of Meteorology: Melbourne, Victoria, Australia, 2016; p. 94. [Google Scholar]
- Peel, M.C.; Finlayson, B.L.; McMahon, T.A. Updated world map of the Köppen-Geiger climate classification. Hydrol. Earth Syst. Sci. 2007, 11, 1633–1644. [Google Scholar] [CrossRef]
- Hennessey, K.; Lucas, C.; Nicholls, N.; Bathols, J.; Suppiah, R.; Ricketts, J. Climate Change Impacts on Fire-Weather in South-East Australia; CSIRO Marine and Atmospheric Research: Aspendale, Australia, 2005. [Google Scholar]
- Cheal, D. Growth Stages and Tolerable Fire Intervals for Victoria’s Native Vegetation Data Sets; Fire and Adaptive Management Report No. 84; Victorian Government Department of Sustainability and Environment: East Melbourne, Victoria, Australia, 2010; pp. 1–36. [Google Scholar]
- Department of Environment, Land, Water & Planning (DELWP). Fire History Records of Fires Primarily on Public Land; Department of Environment, Land, Water & Planning: Melbourne, Victoria, Australia, 2017. [Google Scholar]
- Specht, R.L. The Vegetation of South Australia; Govt. Pr.: Adelaide, Australia, 1972. [Google Scholar]
- Kasel, S.; Bennett, L.T.; Aponte, C.; Fedrigo, M.; Nitschke, C.R. Environmental heterogeneity promotes floristic turnover in temperate forests of south-eastern Australia more than dispersal limitation and disturbance. Landsc. Ecol. 2017, 32, 1613–1629. [Google Scholar] [CrossRef]
- USGS. Earth Explorer. Available online: https://earthexplorer.usgs.gov/ (accessed on 15 January 2017).
- Zhu, Z.; Woodcock, C.E. Object-based cloud and cloud shadow detection in Landsat imagery. Remote Sens. Environ. 2012, 118, 83–94. [Google Scholar] [CrossRef]
- Erdas Inc. Erdas Imagine. Available online: http://www.hexagongeospatial.com/products/power-portfolio/erdas-imagine (accessed on 20 September 2017).
- Clarke, P.J.; Lawes, M.J.; Murphy, B.P.; Russell-Smith, J.; Nano, C.E.M.; Bradstock, R.; Enright, N.J.; Fontaine, J.B.; Gosper, C.R.; Radford, I.; et al. A synthesis of postfire recovery traits of woody plants in Australian ecosystems. Sci. Total Environ. 2015, 534, 31–42. [Google Scholar] [CrossRef] [PubMed]
- Nicolle, D. A classification and census of regenerative strategies in the eucalypts (Angophora, Corymbia and Eucalyptus—Myrtaceae), with special reference to the obligate seeders. Aust. J. Bot. 2006, 54, 391–407. [Google Scholar] [CrossRef]
- Government of Victoria. Bioregions and EVC Benchmarks. Available online: https://www.environment.vic.gov.au/biodiversity/bioregions-and-evc-benchmarks#hsf (accessed on 1 March 2018).
- Specht, R.L.; Wood, J.G. British Science Guild, Handbooks Committee, South Australian Branch. In The Vegetation of South Australia: Handbook of the Flora and Fauna of South Australia, 2nd ed.; Govt. Pr.: Adelaide, Australia, 1972; 328p. [Google Scholar]
- Allen, J.L.; Sorbel, B. Assessing the differenced Normalized Burn Ratio’s ability to map burn severity in the boreal forest and tundra ecosystems of Alaska’s national parks. Int. J. Wildland Fire 2008, 17, 463–475. [Google Scholar] [CrossRef]
- De Santis, A.; Chuvieco, E. Burn severity estimation from remotely sensed data: Performance of simulation versus empirical models. Remote Sens. Environ. 2007, 108, 422–435. [Google Scholar] [CrossRef]
- Tanase, M.; de la Riva, J.; Pérez-Cabello, F. Estimating burn severity at the regional level using optically based indices. Can. J. For. Res. 2011, 41, 863–872. [Google Scholar] [CrossRef]
- Duffy, P.A.; Epting, J.; Graham, J.M.; Rupp, T.S.; McGuire, A.D. Analysis of Alaskan burn severity patterns using remotely sensed data. Int. J. Wildland Fire 2007, 16, 277–284. [Google Scholar] [CrossRef] [Green Version]
- Hoy, E.E.; French, N.H.F.; Turetsky, M.R.; Trigg, S.N.; Kasischke, E.S. Evaluating the potential of Landsat TM/ETM+ imagery for assessing fire severity in Alaskan black spruce forests. Int. J. Wildland Fire 2008, 17, 500–514. [Google Scholar] [CrossRef]
- Soverel, N.O.; Perrakis, D.D.B.; Coops, N.C. Estimating burn severity from Landsat dNBR and RdNBR indices across western Canada. Remote Sens. Environ. 2010, 114, 1896–1909. [Google Scholar] [CrossRef]
- Hall, R.J.; Freeburn, J.T.; de Groot, W.J.; Pritchard, J.M.; Lynham, T.J.; Landry, R. Remote sensing of burn severity: Experience from western Canada boreal fires. Int. J. Wildland Fire 2008, 17, 476–489. [Google Scholar] [CrossRef]
- Tucker, C.J. Red and photographic infrared linear combinations for monitoring vegetation. Remote Sens. Environ. 1979, 8, 127–150. [Google Scholar] [CrossRef] [Green Version]
- Rouse, J.W., Jr.; Haas, R.H.; Schell, J.A.; Deering, D.W. Monitoring Vegetation Systems in the Great Plains with Erts; Third Earth Resources Technology Satellite-1 Symposium; NASA: Washington, DC, USA, 1974; pp. 309–317. [Google Scholar]
- Lutes, D.C.; Keane, R.E.; Caratti, J.F.; Key, C.H.; Benson, N.C.; Sutherland, S.; Gangi, L.J. Firemon: Fire Effects Monitoring and Inventory System; Dept. of Agriculture, Forest Service, Rocky Mountain Research Station: Fort Collins, CO, USA, 2006. [Google Scholar]
- Gao, B.C. NDWI—A normalized difference water index for remote sensing of vegetation liquid water from space. Remote Sens. Environ. 1996, 58, 257–266. [Google Scholar] [CrossRef]
- Chuvieco, E.; Martín, M.P.; Palacios, A. Assessment of different spectral indices in the red-near-infrared spectral domain for burned land discrimination. Int. J. Remote Sens. 2002, 23, 5103–5110. [Google Scholar] [CrossRef]
- Qi, J.; Chehbouni, A.; Huete, A.R.; Kerr, Y.H.; Sorooshian, S. A modified soil adjusted vegetation index. Remote Sens. Environ. 1994, 48, 119–126. [Google Scholar] [CrossRef]
- Smith, A.M.S.; Wooster, M.J.; Drake, N.A.; Dipotso, F.M.; Falkowski, M.J.; Hudak, A.T. Testing the potential of multi-spectral remote sensing for retrospectively estimating fire severity in African savannahs. Remote Sens. Environ. 2005, 97, 92–115. [Google Scholar] [CrossRef]
- Schepers, L.; Haest, B.; Veraverbeke, S.; Spanhove, T.; Vanden Borre, J.; Goossens, R. Burned area detection and burn severity assessment of a heathland fire in Belgium using airborne imaging spectroscopy (APEX). Remote Sens. 2014, 6, 1803–1826. [Google Scholar] [CrossRef]
- Roy, D.R.; Boschetti, L.; Trigg, S.N. Remote sensing of fire severity: Assesing the performance of the normalized burn ratio. IEEE Geosci. Remote Sens. Lett. 2006, 3, 112–116. [Google Scholar] [CrossRef]
- Quinn, G.P. Experimental Design and Data Analysis for Biologists; Quinn, G.P., Keough, M.J., Eds.; Cambridge University Press: Cambridge, UK; New York, NY, USA, 2002. [Google Scholar]
- Hessl, A.; Miller, J.; Kernan, J.; Keenum, D.; McKenzie, D. Mapping paleo-fire boundaries from binary point data: Comparing interpolation methods. Prof. Geogr. 2007, 59, 87–104. [Google Scholar] [CrossRef]
- Fernandez-Carrillo, A.; McCaw, L.; Belenguer-Plomer, M.A.; Tanase, M.A. L-band SAR sensitivity to prescribed burning effects in eucalypt forests of Western Australia. Proc. SPIE 2018, 10788. [Google Scholar] [CrossRef]
- Padilla, M.; Stehman, S.V.; Ramo, R.; Corti, D.; Hantson, S.; Oliva, P.; Alonso-Canas, I.; Bradley, A.V.; Tansey, K.; Mota, B.; et al. Comparing the accuracies of remote sensing global burned area products using stratified random sampling and estimation. Remote Sens. Environ. 2015, 160, 114–121. [Google Scholar] [CrossRef] [Green Version]
- Congalton, R.G. A review of assessing the accuracy of classifications of remotely sensed data. Remote Sens. Environ. 1991, 37, 35–46. [Google Scholar] [CrossRef]
- Cohen, J. Weighted kappa: Nominal scale agreement provision for scaled disagreement or partial credit. Psychol. Bull. 1968, 70, 213–220. [Google Scholar] [CrossRef] [PubMed]
- Holle, H.; Rein, R. The modified cohen’s kappa: Calculating interrater agreement for segmentation and annotation. In Understanding Body Movement: A Guide to Empirical Research on Non-Verbal Behavior, 1st ed.; Lausberg, H., Ed.; Peter Lang: Frankfurt, Germany, 2013; pp. 261–275. [Google Scholar]
- Landis, J.R.; Koch, G.G. The measurement of observer agreement for categorical data. Biometrics 1977, 33, 159–174. [Google Scholar] [CrossRef] [PubMed]
- Hammill, K.A.; Bradstock, R.A. Remote sensing of fire severity in the blue mountains: Influence of vegetation type and inferring fire intensity. Int. J. Wildland Fire 2006, 15, 213–226. [Google Scholar] [CrossRef]
- Keeley, J.E. Fire intensity, fire severity and burn severity: A brief review and suggested usage. Int. J. Wildland Fire 2009, 18, 116–126. [Google Scholar] [CrossRef]
- Sparks, A.; Kolden, C.; Talhelm, A.; Smith, A.; Apostol, K.; Johnson, D.; Boschetti, L. Spectral indices accurately quantify changes in seedling physiology following fire: Towards mechanistic assessments of post-fire carbon cycling. Remote Sens. 2016, 8, 572. [Google Scholar] [CrossRef]
- Marino, E.; Guillen-Climent, M.; Ranz Vega, P.; Tomé, J. Fire Severity Mapping in Garajonay National Park: Comparison between Spectral Indices; Flamma: Madrid, Spain, 2016; Volume 7, pp. 22–28. [Google Scholar]
- Lee, B.; Kim, S.Y.; Chung, J.; Park, P.S. Estimation of fire severity by use of Landsat TM images and its relevance to vegetation and topography in the 2000 Samcheok forest fire. J. For. Res. 2008, 13, 197–204. [Google Scholar] [CrossRef]
- Lu, B.; He, Y.; Tong, A. Evaluation of spectral indices for estimating burn severity in semiarid grasslands. Int. J. Wildland Fire 2016, 25, 147–157. [Google Scholar] [CrossRef]
- Miller, J.D.; Knapp, E.E.; Key, C.H.; Skinner, C.N.; Isbell, C.J.; Max Creasy, R.; Sherlock, J.W. Calibration and validation of the relative differenced Normalized Burn Ratio (RdNBR) to three measures of fire severity in the Sierra Nevada and Klamath Mountains, California, USA. Remote Sens. Environ. 2009, 113, 645–656. [Google Scholar] [CrossRef]
- Stow, D.; Petersen, A.; Rogan, J.; Franklin, J. Mapping burn severity of Mediterranean-type vegetation using satellite multispectral data. Gisci. Remote Sens. 2007, 44, 1–23. [Google Scholar] [CrossRef]
- Collins, L.; Griffioen, P.; Newell, G.; Mellor, A. The utility of random forests for wildfire severity mapping. Remote Sens. Environ. 2018, 216, 374–384. [Google Scholar] [CrossRef]
- Hultquist, C.; Chen, G.; Zhao, K. A comparison of gaussian process regression, random forests and support vector regression for burn severity assessment in diseased forests. Remote Sens. Lett. 2014, 5, 723–732. [Google Scholar] [CrossRef]
Figure 1.
Map of study area and locations of reference plots for fire severity analysis. (a) Victoria highlighted (grey) in the map of Australia; (b) Locations of study areas within Victoria, with grey boxes indicating the extent of Landsat 5 TM scenes used for this study (named by path and row), and the relative location of reference plots (field plots, FP, and aerial photo interpretation plots, API). (c) 2006 fire within Landsat scene 94086 (i.e., path 94, row 86); (d) 2009 fire within Landsat scene 92086. Landsat scenes (c,d) are post-fire RGB images based on a combination of Landsat bands 5, 4, 3.

Figure 2.
Optimality approach for evaluating a spectral index [11,17,62]. This figure shows an example of the pre- and post-fire trajectory of a pixel in the TM4 − TM3, TM4 − TM5 or TM4 − TM7 feature space.

Figure 3.
Summary of classifications and misclassifications resulting from the use of fire-severity thresholds for best-performing indices by forest functional group. Misclassifications are indicated as a difference of only one fire-severity class between predicted and reference data (e.g., an unburnt plot classified as low severity), or as a difference of two or more severity classes (e.g., unburnt plot classified as moderate or high severity).


Table 1.
Description of forest types and forest functional groups.
| Forest Type a | Regeneration Strategy b | Tallest Stratum Genus c | Height of Tallest Stratum | Over-Storey Canopy Cover | Projective Foliage Cover of Tallest Stratum | Group d | ||
|---|---|---|---|---|---|---|---|---|
| Dense (70–100%) | Mid-dense (30–70%) | Spare (10–30%) | ||||||
| Tall Mist Forest | S | E | 30 m | 40% | CF | CF-S | ||
| Moist Forest (S) | S | E | 30 m | 90% | CF | |||
| Closed-forest | R | E/A | 25 m | 50% | CF | CF-R | ||
| Grassy/Heathy Dry Forest | R | E | 10–30 m | 20–30% | OF | OF-R | ||
| Tall Mixed Forest | R | E | 20–30 m | 40–60% | OF | |||
| Foothills Forest | R | E | 15–25 m | 25–40% | OF | |||
| Forby Forest | R | E | 15–30 m | 20–40% | OF | |||
| Moist Forest (R) | R | E | 25–30 m | 30–40% | OF | |||
| High Altitude Shrubland/Woodland | R | E | 15 m | 15–20% | W | W-R | ||
| Riverine Woodland/Forest | R | E | 15 m | 10% | W | |||
| Inland Plains Woodland | R | E | 15 m | 15–30% | W | |||
| Lowan Mallee | R | E | 7 m | 25% | LW | LW-R | ||
| Broombush Whipstick | R | E | 3 m | 30% | LW | |||
| Riparian (higher rainfall) | RS | E | 30 m | 40% | OF | OF-RS | ||
a Forest type were adopted from EVD names and associated structural data [36]; b R: resprouter; S: obligate seeder; RS: mix of both resprouter and obligate seeder; classifications based on predominant fire-response traits of the dominant tree species [39,43,44]; c Tallest stratum genus data were derived from the Ecological Vegetation Classes (EVC) benchmarks database at DELWP - E: Eucalypt spp [45], E/A: Elaeocarpus/Atherosperma; d OF: open forest; CF: closed forest: W: woodland; LW: low woodland [46].
Table 2.
Spectral indices for assessing fire severity; the delta version of each index, as the difference between pre- and post-fire values were tested in this study.
Table 2.
Spectral indices for assessing fire severity; the delta version of each index, as the difference between pre- and post-fire values were tested in this study.
| Spectral Index | Formula * | References | |
|---|---|---|---|
| Normalised Difference Vegetation Index | NDVI | [54,55] | |
| Normalised Burn Ratio | NBR | [18,56] | |
| Normalised Difference Water Index | NDWI | [57] | |
| Normalised Difference Vegetation Index Thermal | NDVIT | [29,30] | |
| Normalised Burn Ratio Thermal | NBRT | [29] | |
| Vegetation Index 6 Thermal | VI6T | [30] | |
| Burned Area Index | BAI | [58] | |
| Modified Soil Adjusted VegetationIndex | MSAVI | [59] | |
| Mid InfraRed Burn Index | MIRBI | [15] | |
| Char Soil Index | CSI | [60] |
* RED: Band 3–Visible red (0.63 to 0.69 µm); NIR: Band 4–Near-infrared (0.76 to 0.90 µm); SWIR1: Band 5–Shortwave infrared 1 (1.55 to 1.75 µm); TIR: Band 6–Thermal (10.4 to 12.5 µm); SWIR2: Band 7–Shortwave infrared 2 (2.08 to 2.35 µm).
Table 3.
Criteria for scoring the capacity of each spectral index to distinguish between fire-severity classes at forest type level based on ANOVA, the Separability index (AVG M, Equation (2)) and Optimality (AVG O, Equation (4)) index.
Table 3.
Criteria for scoring the capacity of each spectral index to distinguish between fire-severity classes at forest type level based on ANOVA, the Separability index (AVG M, Equation (2)) and Optimality (AVG O, Equation (4)) index.
| Scores | ANOVA | Separability Index | Optimality Index |
|---|---|---|---|
| 1 | The index significantly distinguishes all 4 fire severity classes | AVG Separability > 1 | AVG Optimality > 0.75 |
| 0.75 | The index significantly distinguishes 3 fire severity classes | 0.75 ≤ AVG Separability ≤ 1 | 0.5 ≤ AVG Optimality ≤ 0.75 |
| 0 | The index significantly distinguishes less than 3 fire severity classes | AVG Separability < 0.75 | AVG Optimality < 0.5 |
Table 4.
Summary of the total scores by forest type and the average scores by forest group for each spectral index. Total scores are the sum of scores from three evaluation methods (Table 3), with a score of 3 indicating strong discrimination between fire-severity classes by all three methods (Supplementary Table S3). The two best indices for each forest group are indicated in bold.
| Forest Type | Forest Group (FG) | FG Code | Summary Total Scores for all Spectral Indices by Three Methods | |||||||||
|---|---|---|---|---|---|---|---|---|---|---|---|---|
| dNDVI | dNBR | dNDWI | dNBRT | dNDVIT | dVI6T | dBAI | dMSAVI | dMIRBI | dCSI | |||
| Moist Forest (S) | CF-S | 6 | 2 | 2.5 | 2.75 | 2.5 | 2 | 2 | 1.75 | 2 | 0 | 1.75 |
| Tall Mist Forest | CF-S | 6 | 0.75 | 0 | 1.5 | 0.75 | 0 | 0.75 | 0.75 | 1.5 | 0 | 0.75 |
| AVG for CF-S | 1.38 | 1.25 | 2.13 | 1.63 | 1.00 | 1.38 | 1.25 | 1.75 | 0.00 | 1.25 | ||
| Closed-forest | CF-R | 2 | 0 | 0 | 0 | 0 | 0 | 0 | 0 | 0 | 0 | 0 |
| Grassy/heathy Dry Forest | OF-R | 1 | 0.75 | 2.75 | 2.5 | 2.75 | 1.75 | 1 | 0 | 0.75 | 0 | 1.75 |
| Tall Mixed Forest | OF-R | 1 | 0.75 | 0.75 | 0.75 | 0 | 0.75 | 0.75 | 0 | 0.75 | 0 | 0 |
| Foothills Forest | OF-R | 1 | 1 | 2.5 | 2.5 | 2.5 | 1.75 | 2.5 | 0.75 | 1 | 0.75 | 1.75 |
| Forby Forest | OF-R | 1 | 1.5 | 2.5 | 2 | 1.5 | 0.75 | 1.5 | 0 | 1.5 | 0 | 0.75 |
| Moist Forest (R) | OF-R | 1 | 0.75 | 2.5 | 1.75 | 1.5 | 0.75 | 1.5 | 0.75 | 0.75 | 1.75 | 1 |
| AVG for OF-R | 0.95 | 2.2 | 1.9 | 1.65 | 1.15 | 1.45 | 0.3 | 0.95 | 0.5 | 1.05 | ||
| High Altitude Shrubland/Woodland | W-R | 3 | 1.75 | 3 | 2.75 | 2 | 1.75 | 2.5 | 0.75 | 1.75 | 0 | 2 |
| Inland Plains Woodland | W-R | 3 | 1.5 | 0.75 | 0.75 | 0.75 | 1.5 | 0.75 | 0 | 1.5 | 0.75 | 0.75 |
| Riverine Woodland/Forest | W-R | 3 | 1 | 2.5 | 1.75 | 1.75 | 1 | 0.75 | 0 | 1 | 1 | 1.75 |
| AVG for W-R | 1.42 | 2.08 | 1.75 | 1.50 | 1.42 | 1.33 | 0.25 | 1.42 | 0.58 | 1.50 | ||
| Lowan Mallee | LW-R | 4 | 0.75 | 0.75 | 0 | 0.75 | 1.5 | 0 | 0 | 0.75 | 1.5 | 0 |
| Broombush Whipstick | LW-R | 4 | 0 | 1 | 0.75 | 1.75 | 0 | 0 | 0 | 0 | 1 | 0.75 |
| AVG for LW-R | 0.38 | 0.88 | 0.38 | 1.25 | 0.75 | 0.00 | 0.00 | 0.38 | 1.25 | 0.38 | ||
| Riparian | OF-RS | 5 | 1.75 | 0.75 | 0.75 | 1 | 1.5 | 0.75 | 0 | 1.5 | 0 | 0.75 |
Table 5.
Error assessment of fire-severity predictions (four classes) based on estimated thresholds for the best-performing spectral indices by forest functional group or forest type.
Table 5.
Error assessment of fire-severity predictions (four classes) based on estimated thresholds for the best-performing spectral indices by forest functional group or forest type.
| Forest Group | Spectral Indices | OA | Kappa | Commission Error * | Omission Errors * | ||||||
|---|---|---|---|---|---|---|---|---|---|---|---|
| U | L | M | H | U | L | M | H | ||||
| Forest functional groups | |||||||||||
| OF-R | dNBR | 0.68 | 0.53 | 0.41 | 0.69 | 0.12 | 0.32 | 0.25 | 0.45 | 0.41 | 0.11 |
| OF-R | dNDWI | 0.60 | 0.44 | 0.38 | 0.7 | 0.18 | 0.42 | 0.16 | 0.43 | 0.54 | 0.18 |
| W-R | dNBR | 0.69 | 0.56 | 0.54 | 0.68 | 0.13 | 0.16 | 0.03 | 0.53 | 0.43 | 0.09 |
| W-R | dNDWI | 0.62 | 0.47 | 0.57 | 0.7 | 0.21 | 0.25 | 0.08 | 0.55 | 0.53 | 0.14 |
| W-R (Inland Plains Woodland) | dNDVI | 0.56 | 0.41 | 0.62 | 0.55 | 0.17 | 0.33 | 0.5 | 0.5 | 0.64 | 0.09 |
| W-R (Inland Plains Woodland) | dNDVIT | 0.56 | 0.41 | 0.56 | 0.53 | 0.33 | 0.33 | 0.6 | 0.3 | 0.71 | 0.09 |
| W-R (Inland Plains Woodland) | dMSAVI | 0.58 | 0.44 | 0.58 | 0.5 | 0.17 | 0.33 | 0.5 | 0.4 | 0.64 | 0.09 |
| LW-R | dNBR | 0.52 | 0.36 | 0.43 | 0.64 | 0.43 | 0.5 | 0.2 | 0.77 | 0.43 | 0.55 |
| LW-R | dNBRT | 0.50 | 0.33 | 0.42 | 0.76 | 0.44 | 0.47 | 0.28 | 0.82 | 0.39 | 0.55 |
| OF-RS | dNDVI | 0.78 | 0.70 | 0.1 | 0.37 | 0 | 0.25 | 0.1 | 0 | 0.36 | 0.36 |
| OF-RS | dNDVIT | 0.82 | 0.77 | 0.17 | 0.4 | 0 | 0 | 0 | 0.1 | 0.09 | 0.43 |
| OF-RS | dMSAVI | 0.78 | 0.71 | 0.1 | 0.44 | 0 | 0.1 | 0.1 | 0 | 0.36 | 0.36 |
| CF-S | dNDWI | 0.52 | 0.37 | 0.39 | 0.69 | 0.28 | 0.46 | 0.49 | 0.45 | 0.57 | 0.35 |
| Combinations of forest groups ** | |||||||||||
| OF-R + W-R | dNBR | 0.67 | 0.52 | 0.45 | 0.74 | 0.17 | 0.22 | 0.17 | 0.56 | 0.42 | 0.13 |
| OF-R + W-R | dNDWI | 0.60 | 0.44 | 0.42 | 0.72 | 0.22 | 0.35 | 0.2 | 0.49 | 0.53 | 0.17 |
| OF-RS + W-R(Inland Plains Woodland) | dNDVI | 0.67 | 0.56 | 0.3 | 0.47 | 0.21 | 0.23 | 0.3 | 0.11 | 0.54 | 0.32 |
| OF-RS + W-R(Inland Plains Woodland) | dNDVIT | 0.72 | 0.62 | 0.28 | 0.49 | 0.07 | 0.1 | 0.35 | 0.05 | 0.46 | 0.24 |
| OF-RS + W-R(Inland Plains Woodland) | dMSAVI | 0.74 | 0.65 | 0.27 | 0.41 | 0.07 | 0.17 | 0.2 | 0.11 | 0.46 | 0.24 |
* U, L, M and H stand for unburnt, low, moderate and high fire-severity classes; ** Forest groups were combined based on the similar responses observed for OF-R and W-R, as well as for OF-RS and Inland Plains Woodland (W-R); after combination, we calculated new thresholds and estimated their accuracy metrics.
Table 6.
Error assessment of fire-severity predictions (unburnt and low, UL, compared with medium and high, MH) based on thresholds for the best-performing spectral indices by forest group.
Table 6.
Error assessment of fire-severity predictions (unburnt and low, UL, compared with medium and high, MH) based on thresholds for the best-performing spectral indices by forest group.
| Forest Group | Spectral Indices | OA | Kappa | Commission Error * | Omission Errors * | ||
|---|---|---|---|---|---|---|---|
| UL | MH | UL | MH | ||||
| OF-R | dNBR | 0.84 | 0.61 | 0.43 | 0.02 | 0.05 | 0.19 |
| OF-R | dNDWI | 0.82 | 0.58 | 0.45 | 0.02 | 0.07 | 0.2 |
| W-R | dNBR | 0.81 | 0.56 | 0.47 | 0.02 | 0.07 | 0.22 |
| W-R | dNDWI | 0.79 | 0.51 | 0.5 | 0.03 | 0.1 | 0.23 |
| W-R (Inland Plains Woodland) | dNDVI | 0.84 | 0.70 | 0.26 | 0 | 0 | 0.28 |
| W-R (Inland Plains Woodland) | dNDVIT | 0.82 | 0.65 | 0.29 | 0 | 0 | 0.32 |
| W-R (Inland Plains Woodland) | dMSAVI | 0.84 | 0.70 | 0.26 | 0 | 0 | 0.28 |
| LW-R | dNBR | 0.77 | 0.54 | 0.27 | 0.17 | 0.13 | 0.33 |
| LW-R | dNBRT | 0.77 | 0.54 | 0.27 | 0.17 | 0.13 | 0.33 |
| OF-RS | dNDVI | 0.87 | 0.74 | 0.23 | 0 | 0 | 0.24 |
| OF-RS | dNDVIT | 0.87 | 0.74 | 0.23 | 0 | 0 | 0.24 |
| OF-RS | dMSAVI | 0.82 | 0.65 | 0.29 | 0 | 0 | 0.32 |
| CF-S | dNDWI | 0.88 | 0.82 | 0.21 | 0 | 0 | 0.22 |
© 2018 by the authors. Licensee MDPI, Basel, Switzerland. This article is an open access article distributed under the terms and conditions of the Creative Commons Attribution (CC BY) license (http://creativecommons.org/licenses/by/4.0/).
Share and Cite
MDPI and ACS Style
Tran, B.N.; Tanase, M.A.; Bennett, L.T.; Aponte, C. Evaluation of Spectral Indices for Assessing Fire Severity in Australian Temperate Forests. Remote Sens. 2018, 10, 1680. https://doi.org/10.3390/rs10111680
AMA Style
Tran BN, Tanase MA, Bennett LT, Aponte C. Evaluation of Spectral Indices for Assessing Fire Severity in Australian Temperate Forests. Remote Sensing. 2018; 10(11):1680. https://doi.org/10.3390/rs10111680
Chicago/Turabian StyleTran, Bang Nguyen, Mihai A. Tanase, Lauren T. Bennett, and Cristina Aponte. 2018. "Evaluation of Spectral Indices for Assessing Fire Severity in Australian Temperate Forests" Remote Sensing 10, no. 11: 1680. https://doi.org/10.3390/rs10111680
Note that from the first issue of 2016, this journal uses article numbers instead of page numbers. See further details here.