Article

Towards Global Volcano Monitoring Using Multisensor Sentinel Missions and Artificial Intelligence: The MOUNTS Monitoring System

1
Dep. Computer Vision & Remote Sensing, Technische Universität Berlin, 10587 Berlin, Germany
2
GFZ German Research Centre for Geosciences, Telegrafenberg, 14473 Potsdam, Germany
3
Dipartimento di Scienze della Terra, University of Torino, Via Valperga Caluso 35, 10125 Torino, Italy
4
Dipartimento di Scienze della Terra, University of Firenze, Via La Pira 4, 50121 Firenze, Italy
5
Geography Department, Humboldt University Berlin, Unter den Linden 6, 10099 Berlin, Germany
*
Author to whom correspondence should be addressed.
Remote Sens. 2019, 11(13), 1528; https://doi.org/10.3390/rs11131528
Submission received: 30 April 2019 / Revised: 6 June 2019 / Accepted: 18 June 2019 / Published: 27 June 2019
(This article belongs to the Special Issue Remote Sensing of Volcanic Processes and Risk)

Abstract

:
Most of the world’s 1500 active volcanoes are not instrumentally monitored, resulting in deadly eruptions which can occur without observation of precursory activity. The new Sentinel missions are now providing freely available imagery with unprecedented spatial and temporal resolutions, with payloads allowing for a comprehensive monitoring of volcanic hazards. We here present the volcano monitoring platform MOUNTS (Monitoring Unrest from Space), which aims for global monitoring, using multisensor satellite-based imagery (Sentinel-1 Synthetic Aperture Radar SAR, Sentinel-2 Short-Wave InfraRed SWIR, Sentinel-5P TROPOMI), ground-based seismic data (GEOFON and USGS global earthquake catalogues), and artificial intelligence (AI) to assist monitoring tasks. It provides near-real-time access to surface deformation, heat anomalies, SO2 gas emissions, and local seismicity at a number of volcanoes around the globe, providing support to both scientific and operational communities for volcanic risk assessment. Results are visualized on an open-access website where both geocoded images and time series of relevant parameters are provided, allowing for a comprehensive understanding of the temporal evolution of volcanic activity and eruptive products. We further demonstrate that AI can play a key role in such monitoring frameworks. Here we design and train a Convolutional Neural Network (CNN) on synthetically generated interferograms, to operationally detect strong deformation (e.g., related to dyke intrusions), in the real interferograms produced by MOUNTS. The utility of this interdisciplinary approach is illustrated through a number of recent eruptions (Erta Ale 2017, Fuego 2018, Kilauea 2018, Anak Krakatau 2018, Ambrym 2018, and Piton de la Fournaise 2018–2019). We show how exploiting multiple sensors allows for assessment of a variety of volcanic processes in various climatic settings, ranging from subsurface magma intrusion, to surface eruptive deposit emplacement, pre/syn-eruptive morphological changes, and gas propagation into the atmosphere. The data processed by MOUNTS is providing insights into eruptive precursors and eruptive dynamics of these volcanoes, and is sharpening our understanding of how the integration of multiparametric datasets can help better monitor volcanic hazards.

Graphical Abstract

1. Introduction

About 1500 volcanoes are considered active worldwide [1], with about 50–85 erupting volcanoes each year [2]. Unfortunately, due to the cost and difficulty to maintain instrumentation in volcanic environments, less than half of the potentially active volcanoes are monitored with ground-based sensors, and even less are considered well-monitored [3]. Numerous volcanic crises have sadly illustrated that this lack of monitoring capabilities can have dramatic consequences [4], as it was the case during the recent 2018 eruptions at Fuego (Guatemala) and Anak Krakatau (Indonesia), which were both responsible for over 430 dead and missing persons according to authorities [5,6]. Moreover, volcanoes considered dormant (no recent eruption) or extinct (no eruption for >10,000 years) are commonly not instrumentally monitored, but may experience large and unexpected eruptions, as it was the case for Chaiten (Chile) in 2008 which erupted after 8000 years of inactivity [7]. In this regard, satellite remote sensing can provide crucial observations when ground-based monitoring is limited or lacking, due to remote environments and/or limited resources. In turn, continuous long-term observations (i.e., monitoring) from space is key to identify background levels of activity, that will allow to better recognize signs of unrest when the activity is deviating from these baselines. Provided that precursor signals can be recorded, pre-eruptive monitoring can lead to better eruption early warnings, and syn-eruptive monitoring can provide critical information for hazard mitigation [8].
Indeed, eruptions are often (but not always) preceded by precursory signals which may last a few hours to a few years, indicating a state of unrest. These signals include changes in seismicity, ground deformation, gas emissions, and/or thermal anomalies [9,10,11]. Apart from seismicity, all of these can be monitored from space by exploiting various wavelengths across the electromagnetic spectrum: Synthetic Aperture Radar (SAR) is widely used for quantification of surface deformation [12,13], infrared (IR) for quantification of heat radiation [14], and ultraviolet (UV) for quantification of SO2 degassing [15,16]. During an eruption on the other hand, these space-borne sensors can provide additional support to track eruptive products. In particular, IR spectroscopy is used to estimate lava flow discharge rates [17,18], UV and IR spectroscopy to detect volcanic gas and ash clouds [19,20], whereas SAR processing allows for detection of areas covered by lava flows [21,22] and pyroclastic deposits [23,24].
Efforts to analyze these multi-sensor datasets on global and multi-decadal scales have provided insights into volcanic eruption dynamics and precursors [25,26,27,28,29], and are contributing to the development of strategies for global volcano monitoring. Operational implementations of such multi-sensor approaches into monitoring platforms, aiming at providing near-real-time (NRT) access to gas, thermal, and deformation data from satellites have been initiated by a number of transnational projects. Among the most prominent are the GlobVolcano project (2007–2010, [30]), the European Volcano Observatory Space Services (EVOSS, 2010–2013, [31]), and more recently the Disaster Risk Management (DRM) volcano pilot project led by the Committee on Earth Observation Satellites CEOS (2014–2017, [28]). In parallel, data and tools are shared on research infrastructures such as the European Plate Observing System (EPOS) or the World Organization of Volcano Observatories (WOVO, [32]) to stimulate communication and cooperation. Nevertheless, operational monitoring systems providing integrated multi-sensor analysis for volcano surveillance on global scale is still lacking.
Today, a growing number of new Earth Observation (EO) satellites is providing freely available imagery, with global coverage at unprecedented spatial and temporal resolutions, which is a game changer for volcano monitoring. In particular, the Copernicus Sentinel missions, launched by the European Space Agency (ESA), operate a range of instruments [33] which provide the potential for a comprehensive monitoring of volcanic unrest and eruptive dynamics, opening pathways to global, multisensor volcano monitoring. In parallel, due to the sharply-increasing satellite data volume, novel ways of data reduction and analysis by artificial intelligence (AI) are gaining relevance [34,35,36,37,38].
We here present the first operational volcano monitoring platform, incorporating multisensor satellite-based information (Sentinel-1 SAR, Sentinel-2 SWIR, Sentinel-5P TROPOMI), ground-based earthquakes information (Global Earthquake Catalogues GEOFON and USGS), and AI-assisted monitoring. The system currently monitors 17 volcanoes, located in various climatic and geologic settings across the globe: subduction zones (Colima, Popocatépetl, Fuego, Pacaya, Sangay, Sabancaya, Bezymianny, Klyuchevskoy, Udina, Krakatau, Ambrym, Etna), oceanic hotspots (Piton de la Fournaise, Kilauea), and continental rift zones (Nyiragongo, Nyamulagira, Erta Ale). The system is however designed to easily incorporate new targets to monitor, thanks in particular to the global-coverage and free-access of the data. We use freely-available processing toolboxes to perform routine data processing, and allow the user to investigate the multi-parametric results related to a given volcano through an open-access website (www.mounts-project.com). We demonstrate the utility of such an interdisciplinary approach through a number of recent eruptions, describing a range of volcanic processes which can be tracked, from subsurface magma migration, to surface eruptive deposit emplacement, pre/syn-eruptive morphological changes, and aerosol propagation into the atmosphere. In addition, we show how artificial intelligence can play a key role in monitoring tasks. We show how a pre-trained Convolutional Neural Network (CNN) can be incorporated into the processing pipeline to detect large deformation in InSAR interferograms (e.g., related to dyke intrusions), in an automated, timely, and robust fashion.

2. Background: Existing Space-Based Monitoring Systems

The majority of existing volcano monitoring systems are set up and operated by national monitoring agencies, and consequently focus on volcanoes located within their own political boundaries or limited regions of interest. The U.S. Geological Survey (USGS) for example, provides earthquake information on a global scale, but their Volcano Hazards Program monitors volcanoes on U.S. territory only (https://volcanoes.usgs.gov). Each monitored volcano has a dedicated webpage, where a standardized red-yellow-green Volcano Alert Level System (VALS) informs on the state of volcanic activity [39]. Similar systems are operated by several other countries in charge of monitoring active volcanoes on their territory. However, many volcanoes are located on political boundaries between neighboring countries and states, and therefore leave uncertainties concerning the responsibilities during eruptive crisis. In this regard, only a few satellite-based platforms have the scope to monitor volcanoes on a global scale. Such platforms are often operated by scientists at research institutions and universities, and have proven to be particularly important for volcano observatories which do not have the resources to operate a monitoring network. These however, usually focus on the analysis of one type of data: spectroradiometric imagery (IR and UV), or SAR. We hereafter briefly describe a selection of relevant operating satellite-based platforms which provide open data access on a global scale (Table 1), and expose afterwards the rationale behind MOUNTS.

2.1. Spectroradiometry-Based Systems (IR, UV)

The development of thermal remote sensing volcanic activity has seen a long evolution since the 1960s, with a significant expansion and development of autonomous monitoring systems after the beginning of the new millennium [14].
MODVOLC, developed in 2002 by the Hawai’i Institute of Geophysics and Planetology [40,41,42], is a widely used volcano thermal monitoring system which can be considered as the archetype of open-access satellite monitoring services. It is based on the autonomous analysis of MODIS (Moderate Resolution Imaging Spectroradiometer) IR data, which has 1 km spatial resolution. The system provides the location of high-temperature thermal anomalies, spectral radiance data, and heat flux estimates in NRT over all volcanoes around the globe, through an open interactive Web-GIS interface (http://modis.higp.hawaii.edu/).
MIROVA (Middle InfraRed Observation of Volcanic Activity, www.mirovaweb.it) is an enhanced NRT volcanic hot-spot detection system, based on the analysis of the MODIS Middle InfraRed (MIR) bands, developed by the University of Torino and the University of Firenze [43]. It currently monitors 215 volcanoes, and displays time series of various measurements, including the Volcanic Radiative Power (VRP) which measures the heat radiated by the volcanic activity, and higher level post-processed products such as lava effusion rates [44,45]. MOUNTS is strongly inspired by MIROVA, whose website template was used.
HOTVOLC is a monitoring system designed to achieve NRT monitoring of volcanic activity using geostationary satellite data (e.g., MSG-0 SEVIRI). It uses both IR and UV spectroradiometry analysis to monitor volcanic thermal activity, lava effusion rate [46], SO2 gas plume [47], and volcanic ash plume [48]. It is developed at the Observatoire de Physique du Globe de Clermont-Ferrand (France), and monitors ~50 volcanoes worldwide. HOTVOLC provides an interactive Web-GIS interface on which geocoded raster images and time series of the above mentioned parameters are visualized (http://hotvolc.opgc.fr).
The Global Sulfur Dioxide Monitoring Home Page, developed and maintained by NASA’s Atmospheric Chemistry and Dynamics Laboratory (www. https://so2.gsfc.nasa.gov/), is a reference portal that brings together volcanic and anthropogenic SO2 emission data from various monitoring systems. The results are based on the analysis of IR and UV data from different sensors that allow the development of the first inventory of volcanic SO2 emission at global scale [49]. The website provides an archive of daily SO2 emissions detected over different regions of volcanic interest that can be freely downloaded. NRT maps are also available through the various systems linked to the Global Sulfur Dioxide Monitoring Home Page.

2.2. SAR-Based Systems

SARVIEWS, developed by the University of Alaska Fairbanks (http://sarviews-hazards.alaska.edu), is a monitoring service based on the analysis of SAR imagery. The processing flow is triggered by an external alert system informing on an ongoing hazardous event, including volcanic eruptions, earthquakes, floods, or fires. By default it provides wrapped interferograms (6-day and 12-day) and Radiometric Terrain Correction (RTC) images computed over large spatial scales (~250 km wide). A Hybrid Pluggable Processing Pipeline (HyP3) allows on-demand higher level analysis, such as change detection algorithms. The derived products, although not available in open-access, have proven to be useful for operational volcano monitoring [50,51].
LiCS (Looking inside the Continents from Space) is developed by COMET (Centre for Observation and Modelling of Earthquakes, Volcanoes and Tectonics). The InSAR portal (https://comet.nerc.ac.uk/COMET-LiCS-portal/) is an interactive map which provides links to download interferograms and coherence maps computed from Sentinel-1 images on large spatial scales. Although the initial focus was the Alpine–Himalayan tectonic belt, the system has recently expanded to process volcanic areas globally. A volcano deformation database provides access to interferograms and coherence maps at several hundreds of volcanoes (https://comet.nerc.ac.uk/volcanoes/), with the intention to be used for monitoring purposes in the future [26].
The University of Miami Geodesy Laboratory developed a system which provides InSAR displacement time-series at a smaller number of selected volcano (https://insarmaps.miami.edu/). The system relies on automatic InSAR time series analysis of Sentinel-1 products, which allows visualization of the temporal evolution of deformation on a large number of points across the volcano. Such approaches can be useful to detect pre-eruptive inflation, which is often observed in closed volcanic systems [52].

2.3. Commercial Platforms

In recent years, commercial platforms have emerged, offering free visualization of open-access satellite imagery. Even though these are not specifically dedicated to volcano monitoring applications, they can be useful to volcano observatories which do not have the capability to download and process large volumes of data.
EO-Browser and Sentinel-hub Playground in particular (https://apps.sentinel-hub.com/sentinel-playground/ and https://apps.sentinel-hub.com/eo-browser/, respectively), make it possible to browse within a Web-GIS the complete archive of ESA Sentinel missions (Sentinel-1, Sentinel-2, Sentinel-3, Sentinel-5P), NASA Landsat missions (Landsat-5, 7 and 8), NASA MODIS imagery, and more. It gives the possibility to export image products in various formats, create time-lapse animation clips, and provides simple statistical analysis tools. Additional features are offered in commercial packages.
Google Earth Engine (GEE) gives access to several catalogs of open-access satellite imagery and geospatial datasets, and provides a platform to develop and run algorithms on Google’s cloud infrastructure at no cost. While the GEE Explorer provides a simple web interface to visualize satellite imagery, the GEE Code Editor (https://code.earthengine.google.com/) provides a web-based IDE (Integrated Development Environment) for the GEE JavaScript API (Application User Interface). This allows users to develop algorithms and run them on the cloud without having to download the data. Although useful for processing large amounts of data, such service is not at the moment an immediate resource for volcano monitoring.

3. Materials and Methods

3.1. Rationale of the MOUNTS System

Global volcano monitoring has the aim to assemble and provide timely information of physical and geochemical parameters at a large number of (or all) volcanoes worldwide. The information can in turn be useful to both the scientific and operational communities, to understand volcanic processes and mitigate volcanic hazards. The rationale behind MOUNTS is based on the following three requisites:
(1) To analyze the multi-sensor dataset offered by the Sentinel missions to provide the most complete and comprehensive understanding of volcanic processes (Figure 1). Specifically, the datasets considered are: (i) SAR imagery from Sentinel-1 (S1) to monitor surface deformation, morphological changes, and reflectivity changes, (ii) SWIR imagery from Sentinel-2 (S2) to monitor surface thermal anomalies, and (iii) TROPOMI SO2 data from Sentinel-5P (S5P) to monitor volcanic SO2 gas plumes. Ground-based data is also incorporated, by querying global earthquake catalogues (GEOFON and USGS) for earthquakes recorded in the vicinity of the volcano. The volcanic processes which can be apprehended from the integration of these datasets is summarized in Figure 1, and those flagged with an asterisk are illustrated in the paper.
(2) To disseminate the results of the analysis as: (i) geocoded images, and (ii) time series of key parameters extracted from these, so as to have a comprehensive understanding of their evolution through time. The results are published on an open-access website (www.mounts-project.com), with a design similar to MIROVA, whereby each monitored volcano is assigned a webpage following a standard template. Dissemination of these results is achieved in NRT, typically within <1–6 h following the availability of the source product on ESA’s Sentinel Data Hub. The availability of such products after sensing varies depending on the data type and processing level: typically <24 h from sensing for Sentinel-1 SLC (Single Look Complex) products, between 2 and 12 h from sensing for Sentinel-2 L1C (Level-1 C) products, and <3 h from sensing for Sentinel-5P NRTI (Near Real Time) SO2 products.
(3) To implement a modular architecture, allowing easy incorporation of (i) new data types to analyze, (ii) new targets to monitor (i.e., new volcanoes, or new regions of interests for a given volcano depending on the activity, e.g., Kilauea 10 × 10 km extent during regular volcanic activity, and/or Kilauea East Rift Zone 40 × 60 km extent during flank eruption), and (iii) new algorithms to process the data (i.e., new processing chains, or trained neural networks to solve specific tasks).
MOUNTS is the first system to integrate all these components on a unique platform, with open-access, and global coverage capability.

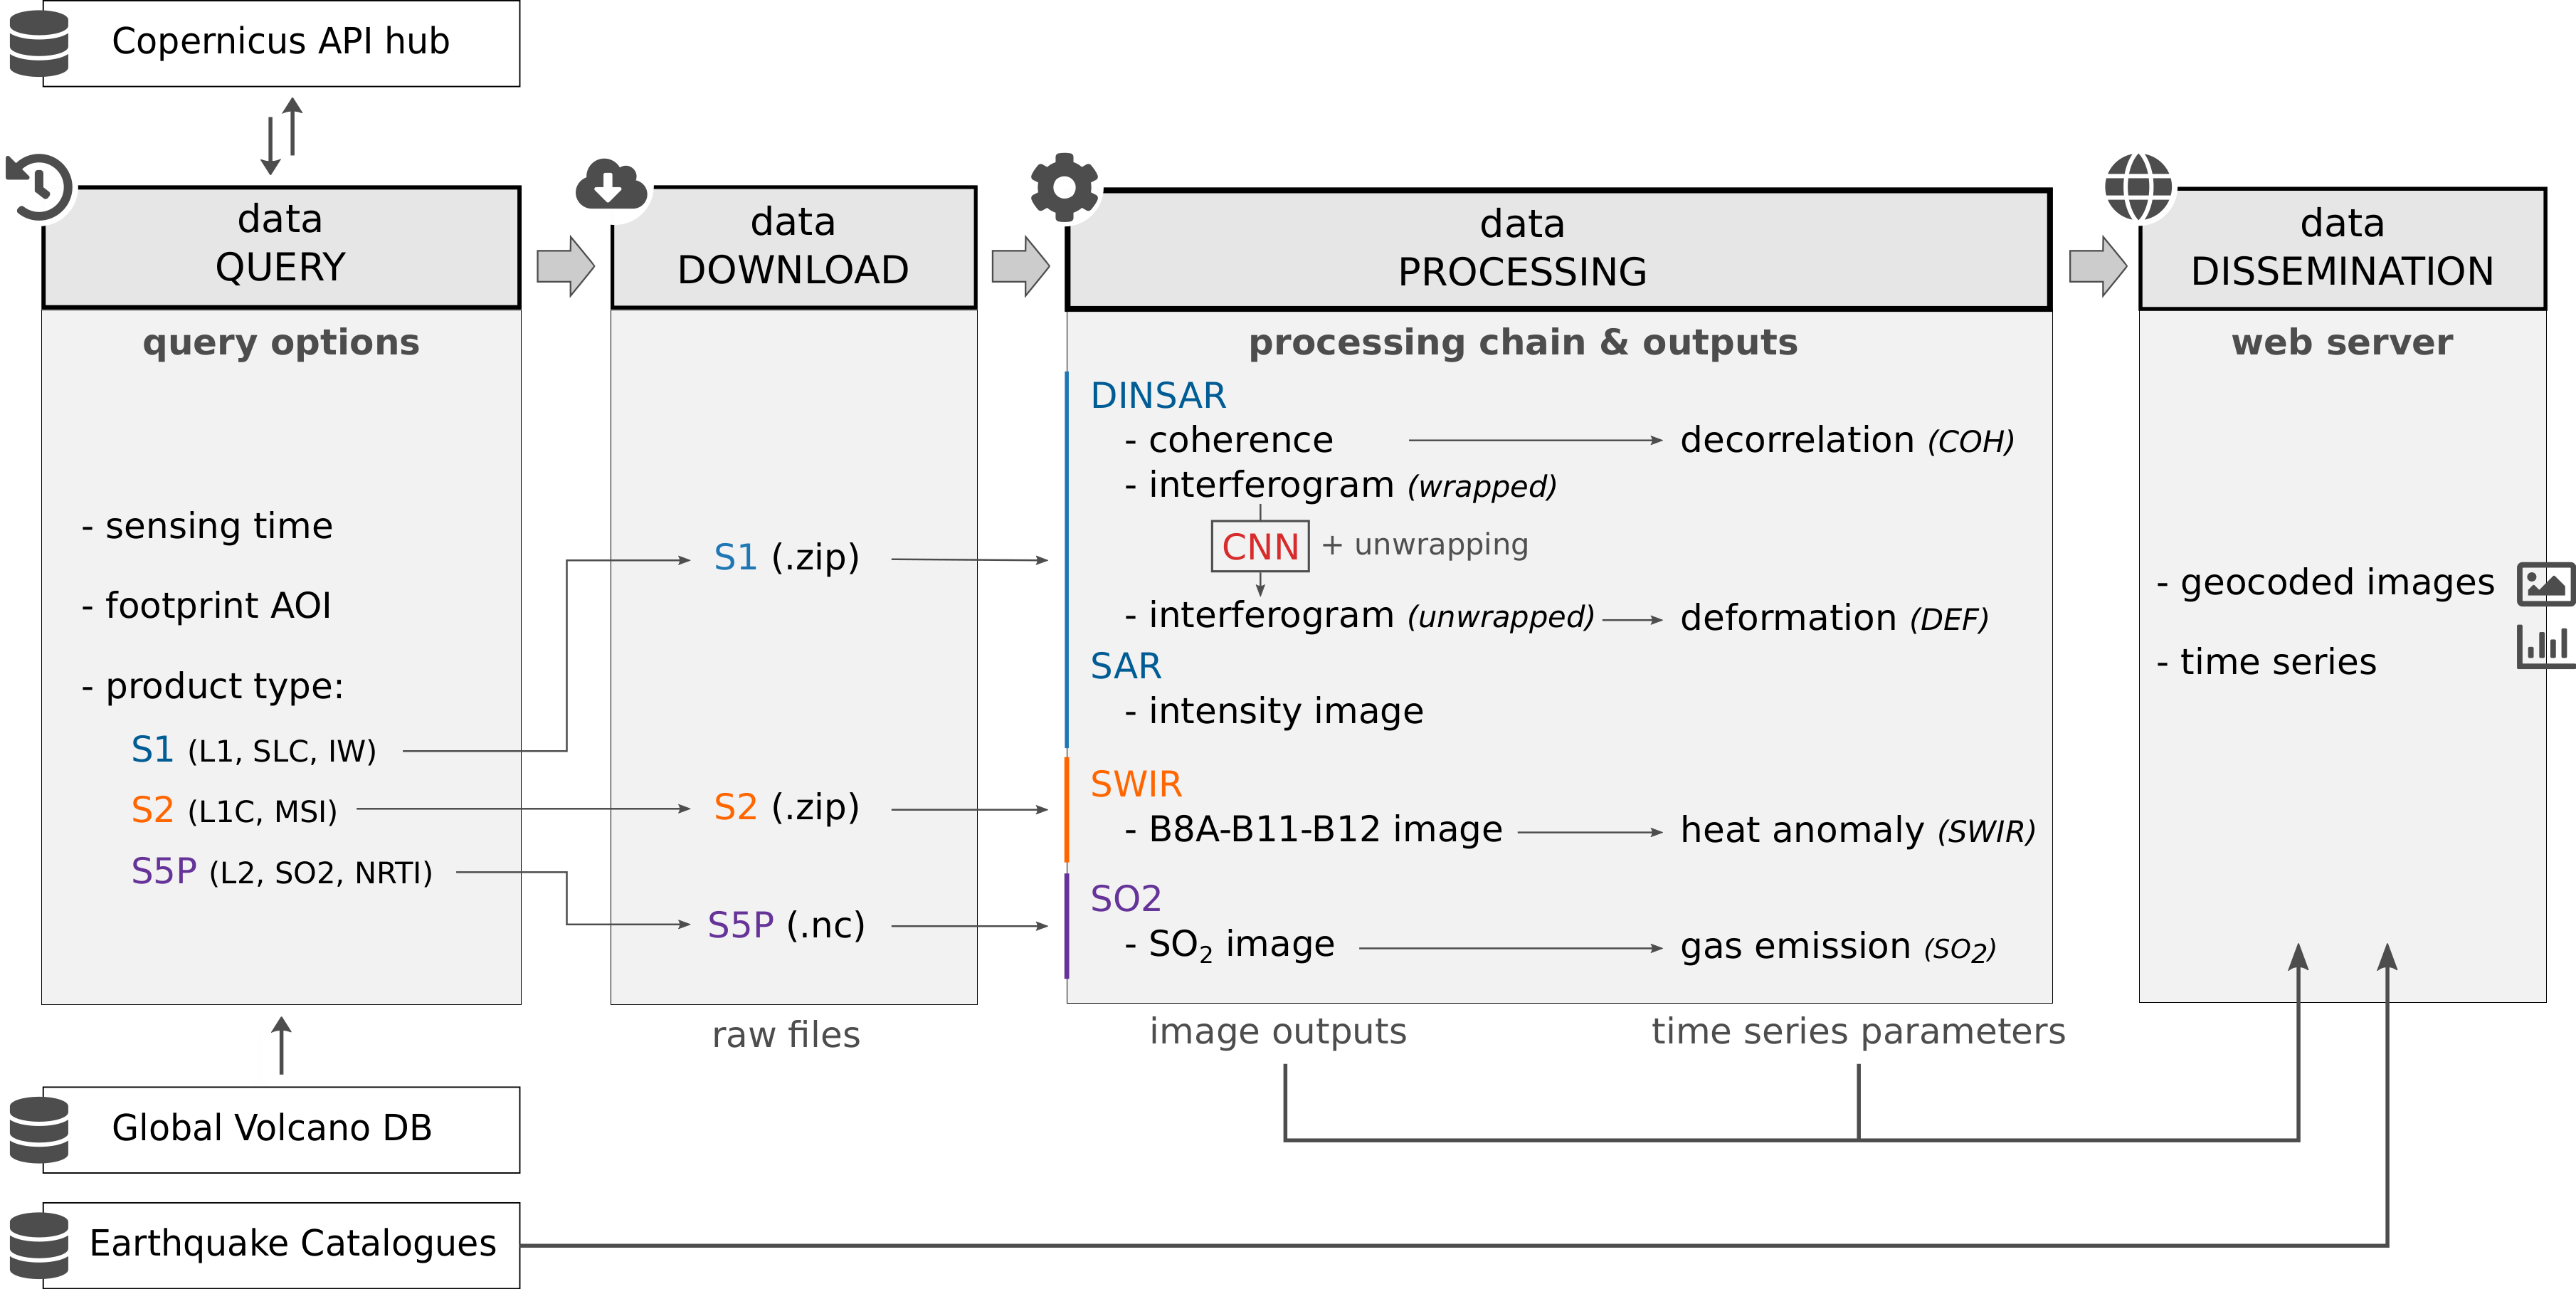
3.2. Workflow of the MOUNTS System

MOUNTS is based on freely available remote sensing data, open source toolboxes, and a modular architecture. The workflow is outlined in Figure 2, and the basic processing information is described hereafter. We refer the reader to the Supplementary Material S1 for more in-depth technical details on various aspects of the processing chain. The entire framework is managed with Python, and is composed of the following elements:
(1) Data query: the ESA Sentinel Data Hub is queried for new products at regular time intervals (typically every hour) using the Open Search API. Query options include the product type (i.e., platform name, file type), the product sensing time, and the footprint of the area of interest (AOI). Products types used by MOUNTS are the following: Sentinel-1 Level 1 (L1) Single Look Complex (SLC) Interferometric Wide (IW) products, Sentinel-2 Level 1C (L1C) products, and Sentinel-5P Level 2 (L2) Near Real Time (NRTI) SO2 products. The standard AOI for a specific volcano is defined as a 10 × 10 km mask centered around the volcano summit, but can be adapted based on specific requirements (e.g., Kilauea Rift Zone 40 × 60 km to monitor flank eruptions). Volcano name, coordinates, and identification number are taken from the Global Volcanism Program (GVP) database [1], maintained by the Smithsonian Institution. The volcanoes monitored by MOUNTS and the associated relevant information for data query and processing are stored in a local database.
(2) Data download: when a new product is found on the Sentinel data hub, the data is automatically downloaded, and its metadata is stored in a local database.
(3) Data processing: as soon as a product is downloaded it goes through the dedicated processing chain, which intends to generate both image files (geocoded) and extract key parameters which help visualize volcanic activity. Products are opened and processed using ESA’s open-source SNAP software (Sentinel Application Platform) through its Python API. The processing techniques applied to Sentinel-1, Sentinel-2, and Sentinel-5P products are described in Section 3.3.
(4) Data dissemination: the outputs of the processing chain are displayed on an open-access website (www.mounts-project.com). The web-design is based upon that of MIROVA, whereby all monitored volcanoes have a dedicated webpage displaying the same set of information. A range of tools have been incorporated to conveniently visualize the multi-parametric data, and thereby evaluate the volcanic activity (Figure 3).

3.3. Processing Techniques

3.3.1. Sentinel-1

The Sentinel-1 mission comprises two polar-orbiting satellites (Sentinel-1A and Sentinel-1B, launched in April 2014 and April 2016, respectively), each carrying a SAR operating at C-band [57]. As it is an active remote sensing instrument sending its own electromagnetic radiation, and as radar wavelengths are mostly unaffected by weather clouds, it provides data in all-weather, day and night conditions, making it particularly advantageous for volcano monitoring. The two-satellite constellation offers a 6 day exact repeat cycle at the equator. However, since the orbit track spacing varies with latitude, the revisit rate is significantly greater at higher latitudes than at the equator. MOUNTS uses Interferometric Wide (IW), Single Look Complex (SLC) products, where each pixel is encoded as a complex number containing information on both the intensity and the phase of the signal backscattered to the radar sensor. Both information can be exploited to retrieve parameters relevant to volcano monitoring [12,26]. In turn, MOUNTS operates two processing pipelines: a SAR pipeline to monitor reflectivity changes due to morphological changes (incoherent change detection), and a DInSAR (Differential SAR Interferometry) pipeline to monitor surface deformation and emplacement of eruptive deposits (coherent change detection).

SAR Processing

The amplitude component of a SAR image measures the energy backscattered to the radar antenna after the electromagnetic wave hits the surface. It depends on the surface slope (i.e., incidence angle of the wave front onto the surface), the surface roughness (i.e., specular or diffuse reflector), and the surface material (i.e., the dielectric constant, particularly affected by moisture content). For instance, a terrain with a slope facing towards the radar sensor will backscatterer a lot of energy to the radar (high amplitude signal), which will appear as bright pixels on the SAR image. Conversely, a slope facing away from the radar will appear as dark pixels (low amplitude). Volcanic ash will tend to smooth the terrain on which it is deposited, thereby acting like a specular reflector, which will tend to backscatter more energy if the radar viewing angle is orthogonal to the slope, but less energy if looking at an oblique angle [23].
As soon as an S1 product is downloaded, it goes through the SAR processing chain which creates a geocoded SAR intensity image (see Supplementary Material S1 for details). Visual inspection of this image can be useful for volcano monitoring even for non-experts, especially when optical images are not available because of cloud coverage. In particular, large surface topography changes and eruptive deposits are usually easily identifiable (see Section 4.3).
Retrieving parameters which can help characterize volcanic activity over time in a robust and automated fashion is however a difficult task. Various approaches have been used to detect and visualize changes in SAR imagery. “Low-cost” approaches usually involve “incoherent change detection”, which identifies surface intensity changes in successive SAR images. These changes can be visualized in a number of ways: (i) as difference maps, whereby the arithmetic difference, logarithmic ratio, or normalized change index (NCI) between two images is plotted [58,59,60], or (ii) as composite RGB image, where two bands are assigned to the first and second SAR image, and the third band to one of the difference map described above (e.g., [23,24]). More advanced techniques track features in the radar image prior to geocoding (i.e., radar coordinates in range and azimuth) to quantify morphological changes. Tracking radar shadows, for example, has proven useful to detect crater deepening [23], infilling of valleys by pyroclastic flows [24], and lava lake level variations [61]. Tracking the position of specific reflectors on the other hand, has proven capable of quantifying volcanic dome growths [62]. Such techniques unfortunately require a lot of manual tuning to adapt to each volcano, and are consequently a difficult approach for global monitoring. In this paper we instead favor the logarithmic ratio approach, in which we color code areas where the intensity has increased and decreased to red and blue respectively (see Section 4.2.2).

DInSAR Processing

SAR interferometry exploits the phase difference between two SAR images having similar viewing geometries, in order to measure both surface topography and displacements. More specifically, InSAR processing is commonly used to generate digital elevation maps, whereas DInSAR processing (Differential InSAR) successively subtracts the terrain elevation to retrieve surface deformation between the two acquisitions [63,64,65,66]. While these techniques typically exploit only two images, more advanced techniques known as “time series processing” exploit multiple images to retrieve more accurate deformation time series (i.e., Permanent Scatters PS and Small Baseline SBAS, see [67] for a review). The accuracy difference between DInSAR and time series approaches is about one order of magnitude, i.e., from centimeter to millimeter accuracy [68]. However, time series techniques require a lot of computing power and are therefore not performed by MOUNTS, which instead focuses on the two-image DInSAR approach.
Each time a new SAR image (S1 IW SLC product) is downloaded by MOUNTS, it goes through a DInSAR processing chain with the preceding acquisition (shortest temporal baseline, typically 6–12 days) from the same relative orbit. Processing of the image pair is performed with SNAP, freely distributed by ESA, and managed through a Python API. Back-geocoding and terrain correction are by default achieved with the SRTM-3 DEM. No multilooking is performed, so that the ground pixel resolution of the output products is 14 × 14 m. We refer the reader to the Supplementary Material S1 for more details on the processing chain. The outputs are typically an interferogram and a coherence map. The interferogram depicts the deformation of the ground along the sensor’s line-of-sight (LOS) direction, and is displayed with values ranging between 0 and 2π which appear as a series of fringes (i.e., “wrapped” interferogram). The coherence is a measure of the interferometric quality, as it is related to the level of noise affecting the phase difference between the two SAR images. It ranges between 0 and 1, and reflects the degree of surface change, where values towards 0 indicate a loss of InSAR coherence (i.e., decorrelation). The main contributions to decorrelation are phase noise due to (i) the temporal change of the scatterers (e.g., vegetation, water, sand-covered areas will appear highly incoherent as the scatterers change continuously), (ii) geometric decorrelation (i.e., images have slightly different look-angles), and (iii) variation in atmospheric water vapor content. Although decorrelation usually renders interferograms useless for measuring ground deformation, it can be used to detect changes in the ground properties (e.g., emplacement of lava flows and eruptive deposits, delineation of eruptive fissures, etc.).
Both the interferogram and coherence image are successively analyzed to derive quantitative parameters, which are meant to be plotted as time series and consequently inform on the evolution of relevant volcanic processes through time. The interferogram analysis is intended to detect strong ground deformation occurring in short time intervals (i.e., between two successive S1 acquisitions, usually 6 to 12 days apart), which typically imprint as multiple narrow fringes (one fringes in Sentinel-1 interferograms represents 2.8 cm displacement in the radar line-of-sight). Processes such as magma intrusion (dykes), caldera collapse, or sudden flank movements are typically detected. The deformation detection is performed using artificial intelligence, which recovers filtered phase gradients in wrapped geocoded interferograms. Unwrapping of the phase gradients is successively performed to recover a deformation map, from which a deformation score (DEF) informing on the amount of ground displacement is computed. The approach is described in detail in Section 3.4 and in Supplementary Material S2. The coherence map, on the other hand, is analyzed to derive a decorrelation score (COH), which counts the number of pixels below a given coherence threshold. Although this parameter can fluctuate due to a number of non-volcanic processes (see phase noise sources described above), it can be useful to track eruptive deposits (e.g., fresh lava flows, pyroclastic deposits, etc.).
Hence, for each new SAR acquisition, an interferogram and coherence map are generated (shortest temporal baseline possible, typically 6 or 12 days), and disseminated on the website. From these, a deformation and decorrelation score are respectively computed, which are plotted as time series on the website.

3.3.2. Sentinel-2

The Sentinel-2 mission comprises two polar-orbiting satellites, Sentinel-2A and Sentinel-2B (launched in June 2015 and March 2017, respectively), placed at 180° from each other in the same sun-synchronous orbit. They carry a Multispectral Instrument (MSI) providing multispectral data in 13 bands spanning from visible (VIS) to short-wave infrared (SWIR) wavelengths. The SWIR channels in particular, allow for detection of thermal emission produced by hot bodies. Considering a revisit frequency of five days under cloud-free conditions (reduced to 2–3 days at mid-latitudes), and a spatial resolution of 20 m/pixel in the SWIR bands, Sentinel-2 provide important measurements for volcano thermal monitoring. Specifically, analysis of thermal and morphometric features of heat sources facilitates tracking of a series of volcanic processes, including lava flow advancements, lava lake pulses, extrusion phases of lava domes, fumarolic activity, thermal activity at multiple active craters, and rise of magma column in open-vent volcanic systems (e.g., [69,70]).
MOUNTS downloads and analyzes Sentinel-2 Level 1C products. We use an approach presented in [55], which is an enhancement of the HOTMAP detection algorithm developed by [71]. It is based on fixed ratios between SWIR bands, and on a contextual threshold derived from a statistical distribution of the thermal anomaly clusters. Images are analyzed considering the TOA (Top of the Atmosphere) reflectance of the 12-11-8A bands (R: 2190 nm, ρ12; G: 1610 nm, ρ11; B: 865 nm, ρ8a). The algorithm detects the number of “hot” pixels in each downloaded image, and stores this parameter (SWIR) which can be displayed in time series. This thermal algorithm was already successfully verified on different volcanic cases worldwide, and compared with MIROVA data, showing a strong correlation between the detected number of “hot” pixels in Sentinel-2, and the VRP [55].

3.3.3. Sentinel-5P

SO2 emissions are recovered from the imaging spectrometer TROPOMI on-board the Sentinel-5P satellite (launched in 2017, data available since December 2018). It offers data with a revisit frequency of 1 day, at exceptionally high spatial resolution (7 × 3.5 km2) and detection limit (respectively 13 and 4 times better than the heritage Ozone Monitoring Instrument (OMI)), thereby opening the possibility to detect volcanic SO2 with an unprecedented precision [16]. SO2 slant column densities are retrieved by TROPOMI using differential optical absorption spectroscopy (DOAS) in the UV spectra (312–326 nm). Final gas densities are provided as vertical column densities (VCDs), for 1 km thick boxes at three different altitudes: 0–1 km (planet boundary layer, PBL), 6.5–7.5 km (mid-troposphere), and 14.5–15.5 km (upper troposphere). ESA disseminates the data as near-real time (NRTI) products, available during 1 month after acquisition, after which they are replaced by Offline (OFFL) products. OFFL products are based upon consolidated calibration and auxiliary data and thus provide better data quality data compared to NRTI products.
MOUNTS downloads Level 2 NRTI products, and processes them to retrieve SO2 mass found in a 500 × 500 km box centered around the volcano. Vertical column SO2 densities are first converted from mol·m−2 to the more commonly used Dobson Unit (DU), using a multiplication factor of 2241,15. SO2 mass is then calculated following [72]:
MSO 2 = 0.0285 i = 0 n A i SO 2 i ,
where MSO2 is the mass of SO2 (in tons), and Ai and SO2i are respectively the area (7 × 3.5 km2) and the density (in DU) at each pixel i of the 0–1 km VCD (PBL). Pixels contaminated with SO2 are successively isolated by creating a mask where DU > 1, to which is successively applied a morphological filter (i.e., erosion + dilatation operators, structuring element of 5 × 5 pixels), which allows for removal of noisy pixels. The remaining pixel clusters are assumed to be of volcanic origin, and the resulting SO2 mass is assigned to the volcano for the time series display.
The 500 × 500 km box size is chosen arbitrarily to capture large SO2 plumes. However, several monitored volcanoes may be located within this area, potentially resulting in redundant SO2 anomalies. Although visual inspection of the image helps identify the emitting volcano, future developments will focus on using wind models to discriminate the emission source, and therefore recover more accurate SO2 emissions for each volcano.

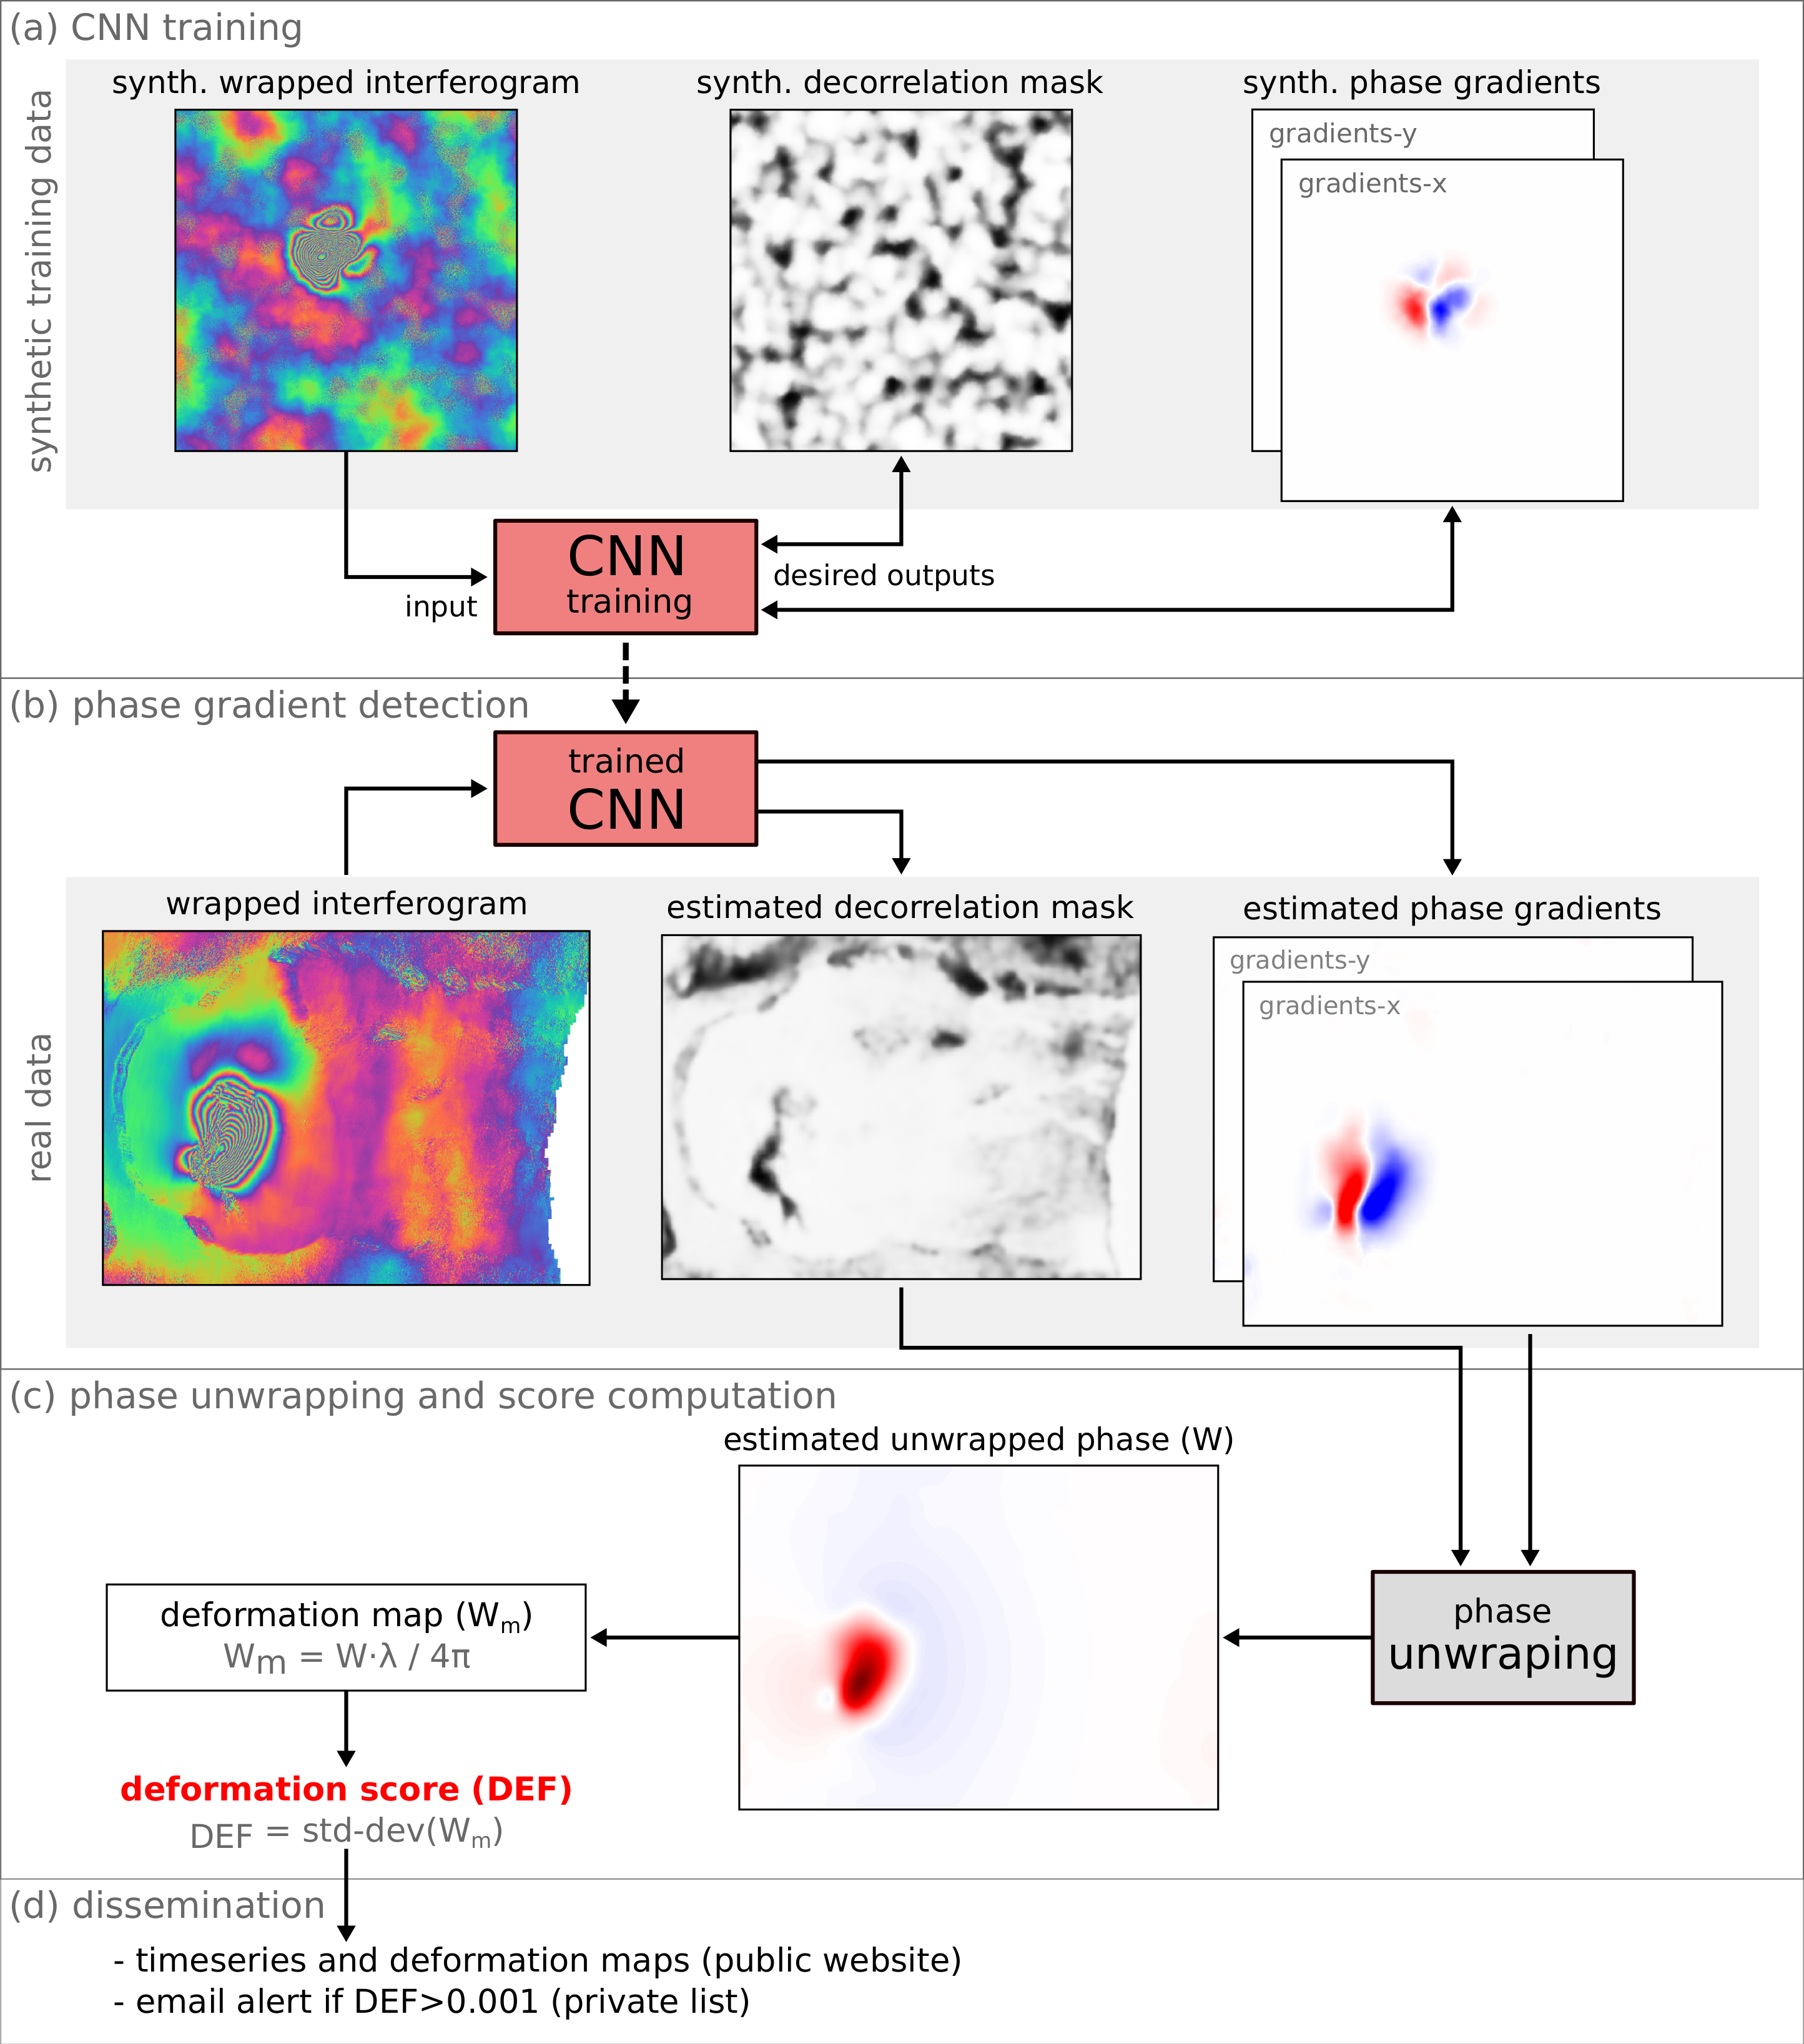
3.4. Machine Learning in Support of Deformation Detection

Machine learning algorithms can help solve specific tasks without being explicitly programmed, relying instead on patterns learned from a training dataset. We here show how trained Convolutional Neural Networks (CNN) can be plugged into the workflow to automatically detect large ground deformation in interferograms (Figure 4).
Synthetic data was first generated to train the network. The goal was to produce synthetic interferograms, wrapped and orthorectified, depicting realistic deformation fringes and phase decorrelation related to various artifacts (i.e., atmospheric phase delays, geometric distortions due to orthorectification, phase decorrelation due to vegetated areas, etc.). We synthesized the data from a combination of procedural noise and empirical rules, which although not physically motivated, can express a wide range of patterns similar to those found in real data (at least locally). The network was designed as a fully convolutional auto encoder built out of residual learning blocks (inspired by ResNet, [73]). Details on the synthetic data generation and network architecture can be found in Supplementary Material S2, and the trained CNN can be accessed on a Github repository (https://github.com/Andreas-Ley/SAR-InterfPhaseFilter).
The network was then trained to recover from the synthetic interferograms (provided as input), the associated phase gradients and phase decorrelation mask (expected outputs), Figure 4a. Once trained, the network is plugged into the processing pipeline (Figure 4b): newly generated interferograms are fed through this pre-trained network, which yields both the phase gradients and phase decorrelation (i.e., noise mask). Unwrapping of these phase gradients is successively performed to recover approximate ground displacements (Figure 4c), where robustness against artifacts that might trigger false alarms is preferred over precise phase differences. The unwrapping simply solves for a displacement map whose gradients match the gradients estimated by the CNN. Since the CNN performs the filtering of the gradients and detection of noise, treatment of decorrellated areas in the unwrapping is rather simple. From this displacement map a deformation score is ultimately computed (DEF), as the standard deviation of the displacements expressed in meters in the radar line-of-sight (LOS). This data is then disseminated (Figure 4d) and can be used to plot time series that allow for identification of strong deformation events. In addition, automated email alerts are sent to interested users when a threshold is exceeded. Based on empiric evaluation of all 17 volcanoes currently monitored by MOUNTS, representing a total of >1360 interferograms, the threshold was set to 0.001 m. This value can however be tuned for each volcano, to adapt to specific volcanic activity or monitoring requirements.
A similar approach involving CNN has been presented by [34] to detect large deformation signals in short-duration, wrapped and geocoded interferograms. The main differences to our approach are the following: (i) training is performed on real interferograms, combined with a data augmentation approach to increase the number of interferograms where deformation is recorded; we instead create synthetic training data, allowing the generation of an unlimited number of interferograms, and avoiding the time-consuming task of labeling interferograms where deformation is identified; (ii) edge detection is applied to the interferograms (during both training and prediction processes), to identify phase jumps between fringes, which are subsequently considered as noise-free regions where deformation can be detected; our network instead is trained to output a decorrelation mask informing on the degree of phase noise, successively used to filter noisy regions in the interferogram where erroneous gradients could be detected, (iii) the network output is a deformation probability; our network outputs clean phase gradients (and decorrelation mask for additional cleaning), which can be successively unwrapped to compute ground deformation maps, from which a physically meaningful score can be derived (i.e., standard deviation expressed in meters), (iv) the authors fine-tuned a popular network (AlexNet, [74]), whereas the architecture of our network was designed from scratch and trained on our synthetic dataset, thereby allowing more flexibility in the desired outputs.
We compare the performances of the two approaches using the same evaluation metrics used in their study, which are derived from the confusion matrix: accuracy (ratio between correctly predicted samples and all testing samples), true positive rate (TPR, ratio between correctly identified positive samples and all positive samples), and true negative rate (TNR, ratio between correctly identified negative samples and all negative samples). Table 2 shows the performances of both networks, tested on the same volcanoes (Erta Ale, Ethiopia, and Etna, Italy), and highlights the good performances of our CNN.
Synthetic data can only seldomly cover the full range of variations and all the corner cases that can be observed in the real world, and is thus usually inferior to real data. However, there are also benefits that make it an attractive choice: with synthetic data the ground truth values of what is to be predicted are known and can be used for the training. Also, since arbitrary amounts of data can be generated, overfitting due to insufficient data is not an issue, and the generalization capability of the final model depends primarily on the realism of the synthetic data. While the present work was under review, a study using synthetic interferograms to train neural networks was published [35]. Unlike our study, the authors generate deformation patterns based on analytic models simulating realistic deformation sources in volcanic settings (i.e., Mogi and Okada sources in particular), and model stratified atmospheric effects from weather models (i.e., GACOS). This approach incorporates expert knowledge into the network via the training data, and opens pathways to potentially recover deformation sources properties from the interferogram in an automatic fashion.

4. Results

We hereafter show how the products derived from S1, S2, and S5P analysis can help monitor various aspects of volcanic activity. The usefulness of each of these parameters varies from one volcano to another, due to both varying volcanic activity (i.e., effusive vs. explosive, open-vent vs. close-vent) and climatic setting (i.e., desert vs. tropical environment). For this reason, we here take various eruptive case examples, where the utility of each of these parameters is best illustrated. Below we successively describe processes related to magma migration towards the surface, effusive and explosive eruptive deposit emplacement, as well as SO2 gas plume propagation in the atmosphere.

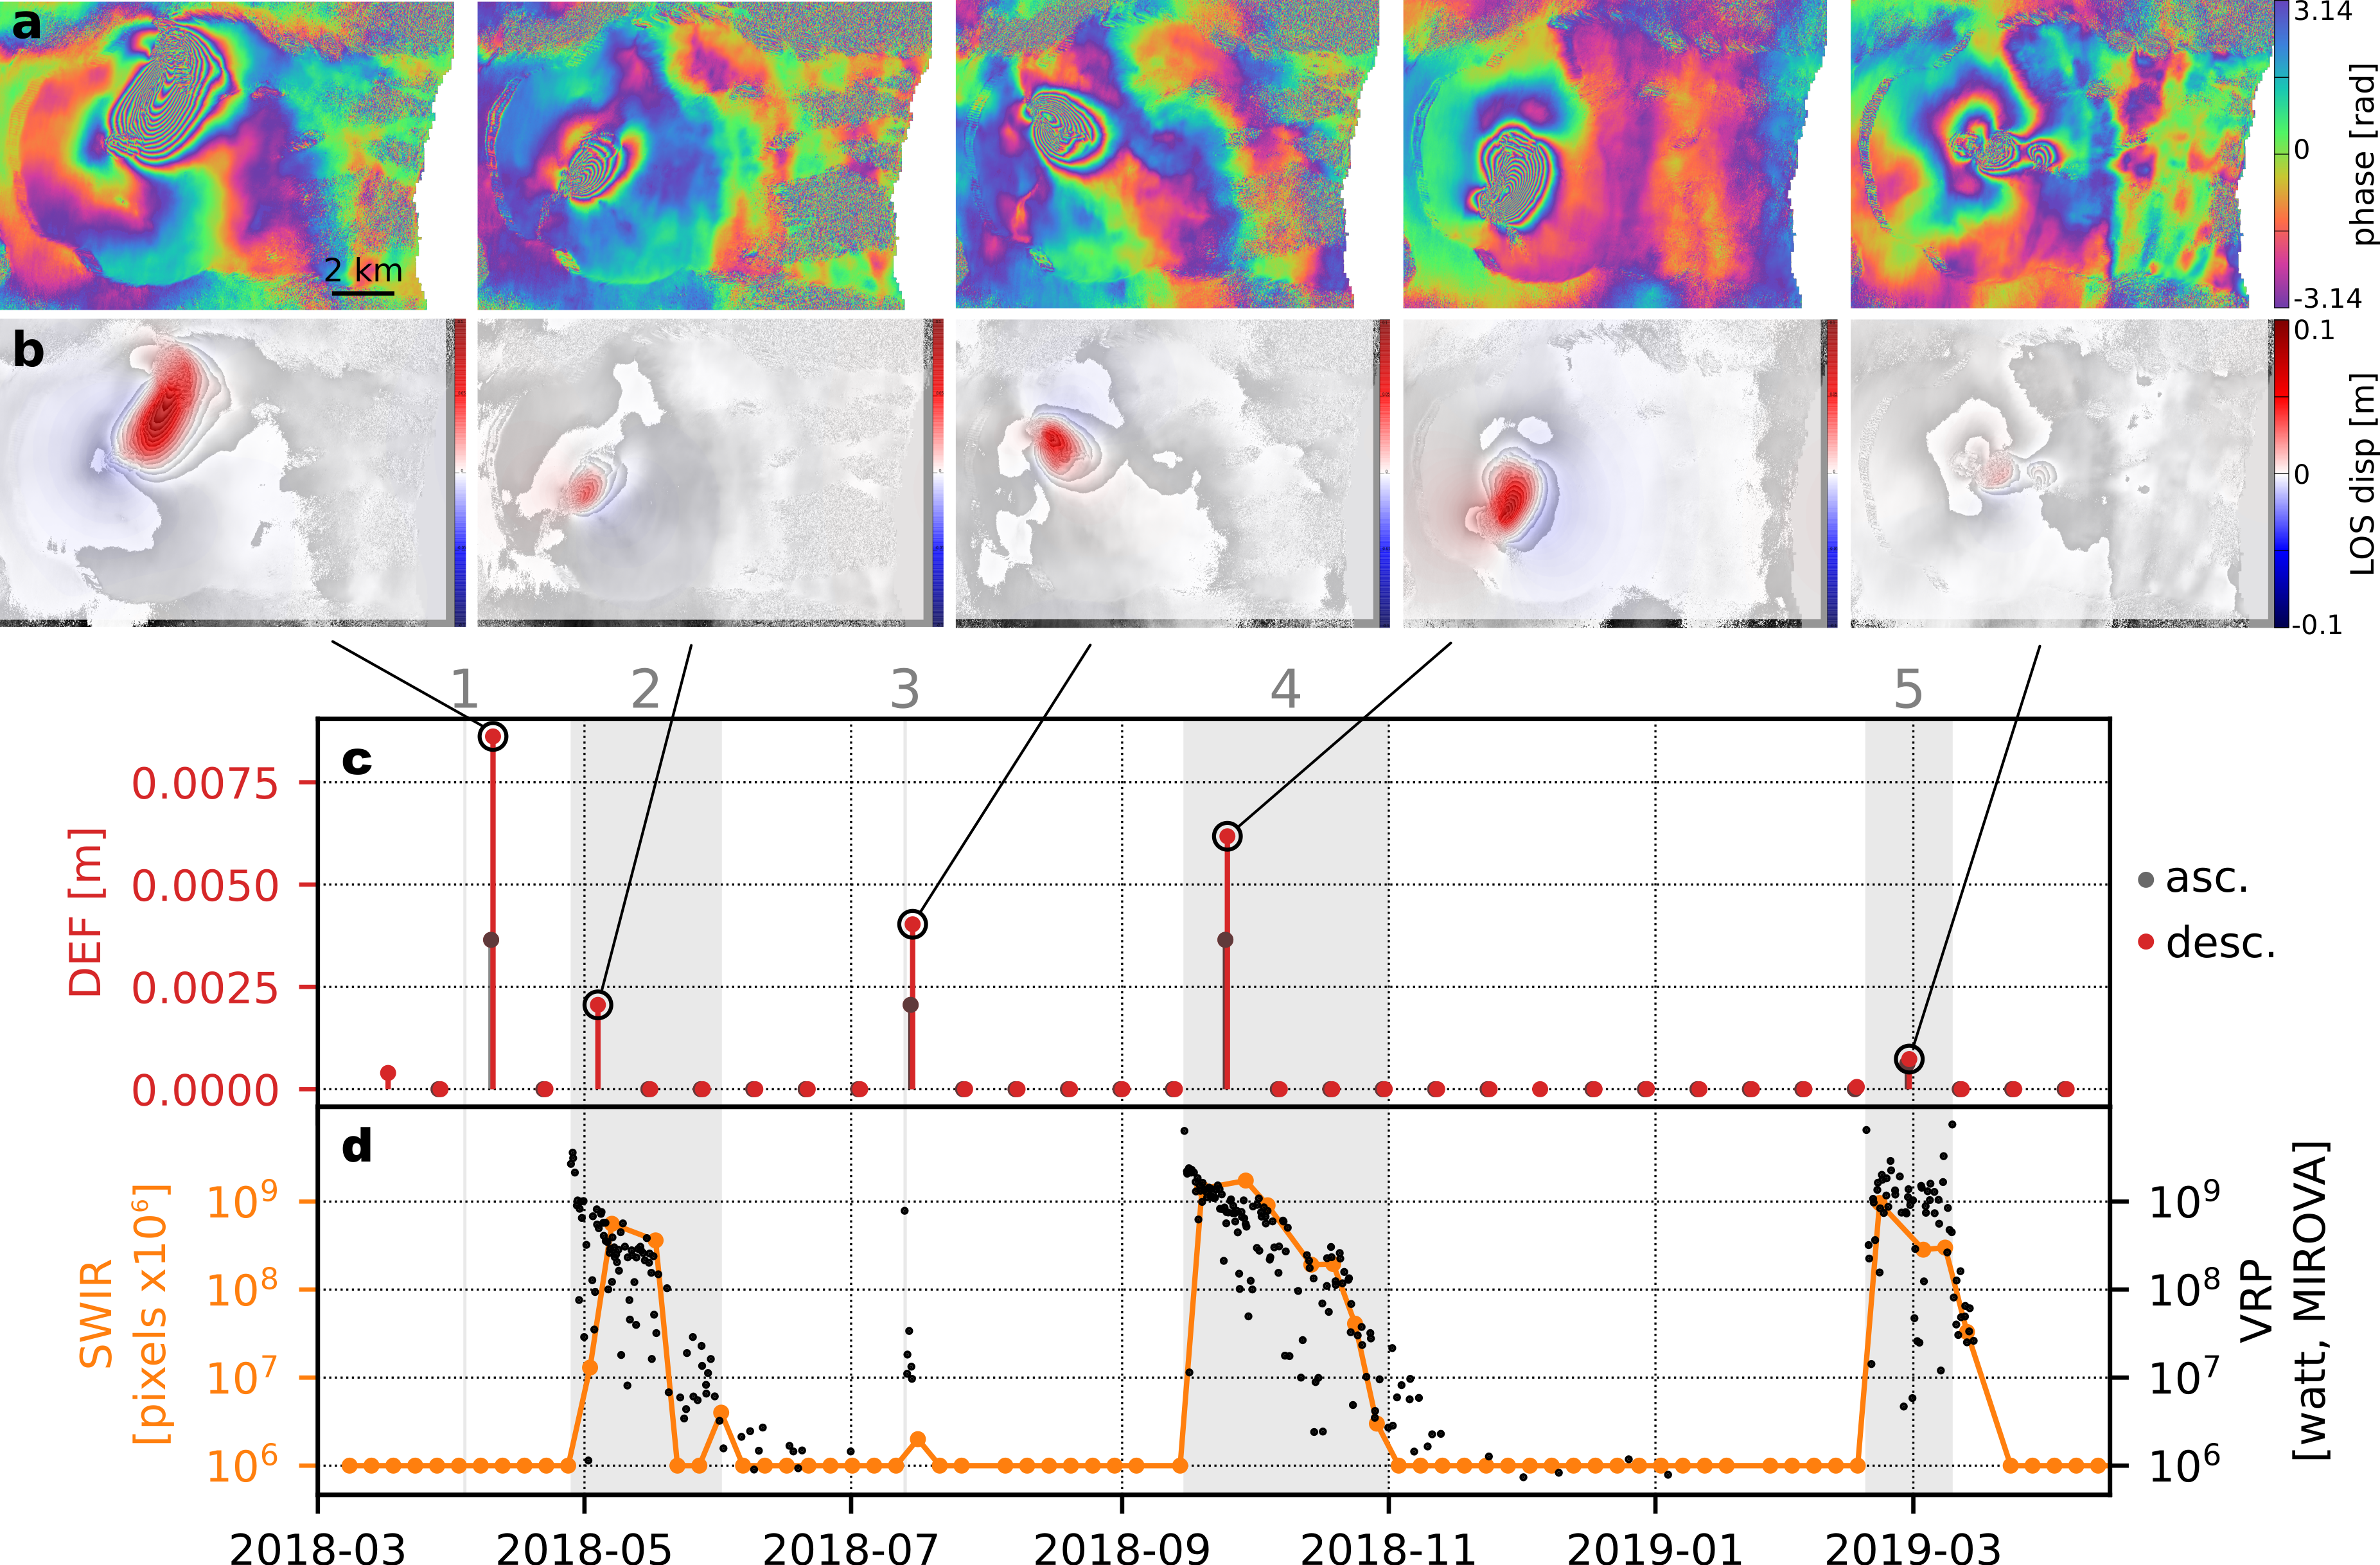
4.1. Detection of Surface Deformation (DInSAR, AI)

A number of processes can cause ground deformation at volcanoes: dyke intrusions, reservoir pressurization, caldera subsidence, cooling of eruptive deposits (lava/pyroclastic flows), landslides, etc. These can to some extent be distinguished based on distinctive patterns of ground displacement imaged in the interferograms [75]. As described previously, MOUNTS focuses on the automatic detection of processes generating large ground deformations in short time intervals (i.e., between two successive S1 acquisitions, usually 6 to 12 days apart), which typically imprint on interferograms as many colored fringes. In particular, dyke intrusions (whereby magma intrudes into a fissure and pushes the surrounding rock aside), are commonly characterized by two lobes with opposite displacements directions, that imprint as a “butterfly” shape. If the dyke reaches the surface, it will result in eruptive fissures/eruptive vents from which lava flows are emplaced.
Figure 5 illustrates the efficiency of this automated deformation detection system, taking the case of Piton de la Fournaise (Réunion Island) as an example. The volcano experienced 5 intrusive episodes in the past year (April 2018–April 2019), all of which reached the surface and resulted in lava flows that lasted between 0.7–47 days (episode 1 and 4 respectively). The system successfully detected the interferograms where ground deformation is recorded (Figure 5a–c), illustrating its robustness against various artifacts in the geocoded interferogram (related to strong topography gradients, strong atmospheric phase noise, and decorrelation in vegetated areas). Furthermore, thermal anomalies detected by S2 SWIR analysis (i.e., number of hot pixels) are compared with the Volcanic Radiative Power (VRP) provided by the MIROVA system (Figure 5d) to testify the good correspondence between the active flow area and the heat radiated by the flow surface.
The systematic analysis of both ground deformation (amplitude, pattern, orientation) related to the intrusion of magma in the shallow portions of the edifice, and lava effusion rate once the magma breaches the surface, should help better understand the mechanisms controlling effusive eruptions in closed-vent volcano systems such as Piton de la Fournaise.

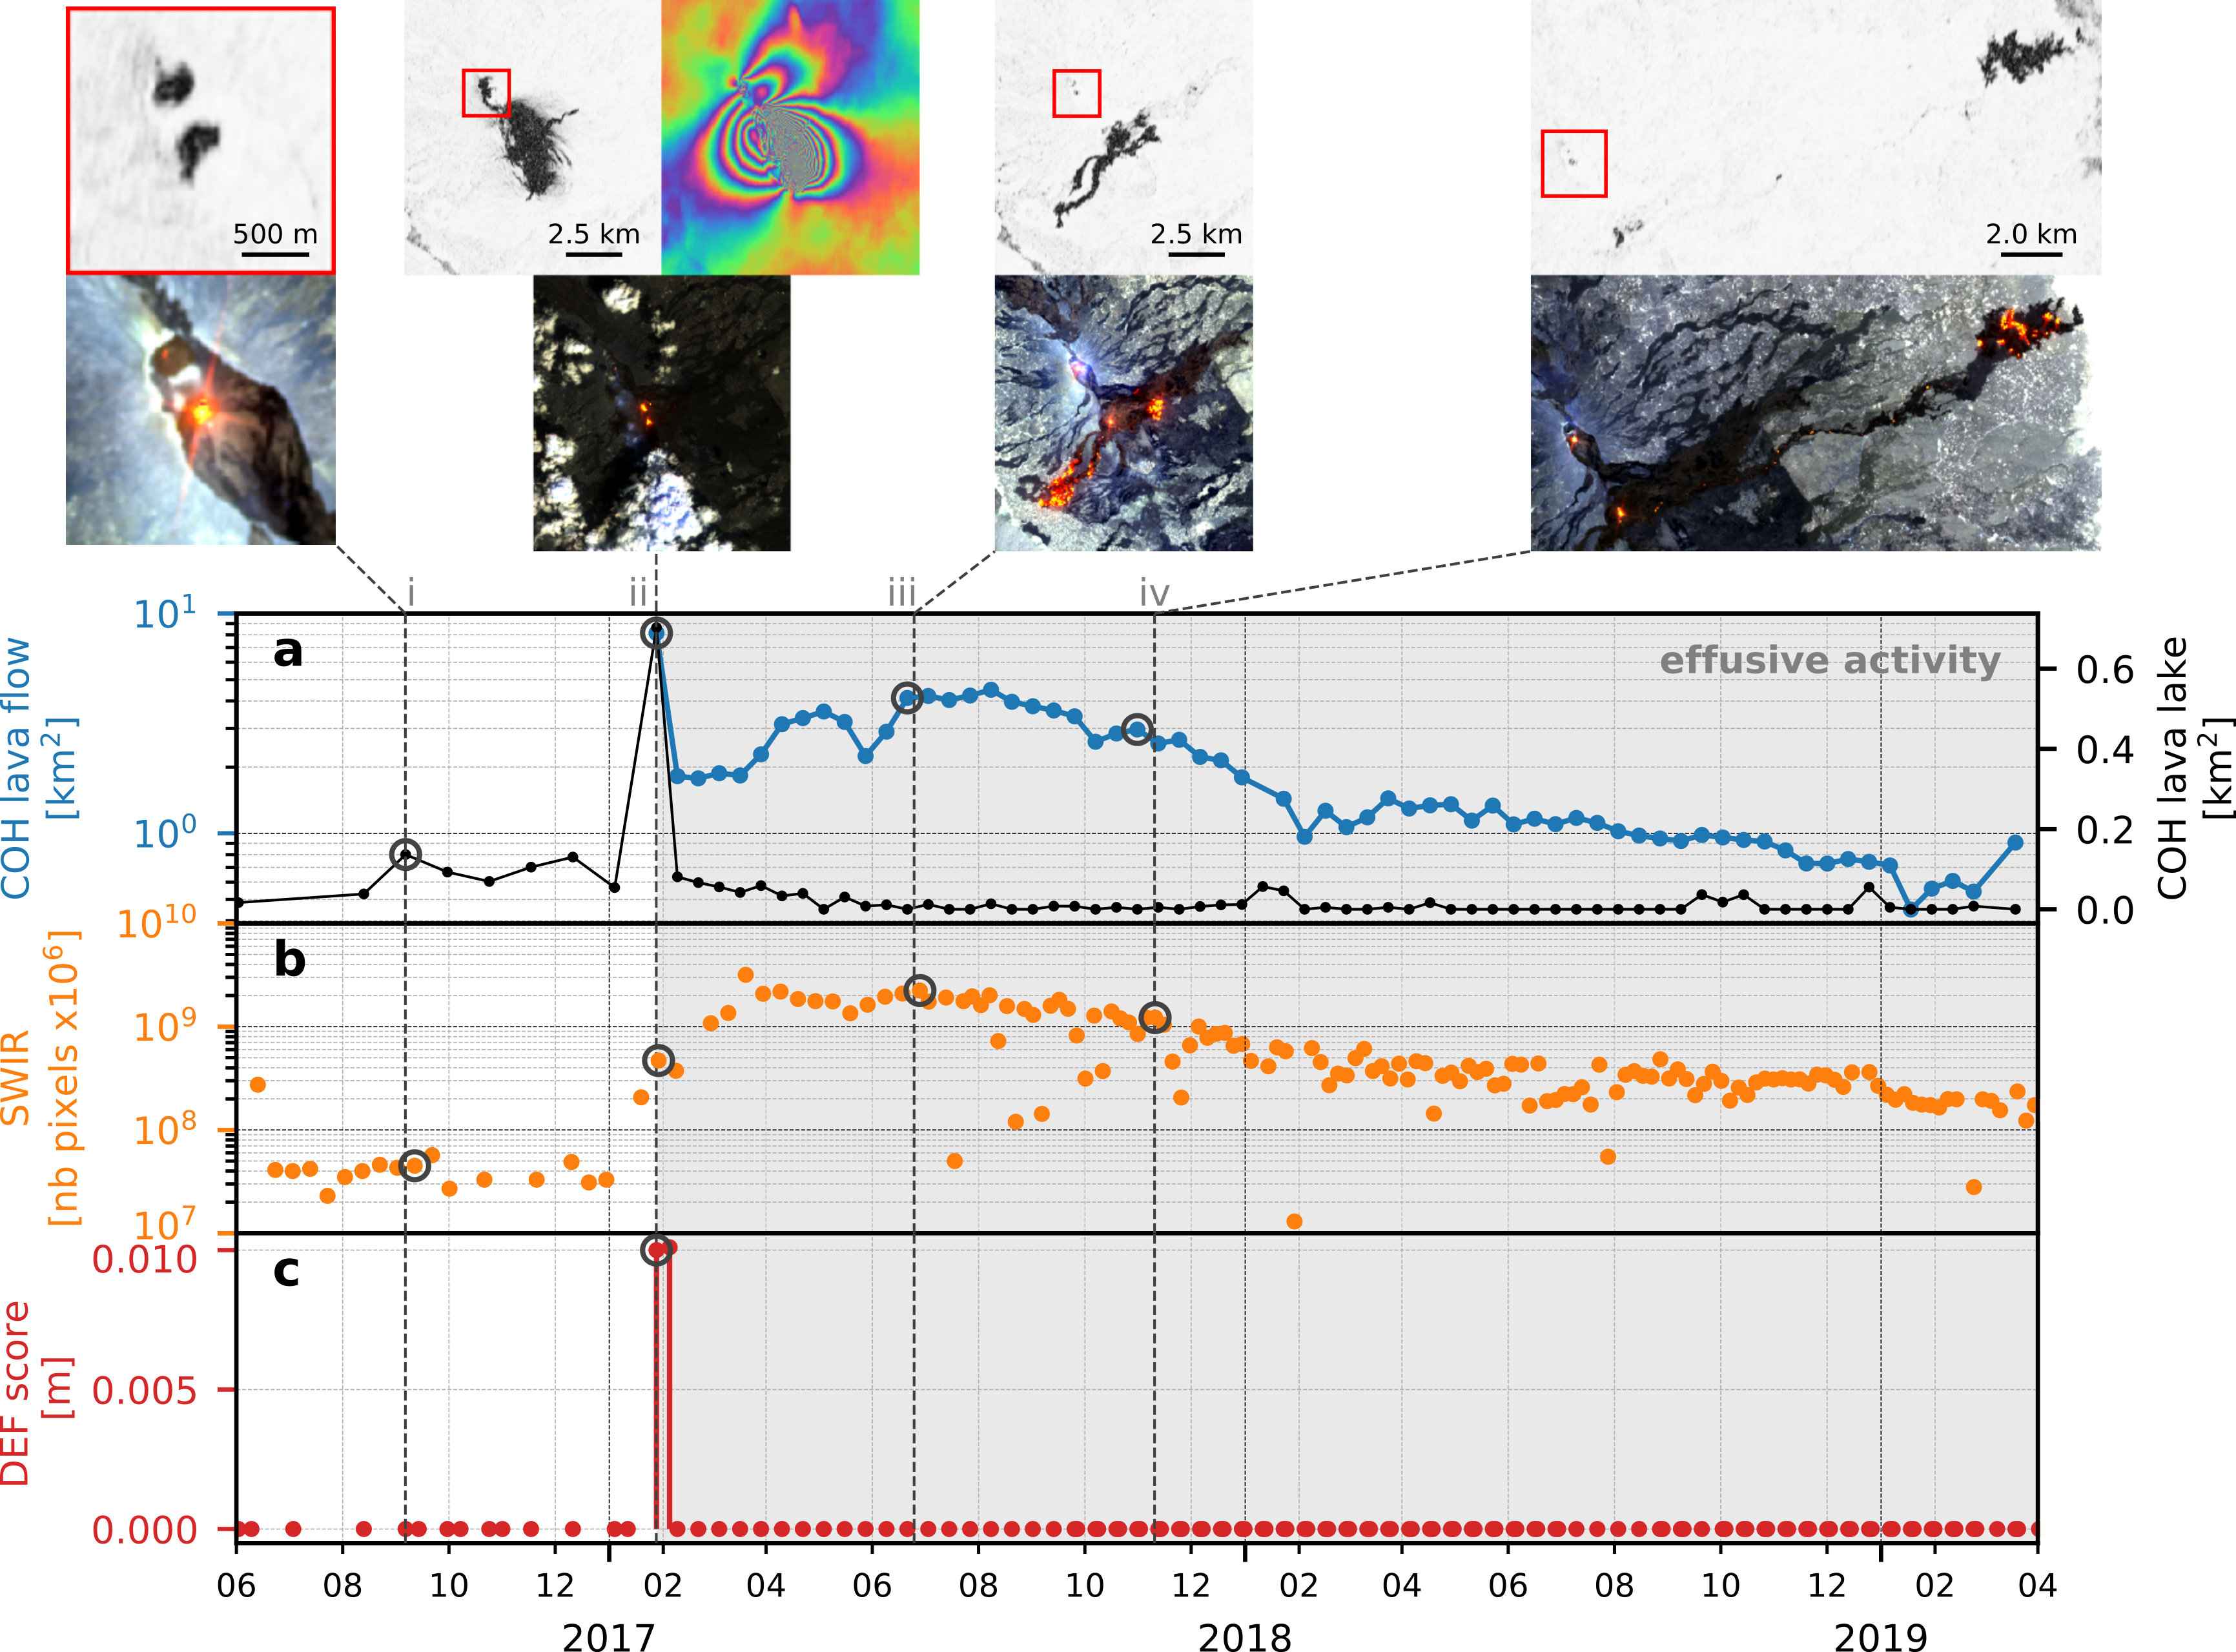
4.2. Detection of Eruptive Deposits (SWIR, DInSAR, SAR)

Volcanic eruptions can generate various types of eruptive deposits, including lava flows, pyroclastic flows, mud flows, pyroclastic deposits, ash fall, etc. The best-suited parameter to detect these from space will depend on both the volcanic product type and the surface on which it is emplaced (i.e., arid surface, vegetated surface). We here describe two extreme eruptive case scenarios: the Erta Ale eruption (Ethiopia, ongoing since January 2017), characterized by an effusive activity where lava flows are emplaced in a desert environment, and the Fuego eruption (Guatemala, June 2018), characterized by a violent explosive activity which generated pyroclastic flows (i.e., avalanche of hot blocks and ash which flowed down the surrounding valleys in a densely vegetated environment).

4.2.1. Using DInSAR Coherence and SWIR

Detecting lava flows in non-vegetated regions is particularly efficient using the interferometric coherence [76]. Active lava flows will appear as highly incoherent areas (coherence values close to zero), contrasting with the coherent surface on which they are emplaced (coherence values typically >0.5). Moreover, because the summits of active volcanoes are usually vegetation-free, the coherence can also be utilized to monitor summital volcanic activity, as eruptive deposits will appear incoherent.
Both applications are illustrated in Figure 6, which depicts the ongoing Erta Ale eruption and its precursory activity. Indeed, in the months preceding the eruption onset, intense summit activity is indicated from the coherence map analyzed in a 2 × 2 km box around the summit (Figure 6a black curve). In particular, from June 2016 onwards the northwestern lake becomes active (in addition to the permanently active southeastern lake), and in the following months the activity at both lakes progressively intensifies, leading to multiple lava overflows (e.g., small overflow on 20 August 2016 visible on coherence image in Figure 6(i), and large overflow on 19 January 2017 visible on Sentinel-2 image). On 28 January 2017, the S1 interferogram shows a strong deformation signal with a distinctive pattern characteristic of a dyke intrusion (Figure 6c and Figure 6(ii)), which marks the onset of a >2-year eruption which is still ongoing today [77]. The eruptive fissure opened multiple new vents located SE of the summit lava lakes (clearly identifiable from S1 coherence and amplitude images), which progressively focused on a single new eruptive vent from which lava flowed during the following months. During this time, the activity at the summit lava lakes significantly decreases (i.e., coherence analysis on 2 × 2 km extent, Figure 6a black curve), suggesting a possible drainage of the summit lava lakes. Both the coherence and the SWIR analyses computed on a large >20 km spatial scale (Figure 6a blue curve and Figure 6b respectively), depict the lava flow emplacement. The good agreement between the two highlights the fact that coherence can be used to track the active flow front, even when S2 images may not be usable due to cloud coverage. From this basic analysis, more elaborate parameters can be extracted offline, such as the lava flow front position through time, or the lava effusion rate, both key for hazard mitigation issues.
The coherence threshold can be adapted to each volcano, in order to account for specific environments (i.e., how incoherent is the surrounding land surface). More elaborate strategies can also be implemented to enhance the decorrelation sensibility to volcano-related processes, such as using NDVI masks (computed from S2 images) to exclude vegetated areas from the analysis. Nevertheless, in certain climatic settings coherence-based detection is simply not the best suited, and intensity-based detection can prove more useful.

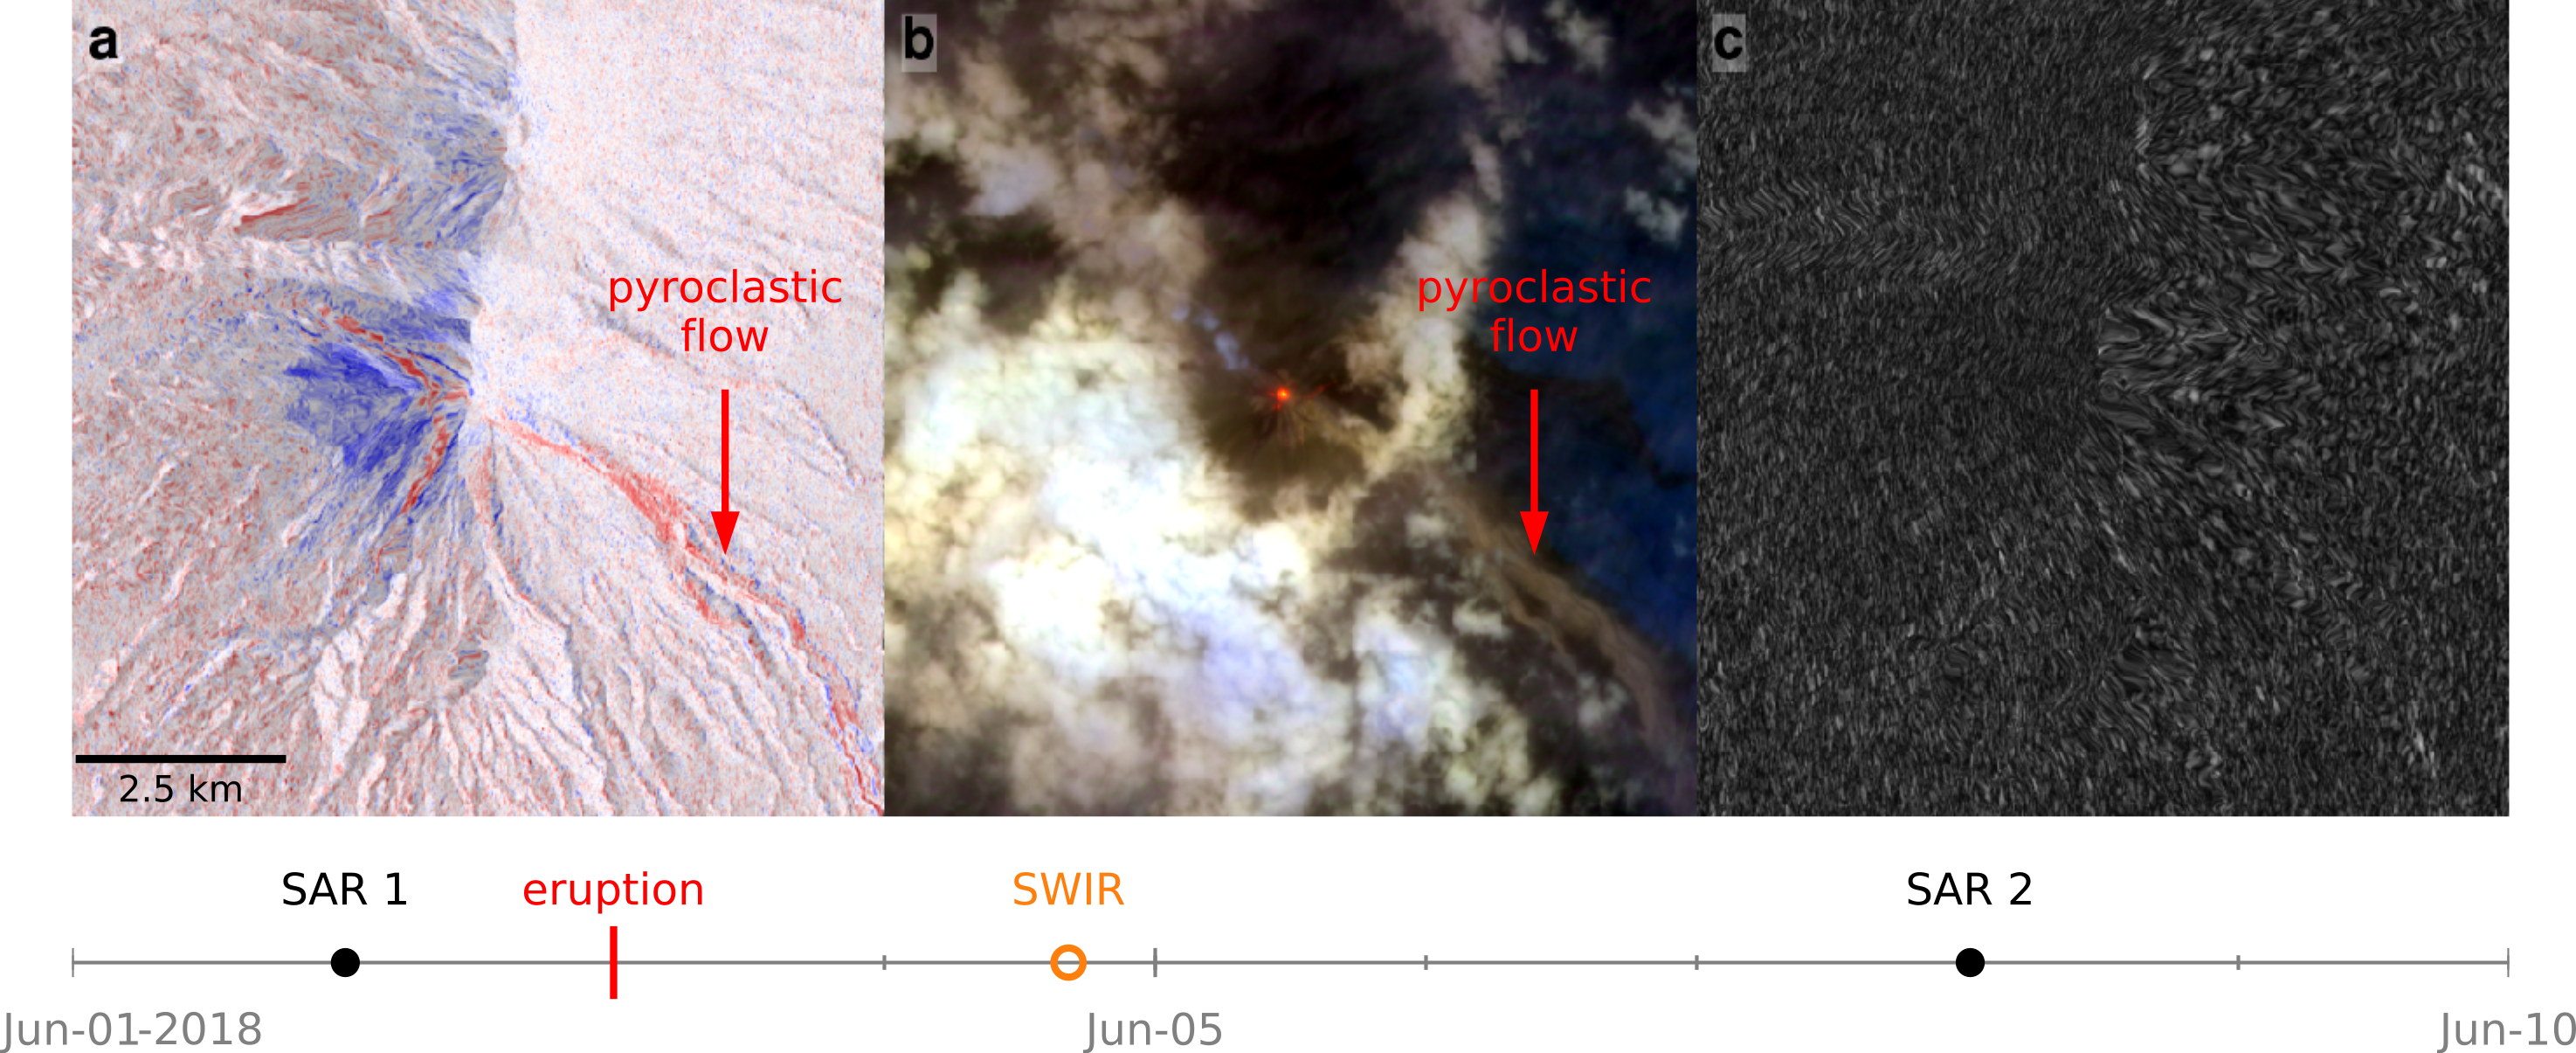
4.2.2. Using SAR Intensity

The interferometric coherence is hardly exploitable in regions with very dense vegetation, or where the surface is likely to change rapidly due to various environmental factors (e.g., snow or sand). In such context, changes in the intensity of SAR images can help identify eruptive deposits. Figure 7 illustrates this, taking as example the 2018 eruption of Fuego (Guatemala) which killed over 200 persons due to pyroclastic flows [5]. The interferometric coherence image (Figure 7c) computed between SAR image 1 and 2, respectively acquired before and after the eruption, is entirely incoherent and therefore unusable. However, computing the log ratio between the two intensity images (Figure 7a) reveals substantial changes: areas in blue are those where the intensity has decreased, whereas areas in red are those where the intensity has increased. The latter are mainly confined in the valleys, and likely correspond to the rougher block-and-ash deposit [24]. Conversely, areas where intensity decreases are concentrated around the summit vent, which could be associated to the deposition of ash.

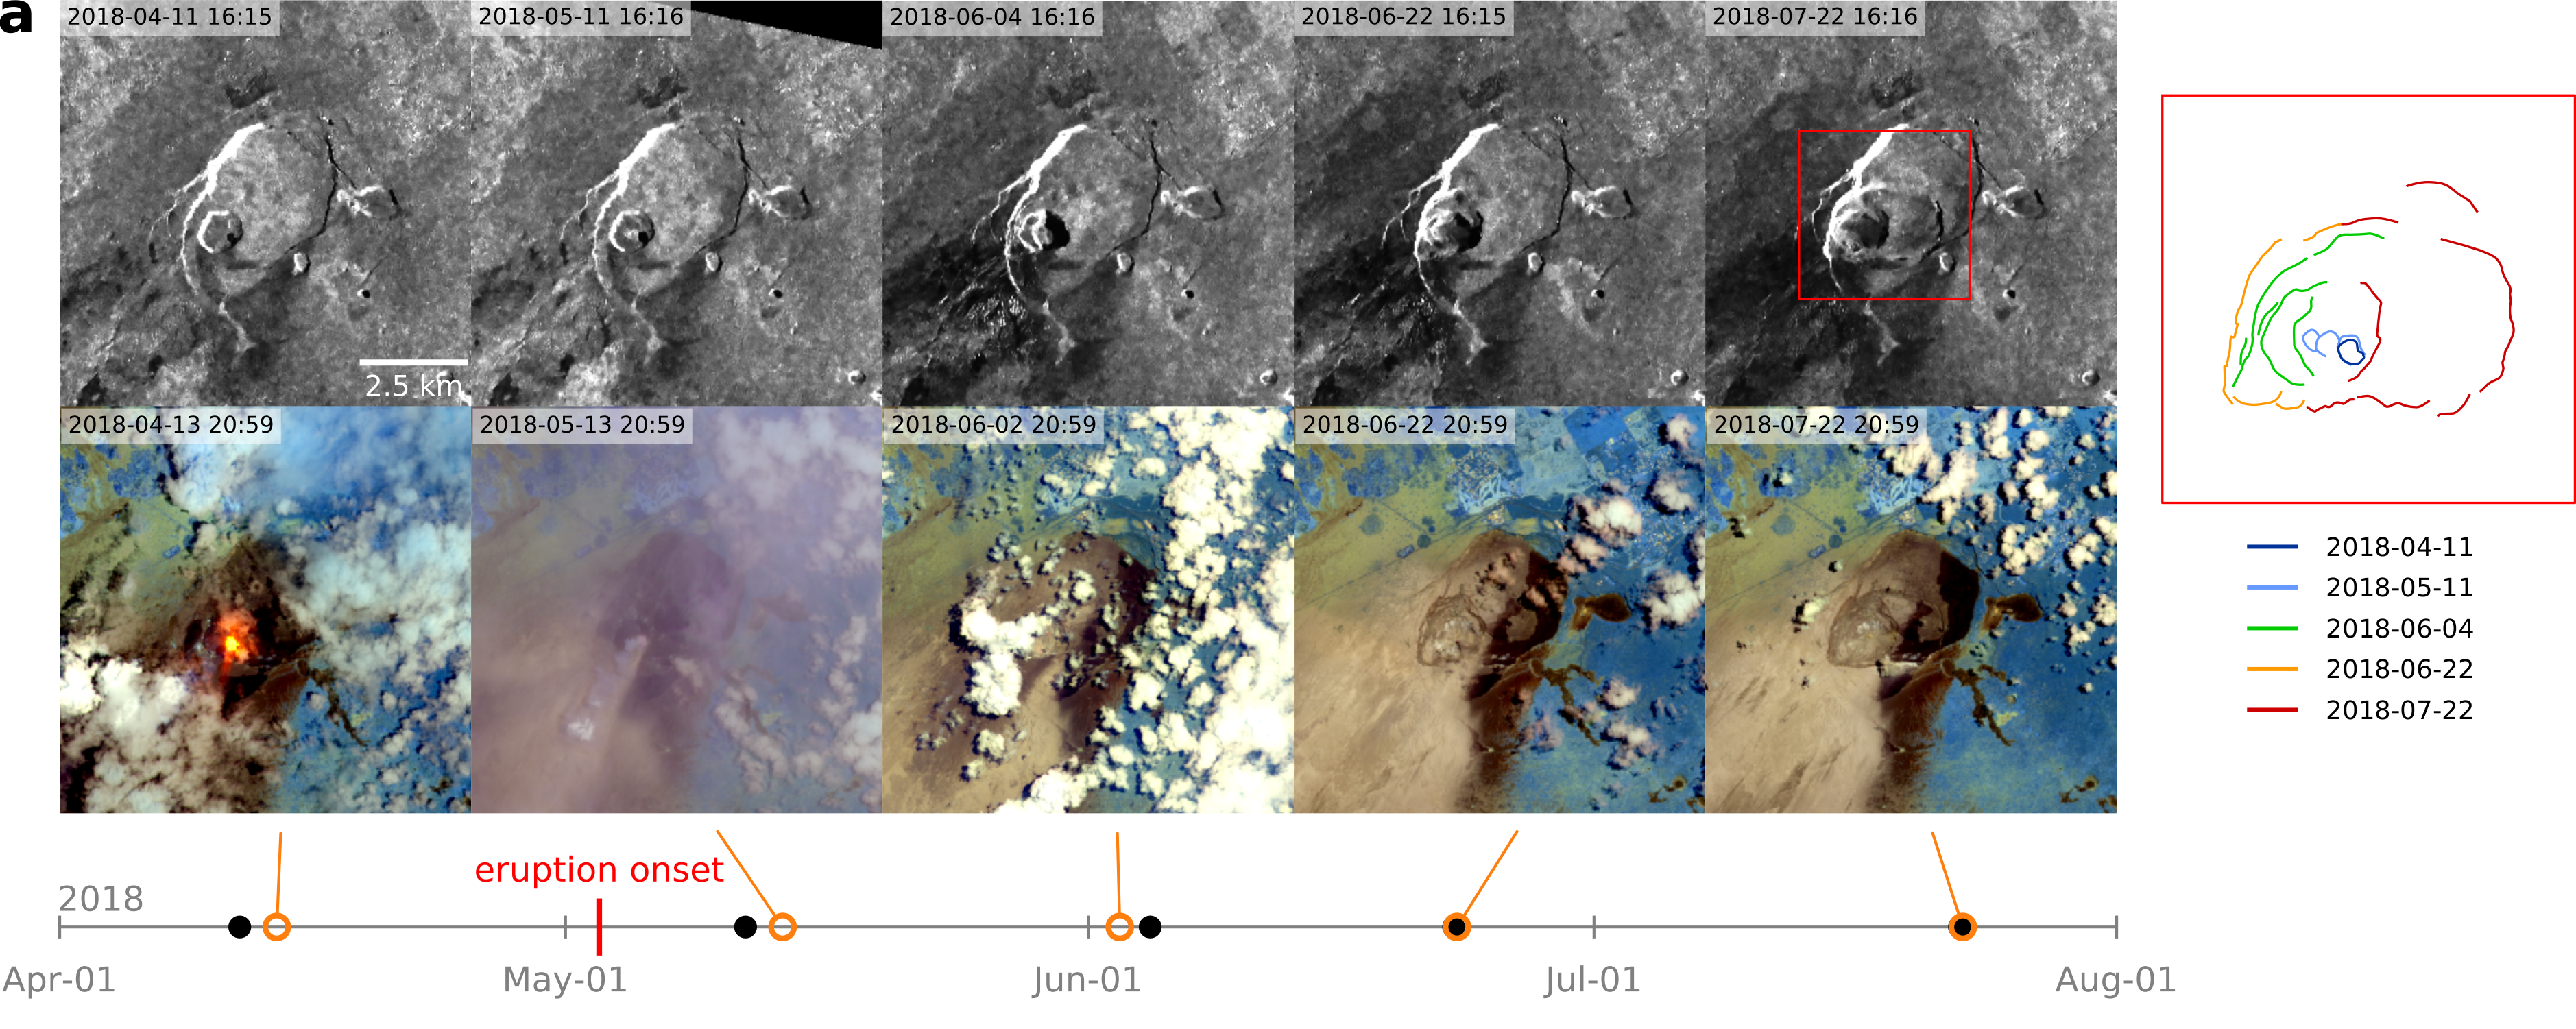
4.3. Detection of Morphological Changes (SAR)

The intensity of SAR images is strongly dependent on the terrain slope, and is therefore useful to monitor morphological changes affecting the volcano. Because radar wavelengths penetrate through clouds, SAR intensity images provide crucial insights into the volcanic activity when optical imagery is obstructed by atmospheric and/or volcanic gas clouds. We here give two examples taken from very different volcanological settings: the summit crater collapse of Kīlauea (Hawai’i) during the 2018 effusive eruption (Figure 8a), and the Anak Krakatau (Indonesia) island growth and destruction during the 2018 explosive eruption (Figure 8b).
Kilauea is well known for its persistent active lava lake. In 2018, it experienced its largest flank eruption and caldera collapse in the last 200 years [79,80]. During spring 2018, the lava lake activity was high, which was clearly detected as a hotspot in the S2 SWIR images (Figure 8a, 13 April 2018). On 30 April 2018, seismicity indicated the intrusion of a dyke along the East Rift Zone, which generated a ~38 km long deformation zone, and multiple eruptive fissures with lava flows rapidly reaching the sea (see Supplementary Material S5 for analysis of S1 and S2 over the entire rift zone). During this time the summit underwent significant changes: lava lake withdrawal (i.e., hotspot disappears in SWIR images, Figure 8a), accompanied by summit subsidence (i.e., deflation detected in interferogram), progressively evolving in a ~3 km wide caldera collapse (see LIDAR digital elevation model in [80]), as the shallow magma reservoir was being drained. The progression of the caldera collapse is clearly imaged with SAR intensity images, which reveal the progressive formation of fractures and the profound summit morphological changes accompanying the flank eruption (Figure 8a and video in Supplementary Material S3). Ash deposits following the eruption onset is also captured, identified by a decrease in the SAR backscattered intensity on the SE flank of the volcano, also visible in the SWIR images. This decrease can be explained by the fact that fresh ash is less reflective than bare rock owing to its loose structure and high porosity, and that ash deposits smooth the surface, resulting in a more specular reflector which backscatters less energy towards when the slope is facing away from the sensor [23].
Krakatau is well-known for its volcano-induced tsunamis. Just over 135 years after the famous 1883 event, the volcano triggered on 22 December 2018 another deadly wave. Analysis of the SAR intensity images clearly shows the progressive island growth in the months preceding the tsunami, due to multiple lava flows reaching the sea and extending the island’s coast line (Figure 8b and Supplementary Material video S4). This likely increased the instability of the volcano’s flank, which on 22 December 2018 collapsed, generating a tsunami wave [81]. Post flank sector collapse images first reveal an amphitheater-shaped scar opened to the sea (Figure 8b, 31 December 2018 image), which was closed shortly after by an explosion tuff ring, resulting in a ~400 m wide water filled crater (Figure 8b, 12 January and 15 February 2019 images).

4.4. Detection of SO2 Gas Flux (UV)

On 18 February 2019 a new eruption of the Piton de la Fournaise began. According to OVPF Reports, 14 ± 5 Mm3 of lava were erupted during the 18 days of activity, fed by several eruptive fissures located on the upper east flank of the volcanic cone. Following a phase of gradual increase in volcanic tremor and the intensification of surface activity, the eruption ended abruptly on March 10 (OVPF Reports).
Figure 9 shows the time series of SO2 mass burden recovered from S5P (Figure 9b), complemented by thermal anomalies recorded from S2 SWIR data (Figure 9c). The SO2 mass obtained from MOUNTS is compared with the SO2 mass computed by NASA as a measure of correlation between the two datasets. In addition, thermal anomalies detected by S2 are overlaid with the VRP data provided by MIROVA (Figure 9c) to show correspondence between the active flow area and the heat radiated by the flow surface. Once suitably calibrated, the combination of SO2 and thermal data provides a synoptic view of the gas and magma fluxes during the course of the February–March 2019 eruption which can be used to track eruptive trends and patterns in real time [82]. Notably for this specific case, the two datasets show consistent trends, indicating a gradual intensification of the effusive and degassing activity during the final phases of the eruption. Thermal anomalies recorded after 10 March and in the absence of gas emission are attributed to the cooling of the lava field. The last SO2 detection (10 March 2019 09:38 UTC) is attributed to the gas plume, no longer fed from the eruptive vent but still inside the 500 × 500 km AOI as it slowly drifts away from the island.

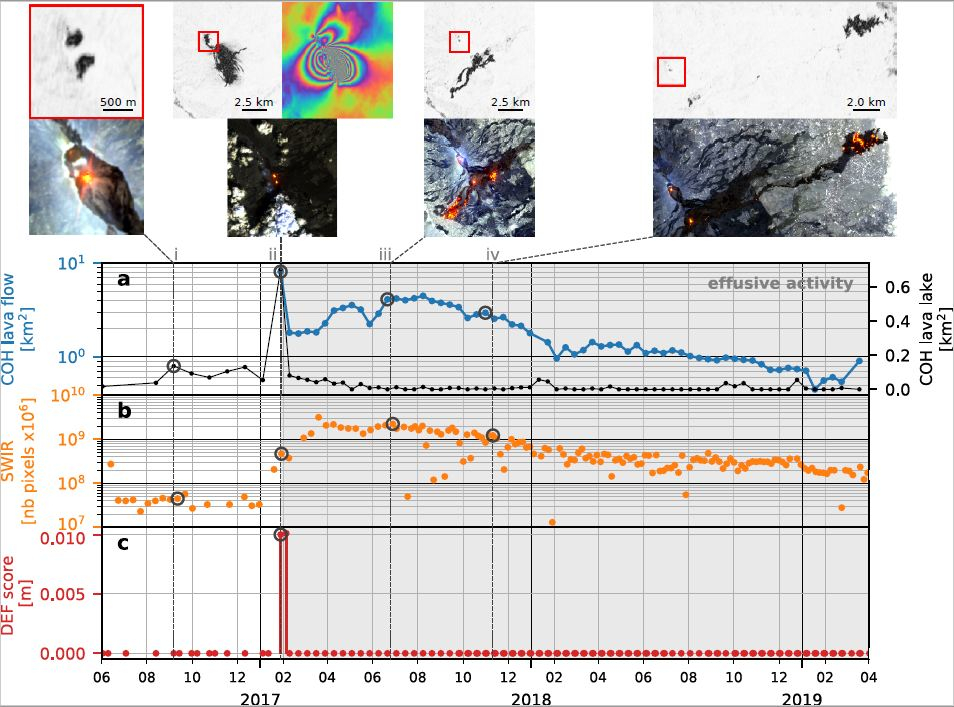
4.5. Combining Ground-Based and Space-Based Sensors

Magma migration within the crust generates stresses, which can result in earthquakes as the surrounding rocks are displaced or fractured. This seismicity, commonly known as volcano-tectonic (VT) seismicity, is often recorded both prior and during volcanic eruptions, within and around the volcanic edifice [83]. High magnitude VT earthquakes can be recorded and located by global seismological networks, even when the nearest seismic stations are installed several hundreds of kilometers away. In turn, their timing, location, magnitude, and sometimes focal mechanism, are stored in open access global earthquake databases, particularly GEOFON and USGS catalogues. MOUNTS facilitates the interrogation of such catalogs, recovering potential earthquakes recorded in a region centered around the monitored volcano. This data can support the analysis of the volcanic phenomena, especially when the volcano is not equipped with ground-based monitoring instrumentation.
Figure 10 shows the recent eruption of Ambrym (Vanuatu), and illustrates how combining ground-based and space-based sensors helps understand the eruptive dynamics of this volcano located in a very remote and cloud-prone region. On 15 December 2018 and in the days that followed, a swarm of volcano-tectonic earthquakes were recorded in the vicinity of the volcano, with magnitudes ranging between ~4.5 and 5.5 (Figure 10d). The volcano was known until then for its persistent activity characterized by two active volcanic lakes (Figure 10(b.1)), responsible for high heat and gas fluxes (Figure 10b,c respectively), [84,85]. Analysis of the SAR intensity images immediately before and after this swarm reveal profound morphological changes (Figure 10(d.1,d.2)), in particular the collapse and enlargement of the summit crater. DInSAR analyses indicate very strong ground deformation during this period (Figure 10a red curve, Figure 10(a.1)), related to dyke intrusion and caldera subsidence [86]. Simultaneously, the decorrelation in the coherence map increases (Figure 10a blue curve), due to both the ground deformation and perhaps also pyroclastic deposits. Once stabilized, the coherence map reveals the presence of a new eruptive vent (Figure 10(a.2)), from which lava was most likely emitted, as suggested by the SWIR image acquired on 15 December 2018 (Figure 10(b.2)). Interestingly, following this event the volcano completely changed dynamics: the summit lava lakes were most likely drained, as suggested by the absence of thermal anomalies and the cessation of SO2 gas emissions.

5. Discussion

The key to detecting volcano unrest and understanding the underlying mechanisms is to be able to recognize when a volcano is deviating from its background level of activity. Once the eruption starts on the other hand, the key to decipher the eruptive dynamics and to mitigate the related hazards, is to integrate multiparametric dataset streaming from both space- and ground-based sensors, in order to provide the most comprehensive view of the eruptive phenomena. Both require “monitoring”, i.e., observing the volcanic activity over long periods of time, during both quiescent and eruptive phases. As such, the aim of monitoring platforms such as MOUNTS is twofold: (1) a scientific one, aiming at deepening our understanding of volcanic processes and patterns at stake at active volcanoes, by processing in a systematic way large amounts of data in an effort to construct global databases, and (2) a societal one, aiming at producing more successful eruption forecasts, and providing additional information to the operational community (e.g., local volcano observatories and civil protection) in order to mitigate the risks related to volcanic hazards.
The results presented in this paper intend to demonstrate how the monitoring platform MOUNTS can contribute to both scientific and operational aims. We here discuss the benefits, limitations, and future developments of the system.

5.1. Benefits of MOUNTS

The benefits of the developed system are the following:
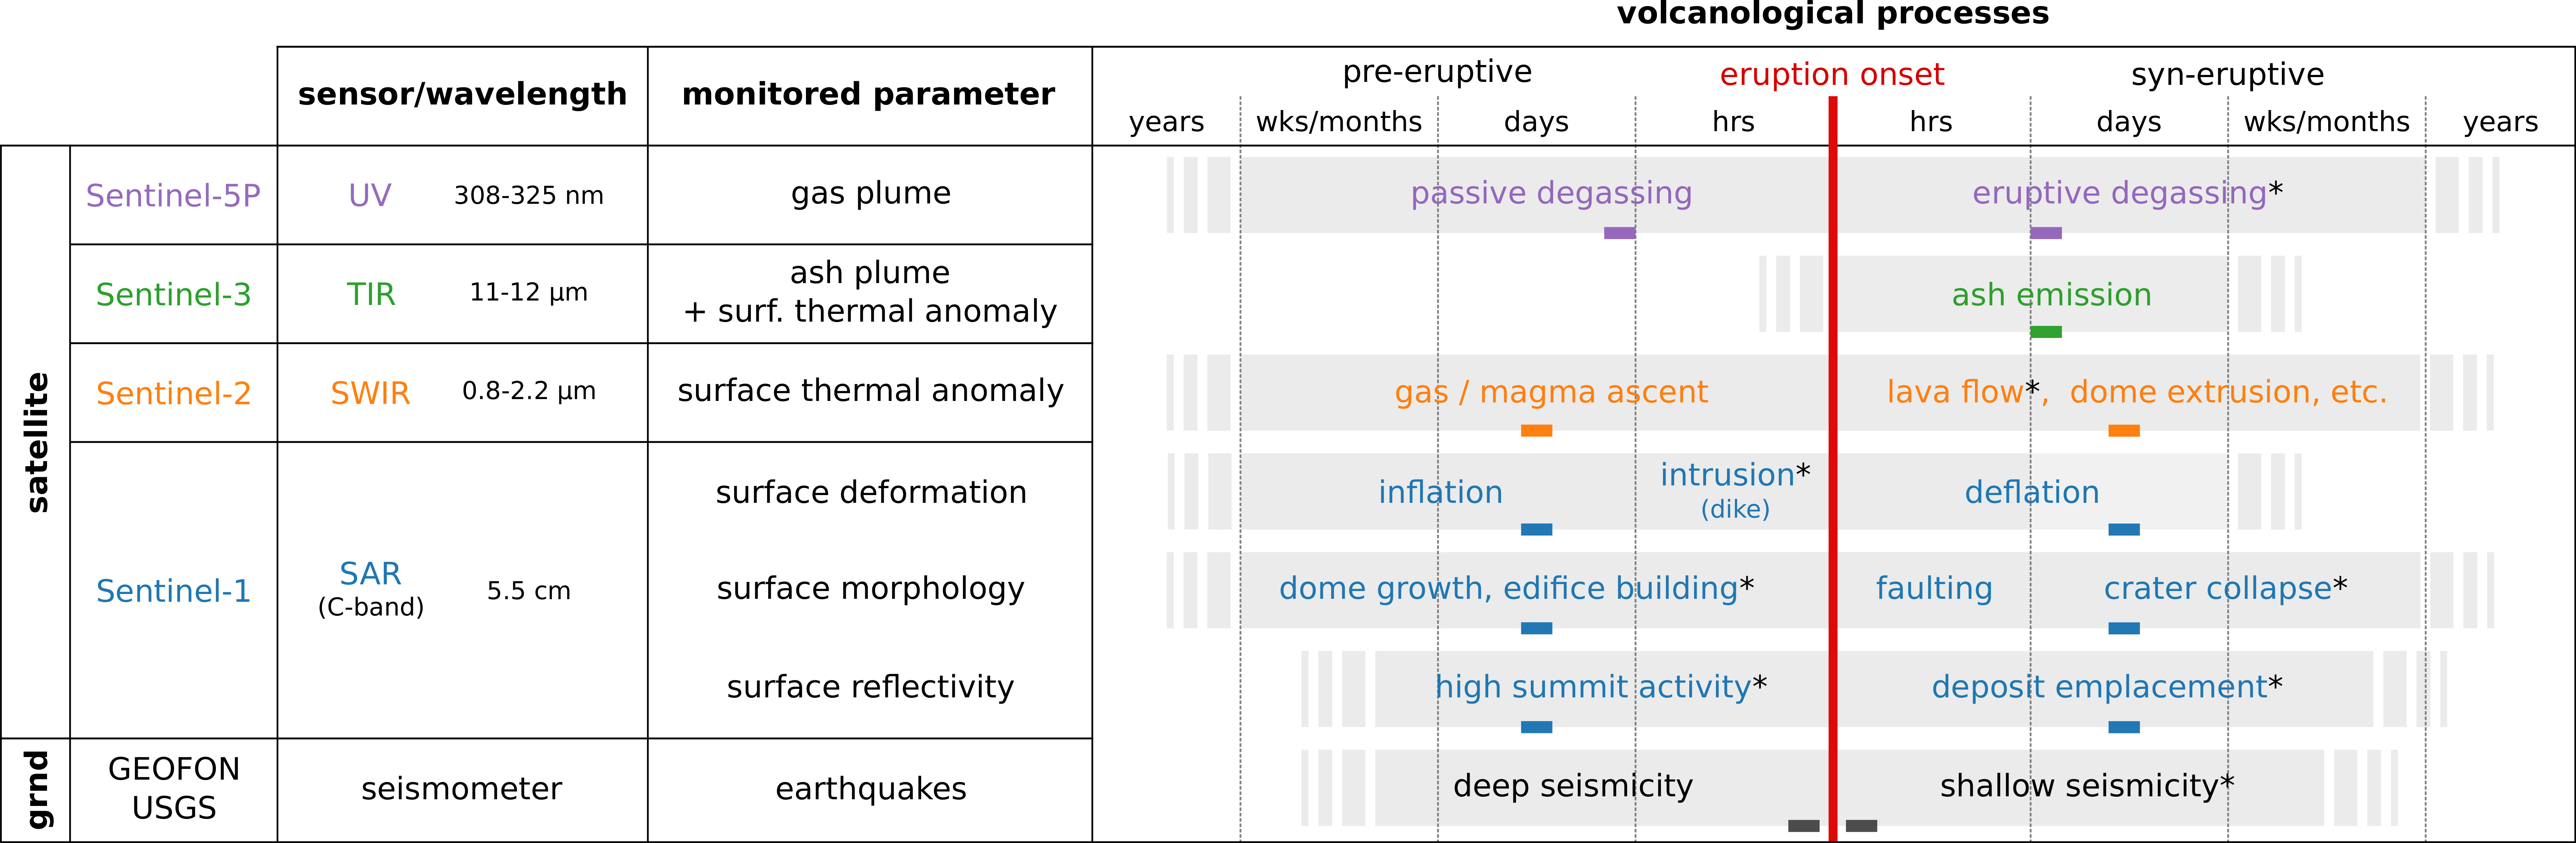
  • Automated processing of free multisensor dataset which provide key parameters for volcano monitoring: surface deformation and reflectivity changes (Sentinel-1), heat anomalies (Sentinel-2), SO2 gas emission (Sentinel-5P), and seismic activity (USGS and GEOFON earthquake catalogues). This interdisciplinary approach allows for assessment of a variety of volcanic phenomena in various volcanological contexts. Moreover, exploiting multiple sensors spanning across the electromagnetic spectrum reduces the dependency to sensing conditions (e.g., night, clouds).
  • Flexible design allowing fast implementation of new targets to monitor, with freedom regarding the size and shape of the region of interest. This allows to rapidly respond to new eruptive crisis, and adapt to the specific scenarios (e.g., monitoring of summit activity on small ~1–2 km spatial extent, and/or monitoring of effusive activity on large >50 km extent). The system currently monitors 17 volcanoes in various volcanological and climatic settings across the globe, many of which recently experienced large eruptive crisis.
  • Visualization through an open-access website (www.mounts-project.com) of both geocoded images (i.e., DInSAR interferograms wrapped/unwrapped, DInSAR coherence map, SAR VV intensity image, SWIR B12-B11-B8A image, and SO2 PBL concentration), and time series of parameters extracted from each image type (i.e., deformation score, number of decorrelated pixels, number of hot pixels, and SO2 mass, respectively). This allows to apprehend the evolution through time of the volcanic activity and eruptive products. Download of full resolution images and time series graphs (PNG format) is readily possible from the website; more specific data download based on user-defined queries is planned, but for the moment possible on-demand only.
  • Based on the free SNAP toolboxes, providing a unique framework to manipulate data from various satellites, with state-of-the-art processing algorithms (e.g., DInSAR). MOUNTS is open-source, with a Github repository (https://github.com/sebastienValade/mounts) storing both the source code and a changelog informing on all the notable changes made to the system and website.
  • Modular architecture, allowing the implementation of new processing algorithms to extract relevant volcanological parameters, or solve specific tasks. As a matter of example, a pre-trained CNN was plugged to detect strong deformation in the interferograms generated by the system.
  • Automated email alert messaging to dedicated users when specific thresholds are overcome. Interaction with other monitoring systems such as MIROVA is achieved by facilitating access to volcano-dedicated webpages (Figure 3). Strengthening the interactivity between the systems is planned, in particular by sharing database access in order to confront datasets more easily.
The operational community such as volcano observatories can use MOUNTS and contribute to its development in a number of ways. The IGEPN (Instituto Geofísico de la Escuela Politécnica Nacional) for example, responsible for volcano monitoring in Ecuador, suggested to add Sangay to the list of monitored volcanoes in order to contribute to the surveillance of this remote edifice. The data available on the platform was used freely, and a collaborative exchange was initiated upon request to provide more specific data processing. The resulting material was further analyzed by IGEPN staff according to their needs, and was used in the activity reports describing the ongoing crisis for public information [87]. (Disclaimers on the data usage and appropriate acknowledgements can be found on the website). Scientific collaborations to investigate specific volcanic processes, or to develop specific methods (based on either the dataset available on the website, or on datasets resulting from more complex analysis) are also welcomed.

5.2. Limitations of MOUNTS and Future Developments

The quantity of data available for volcano monitoring is increasing exponentially, but so is the difficulty to transform it into knowledge. Indeed a number of limitations arise, related to the extraction of meaningful parameters (are we looking at the right variables?), resolution issues (is the sampling in time and space accurate enough?), and data handling issues (how do we deal with the growing mass of data?). MOUNTS is at this stage still a proof-of-concept, which has large potential for improvement. We hereafter discuss the main limitations and development directions.
  • Improve MOUNTS’ capability to recover parameters informing on the state of volcanic activity, eruptive precursors in particular. While IR and UV spectroradiometry is able to provide rather straightforward parameters (i.e., heat and gas flux respectively), recovering parameters from SAR in a robust and automated fashion is more challenging. In this paper, we show how trained neural networks can achieve complex tasks in a timely and reliable manner, and can be easily implemented in operational processing chains. In particular, strong deformation typically imprint on interferograms as many colored fringes, which are successfully detected. Further development however is needed to detect slow deformation mechanisms, which do not generate deformation patterns with numerous fringes. Future developments should also focus on designing and training neural networks to recover from SAR data other relevant parameters that can inform on volcanic activity. For example, efficient change detection able to exclude changes non related to volcanic activity (e.g., snow fall, vegetation growths, etc.) would prove extremely useful during both pre-eruptive and syn-eruptive phases.
  • Incorporate additional data types in the processing chain to provide further insights into the volcanic activity. A priority is to analyze Sentinel-3 (S3) TIR data routinely, crucial to monitor ground thermal anomalies at high sampling rate (sensor characteristics similar to MODIS), but also to detect ash plumes in the atmosphere. Ash detection is commonly achieved using the brightness temperature difference (BTD) procedure [88], applied to two channels centered around 11 and 12 μm. This approach is easily applicable, but also prone to generate false alarms. A number of methods have been developed to overcome this issue [20], including 3-band algorithms [48], the BTD algorithm with water vapor correction (BTD-WVC), the Robust Satellite Technique (RST) specifically configured for volcanic ash, and shallow neural networks [89,90]. Future developments should therefore implement automated S3 processing to monitor volcanic ash propagation in the atmosphere, which poses a major threat for air traffic in particular.
  • Incorporate modeling tools to predict the propagation of volcanic eruptive products, using the recovered multiparametric data as input source terms for the models. Such strategies are not new, and are now, thanks to increasing computing power and data availability, becoming achievable in NRT to forecast the propagation of lava flows [91] or the dispersion of ash plumes into the atmosphere (e.g., [92,93]), as well as to predict the geometry and depth of magma bodies responsible for volcano deformation (e.g., [94,95,96]). Monitoring platforms such as MOUNTS should not necessarily include such modeling routines, but should at least strive to provide parameters than can be fed to such models.
  • Migrate processing tasks on cloud platforms where data is archived. The development of MOUNTS was done by automatizing data download and processing, using free and open-source data and software. In doing so, we were able to keep the costs of this proof-of-concept platform very low (i.e., a single desktop computer manages data download, processing, and hosting of the web server). Nevertheless, this architecture limits the ability to process larger amounts of data, which would require the analysis of the entire available Sentinel dataset over hundreds of volcanoes worldwide. To achieve this, cloud computing strategies are preferable, whereby algorithms would run on a platform where the data is hosted, thereby preventing data download, and at the same time offering higher computing power. Commercial platforms offering such services exist: the Copernicus DIAS platforms (Data and Information Access Services, which include Sobloo, Onda, Creodias, Mundi, and Wekeo), the Amazon Web Services (AWS), or the Google Cloud Platform.
  • Analyze the recovered multiparametric volcanic time-trends. Monitoring efforts such as the one presented here, allow the development of consistent multiparametric databases on a variety of volcanic settings (i.e., various volcano types, tectonic settings and magma compositions). Such databases are crucial to decipher eruptive patterns, and potentially better estimate future activity [25,26,27,29]. As a matter of example, decadal heat and gas emission time-trends help decrypt slow mechanisms of magma/gas accumulation and release at active volcanoes [97]. Clustering of these trends in categorically similar patterns, together with time-series analysis and probabilistic approaches (e.g., [98,99]), should be investigated to help decision making and potentially lead to better eruption forecasting. Moreover, incorporating standardized volcano alert level classifications (whereby color-codes help flag the activity of volcanoes [39,100]), will help better communicate the level of volcanic unrest and eruption likelihood to local populations and governmental authorities [101,102], and potentially lead to better early warning systems.

6. Conclusions

We present an operational volcano monitoring system, based on the automated download and processing of multisensor satellite-based data (Sentinel-1 SAR, Sentinel-2 SWIR, Sentinel-5P TROPOMI). The recovered data aim at providing key parameters able to inform on the state of volcanic activity, namely: surface deformation, surface reflectivity changes, surface heat anomalies, and SO2 gas emissions. The results are disseminated in NRT on a public website (www.mounts-project.com), where both geocoded images and multi-parametric time series help understand the activity. Moreover, we demonstrate how artificial intelligence can be used in such monitoring system to solve complex tasks. In particular, we designed and trained a convolutional neural network to detect large deformation signals in wrapped interferograms with no atmospheric corrections. The training was done on synthetically generated interferograms, and evaluated on >1360 real interferograms produced by MOUNTS. Due to the very good performances of the network, it is now incorporated into the operational processing chain, which delivers automatic email alerts to dedicated users when strong deformation is recorded at the monitored volcanoes.
In addition to the set of parameters recovered from spaceborne sensors, we incorporate information available from global earthquake catalogues (GEOFON and USGS) to inform on the seismicity located in the vicinity of the volcano. The utility of integrating both satellite-based parameters (deformation, heat and gas) and ground-based parameters (seismicity) are demonstrated through a number of recent eruptions: Erta Ale 2017, Piton de la Fournaise 2018–2019, Fuego 2018, Kilauea 2018, Anak Krakatau 2018, and Ambrym 2018. We show how this interdisciplinary approach allows for assessment of a variety of volcanic phenomena, ranging from subsurface magma migration, to surface eruptive deposit emplacement, pre/syn-eruptive morphological changes, and SO2 gas emission into the atmosphere. The data processed by MOUNTS is providing insights into the eruptive dynamics of these volcanoes, and is sharpening our understanding of how the integration of such multiparametric datasets can help better monitor volcanic hazards.

Supplementary Materials

The following are available online at https://www.mdpi.com/2072-4292/11/13/1528/s1, S1: Details on DInSAR, SAR, and SWIR processing chains; S2: Details on neural network architecture, training, and synthetic data generation; S3: Video of the summit crater morphological changes detected from SAR imagery during the 2018 eruptive episodes at Kilauea (Hawai’i); S4: Video of the island growth and destruction before/after the December 2018 eruption of Krakatau (Indonesia); S5: Kilauea (Hawai’i) East Rift Zone flank eruption monitored by MOUNTS on large spatial scale.

Author Contributions

Conceptualization: (S.V., T.R.W., A.L.), inspired by MIROVA (D.C., M.L.); Methodology: system architecture and management (S.V., A.L.), website development (S.V.), Convolutional Neural Network (A.L.), SWIR hot pixel detection (F.M.), SAR speckle filtering and change detection, (O.D.), SO2 emission analysis (S.V., M.L.); Writing: original draft preparation (S.V.), review and editing by (A.L., D.C., D.L., F.M., O.D., M.L., T.R.W., O.H.).

Funding

This publication was financially supported by Geo.X, the Research Network for Geosciences in Berlin and Potsdam (Project Number: SO_087_GeoX).

Acknowledgments

We thank four anonymous reviewers for their comments which helped improve the manuscript. We also wish to acknowledge N. Anantrasirichai for providing details regarding the training dataset used in their study [34], as well as M. Gouhier, F. Amelung and F.J. Meyer for sharing details on the monitoring systems compiled in Table 1. Sentinel data are made freely available online by Copernicus Open Access Hub (https://scihub.copernicus.eu/), and are partially processed with the free SNAP toolboxes (https://step.esa.int/main/toolboxes/snap/). Earthquake catalogs are provided by GEOFON (GFZ Potsdam) and USGS, and interrogated using the Pyrocko Toolbox (https://pyrocko.org/, [103]).

Conflicts of Interest

The authors declare no conflict of interest.

References

  1. Siebert, L.; Simkin, T.; Kimberly, P. Volcanoes of the World, 3rd ed.; University of California Press: Berkley, CA, USA, 2011. [Google Scholar]
  2. Loughlin, S.C.; Vye-Brown, C.; Sparks, R.S.J.; Brown, S.K.; Barclay, J.; Calder, E.; Cottrell, E.; Jolly, G.; Komorowski, J.-C.; Mandeville, C.; et al. An introduction to global volcanic hazard and risk. In Global Volcanic Hazards and Risk; Cambridge University Press: Cambridge, UK, 2015; pp. 1–80. ISBN 9781316276273. [Google Scholar] [Green Version]
  3. Brown, S.K.; Loughlin, S.C.; Sparks, R.S.J.; Vye-Brown, C.; Barclay, J.; Calder, E.; Cottrell, E.; Jolly, G.; Komorowski, J.-C.; Mandeville, C.; et al. Global volcanic hazard and risk. In Global Volcanic Hazards and Risk; Cambridge University Press: Cambridge, UK, 2015; pp. 81–172. ISBN 9781316276273. [Google Scholar]
  4. Auker, M.R.; Sparks, R.S.J.; Siebert, L.; Crosweller, H.S.; Ewert, J. A statistical analysis of the global historical volcanic fatalities record. J. Appl. Volcanol. 2013, 2, 1–24. [Google Scholar] [CrossRef]
  5. Agencia Guatemalteca de Noticias. Available online: https://agn.com.gt/gobierno-de-guatemala-erogo-3609-millones-de-quetzales-para-atender-a-victimas-de-erupcion-del-volcan-de-fuego/ (accessed on 5 June 2019).
  6. ReliefWeb—Indonesia: Earthquakes and Tsunami—Sunda Straits Tsunami—MDRID013 EPoA update n° 15; (n° 2 for Sunda Straits Tsunami Operation). Available online: https://reliefweb.int/report/indonesia/indonesia-earthquakes-and-tsunami-sunda-straits-tsunami-mdrid013-epoa-update-n-15-n (accessed on 5 June 2019).
  7. Major, J.J.; Lara, L.E. Overview of Chaitén Volcano, Chile, and its 2008–2009 eruption. Andean Geol. 2013, 40, 196–215. [Google Scholar] [CrossRef]
  8. Poland, M. Volcano monitoring from space. In Global Volcanic Hazards and Risk; Loughlin, S.C., Sparks, R.S.J., Brown, S.K., Jenkins, S.F., Vye-Brown, C., Eds.; Cambridge University Press: Cambridge, UK, 2015; pp. 311–316. [Google Scholar]
  9. Pallister, J.; McNutt, S.R. Synthesis of Volcano Monitoring. In The Encyclopedia of Volcanoes; Elsevier: Amsterdam, The Netherlands, 2015; pp. 1151–1171. ISBN 9780123859389. [Google Scholar]
  10. Sparks, R.S.J.; Biggs, J.; Neuberg, J.W. Geophysics. Monitoring volcanoes. Science 2012, 335, 1310–1311. [Google Scholar] [CrossRef]
  11. Phillipson, G.; Sobradelo, R.; Gottsmann, J. Global volcanic unrest in the 21st century: An analysis of the first decade. J. Volcanol. Geotherm. Res. 2013, 264, 183–196. [Google Scholar] [CrossRef]
  12. Pinel, V.; Poland, M.P.; Hooper, A. Volcanology: Lessons learned from Synthetic Aperture Radar imagery. J. Volcanol. Geotherm. Res. 2014, 289, 81–113. [Google Scholar] [CrossRef]
  13. Dzurisin, D. A comprehensive approach to monitoring volcano deformation as a window on the eruption cycle. Rev. Geophys. 2003, 41, 1–29. [Google Scholar]
  14. Harris, A. Thermal Remote Sensing of Active Volcanoes; Cambridge University Press: Cambridge, UK, 2013. [Google Scholar]
  15. Carn, S.A.; Fioletov, V.E.; Mclinden, C.A.; Li, C.; Krotkov, N.A. A decade of global volcanic SO2 emissions measured from space. Sci. Rep. 2017, 7, 1–12. [Google Scholar] [CrossRef]
  16. Theys, N.; Hedelt, P.; De Smedt, I.; Lerot, C.; Yu, H.; Vlietinck, J.; Pedergnana, M.; Arellano, S.; Galle, B.; Fernandez, D.; et al. Global monitoring of volcanic SO2 degassing with unprecedented resolution from TROPOMI onboard Sentinel-5 Precursor. Sci. Rep. 2019, 9, 1–10. [Google Scholar] [CrossRef]
  17. Harris, A.J.L.; Dehn, J.; Calvari, S. Lava effusion rate definition and measurement: A review. Bull. Volcanol. 2007, 70, 1–22. [Google Scholar] [CrossRef]
  18. Harris, A.J.L.; De Groeve, T.; Garel, F.; Carn, S.A. Detecting, Modelling and Responding to Effusive Eruptions; Geological Society of London: London, UK, 2016. [Google Scholar]
  19. Mackie, S.; Cashman, K.; Ricketts, H.; Rust, A.; Watson, M. Volcanic Ash: Hazard Observation; Elsevier: Amsterdam, The Netherlands, 2016. [Google Scholar]
  20. Zehner, C. Monitoring Volcanic Ash from Space. In Proceedings of the ESA-EUMETSAT Workshop on the 14 April to 23 May 2010 Eruption at the Eyjafjöll Volcano, South Iceland, Frascati, Italy, 26–27 May 2010; Zehner, C., Ed.; ESA: Frascati, Italy, 2012. [Google Scholar]
  21. Zebker, H.A.; Rosen, P.; Hensley, S.; Mouginis-Mark, P.J. Analysis of active lava flows on Kilauea volcano, Hawaii, using SIR-C radar correlation measurements. Geology 1996, 24, 495–498. [Google Scholar] [CrossRef]
  22. Lu, Z.; Fielding, E.; Patrick, M.R.; Trautwein, C.M. Estimating lava volume by precision combination of multiple baseline spaceborne and airborne interferometric synthetic aperture radar: The 1997 eruption of okmok volcano, alaska. IEEE Trans. Geosci. Remote Sens. 2003, 41, 1428–1436. [Google Scholar]
  23. Arnold, D.W.D.; Biggs, J.; Wadge, G.; Mothes, P. Using satellite radar amplitude imaging for monitoring syn-eruptive changes in surface morphology at an ice-capped stratovolcano. Remote Sens. Environ. 2018, 209, 480–488. [Google Scholar] [CrossRef] [Green Version]
  24. Wadge, G.; Cole, P.; Stinton, A.; Komorowski, J.C.; Stewart, R.; Toombs, A.C.; Legendre, Y. Rapid topographic change measured by high-resolution satellite radar at Soufriere Hills Volcano, Montserrat, 2008–2010. J. Volcanol. Geotherm. Res. 2011, 199, 142–152. [Google Scholar] [CrossRef]
  25. Biggs, J.; Ebmeier, S.K.; Aspinall, W.P.; Lu, Z.; Pritchard, M.E.; Sparks, R.S.J.; Mather, T. A Global link between deformation and volcanic eruption quantified by satellite imagery. Nat. Commun. 2014, 5, 3471. [Google Scholar] [CrossRef]
  26. Ebmeier, S.K.; Andrews, B.J.; Araya, M.C.; Arnold, D.W.D.; Biggs, J.; Cooper, C.; Cottrell, E.; Furtney, M.; Hickey, J.; Jay, J.; et al. Synthesis of global satellite observations of magmatic and volcanic deformation: Implications for volcano monitoring & the lateral extent of magmatic domains. J. Appl. Volcanol. 2018, 7, 1–26. [Google Scholar]
  27. Furtney, M.A.; Pritchard, M.E.; Biggs, J.; Carn, S.A.; Ebmeier, S.K.; Jay, J.A.; McCormick Kilbride, B.T.; Reath, K.A. Synthesizing multi-sensor, multi-satellite, multi-decadal datasets for global volcano monitoring. J. Volcanol. Geotherm. Res. 2018, 365, 38–56. [Google Scholar] [CrossRef]
  28. Pritchard, M.E.; Biggs, J.; Wauthier, C.; Sansosti, E.; Arnold, D.W.D.; Delgado, F.; Ebmeier, S.K.; Henderson, S.T.; Stephens, K.; Cooper, C.; et al. Towards coordinated regional multi-satellite InSAR volcano observations: Results from the Latin America pilot project. J. Appl. Volcanol. 2018, 7, 5. [Google Scholar] [CrossRef]
  29. Reath, K.; Pritchard, M.; Poland, M.; Delgado, F.; Carn, S.; Coppola, D.; Andrews, B.; Ebmeier, S.K.; Rumpf, E.; Henderson, S.; et al. Thermal, Deformation, and Degassing Remote Sensing Time Series (CE 2000–2017) at the 47 most Active Volcanoes in Latin America: Implications for Volcanic Systems. J. Geophys. Res. (Solid Earth) 2019, 124, 195–218. [Google Scholar] [CrossRef]
  30. Borgström, S.; Bianchi, M.; Bronson, W.; Tampellini, M.L.; Ratti, R.; Seifert, F.M.; Komorowski, J.C.; Kaminski, E.; Peltier, A.; Van der Voet, P. Globvolcano: Earth Observation Services for Global Monitoring of Active Volcanoes. In Proceedings of the Fringes 2009 Workshop, Frascati, Italy, 30 November–4 December 2009; ESA: Frascati, Italy, 2010. [Google Scholar]
  31. Tait, S.; Ferrucci, F. A real-time, space borne volcano observatory to support decision making during eruptive crises: European volcano observatory space services. In Proceedings of the 2013 UK Sim 15th International Conference on Computer Modelling and Simulation, Cambridge, UK, 10–12 April 2013; pp. 283–289. [Google Scholar]
  32. Newhall, C.G.; Costa, F.; Ratdomopurbo, A.; Venezky, D.Y.; Widiwijayanti, C.; Win, N.T.Z.; Tan, K.; Fajiculay, E. WOVOdat—An online, growing library of worldwide volcanic unrest. J. Volcanol. Geotherm. Res. 2017, 345, 184–199. [Google Scholar] [CrossRef]
  33. Berger, M.; Moreno, J.; Johannessen, J.A.; Levelt, P.F.; Hanssen, R.F. ESA’s sentinel missions in support of Earth system science. Remote Sens. Environ. 2012, 120, 84–90. [Google Scholar] [CrossRef]
  34. Anantrasirichai, N.; Biggs, J.; Albino, F.; Hill, P.; Bull, D. Application of Machine Learning to Classification of Volcanic Deformation in Routinely Generated InSAR Data. J. Geophys. Res. Solid Earth 2018, 123, 6592–6606. [Google Scholar] [CrossRef]
  35. Anantrasirichai, N.; Biggs, J.; Albino, F.; Bull, D. A deep learning approach to detecting volcano deformation from satellite imagery using synthetic datasets. Remote Sens. Environ. 2019, 230, 111–179. [Google Scholar] [CrossRef]
  36. Ebmeier, S.K. Application of independent component analysis to multitemporal InSAR data with volcanic case studies. J. Geophys. Res. Solid Earth 2016, 121, 8970–8986. [Google Scholar] [CrossRef]
  37. Gaddes, M.E.; Hooper, A.; Bagnardi, M.; Inman, H.; Albino, F. Blind Signal Separation Methods for InSAR: The Potential to Automatically Detect and Monitor Signals of Volcanic Deformation. J. Geophys. Res. Solid Earth 2018, 123, 10,226–10,251. [Google Scholar] [CrossRef] [Green Version]
  38. Witze, A. How AI and satellites could help predict volcanic eruptions. Nature 2019, 567, 156–157. [Google Scholar] [CrossRef] [PubMed]
  39. Fearnley, C.J.; McGuire, W.J.; Davies, G.; Twigg, J. Standardisation of the USGS Volcano Alert Level System (VALS): Analysis and ramifications. Bull. Volcanol. 2012, 74, 2023–2036. [Google Scholar] [CrossRef]
  40. Wright, R.; Flynn, L.; Garbeil, H.; Harris, A.; Pilger, E. Automated volcanic eruption detection using MODIS. Remote Sens. Environ. 2002, 82, 135–155. [Google Scholar] [CrossRef] [Green Version]
  41. Wright, R.; Flynn, L.P.; Garbeil, H.; Harris, A.J.L.; Pilger, E. MODVOLC: Near-real-time thermal monitoring of global volcanism. J. Volcanol. Geotherm. Res. 2004, 135, 29–49. [Google Scholar] [CrossRef]
  42. Wright, R. MODVOLC: 14 years of autonomous observations of effusive volcanism from space. Geol. Soc. Lond. Spec. Publ. 2016, 426, 23–53. [Google Scholar] [CrossRef]
  43. Coppola, D.; Laiolo, M.; Cigolini, C.; Delle Donne, D.; Ripepe, M. Enhanced volcanic hot-spot detection using MODIS IR data: Results from the MIROVA system. Geol. Soc. Lond. Spec. Publ. 2016, 426, 181–205. [Google Scholar] [CrossRef]
  44. Coppola, D.; Laiolo, M.; Delle Donne, D.; Ripepe, M.; Cigolini, C. Hot-spot detection and characterization of strombolian activity from MODIS infrared data. Int. J. Remote Sens. 2014, 35, 3403–3426. [Google Scholar] [CrossRef] [Green Version]
  45. Coppola, D.; Barsotti, S.; Cigolini, C.; Laiolo, M.; Pfeffer, M.; Ripepe, M. Monitoring the time-averaged discharge rates, volumes and emplacement style of large lava flows by using MIROVA system: The case of the 2014-2015 eruption at Holuhraun (Iceland). Ann. Geophys. 2019, 61, 52. [Google Scholar] [CrossRef]
  46. Gouhier, M.; Guéhenneux, Y.; Labazuy, P.; Cacault, P.; Decriem, J.; Rivet, S. HOTVOLC: A web-based monitoring system for volcanic hot spots. Geol. Soc. Lond. Spec. Publ. 2016, 426, 223–241. [Google Scholar] [CrossRef]
  47. Gauthier, P.-J.; Sigmarsson, O.; Gouhier, M.; Haddadi, B.; Moune, S. Elevated gas flux and trace metal degassing from the 2014–2015 fissure eruption at the Bárðarbunga volcanic system, Iceland. J. Geophys. Res. Solid Earth 2016, 121, 1610–1630. [Google Scholar] [CrossRef]
  48. Guéhenneux, Y.; Gouhier, M.; Labazuy, P. Improved space borne detection of volcanic ash for real-time monitoring using 3-Band method. J. Volcanol. Geotherm. Res. 2015, 293, 25–45. [Google Scholar] [CrossRef]
  49. Carn, S.A.; Clarisse, L.; Prata, A.J. Multi-decadal satellite measurements of global volcanic degassing. J. Volcanol. Geotherm. Res. 2016, 311, 99–134. [Google Scholar] [CrossRef]
  50. Meyer, F.J.; McAlpin, D.B.; Gong, W.; Ajadi, O.; Arko, S.; Webley, P.W.; Dehn, J. Integrating SAR and derived products into operational volcano monitoring and decision support systems. ISPRS J. Photogramm. Remote Sens. 2015, 100, 106–117. [Google Scholar] [CrossRef]
  51. Ajadi, O.A.; Meyer, F.J.; Webley, P.W. Change detection in synthetic aperture radar images using a multiscale-driven approach. Remote Sens. 2016, 8, 482. [Google Scholar] [CrossRef]
  52. Chaussard, E.; Amelung, F.; Aoki, Y. Characterization of open and closed volcanic systems in Indonesia and Mexico using InSAR time series. J. Geophys. Res. Solid Earth 2013, 118, 3957–3969. [Google Scholar] [CrossRef]
  53. Li, C.; Krotkov, N.A.; Carn, S.; Zhang, Y.; Spurr, R.J.D.; Joiner, J. New-generation NASA Aura Ozone Monitoring Instrument (OMI) volcanic SO2 dataset: Algorithm description, initial results, and continuation with the Suomi-NPP Ozone Mapping and Profiler Suite (OMPS). Atmos. Meas. Tech. 2017, 10, 445–458. [Google Scholar] [CrossRef]
  54. González, P.J.; Walters, R.J.; Hatton, E.L.; Spaans, K.; Hooper, A.J.; Wright, T.J. LiCSAR: Tools for automated generation of Sentinel-1 frame interferograms. In Proceedings of the AGU Fall Meeting, San Francisco, CA, USA, 12–16 December 2016. [Google Scholar]
  55. Massimetti, F.; Coppola, D.; Laiolo, M.; Cigolini, C.; Ripepe, M. First comparative results from SENTINEL-2 and MODIS-MIROVA volcanic thermal dataseries. In Proceedings of the CoV10 IAVCEI General Assembly, Naples, Italy, 2–7 September 2018. [Google Scholar]
  56. Theys, N.; De Smedt, I.; Yu, H.; Danckaert, T.; Van Gent, J.; Hörmann, C.; Wagner, T.; Hedelt, P.; Bauer, H.; Romahn, F.; et al. Sulfur dioxide retrievals from TROPOMI onboard Sentinel-5 Precursor: Algorithm theoretical basis. Atmos. Meas. Tech. 2017, 10, 119–153. [Google Scholar] [CrossRef]
  57. Torres, R.; Snoeij, P.; Geudtner, D.; Bibby, D.; Davidson, M.; Attema, E.; Potin, P.; Rommen, B.Ö.; Floury, N.; Brown, M.; et al. GMES Sentinel-1 mission. Remote Sens. Environ. 2012, 120, 9–24. [Google Scholar] [CrossRef]
  58. Chaussard, E. A low-cost method applicable worldwide for remotely mapping lava dome growth. J. Volcanol. Geotherm. Res. 2017, 341, 33–41. [Google Scholar] [CrossRef]
  59. Wadge, G.; Scheuchl, B.; Stevens, N.F. Spaceborne radar measurements of the eruption of Soufrière Hills Volcano, Montserrat. Geol. Soc. Lond. Mem. 2002, 21, 583–594. [Google Scholar] [CrossRef]
  60. Bernhard, E.-M.; Stein, E.; Twele, A.; Gähler, M. Synergistic Use of Optical and Radar Data for Rapid Mapping of Forest Fires in the European Mediterranean. ISPRS—Int. Arch. Photogramm. Remote Sens. Spat. Inf. Sci. 2012, XXXVIII-4, 27–32. [Google Scholar] [CrossRef]
  61. Barrière, J.; d’Oreye, N.; Oth, A.; Geirsson, H.; Mashagiro, N.; Johnson, J.B.; Smets, B.; Samsonov, S.; Kervyn, F. Single-Station Seismo-Acoustic Monitoring of Nyiragongo’s Lava Lake Activity (D.R. Congo). Front. Earth Sci. 2018, 6, 1–17. [Google Scholar] [CrossRef]
  62. Wang, T.; Poland, M.P.; Lu, Z. Dome growth at Mount Cleveland, Aleutian Arc, quantified by time series TerraSAR-X imagery. Geophys. Res. Lett. 2015, 42, 10614–10621. [Google Scholar] [CrossRef]
  63. Rosen, P.A.; Hensley, S.; Joughin, I.R.; Li, F.K.; Madsen, S.N.; Rodriguez, E.; Goldstein, R.M. Synthetic aperture radar interferometry Synthetic aperture radar interferometry. Inverse Probl. 1998, 14, 55. [Google Scholar]
  64. Gabriel, A.K.; Goldstein, R.M.; Zebker, H.A. Mapping small elevation changes over large areas: Differential radar interferometry. J. Geophys. Res. 1989, 94, 9183. [Google Scholar] [CrossRef]
  65. Simons, M.; Rosen, P.A. Interferometric Synthetic Aperture Radar Geodesy. In Treatise Geophys, 2nd ed.; Elsevier: Oxford, UK, 2015; Volume 3, pp. 339–385. [Google Scholar]
  66. Lu, Z. InSAR Imaging of Volcanic Deformation over Cloud-prone Areas—Aleutian Islands. Photogramm. Eng. Remote Sens. 2013, 73, 245–257. [Google Scholar] [CrossRef]
  67. Hooper, A.; Bekaert, D.; Spaans, K.; Arikan, M. Recent advances in SAR interferometry time series analysis for measuring crustal deformation. Tectonophysics 2012, 514–517, 1–13. [Google Scholar] [CrossRef]
  68. Pepe, A.; Calò, F. A Review of Interferometric Synthetic Aperture RADAR (InSAR) Multi-Track Approaches for the Retrieval of Earth’s Surface Displacements. Appl. Sci. 2017, 7, 1264. [Google Scholar] [CrossRef]
  69. Marchese, F.; Neri, M.; Falconieri, A.; Lacava, T.; Mazzeo, G.; Pergola, N.; Tramutoli, V. The Contribution of Multi-Sensor Infrared Satellite Observations to Monitor Mt. Etna (Italy) Activity during May to August 2016. Remote Sens. 2018, 10, 1948. [Google Scholar] [CrossRef]
  70. Laiolo, M.; Ripepe, M.; Cigolini, C.; Coppola, D.; Della Schiava, M.; Genco, R.; Innocenti, L.; Lacanna, G.; Marchetti, E.; Massimetti, F.; et al. Space-and Ground-Based Geophysical Data Tracking of Magma Migration in Shallow Feeding System of Mount Etna Volcano. Remote Sens. 2019, 11, 1182. [Google Scholar] [CrossRef]
  71. Murphy, S.W.; de Souza Filho, C.R.; Wright, R.; Sabatino, G.; Correa Pabon, R. HOTMAP: Global hot target detection at moderate spatial resolution. Remote Sens. Environ. 2016, 177, 78–88. [Google Scholar] [CrossRef]
  72. Krueger, A.J.; Walter, L.S.; Bhartia, P.K.; Schnetzler, C.C.; Krotkov, N.A.; Sprod, I.; Bluth, G.J.S. Volcanic sulfur dioxide measurements from the total ozone mapping spectrometer instruments. J. Geophys. Res. 1995, 100, 14057. [Google Scholar] [CrossRef]
  73. He, K.; Zhang, X.; Ren, S.; Sun, J. Deep residual learning for image recognition. In Proceedings of the IEEE Conference on Computer Vision and Pattern Recognition, Las Vegas, NV, USA, 26 June–1 July 2016; pp. 770–778. [Google Scholar]
  74. Krizhevsky, A.; Sutskever, I.; Hinton, G.E. ImageNet classification with deep convolutional neural networks. In Proceedings of the 26th Annual Conference on Neural Information Processing Systems 2012, Lake Tahoe, NV, USA, 3–6 December 2012; pp. 1106–1114. [Google Scholar]
  75. Biggs, J.; Pritchard, M.E. Global volcano monitoring: What does it mean when volcanoes deform? Elements 2017, 13, 17–22. [Google Scholar] [CrossRef]
  76. Dietterich, H.R.; Poland, M.P.; Schmidt, D.A.; Cashman, K.V.; Sherrod, D.R.; Espinosa, A.T. Tracking lava flow emplacement on the east rift zone of Kīlauea, Hawai‘i, with synthetic aperture radar coherence. Geochem. Geophys. Geosyst. 2012, 13, 1–17. [Google Scholar] [CrossRef]
  77. Xu, W.; Rivalta, E.; Li, X. Magmatic architecture within a rift segment: Articulate axial magma storage at Erta Ale volcano, Ethiopia. Earth Planet. Sci. Lett. 2017, 476, 79–86. [Google Scholar] [CrossRef]
  78. D’Hondt, O.; López-Martínez, C.; Guillaso, S.; Hellwich, O. Nonlocal filtering applied to 3-D reconstruction of tomographic SAR data. IEEE Trans. Geosci. Remote Sens. 2018, 56, 272–285. [Google Scholar] [CrossRef]
  79. Patrick, M.R.; Anderson, K.R.; Poland, M.P.; Orr, T.R.; Swanson, D.A. Lava lake level as a gauge of magma reservoir pressure and eruptive hazard. Geology 2015, 43, 831–834. [Google Scholar] [CrossRef]
  80. Neal, C.A.; Brantley, S.R.; Antolik, L.; Babb, J.L.; Burgess, M.; Calles, K.; Cappos, M.; Chang, J.C.; Conway, S.; Desmither, L.; et al. The 2018 rift eruption and summit collapse of Kīlauea Volcano. Science 2019, 363, 367–374. [Google Scholar] [CrossRef]
  81. Williams, R.; Rowley, P.; Garthwaite, M.C. Small flank failure of Anak Krakatau Volcano caused catastrophic December 2018 Indonesian tsunami. EarthArXiv 2019. [Google Scholar] [CrossRef]
  82. Coppola, D.; Di Muro, A.; Peltier, A.; Villeneuve, N.; Ferrazzini, V.; Favalli, M.; Bachèlery, P.; Gurioli, L.; Harris, A.J.L.; Moune, S.; et al. Shallow system rejuvenation and magma discharge trends at Piton de la Fournaise volcano (La Réunion Island). Earth Planet. Sci. Lett. 2017, 463, 13–24. [Google Scholar] [CrossRef]
  83. Zobin, V.M. Origin of Volcano-Tectonic Earthquakes. In Introduction to Volcanic Seismology, Volume 6, 3rd ed.; Elsevier: Amsterdam, The Netherlands, 2017; pp. 31–45. [Google Scholar]
  84. Coppola, D.; Laiolo, M.; Cigolini, C. Fifteen years of thermal activity at Vanuatu’s volcanoes (2000–2015) revealed by MIROVA. J. Volcanol. Geotherm. Res. 2016, 322, 6–19. [Google Scholar] [CrossRef]
  85. Allard, P.; Aiuppa, A.; Bani, P.; Métrich, N.; Bertagnini, A.; Gauthier, P.J.; Shinohara, H.; Sawyer, G.; Parello, F.; Bagnato, E.; et al. Prodigious emission rates and magma degassing budget of major, trace and radioactive volatile species from Ambrym basaltic volcano, Vanuatu island Arc. J. Volcanol. Geotherm. Res. 2016, 322, 119–143. [Google Scholar] [CrossRef]
  86. Hamling, I.J.; Cevuard, S.; Garaebiti, E. Large-Scale Drainage of a Complex Magmatic System: Observations From the 2018 Eruption of Ambrym Volcano, Vanuatu. Geophys. Res. Lett. 2019, 4609–4617. [Google Scholar] [CrossRef]
  87. IGEPN: Informe Especial del Volcán Sangay N° 3. 2019. Available online: https://www.igepn.edu.ec/servicios/noticias/1733-informe-especial-del-volcan-sangay-n-3-2019 (accessed on 6 June 2019).
  88. Prata, A.J. Infrared radiative transfer calculations for volcanic ash clouds. Geophys. Res. Lett. 1989, 16, 1293–1296. [Google Scholar] [CrossRef]
  89. Piscini, A.; Corradini, S.; Marchese, F.; Merucci, L.; Pergola, N.; Tramutoli, V. Volcanic ash cloud detection from space: A comparison between the RST ASH technique and the water vapour corrected BTD procedure. Geomat. Nat. Hazards Risk 2011, 2, 263–277. [Google Scholar] [CrossRef]
  90. Piscini, A.; Picchiani, M.; Chini, M.; Corradini, S.; Merucci, L.; Del Frate, F.; Stramondo, S. A neural network approach for the simultaneous retrieval of volcanic ash parameters and SO2 using MODIS data. Atmos. Meas. Tech. 2014, 7, 4023–4047. [Google Scholar] [CrossRef] [Green Version]
  91. Harris, A.; Chevrel, M.; Coppola, D.; Ramsey, M.; Hrysiewicz, A.; Thivet, S.; Villeneuve, N.; Favalli, M.; Peltier, A.; Kowalski, P.; et al. Validation of an integrated satellite-data-driven response to an effusive crisis: The April–May 2018 eruption of Piton de la Fournaise. Ann. Geophys. 2019, 61. [Google Scholar] [CrossRef]
  92. Fu, G.; Prata, F.; Lin, H.X.; Heemink, A.; Segers, A.; Lu, S. Data assimilation for volcanic ash plumes using a satellite observational operator: A case study on the 2010 Eyjafjallajökull volcanic eruption. Atmos. Chem. Phys. 2017, 17, 1187–1205. [Google Scholar] [CrossRef]
  93. Scollo, S.; Prestifilippo, M.; Spata, G.; D’Agostino, M.; Coltelli, M. Monitoring and forecasting Etna volcanic plumes. Nat. Hazards Earth Syst. Sci. 2009, 9, 1573–1585. [Google Scholar] [CrossRef] [Green Version]
  94. Bagnardi, M.; Hooper, A. Inversion of Surface Deformation Data for Rapid Estimates of Source Parameters and Uncertainties: A Bayesian Approach. Geochem. Geophys. Geosyst. 2018, 19, 2194–2211. [Google Scholar] [CrossRef]
  95. Nikkhoo, M.; Walter, T.R. Triangular dislocation: An analytical, artefact-free solution. Geophys. J. Int. 2015, 201, 1119–1141. [Google Scholar] [CrossRef]
  96. Nikkhoo, M.; Walter, T.R.; Lundgren, P.R.; Prats-Iraola, P. Compound dislocation models (CDMs) for volcano deformation analyses. Geophys. J. Int. 2017, 208, 877–894. [Google Scholar] [CrossRef]
  97. Laiolo, M.; Massimetti, F.; Cigolini, C.; Ripepe, M.; Coppola, D. Long-term eruptive trends from space-based thermal and SO2 emissions: A comparative analysis of Stromboli, Batu Tara and Tinakula volcanoes. Bull. Volcanol. 2018, 80, 68. [Google Scholar] [CrossRef]
  98. Young, P.C. New approaches to volcanic time-series analysis. In Statistics in Volcanology; IAVCEI Special Publications; Geological Society of London: London, UK, 2006; pp. 143–160. [Google Scholar]
  99. Ho, C.H. Volcanic time-trend analysis. J. Volcanol. Geotherm. Res. 1996, 74, 171–177. [Google Scholar] [CrossRef]
  100. Guffanti, M.; Miller, T.P. A volcanic activity alert-level system for aviation: Review of its development and application in Alaska. Nat. Hazards 2013, 69, 1519–1533. [Google Scholar] [CrossRef]
  101. Winson, A.E.G.; Costa, F.; Newhall, C.G.; Woo, G. An analysis of the issuance of volcanic alert levels during volcanic crises. J. Appl. Volcanol. 2014, 3, 1–12. [Google Scholar] [CrossRef]
  102. Papale, P. Rational volcanic hazard forecasts and the use of volcanic alert levels. J. Appl. Volcanol. 2017, 6, 13. [Google Scholar] [CrossRef] [Green Version]
  103. Heimann, S.; Kriegerowski, M.; Isken, M.; Cesca, S.; Daout, S.; Grigoli, F.; Juretzek, C.; Megies, T.; Nooshiri, N.; Steinberg, A.; et al. Pyrocko—An open-source seismology toolbox and library. V. 0.3. GFZ Data Serv. 2017. [Google Scholar] [CrossRef]
Figure 1. Utility of different sensor types, both spaceborne and ground-based, used by MOUNTS to monitor various volcanic processes. The occurrence of these may vary strongly from one volcano to another [11,26], and therefore the timings reported are given in an indicative manner. Processes flagged with an asterisk are those illustrated in this paper. The approximate revisit frequency of each satellite product used is indicated with a colored-marker (see Table 1 for details). Apart from Sentinel-3, all data are available on MOUNTS website. USGS: U.S. Geological Survey; SAR: Synthetic Aperture Radar; SWIR: short-wave infrared (SWIR).
Remotesensing 11 01528 g001
Figure 2. Workflow of MOUNTS monitoring system, managing automated data query, download, processing, and dissemination of satellite-based (Sentinel-1 (S1), -2 (S2) and -5P (SP5)) and ground-based (global earthquake catalogues USGS and GEOFON) data at a number of volcanoes worldwide.
Remotesensing 11 01528 g002
Figure 3. Snapshot of the standard webpage identical for each monitored volcano, and description of the menu content.
Remotesensing 11 01528 g003
Figure 4. Workflow to detect ground deformation using a pre-trained convolutional network: (a) Convolutional Neural Network (CNN) training using synthetic data (see Supplementary Material S2), (b) operational usage of the pre-trained CNN to detect to detect phase gradients and decorrelation mask in real interferograms (Piton de la Fournaise in this example), (c) phase unwrapping to recover ground displacements, and derive a deformation score defined as the standard deviation of the displacement map, (d) data dissemination, as images and time series on a public website (www.mounts-project.com), and email alerts to interested users when a threshold is overcome.
Remotesensing 11 01528 g004
Figure 5. Example of surface deformation detection related to magma intrusions at Piton de la Fournaise (Réunion Island). (a) Wrapped interferograms and (b) deformation maps in radar line-of-sight (LOS), obtained from interferogram unwrapping (see Figure 4). (c) Deformation score DEF computed from the deformation map. (d) Number of hot pixels detected in the S2 SWIR image (orange curve, computed by MOUNTS), and Volcanic Radiative Power (VRP) recovered from MODIS data (black markers, computed by MIROVA). The eruptive episodes are numbered from 1 to 5, and highlighted by gray areas based on the eruption timing provided by the OVPF (Observatoire Volcanologique du Piton de la Fournaise): 0.7, 34.6, 0.8, 47, and 19.9 days respectively, publically available at http://www.ipgp.fr/fr/ovpf/activite-recente-piton-de-fournaise. Eruptive episode 5 is shown in detail in Figure 9, in which SO2 data is also displayed.
Remotesensing 11 01528 g005
Figure 6. Example of lava flow emplacement detection at Erta Ale (Ethiopia) using both S1 interferometric coherence and S2 SWIR analysis. (a) Decorrelation area related to volcanic activity, calculated as the number of pixels where coherence <0.5, multiplied by the pixel area (14 × 14 m). Black curve: decorrelation on 2 × 2 km mask centered at the summit to image the lava lake activity. Blue curve: decorrelation on 50 × 50 km mask to image the lava flow emplacement. Because on such a large scale the coherence map also includes sandy areas where coherence is <0.5, these regions where manually excluded for this specific figure so that the curve only depicts the area of the active lava flow. (b) Number of hot pixels (×106) detected in the S2 SWIR image (50 × 50 km mask). (c) Deformation score DEF computed from the deformation map (unwrapped interferogram). Coherence maps (top image row) and SWIR images (bottom image row) are displayed at selected dates, with spatial scales varying according to the eruptive phase: (i) pre-eruptive phase with intense activity at the summit lava lakes, 2 × 2 km mask; (ii) eruptive onset, manifested by surface deformation and aperture of a new eruptive vent, ~12 × 12 km mask; (iii) early stages of the effusive activity (highlighted by a gray box), showing the emplacement of lava flows on both NE and SW flanks of the volcano, ~12 × 12 km mask; (iv) advanced stages of the effusive activity, when the lava flow front reaches its maximum distance from the vent, 11.5 × 19.5 km mask. The red box displayed in the coherence images refer to the 2 × 2 km mask centered on the active lava lakes.
Remotesensing 11 01528 g006
Figure 7. Example of pyroclastic flow detection after the June 2018 Fuego (Guatemala) eruption. (a) SAR intensity log-ratio (VV polarization) computed between image SAR 1 acquired before eruption (2 June 2018 00:13), and image SAR 2 acquired after (8 June 2018 00:14). Blue and red colors indicate respectively decrease and increase in backscattered intensity. (b) S2 SWIR image acquired on 4 June 2018 16:18 UTC. (c) Interferometric coherence between images SAR 1 and SAR 2.
Remotesensing 11 01528 g007
Figure 8. Two examples of morphological changes detected from SAR intensity (images on top rows, black markers on timeline), and closest S2 SWIR acquisition (images in bottom rows, orange markers on timeline). The temporal evolution of the most prominent morphological changes visible in SAR images are sketched on the right. (a) Caldera collapse of Kilauea (Hawai’i) during the first months of the 2018 flank eruption. (b) Anak Krakatau (Indonesia) island growth during the months preceding the 2018 tsunamigenic landslide, and horseshoe-shaped caldera after the landslide. In this figure speckle is removed from SAR images using a non-local means filter [78] (NDSAR, https://github.com/odhondt/ndsar), and tone mapping of SWIR images is fixed so that colors and contrasts are the same in each image. See Supplementary Material S3 and S4 for video animations spanning several months.
Remotesensing 11 01528 g008aRemotesensing 11 01528 g008b
Figure 9. Example of SO2 emission detection during the February 2019 eruptive crisis at Piton de la Fournaise (Reunion Island). (a) SO2 images from Sentinel-5P at selected dates (planet boundary layer PBL, 500 × 500 km mask). The detected pixels contaminated with volcanic SO2 are overlaid with a semi-transparent gray mask. (b) SO2 mass recovered by MOUNTS (purple markers) and by NASA (black markers, data available at https://so2.gsfc.nasa.gov/pix/daily/0319/reunion_0319tr.html, computed on 1000 × 1000 km mask). (c) Number of hot pixels (×106) detected in the S2 SWIR image (orange curve, computed by MOUNTS), and Volcanic Radiative Power (VRP) recovered from MODIS data (black markers, computed by MIROVA).
Remotesensing 11 01528 g009
Figure 10. Multiparametric dataset combining space-based and ground-based sensors, which help decipher the recent eruptive dynamics of Ambrym (Vanuatu). The eruption onset on 15 December 2018 is indicated by a red vertical line across the plots. Time series of: (a) decorrelation score COH (pixels with coherence <0.5) in blue indicating surface reflectivity change, and deformation score DEF in red; (b) thermal anomalies from S2 SWIR analysis in orange (N hot pixels ×106) and MODIS MIR analysis in black (VRP), processed by MOUNTS and MIROVA, respectively; (c) SO2 gas mass in the atmosphere from Sentinel-5P analysis in purple and OMPS analysis in black, processed by MOUNTS and NASA respectively; (d) magnitudes of the earthquake recorded in the vicinity of the volcano, recovered from the USGS global earthquake catalog. Images: (a.1) wrapped interferogram computed between SAR images d.1 and d.2, revealing very strong ground deformation (areas with strong phase decorrelation are masked to show only where deformation fringes are visible); (a.2) interferometric coherence, on which a new eruptive vent is identifiable; (b.1) S2 SWIR image prior to eruption onset, showing the persistent lava lakes activity; (b.2) S2 SWIR image after eruption onset, showing the lava flow emplacement from the new eruptive vent; (c.1) S5P image showing SO2 emissions prior to eruption onset; (c.2) S5P image showing strong decrease of SO2 emissions after eruption onset; (d.1,2) S1 intensity images immediately before and after the eruption onset, revealing profound morphological changes. Spatial extent of images a.1,2, b.1,2 and d.1,2 = 10 × 10 km, extent of images c.1,2 = 500 × 500 km.
Remotesensing 11 01528 g010
Table 1. Selected operational space-based volcano monitoring systems having a global scope. Although both MOUNTS (Monitoring Unrest from Space) and the Insar Viewer (Univ. Miami) incorporate ground-based open-access data in their platform, we here only describe satellite-based data. We refer the reader to the websites and publications for more in-depth detail on the various systems. Revisit and repeat frequencies are indicative, as these vary depending on the latitude and acquisition plan of the space agencies. The revisit frequency indicates the rate at which a volcano is imaged without considering repetitiveness of relative orbits, whereas the repeat frequency considers coverage ensured from the same repetitive relative orbit (i.e., necessary for InSAR analysis in particular). Acronyms used in the table: MIR = Middle InfraRed, TIR = Thermal InfraRed, TADR = Time-Averaged Discharge Rate (m3/s), NTI = Normalized Thermal Index, VRP = Volcanic Radiative Power (Watt), TSR = Total Spectral Radiance, VFR = Volume Flow Rate (m3/s), BTD = Brightness Temperature Difference. Webpage links: (1) http://modis.higp.hawaii.edu/, (2) www.mirovaweb.it, (3) http://hotvolc.opgc.fr, (4) https://so2.gsfc.nasa.gov/, (5) http://sarviews-hazards.alaska.edu, (6) https://comet.nerc.ac.uk/COMET-LiCS-portal/, https://comet.nerc.ac.uk/volcanoes/ (7) https://insarmaps.miami.edu/, (8) www.mounts-project.com.
SystemSatellite/Sensor Characteristics Used by the SystemSystem Characteristics
Satellite (Sensor)Wave-LengthOrbit, Revisit/RepeatResolutionAlgorithmKey ProductsAvailability after SensingN. VolcanoesWeb link
MODVOLCAqua/Terra (MODIS)MIR-TIRpolar-orbiting
~4 img/day revisit
1 kmspectral algorithm [40]Thermal monitoring:
.
N hot spot (pixels)
.
radiant flux (timeseries)
<12 h>10001
MIROVAAqua/Terra (MODIS)MIR-TIRpolar-orbiting
~4 img/day revisit
1 kmcontextual algorithm [43]Thermal monitoring:
.
VRP (timeseries)
.
NTI (map)
Lava monitoring:
.
TADR (timeseries, offline)
<4 h2152
HOTVOLCMSG-0 (SEVIRI)MIR-TIRgeostationary
1 img/15 min
3 km (nadir)contextual algorithm [46]Thermal monitoring:
.
spectral radiance (map, timeseries)
Lava monitoring:
.
TSR (timeseries)
.
N hot spots (timeseries)
.
VFR (timeseries)
<30 min~503
[48]Ash monitoring:
.
BTD 5-band, altitude, mass concentration, plume contour (map)
.
area, altitude, mass (timeseries)
[47]SO2 monitoring:
.
BTD tropospheric (map, timeseries)
.
area (timeseries)
NASA Global SO2 MonitoringAura (OMI, OMPS)
Sentinel-5P (TROPOMI)
UVpolar-orbiting
~1 day revisit
13 × 24 km (OMI)
50 × 50 km (OMPS)
3.5 × 7 km (TROPOMI)
[53]SO2 monitoring:
.
concentration (map)
.
mass (timeseries)
<2 d (OMI-OMPS)
>7 d (TROPOMI)
>10004
SARVIEWSSentinel-1 A/B (SAR)C-bandpolar-orbiting
~6–12 days repeat
3.1 × 14.1 m
(SLC, IW)
DInSAR
(Gamma software)
Change Detection [50,51]
Deformation monitoring:
.
wrapped interferogram (80 × 80 m px)
Reflectivity monitoring:
.
RTC image
.
change map
≤24 hvariable5
LICSSentinel-1 A/B (SAR)C-bandpolar-orbiting
~6–12 days repeat
3.1 × 14.1 m (SLC, IW)DInSAR
(Gamma software) [54]
Deformation monitoring:
.
wrapped interferogram + coherence map
.
unwrapped interferogram
<2 weeks>10006
Univ. Miami InSAR ViewerSentinel-1 A/B (SAR)C-bandpolar-orbiting
~6–12 days repeat
3.1 × 14.1 m (SLC, IW)INSAR timeseries (ISCE + MindPy)Deformation monitoring:
.
ground displacement timeseries map
2–3 days~107
MOUNTSSentinel-1 A/B (SAR)C-bandpolar-orbiting
~6–12 days repeat
3.1 × 14.1 m (SLC, IW)DInSAR
(SNAP software)
Artificial Intelligence (CNN)
Deformation/reflectivity monitoring:
.
wrapped interferogram + coherence map (14 × 14 m px)
.
unwrapped interferogram
.
SAR intensity image
.
deformation and decorrelation timeseries
≤24 h~208
Sentinel-2 A/B (MSI)VIS-SWIRpolar-orbiting
~5 days revisit
10 m (VIS)
20 m (SWIR)
contextual algorithm [55]Thermal monitoring:
.
SWIR image B12-B11-B8A (20 × 20 m px)
.
N hot pixels (timeseries)
≤12 h
Sentinel-5P (TROPOMI)UVpolar-orbiting
~1 day revisit
3.5 × 7 km[16,56]SO2 monitoring:
.
concentration map in PBL (3.5 × 7 km px)
.
mass (timeseries)
≤6 h
Table 2. Evaluation of the performances of the proposed CNN, and comparison with the CNN presented by [34] (AlexNet). The metrics are derived from the confusion matrix, where P is the number of real positives in the dataset (i.e., number of interferograms where deformation is recorded), N is the number of real negatives, TPR is the true positive rate, and TNR is the true negative rate. For each volcano we evaluate on the entire interferogram dataset (since training is performed on an independent synthetic dataset), whereas [34] report the average over multiple random splits into training and testing groups of equal size. Interferograms where deformation is expected were marked manually for ground truth (i.e., real positives P), and during evaluation deformation detection threshold was DEF = 0.001, the same threshold as for the email notifications.
VolcanoMethodN Interferograms (P + N)Time SpanAccuracyTPRTNRExec. Time (Interf. Size)
Erta Aleproposed CNN134 (2 + 132)3 February 2016–
19 May 2019
1.0001.0001.0000.18 s (875 × 817)
AlexNet 1205 (12 + 193)11 December 2016–
6 December 2017
0.9941.0000.9881.50 s (500 × 500)
Etnaproposed CNN126 (2 + 124)8 May 2018–
21 May 2019
0.9931.0000.993-
AlexNet 1189 (2 + 187)3 September 2016–
9 November 2017
0.8710.7470.981-
1 From [34].

