Article

Development and Validation of a Model to Combine NDVI and Plant Height for High-Throughput Phenotyping of Herbage Yield in a Perennial Ryegrass Breeding Program

1
Agriculture Victoria Research, Hamilton Centre, Hamilton 3300, Australia
2
School of Agriculture and Food, Faculty of Veterinary and Agricultural Sciences, The University of Melbourne, Melbourne 3010, Australia
3
Agriculture Victoria Research, AgriBio, Centre for AgriBioscience, Bundoora 3083, Australia
4
School of Applied Systems Biology, La Trobe University, Bundoora 3086, Australia
*
Author to whom correspondence should be addressed.
Remote Sens. 2019, 11(21), 2494; https://doi.org/10.3390/rs11212494
Submission received: 28 August 2019 / Revised: 10 October 2019 / Accepted: 21 October 2019 / Published: 25 October 2019

Abstract

:
Sensor-based phenotyping technologies may offer a non-destructive, high-throughput and efficient assessment of herbage yield (HY) to replace current inefficient phenotyping methods. This paper assesses the feasibility of combining normalised difference vegetative index (NDVI) from multispectral imaging and ultrasonic sonar estimates of plant height to estimate HY of single plants in a large perennial ryegrass breeding program. For sensor calibration, fresh HY (FHY) and dry HY (DHY) were acquired destructively, and plant height was measured at four dates each in 2017 and 2018 from a selected subset of 480 plants. Global multiple linear regression models based on K-fold and random split cross-validation methods were used to evaluate the relationship between observed vs. predicted HY. The coefficient of determination (R2) = 0.67–0.68 and a root mean square error (RMSE) between 5.43–7.60 g was obtained for the validation of predicted vs. observed DHY. The mean absolute error (MAE) and mean percentage error (MPE) ranged between 3.59–5.44 g and 22–28%, respectively. For the FHY, R2 values ranged from 0.63 to 0.70, with an RMSE between 23.50 and 33 g, MAE between 15.11 and 24.34 g and MPE between ~22% and 31%. Combining NDVI and plant height is a robust method to enable high-throughput phenotyping of herbage yield in perennial ryegrass breeding programs.

Graphical Abstract

1. Introduction

Perennial ryegrass (Lolium perenne L.) is one of the most important temperate forage crops in Australia for dairy, meat and wool production and it makes a significant contribution to Australia’s grazing industries valued at $8 billion/annum [1]. Herbage yield (HY) improvement is one of the primary ryegrass breeding targets, yet it is not easy to improve because phenotyping herbage yield is laborious, costly and must be performed multiple times within a year and across multiple years [2,3,4]. The development of new cultivars may take up to 15 years, where repeated phenotyping of herbage yield and related traits is required at every harvest. However, performing measurements using current methods on large numbers plants or plots is slow and expensive, making it difficult to include large numbers of individual plants or plots [5]. This makes it challenging to capture an accurate representation of the population and estimate the correct values for individual genotypes. Therefore, HY estimation requires rapid, non-destructive phenotyping methods that can also facilitate genomic tools (e.g., genomic selection, GS) to shorten the breeding time and accelerate genetic gain. However, the number of plants for GS is likely higher than the number of plants traditionally used by breeders to perform selection breeding (e.g., The DairyBio initiative has 48,000 individual plants for genomic sub-selection breeding) where phenotyping of individual plants require accurate evaluation [5]. In recent years, high-throughput phenotyping (HTP) technologies have brought new insights to evaluate phenotypic traits efficiently in large breeding programs [6,7,8,9].
Previous studies have used sensor-based data sources from aerial and ground-based platforms to estimate biophysical characteristics of various vegetations, including herbage yield of forage crops [5,10,11]. The aerial-based phenotyping platforms are suitable for lightweight red-green-blue (RGB), multispectral, and hyperspectral imaging systems and have used vegetative indices to build models for herbage yield [10,12] and biomass [13,14,15] estimation of pasture and cereal crops respectively. Normalised difference vegetative index (NDVI) is a widely used vegetative index for estimates of biomass [16,17,18] with limitations at high-biomass and density of crop cover [19]. Small, low-cost unmanned aerial systems (UAS) and satellite technologies (mainly equipped with multispectral sensors) are mainly deployed to execute the phenotyping task. The UAS system allows proximal sensing of plant phenotypes at a small experimental unit level with high spatial and spectral resolution [20,21,22].
Another alternative extensively used to estimate herbage yield is plant height [23,24,25]. Plant structural information metrics may be accessed from terrestrial and aerial sensors. The usefulness of this information depends on the spatial and temporal resolution of the data [13]. Different sensor types have been used to evaluate plant height, such us ultrasonic sonar and LiDAR on the ground and UAS [26,27,28] as well as structure from motion from digital cameras on UAS [13,29]. Among the mentioned sensors, ultrasonic sonar is inexpensive and user-friendly with broader application for sward pasture measurements [26,30,31]. However, the accuracy of plant height measurement from ultrasonic sonar may be limited by the distance between the sensor and target plant, plant growth habit and the size (density) of the leaves [26,30]. To overcome some of these limitations, fitting ultrasonic sonar to ground-based phenotyping platforms may provide accurate measurements. Indeed, the advantage of a ground-based platform is the suitability capturing data at high resolution with minimal errors [32].
Generally, the performance of vegetative indices from UAS can be limited by saturation at higher levels of crop canopy cover [19]. Combining vegetative indices from photogrammetric imagery and plant height information may improve herbage yield [5]. The combination of NDVI and plant height from terrestrial LiDAR may improve the herbage yield estimation by up to 20% [12]. A similar result has been observed in studies of herbage yield estimation of tall fescue (Festuca arundinacea), perennial ryegrass and phalaris (Phalaris aquatica) sward plots [33]. In these studies, forage crops were evaluated as swards or under conditions similar to those in commercial paddocks. However, assessment of ryegrass herbage yield at early stages of a breeding program requires an evaluation of large numbers of individual plants, grown under spaced conditions. Non-destructive estimations of plant height and NDVI may provide the structural and spectral information for forage breeders to select elite genotypes from large breeding populations to explore the full potential of GS.
Some biomass and herbage yield estimation methods use advanced multivariate regression techniques for the establishment of a direct relationship between proximally sensed and manually collected parameters. Previous studies have demonstrated the use of linear and non-linear regression models to predict plot biomass from sensor measured plant height in barley experimental plots, NDVI in cover crops and combined plant height, and NDVI in tall fescue [12], winter wheat and barley [15,34]. The performance of the models varies with the experiment and crop types used. However, most of the previous studies focus on plot-level field evaluations for grass and crop management, and no previous studies have been performed that apply sensors in combination to determine the HY estimations of single plants. In this study, we develop various cross-validation models using NDVI from UAS-based multispectral imaging and plant height from the ground-based vehicle to predict fresh herbage yield (FHY) and dry herbage yield (DHY) in large perennial ryegrass breeding program.
The overall objective of the study was to establish herbage yield estimation models for individual perennial ryegrass plants by using data derived from non-destructive methods including plant height, NDVI and a fusion of plant height and NDVI for eight harvests during the 2017 and 2018 growing seasons. The model predictions were compared with manual measurements to validate them as predictors of HY for individual plants.

2. Materials and Methods

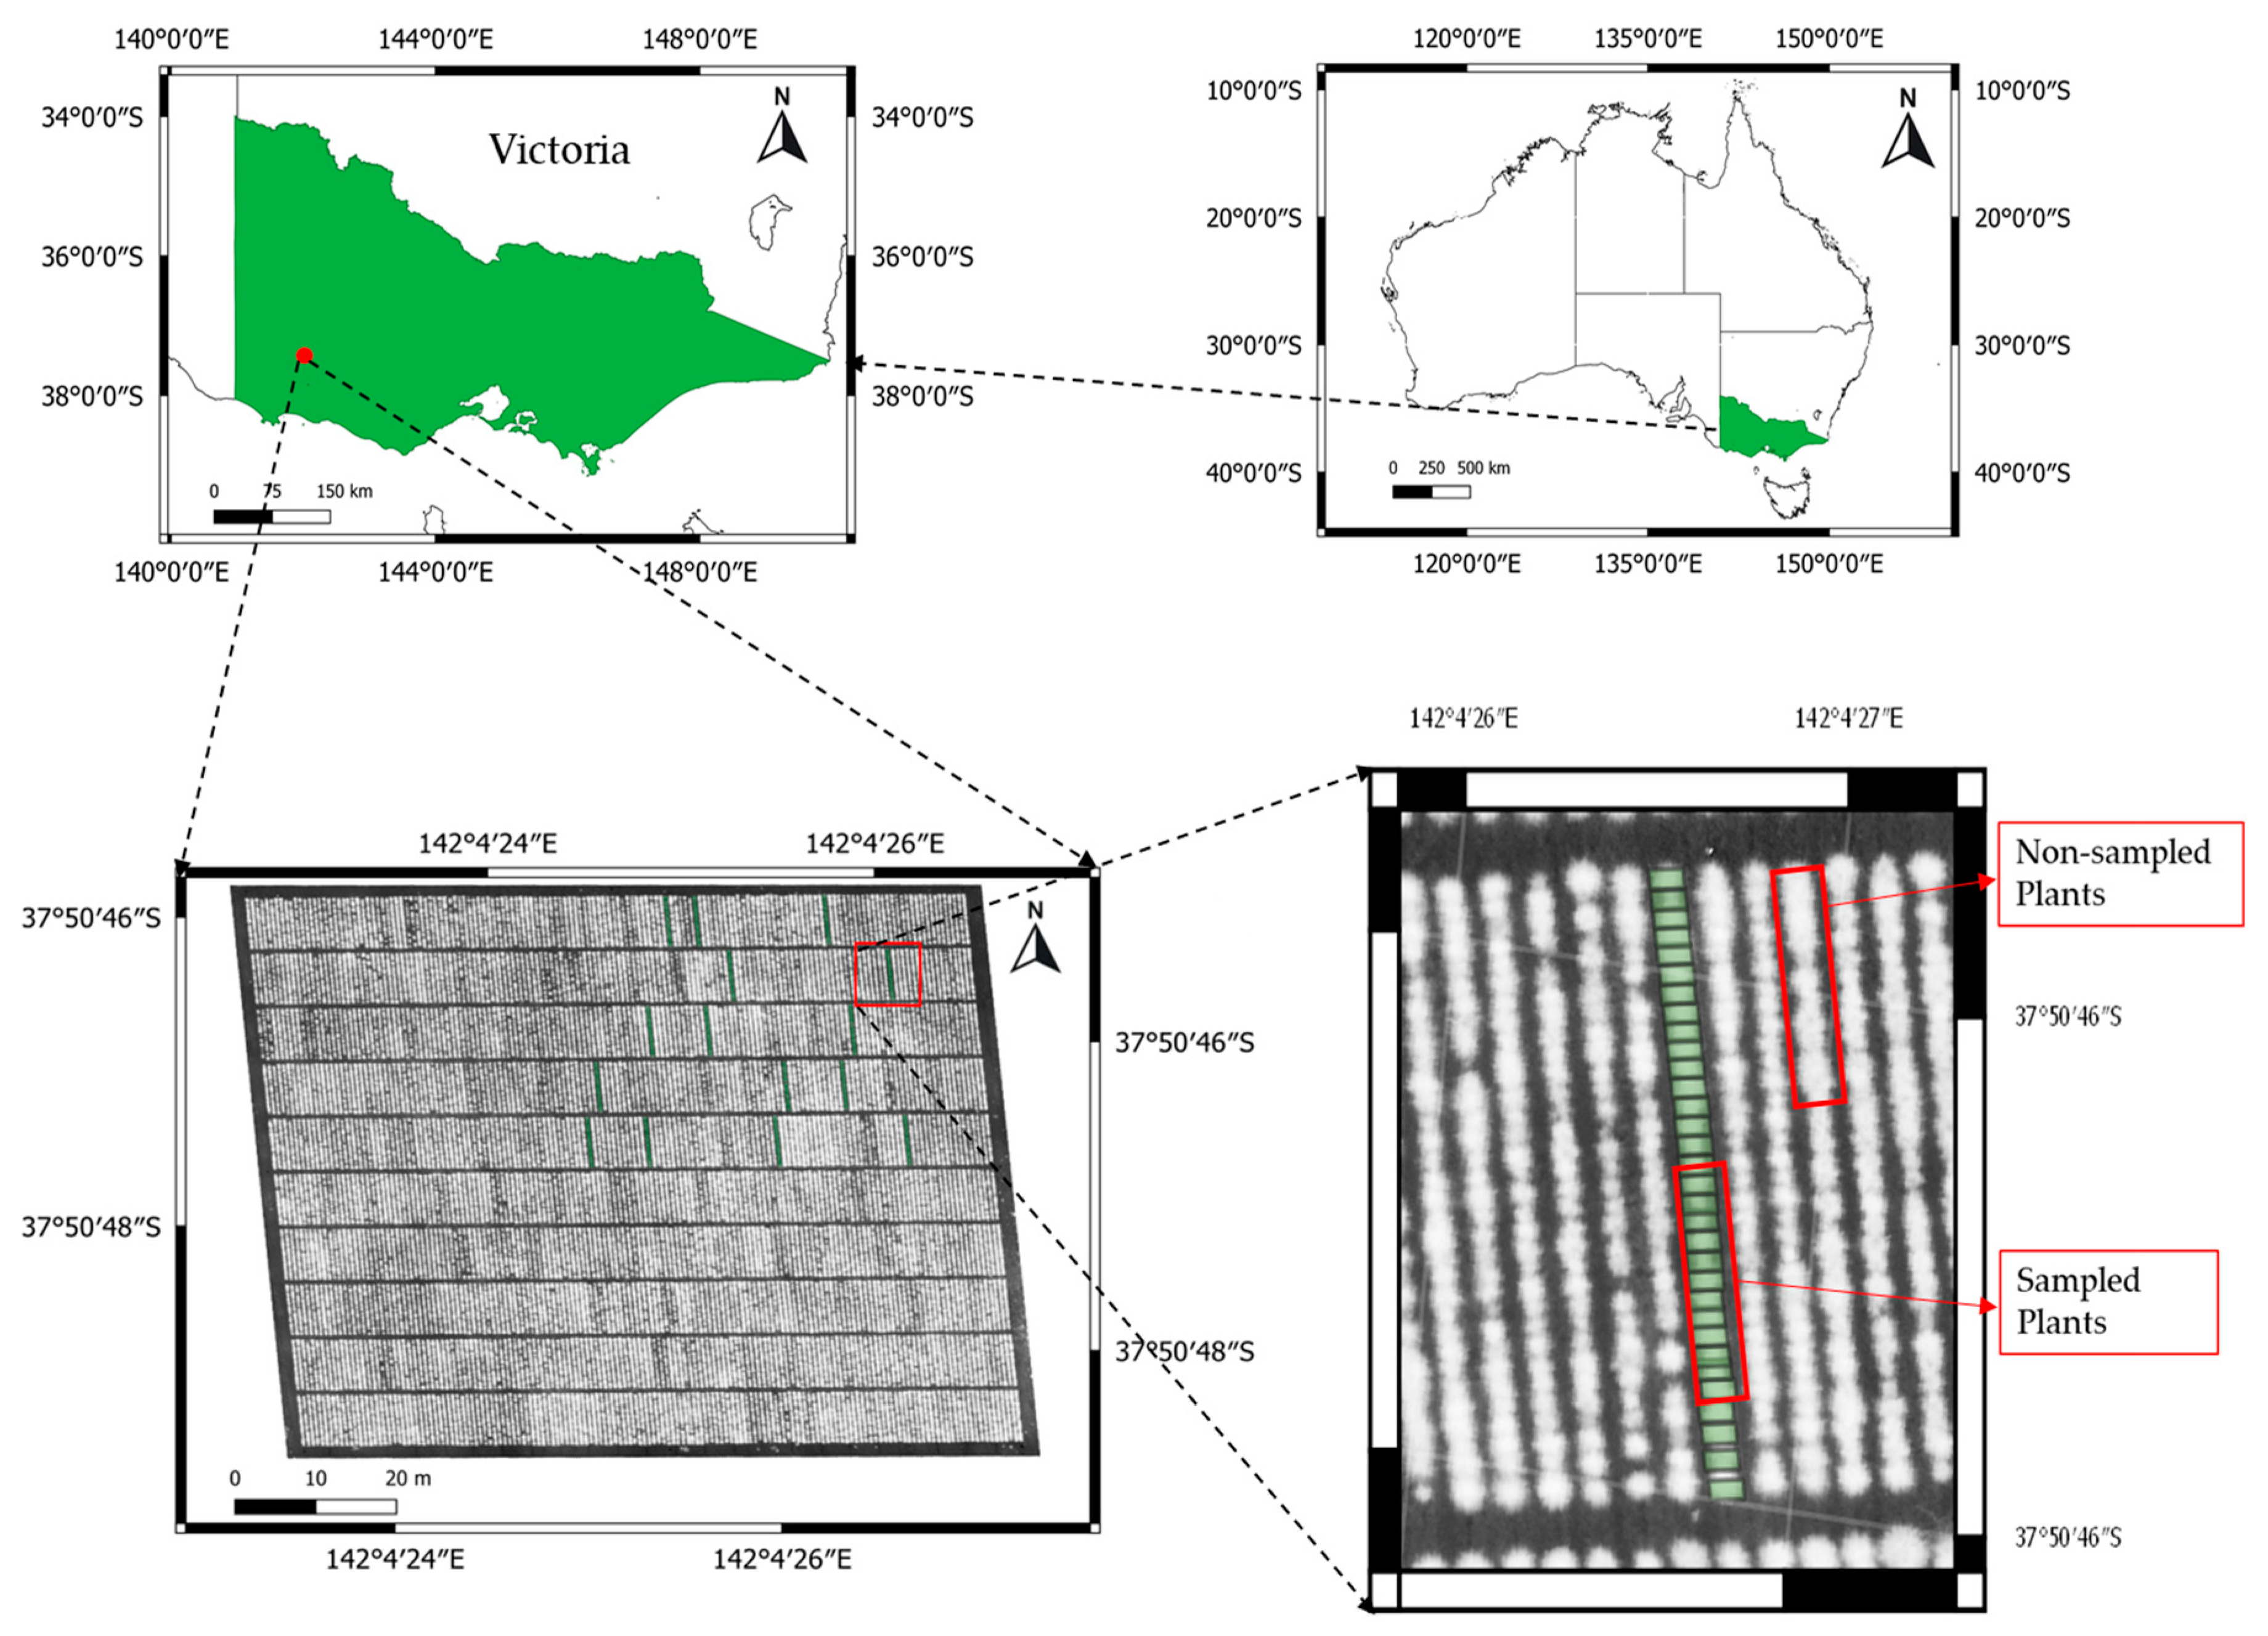
2.1. Experimental Setup

The experiment was carried out on a field at Agriculture Victoria Research’s (AVR)-Hamilton Centre (37.8462°S, 142.07375°E, elevation 209 m) located in South West Victoria, Australia. The research site, approximately 0.78 ha, planted with 48,000 perennial ryegrass plants, was established in June 2016 as part of the DairyBio project. The field trial was established to perform genomic sub-selection (GSS, field hereafter) through applications of advanced phenomics and genomics tools. It contains 500 perennial ryegrass plots of fifty cultivars and advanced breeding lines planted as randomised complete block design. Each plot consists of 96 genotypes in a layout of three parallel rows, each with 32 spaced plants per row, 0.60 m spacing between rows, and 0.25 m spacing between individual plants within a row (Figure 1). The size of each plot is ~14.4 m2 (1.8 m × 8 m dimension) representing one cultivar/advanced breeding line per plot. Fertiliser application and weed management practices were performed regularly throughout the experiment period.
For this experiment, eight total harvests in the years 2017 and 2018 were performed. At each harvest, a subset of 475 (2017) and 426 (2018) plants from five breeding lines were harvested. Details of the manually collected data, data from the UAS and PhenoRover phenotyping platforms are listed in Table 1.
Two phenotyping systems, ground and UAS-based platforms were used for data collection. A ground-based phenotyping system was used to collect plant height measurements from single plants whereas the UAV used a multispectral imaging system to extract individual plant’s NDVI values. The selected plants were assessed for height and cut for fresh and dry weight on the following day.

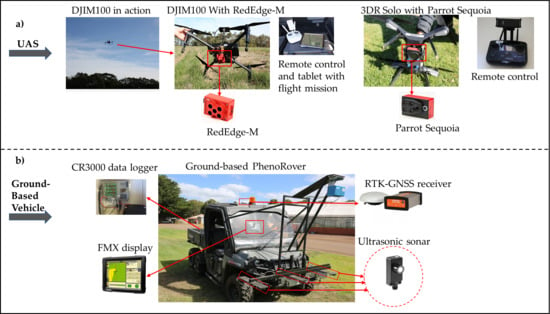
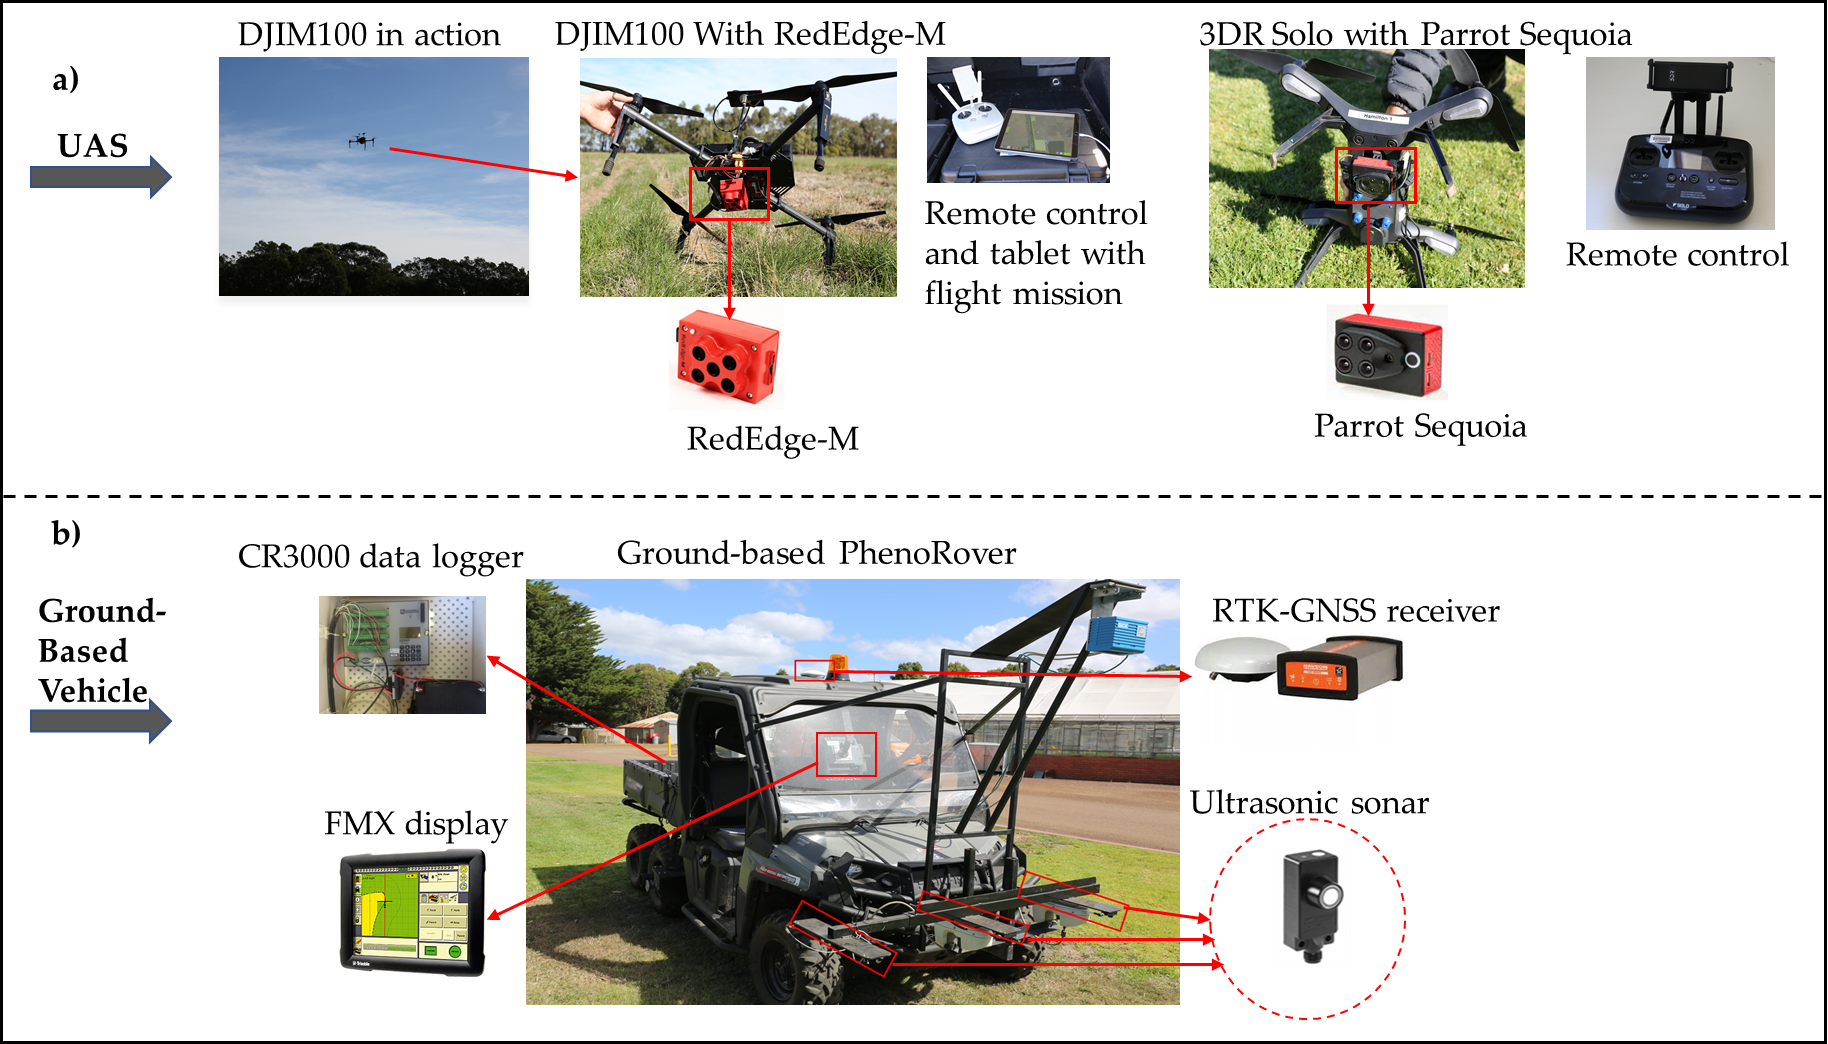
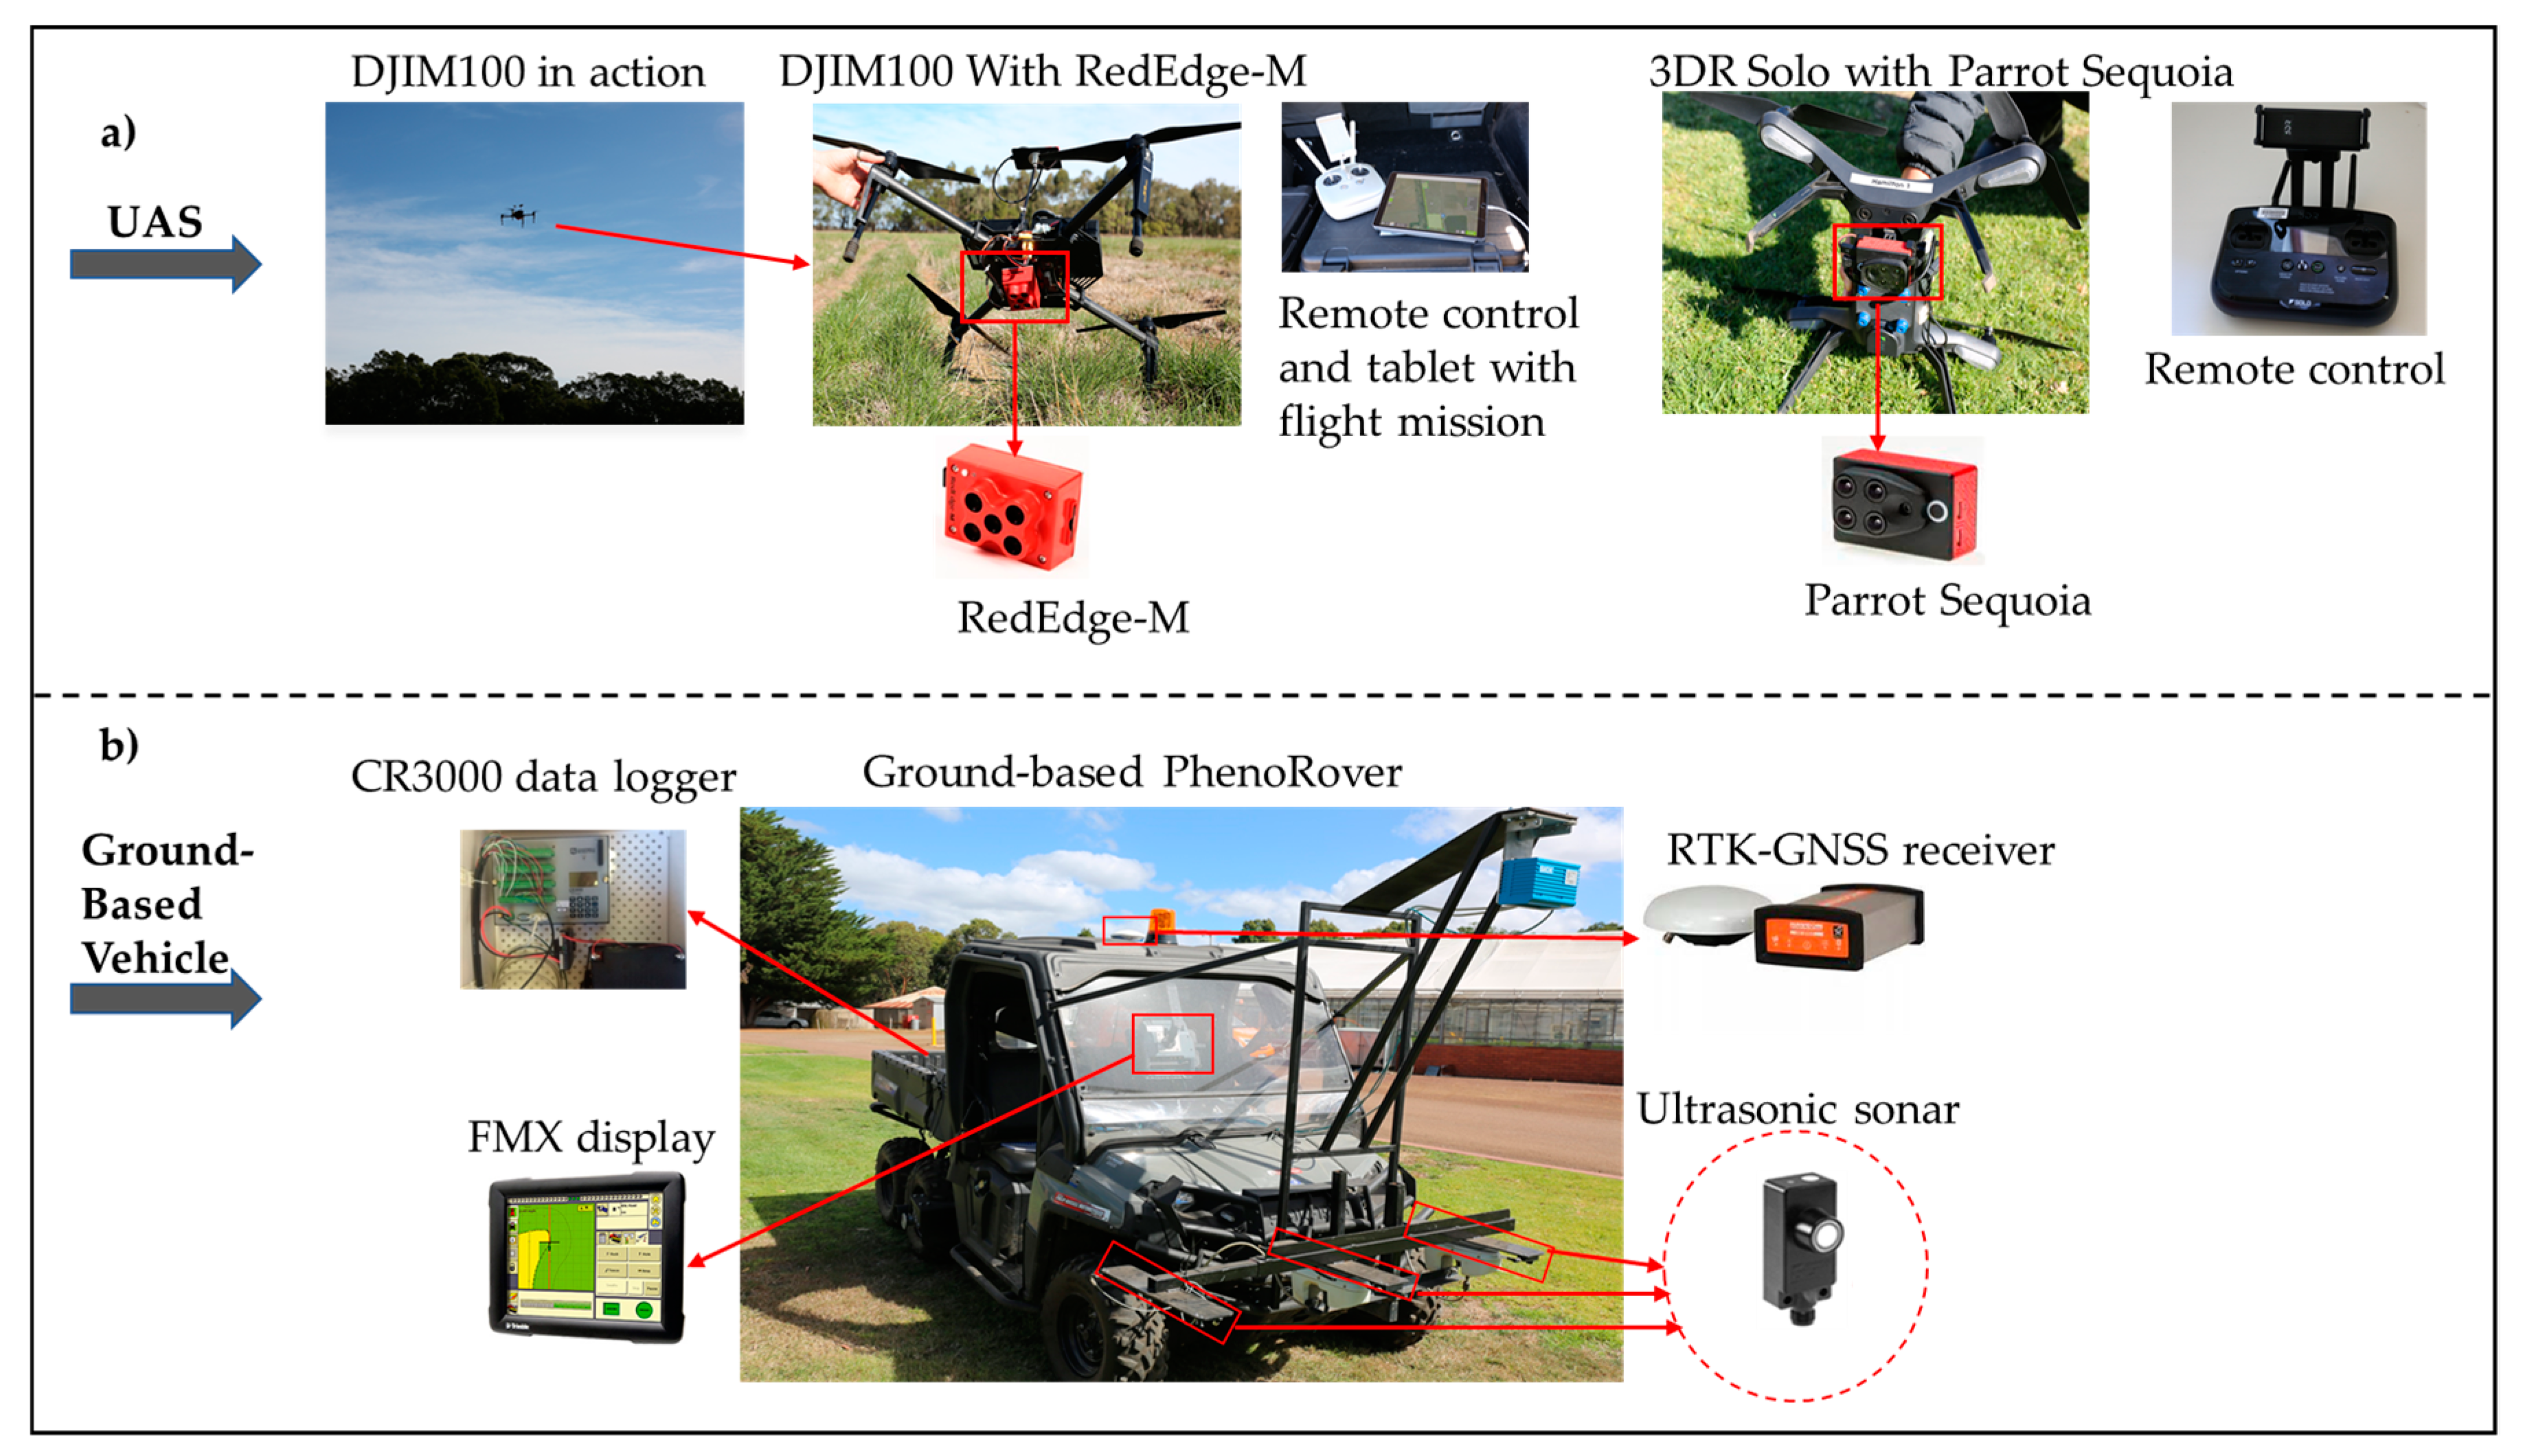
2.2. Data Collection Platforms

2.2.1. Unmanned Aerial Systems (UAS)

During 2017, aerial images were collected via a Parrot Sequoia (Parrot Drones S.A.S, Paris, France) multispectral camera abroad a 3DR Solo (3D Robotics, Berkeley, CA, USA) UAS at 20 m elevation (Figure 2a). Tower Beta software was used to conduct each flight. Airinov calibration plates (MicaSense Inc., Seattle, WA, USA) with known reflectance values were used to correct the reflectance values of the images.
During 2018, aerial images were collected via a RedEdge-M (RedEdge-M, MicaSense Inc., Seattle, WA, USA) multispectral camera aboard a DJI M100 (DJI Technology Co., Shenzhen, China) UAS to collect images at 20 m flight elevation. New UAS and camera system was used in this season due to the reason AVR decided to upgrade the carrying capacity of the UAS system at Hamilton Centre in the year 2018. Flights were conducted using the Pix4D capture software. Reflectance values from calibration tarps (Tetracam INC. Chatsworth, CA, USA) were used to correct the reflectance values of the images. The multispectral imagery was collected with 1.2 megapixels. The details of UAS data acquisition methods and processing accuracies are listed in Table 2.

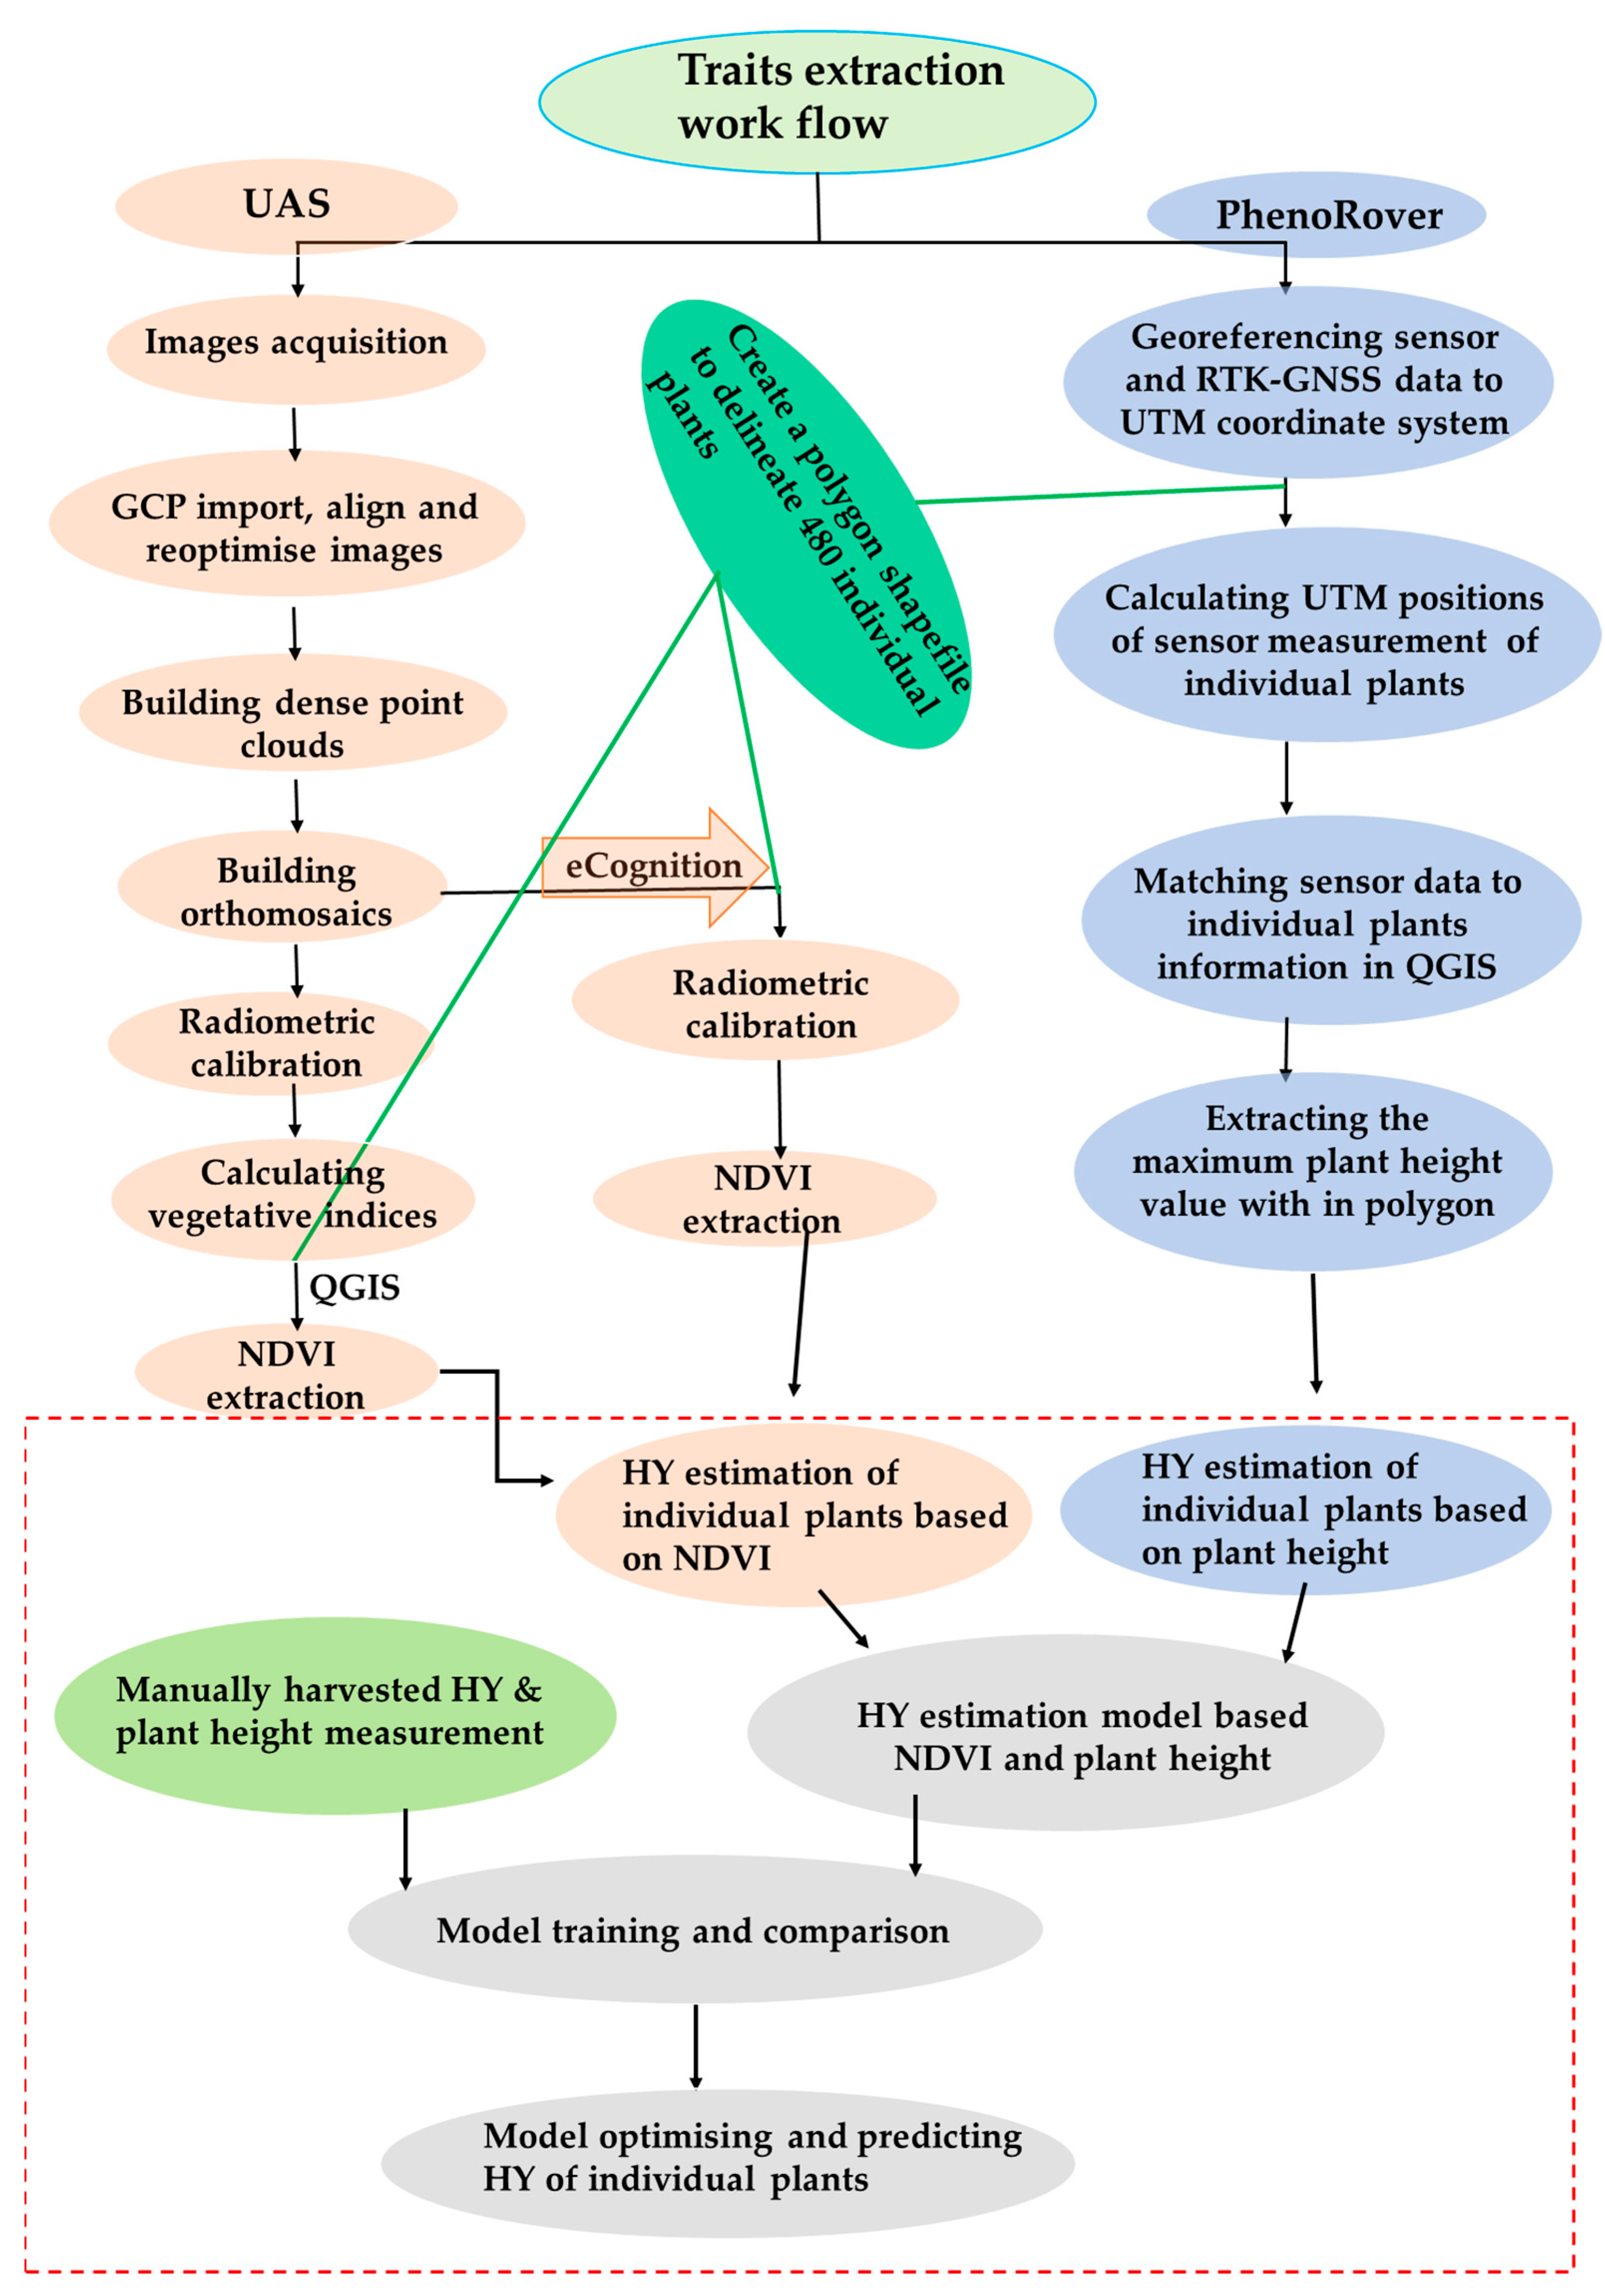
2.2.2. Image Processing and NDVI Data Extraction

PiX4D Mapper Pro (version 4.3.31 Pix4D, Lausanne, Switzerland) (https://pix4d.com) was used to perform geolocation of captured images by generating orthomosaics. The initial main steps in this process included importing ground control points (GCPs), aligning and reoptimizing of images. The next step included building dense point clouds, building orthomosaic, performing radiometric calibration (2017 data) and calculating NDVI [21]. Nine GCPs were distributed across the field trial site for increasing accuracy and noise reduction (Figure 1). Accurate geographical locations of GCPs were obtained using a Trimble RTK GNSS receiver (Navcom SF-3040, Nav Com Technology Inc., Torrance, CA, USA), with a horizontal/vertical accuracy of 0.01 m + 0.5 ppm/0.02 m + 1 ppm respectively. The values of the geometric root mean square errors of the GCPs and ground sample distances (GSD) of the processed data are indicated in Table 2 were used to evaluate the accuracy of the orthomosaic images.
For the 2017 data, single plants NDVI value was calculated from the orthophotos using zonal statistics in the QGIS 2.18.2 (QGIS Development Team, 2017, Raleigh, NC, USA) (https://www.qgis.org/en) software environment. This was performed by manually projecting polygons on to each sampled single plant in the coordinate reference system of the trial.
For the 2018 data TIFF files of index values from individual bands were loaded to eCognition software (eCognition Developer 9, Trimble, Munich, Germany). In the eCognition workflow, calibration of TIFF index values was performed based on the extrapolation of digital numbers from the calibration tarps of known reflectance. Next, the calculation of VI, manual segmentation, and classification of VIs were performed, followed by NDVI value extractions.

2.2.3. PhenoRover System Field Deployments

The PhenoRover system is a ground-based platform consisting of a Polaris Ranger 6 × 6 side-by-side vehicle system (Polaris Industries Inc., Medina, MN, USA) and a range of integrated sensors (Figure 2b). The PhenoRover phenotyping platform was designed for collecting pasture height data, and the development was completed at Hamilton in 2016. The PhenoRover was deployed at the beginning of 2018 and proceeded to collect data at each three-leaf stage harvest at an average speed of 1.4 ms−1. Six ultrasonic sonar sensors (UNDK 30U6103/S14, Baumer group, Frauenfeld, Switzerland) were installed onto a sensor boom, which was 1.45 m wide custom-made steel rigidly welded to the PhenoRover front. The six ultrasonic sonar sensors in total collected height data in three rows and two columns of plants on each pass of the PhenoRover over the field trial. All ultrasonic sonar sensors were mounted at 0.6 m above the ground and arranged in three rows of 0.6 m apart in a nadir view. The ultrasonic sonars have a high repeatability accuracy of 0.0005 m. The ultrasonic sonar sensors have a measuring range from 0.1 to 1.0 m, with a sonic frequency of 240 KHz taking measurements at 10 Hz. This allows for height measurement to be captured every 0.05–0.10 m when driving at 1.4 ms−1. In addition to the ultrasonic sensors, one Global Navigation Satellite System (GNSS) antennae (AG25, Trimble, Westminster, CO, USA) was installed at the rooftop of the PhenoRover system and connected to a real-time kinematics GNSS (RTK-GNSS) receiver (FMX Integrated Display, Trimble, Westminster, CA, USA) for generating georeferenced and geolocated sensor data. Moreover, to record the ultrasonic sonar measurements a Campbell Scientific CR3000 datalogger (Campbell Scientific, Inc., Logan, UT, USA) was fitted on the back of the PhenoRover system.

2.2.4. Plant Height Data Extraction from the Ultrasonic Sonar

Ultrasonic sonar sensors measurements were processed using the methodology of Thompson et al. [35] and Wang et al. [36] (Figure 3). Two main steps are followed for analysing the data: (1) georeferencing of sensor and RTK-GNSS data through projecting to the Universal Transverse Mercator (UTM) coordinate system. The UTM position of each sensor’s measurement was calculated. The field site is in the UTM zone 54S; and (2) matching ultrasonic sensor data to individual plant information using QGIS to annotate sensor data to each plant’s boundaries. Geo-referenced individual plants data were overlayed on pre-defined polygon shapefiles of the selected individual plants in QGIS. Polygons with ID numbers were manually drawn around the individual plants. The data processing and extraction were performed through the processing steps of the HTP geo-processer plug-in. This completes the processing of plant height, displaying an attribute table as a final output of individual plant height along with the ID numbers of the plants.

2.2.5. HY Data Collection

Individual plants’ HY data from manual harvests were collected in the years 2017 and 2018 under four harvesting dates of different seasons of each year (Table 1). The timing was determined by the growth stage of the single plants, in which the 2–3 leaf stage was considered as a standard simulated grazing stage [37]. Thirty-two plants from the third row of the sampled plot were selected for plant height and herbage yield measurement. The destructive measurements of FHY and DHY of single plants were obtained by cutting plants at the 0.05 m above-ground level. FHY was measured from individual plants, and all samples were subsequently dried in an oven for 48 h at 60 °C for the determination of DHY. Additionally, individual plant height was measured using a standard ruler from the base of each plant to the highest upright standing leaf.

2.3. Estimation Models of HY through Sensors Data Combination

Data from the ground and aerial-based platforms were combined to obtain the most suitable model for individual plants’ herbage yield estimation. Firstly, UAS-based NDVI data extracted from each plant through the process in Figure 3 were modelled to estimate HY at every seasonal harvest. Secondly, manually measured plant height and PhenoRover-based plant height data extracted from individual plants through the process in Figure 3 were compared. Thirdly, the manually measured and PhenoRover-based plant height data were modelled to estimate HY. To improve the estimation of accuracy of FHY and DHY, combining the spectral and structural information may be necessary [12,15,31]. In this study, different multiplicative combination methods of NDVI and plant height were assessed, including NDVI × plant height, NDVI × plant height × plant height and, NDVIsq × plant height (NDVIsq_PH). NDVIsq_PH showed the best combination to estimate FHY and DHY with higher accuracy.

2.4. Statistical Analysis

The relationship of herbage yields with plant height and NDVI were analysed using general linear regression models (Figure 3). The measurement taken at the individual plant level was the unit of analyses. Residuals versus fitted values plots were examined to determine the need for data transformation to ensure the normality of residuals with constant variance. When deemed necessary, data were logarithmically transformed before the final analyses. All analyses were performed in R version 3.5.2 (R Core Team 2018, Vienna, Austria).
On some data collection dates (all of 2017 and one day in 2018), plant heights from ultrasonic sonar was not available due to technical issues with the GPS of the PhenoRover system. For these dates, manually measured plant height with a standard ruler was used. For the testing, the estimation of plant height using ultrasonic sonar, a linear regression relationship with the manually measured plant height was performed on three collection dates of 2018.
A parsimonious model for FHY/DHY was developed by using variables such as NDVI values, manually measured plant height (PH)/ plant height from ultrasonic sonar sensors, the product of NDVI square and plant height (NDVIsq_PH) and seasons. The parsimonious model selected was:
F H Y / D H Y   ~   i n t e r c e p t + N D V I s q _ P H + S e a s o n + N D V I s q _ P H . S e a s o n
The predictive accuracy of the model was determined by splitting data into calibrations/training and validation/test sets, which is often referred to as cross-validation. Cross-validation can be carried out in many ways, but we focused on two methods (1) k-fold cross-validation and (2) random split of the dataset. In K-fold cross-validation, we randomly split the data into k-folds (k = 2, 5, 10 and 20) and K-1 folds (sets) of data used as calibration/training set and model parameters were estimated using this data. Using these model parameters, we predicted the FHY/DHY for the remaining one-fold (set) of the data. The cross-validation process is then repeated k times, with each of the k-fold (sets) used exactly once as the validation/test data.
In random split approach, we randomly split data into 60%/40%, 70%/30% and 80%/20%, where 60%, 70% and 80% of the data were used as calibration/training and 40%, 30% and 20% of the data were used as validation/test set, respectively. Each of the random split strategies was carried out 10,000 times, and results averaged.
The model accuracy was measured using coefficient of determination (R2), root mean squared error (RMSE), mean absolute error (MAE), and mean percentage error (MPE) [21]. The R2 is the correlation coefficient between measured and predicted herbage yield. RMSE is the square root of the mean squared difference between observed herbage yield and predicted herbage yield. MAE is the mean of the absolute difference between observed herbage yield and predicted herbage yield and mean percentage error is the mean of the error percentage ((|observed herbage yield–predicted herbage yield|/observed herbage yield) × 100).

3. Results

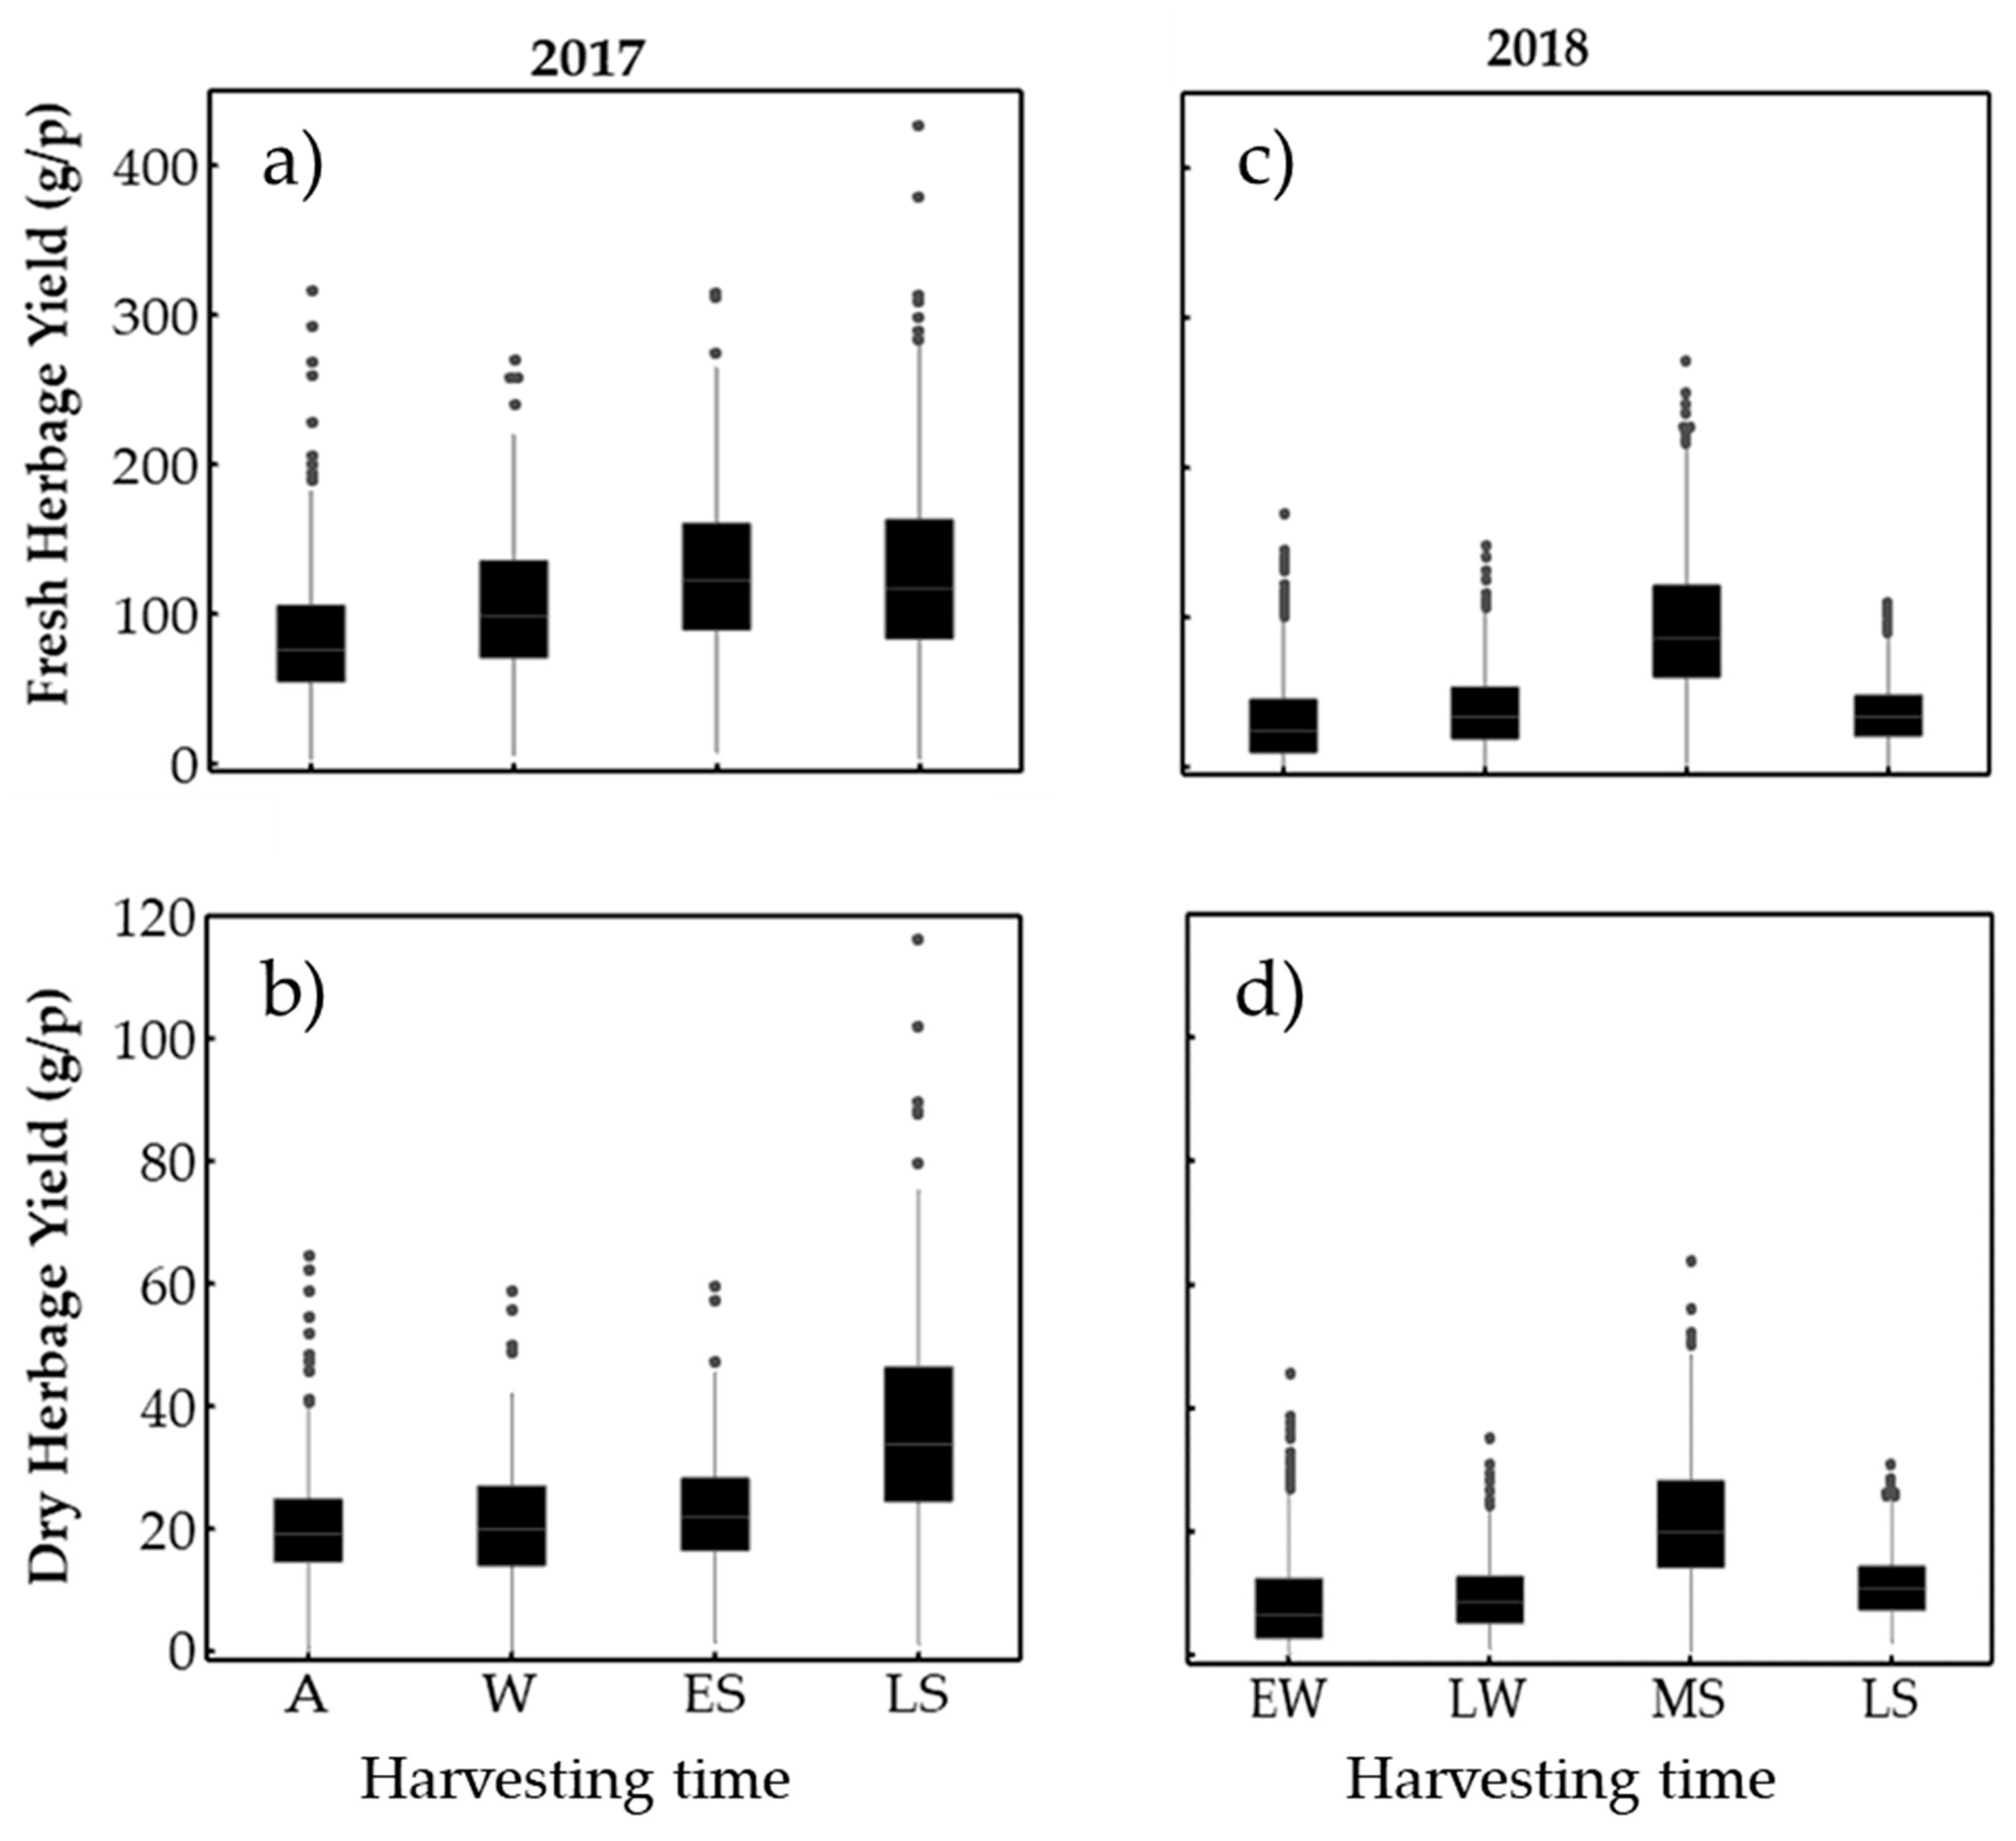
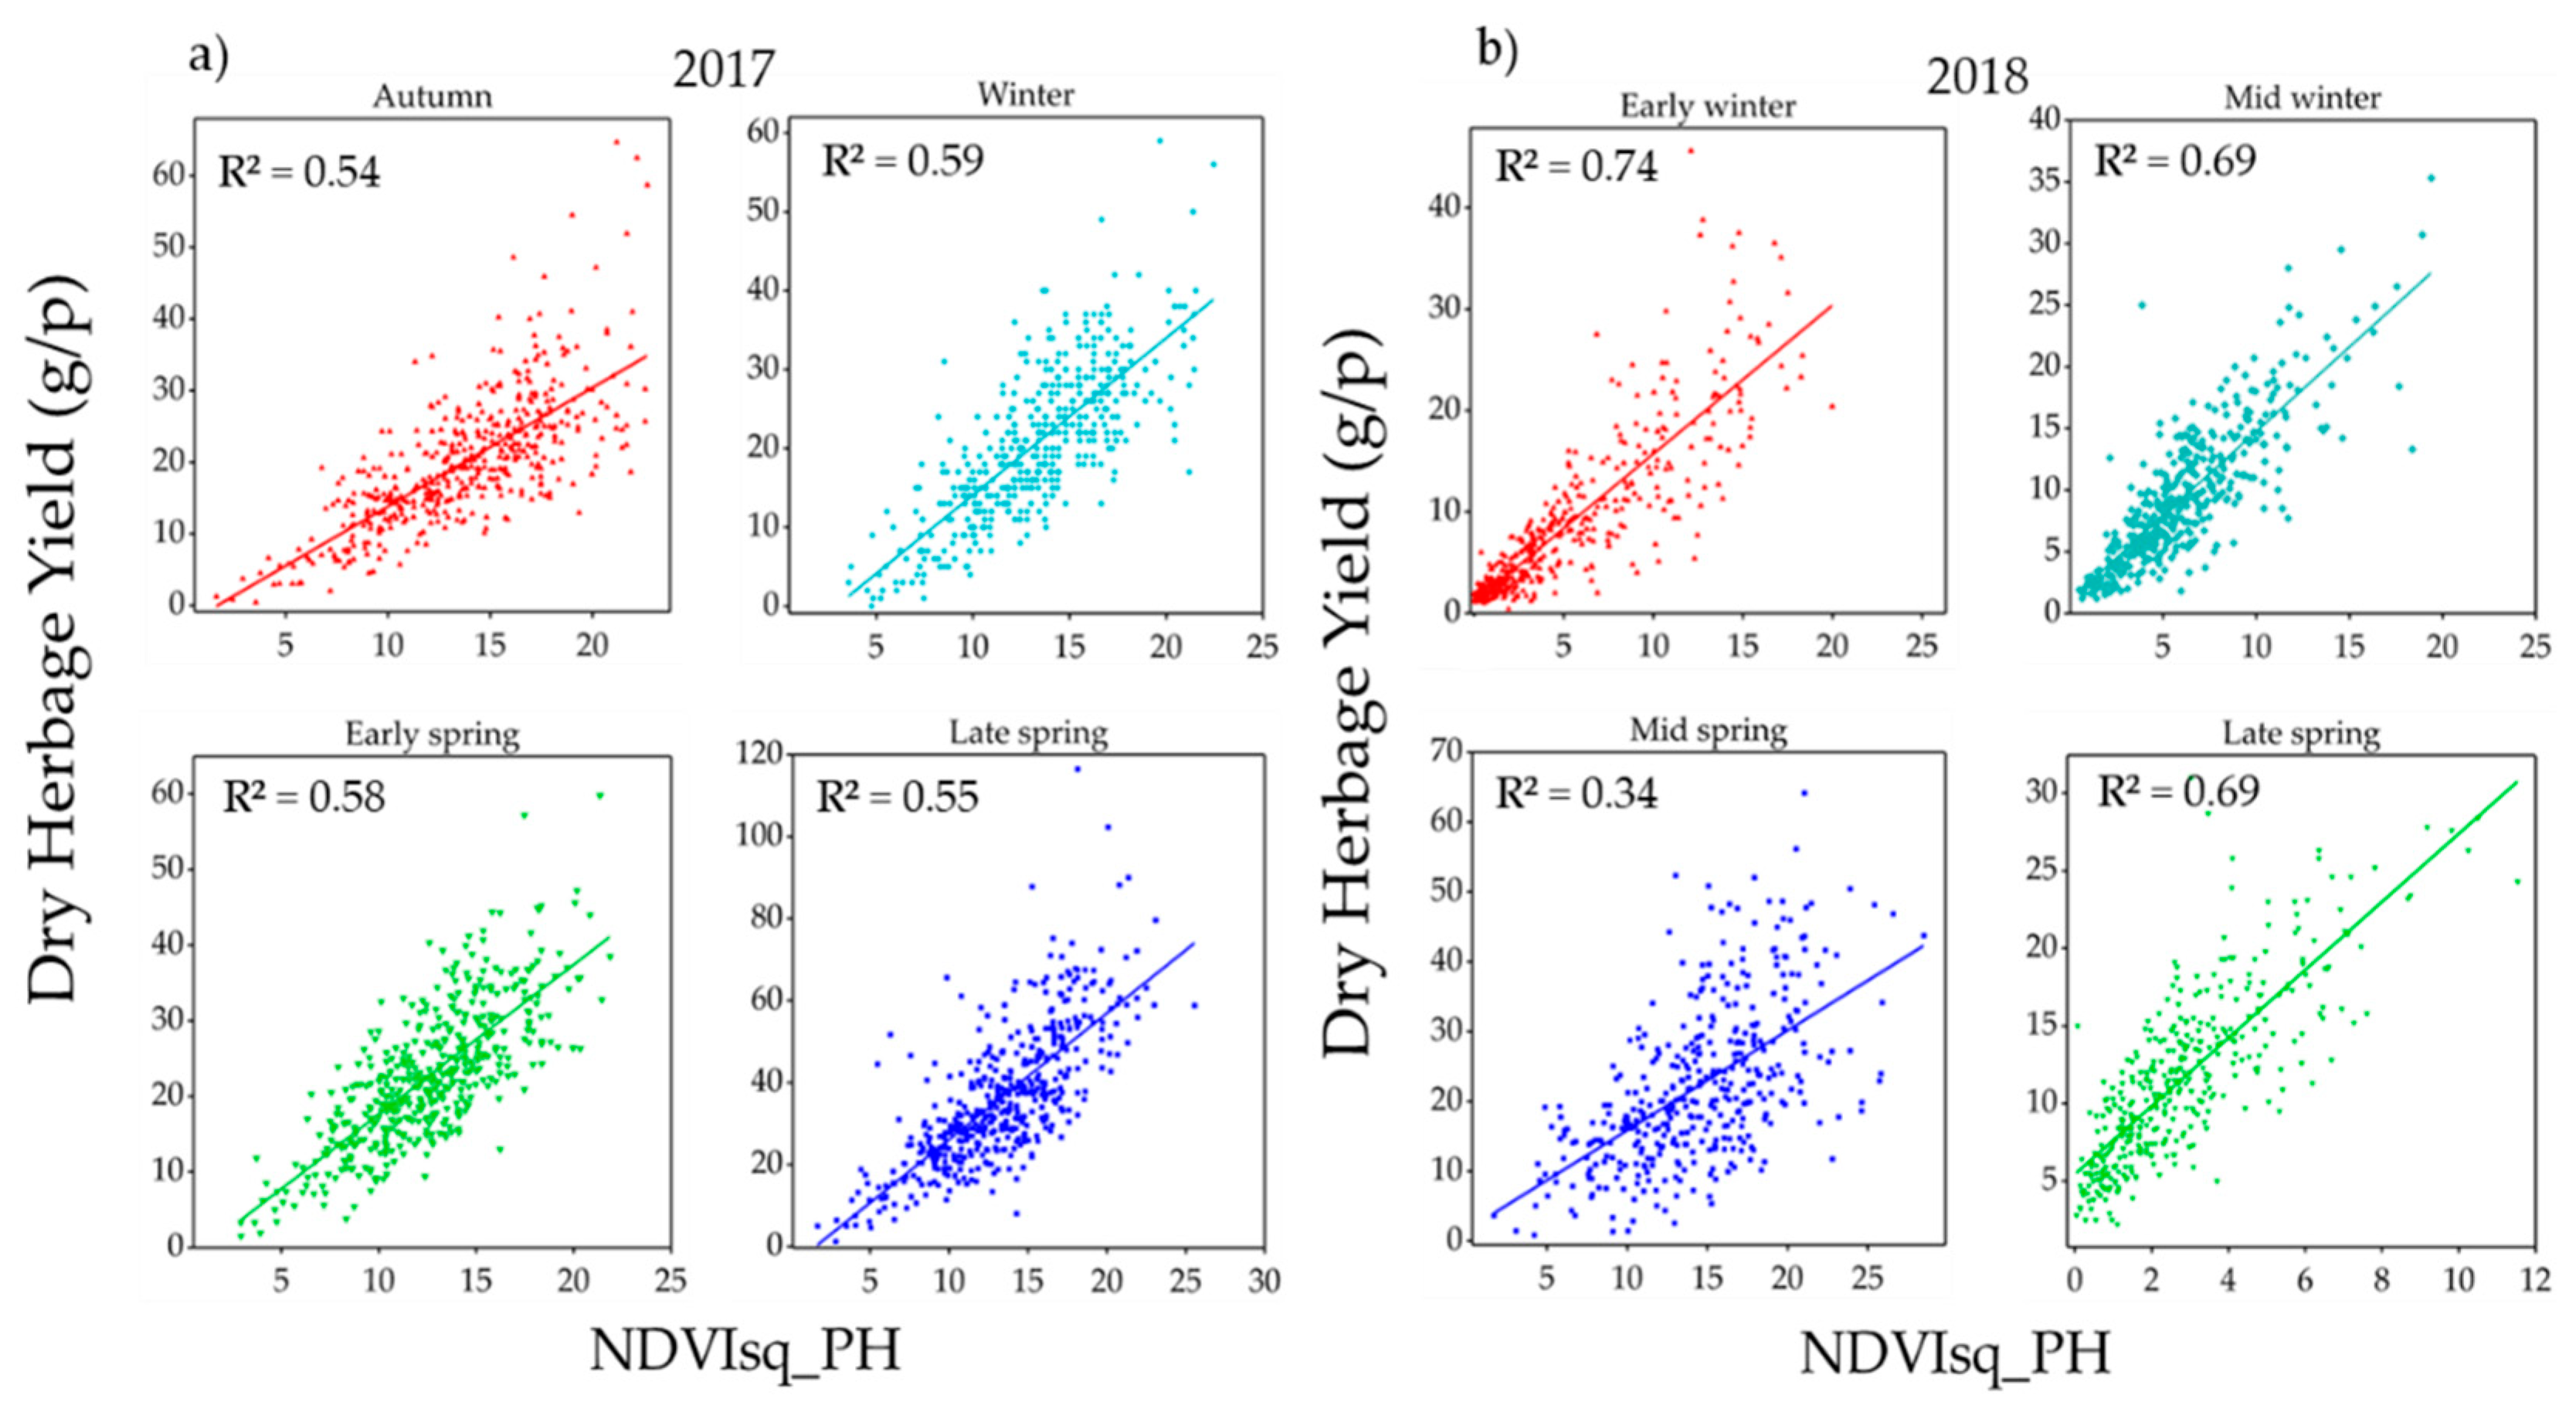
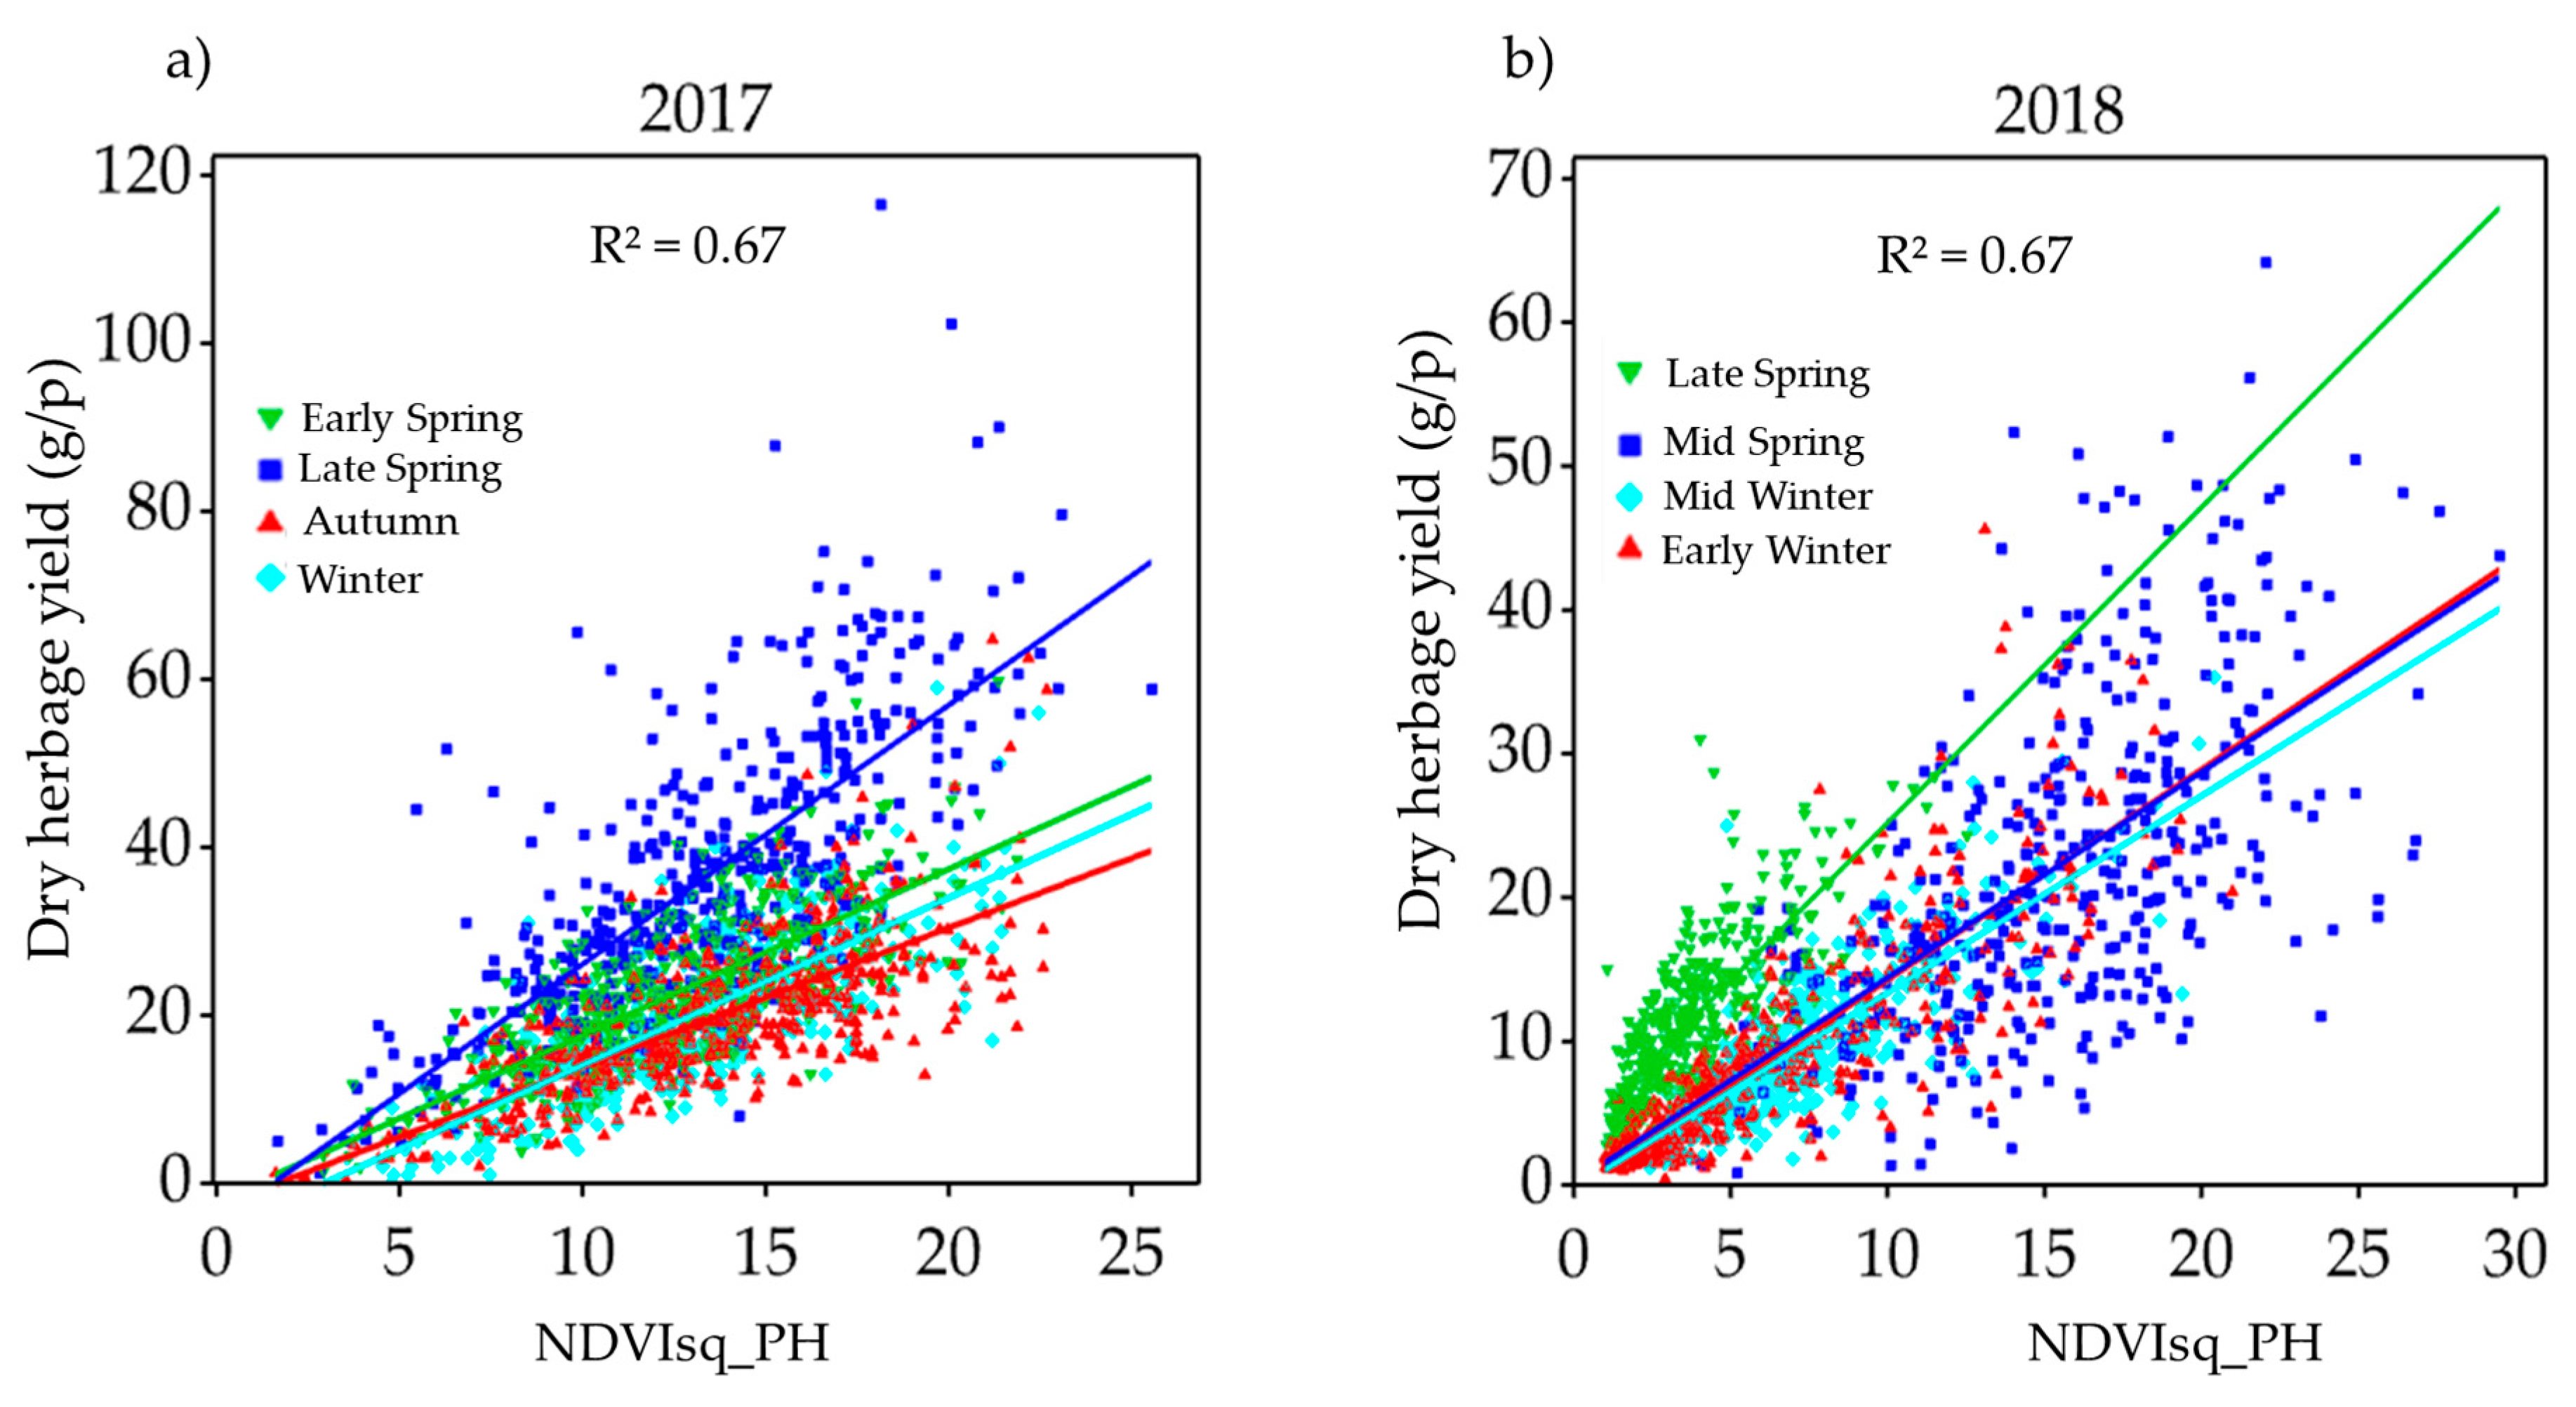
3.1. Seasonal Herbage Yield Variation

Figure 4 shows a box mean of measured FHY and DHY of individual plants across four seasons of 2017 and 2018. The FHY value per plant (82.48–127.18 g) varied across seasons in 2017 and (32.80–96.50 g) in 2018. Similarly, the DHY value per plant varies (20.04–36.24 g) in 2017 and (9–22.29 g) in 2018. Moreover, measured seasonal FHY and DHY of the years 2017 and 2018 indicated a wide variability of biomass values (~1.41–428 g) for each measurement season for the individual plants. This suggests that herbage yield had enough variation to use to correlate the NDVI and plant height from ultrasonic sonar sensors.

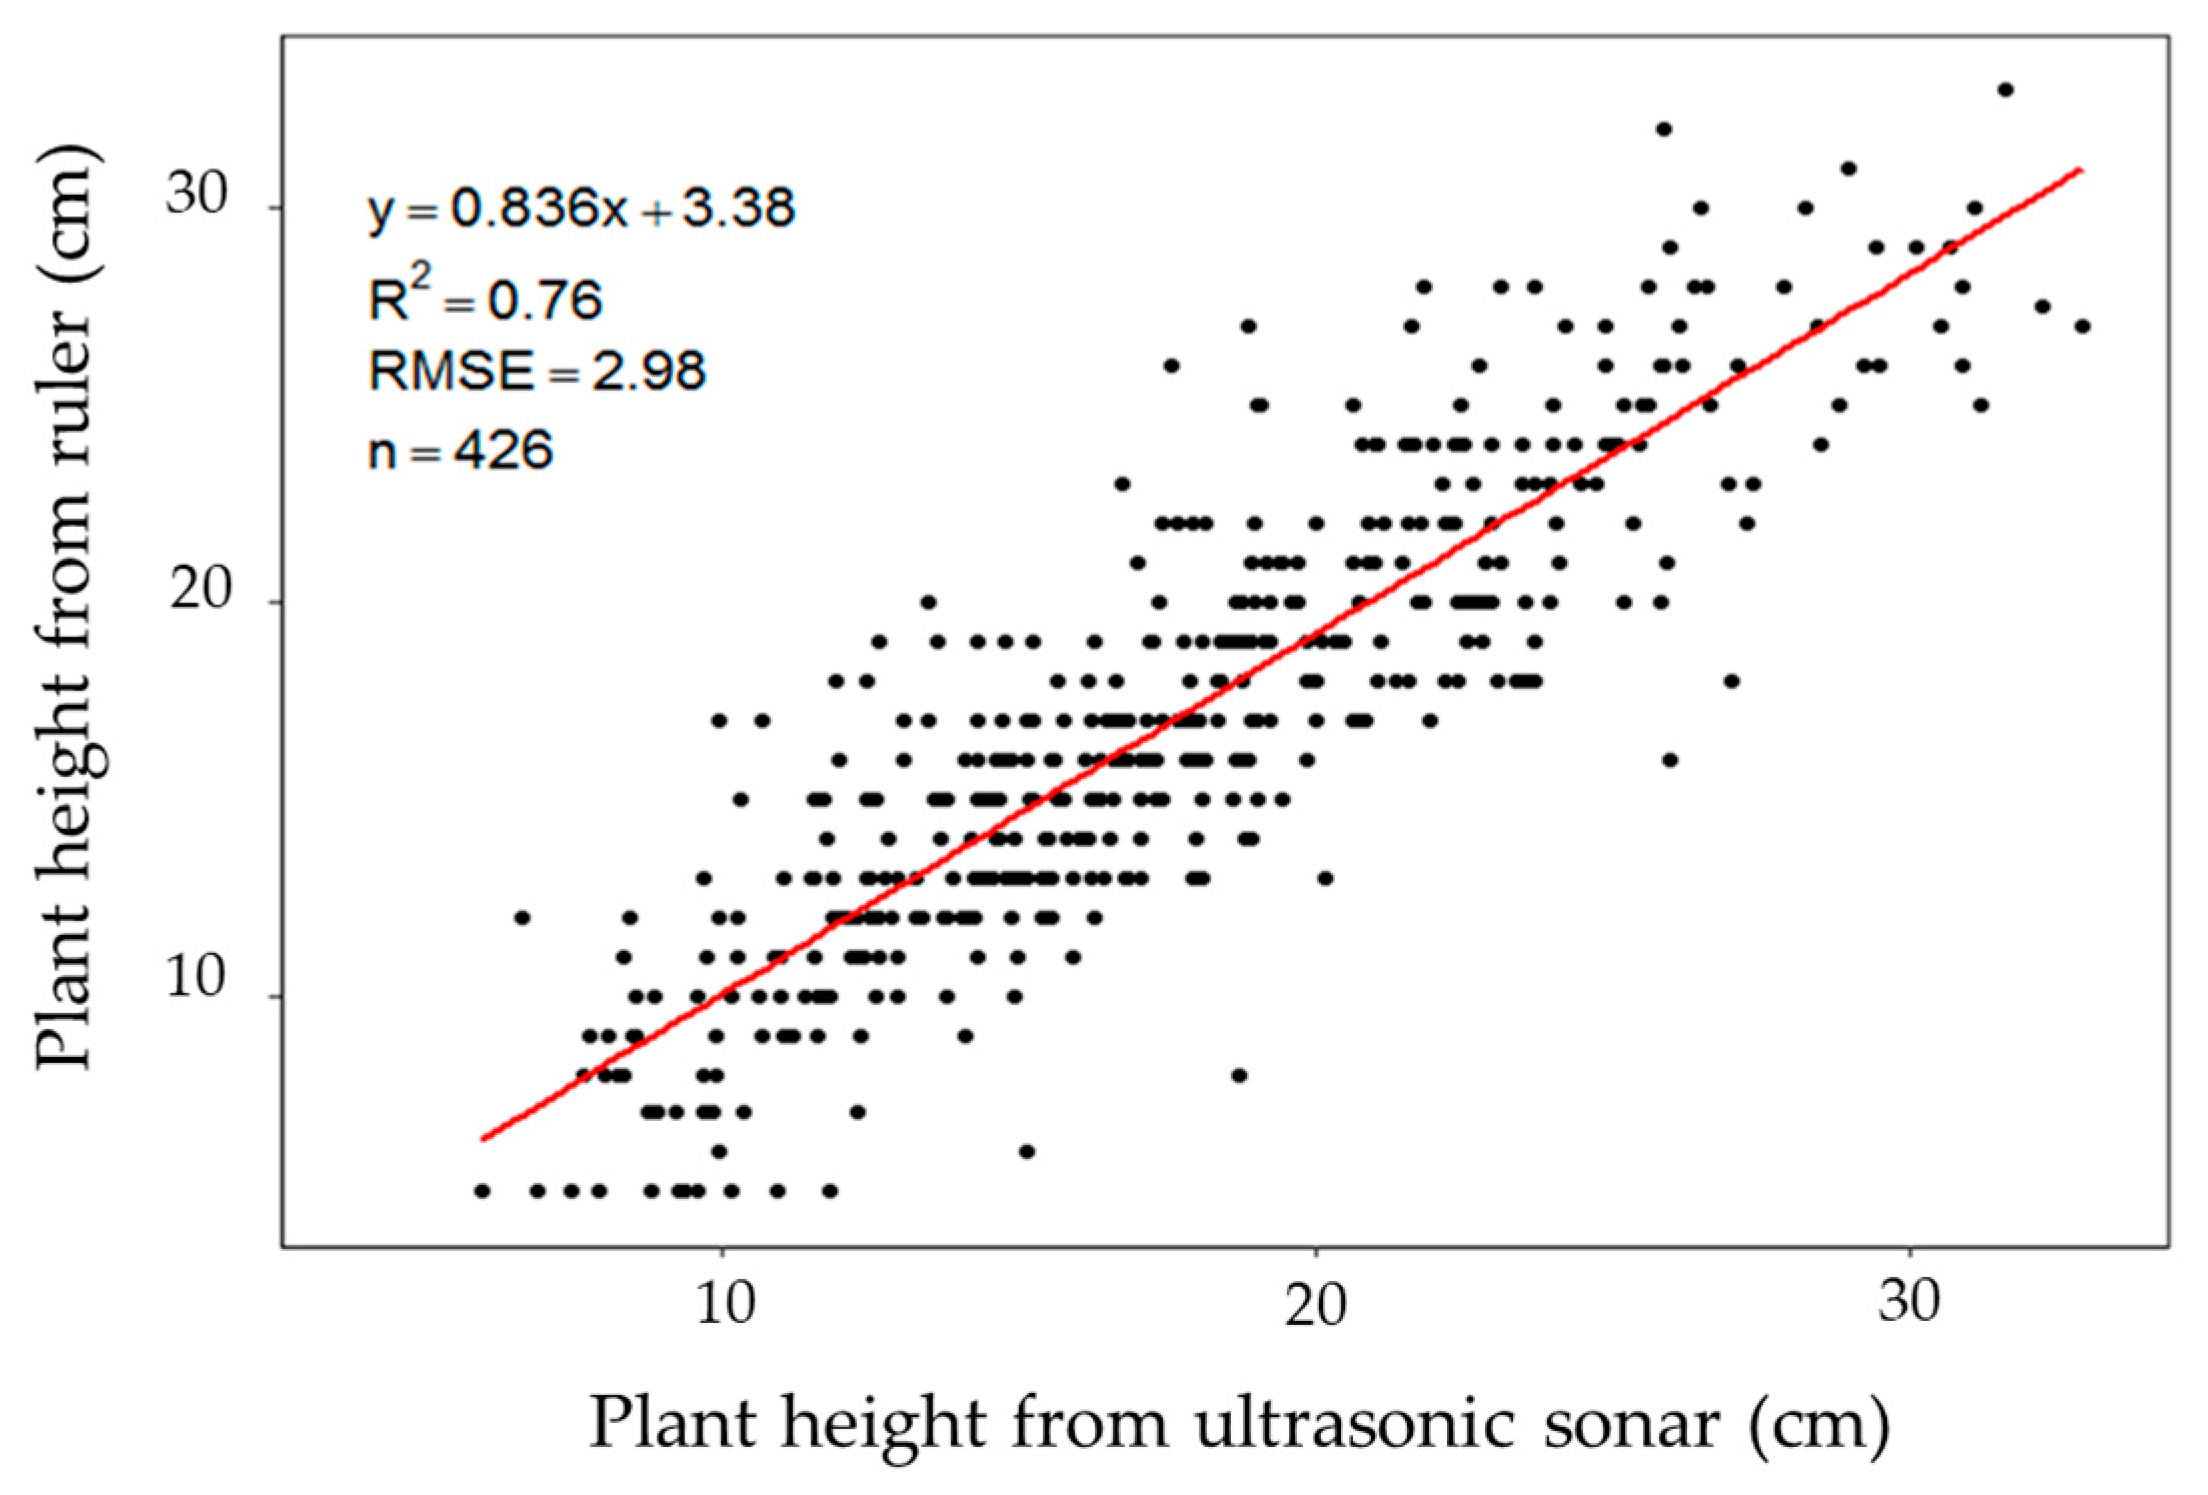
3.2. Correlation between Manual and Sonar Plant Height

A strong correlation (R2 = 0.76) was observed between manual and ultrasonic sonar plant height (Figure 5). Plant height measurement using ultrasonic sonar slightly overestimated height, mainly when plants are small, which may result from the uneven surface of the measured field trial. The slope of the regression line was close to one, and the RMSE was 2.98 cm, and this implies that the use of ultrasonic sonar is useful to estimate plant heights of space-planted perennial ryegrass single plants.

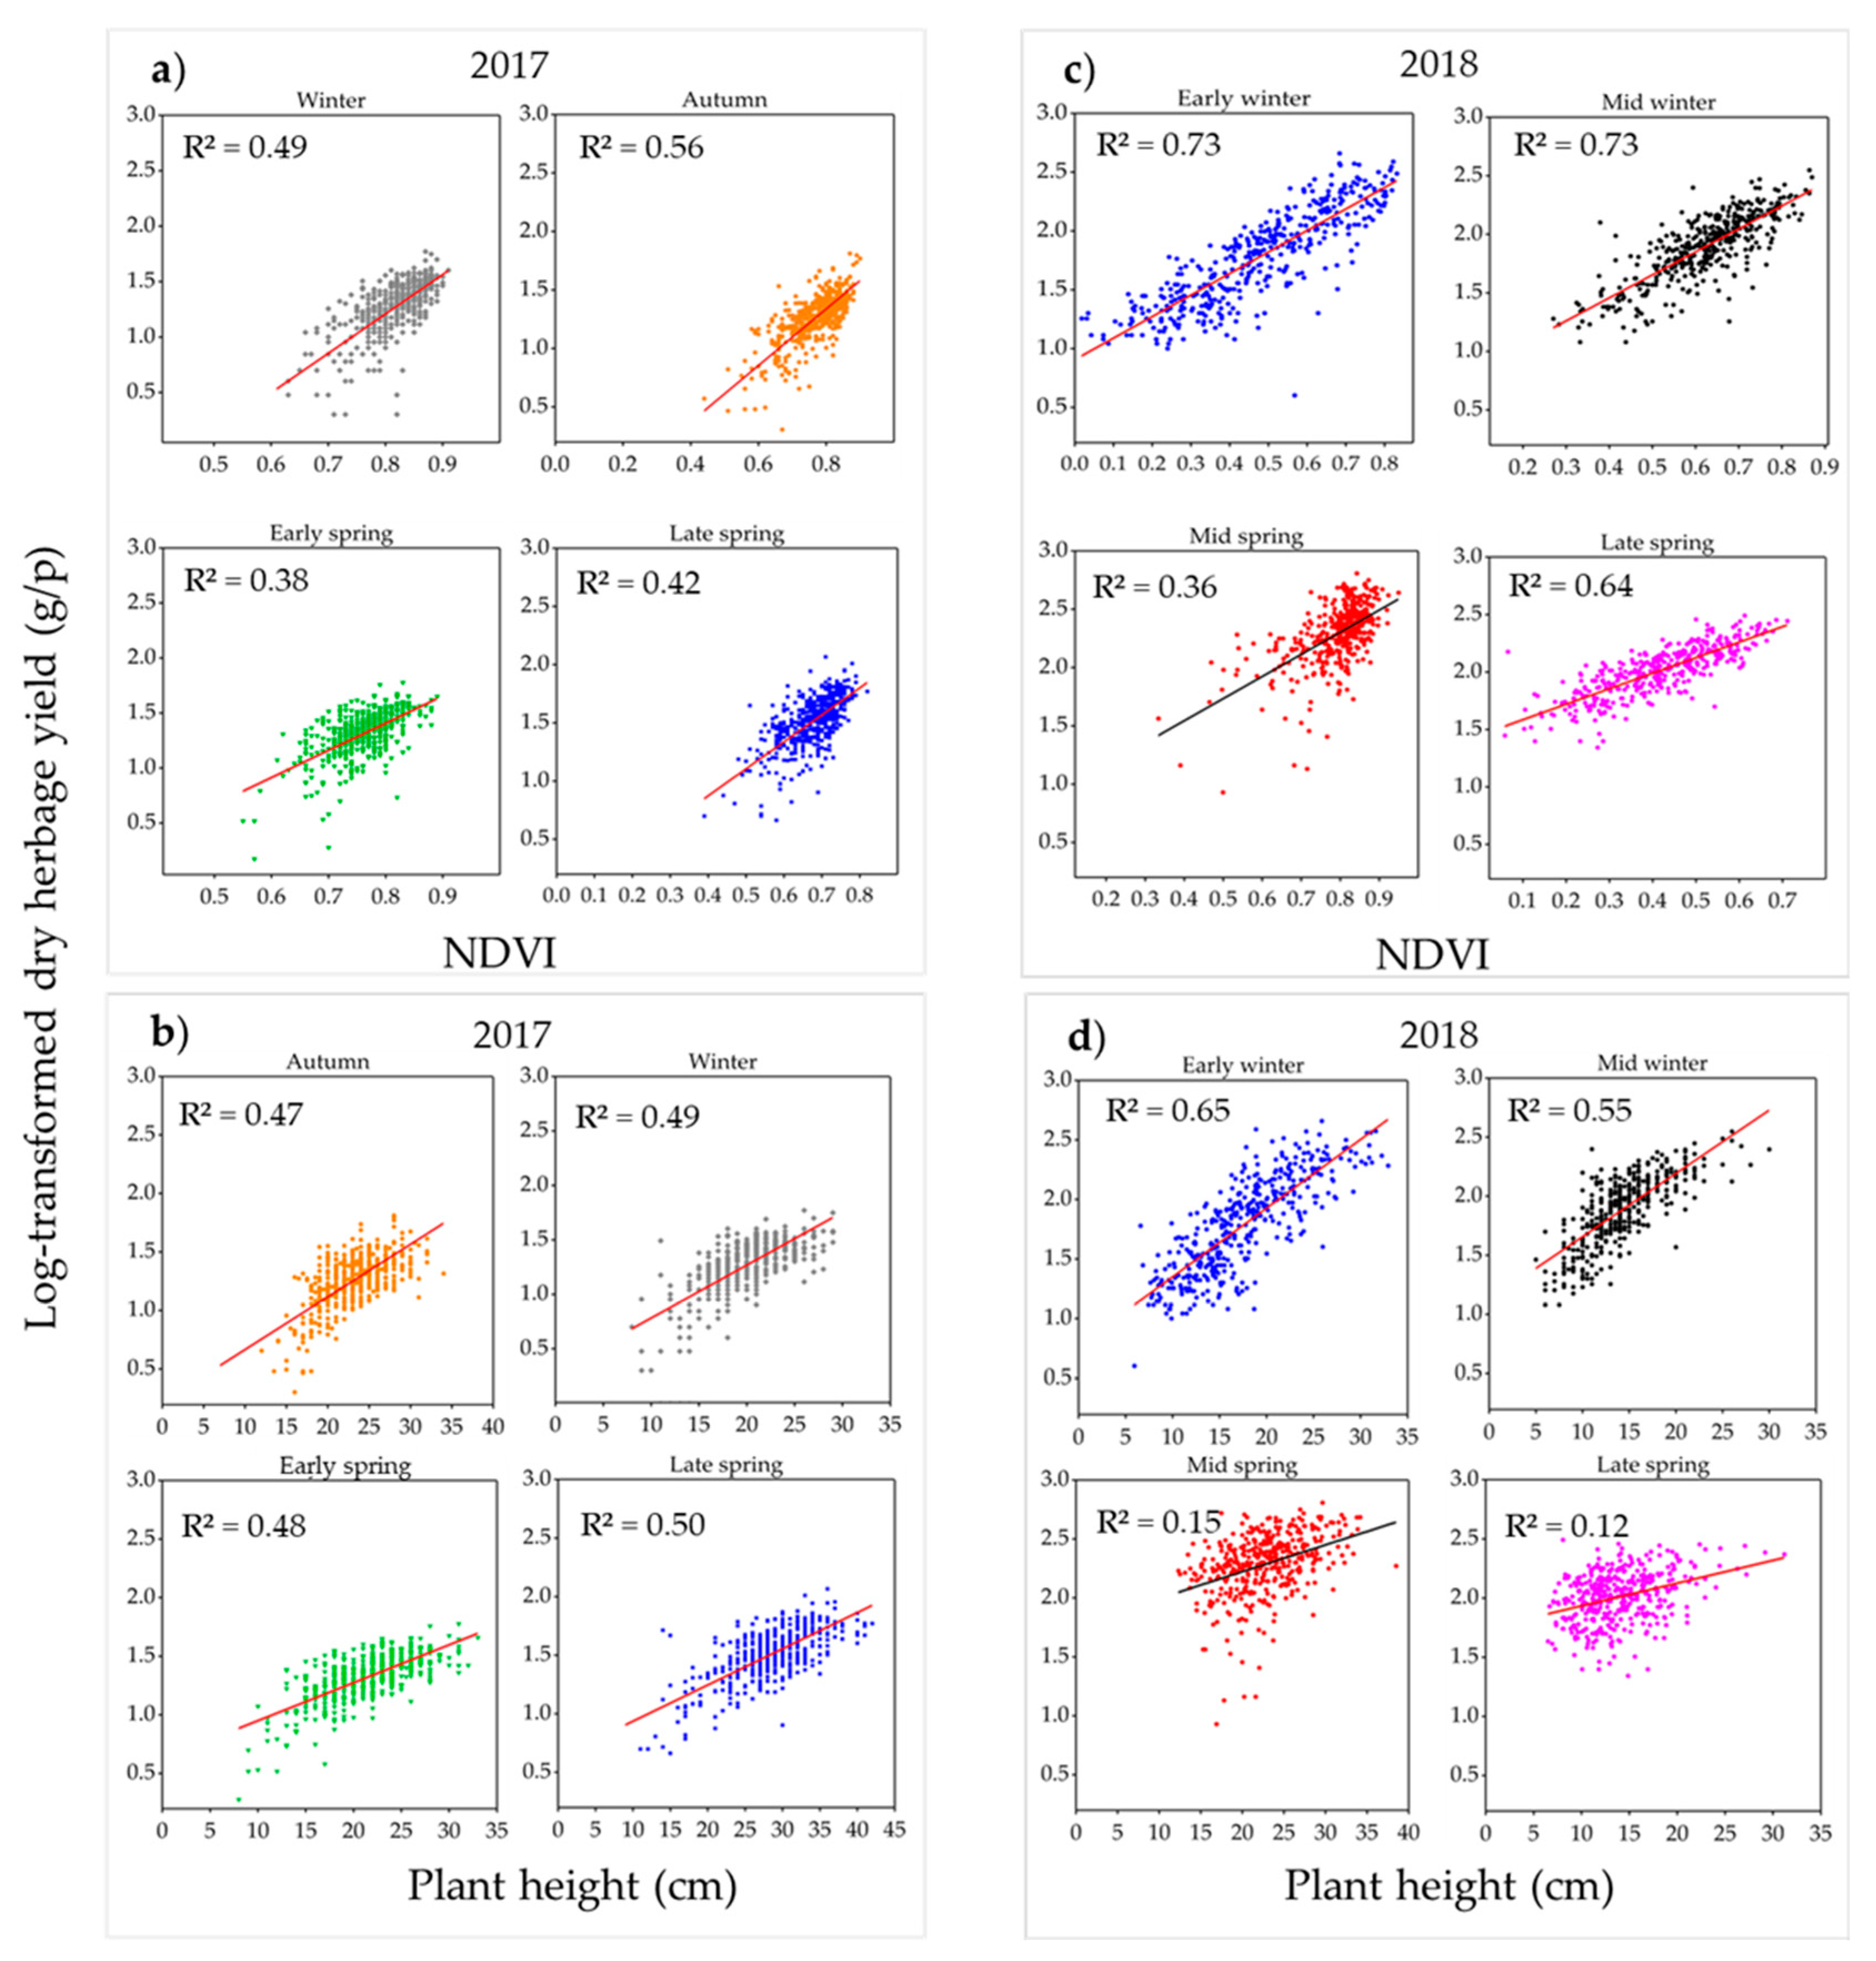
3.3. Individual Plant Herbage Yield Model Evaluation

The R2 for linear regression models of log-transformed DHY estimation from NDVI ranges between 0.35 and 0.73 (Figure 6a,c). The variation in accuracy of seasonal HY estimation indicates that NDVI as an estimator can be limited by saturation at high seasonal HY accumulation. A linear relation between DHY and plant height showed variable R2, which was between 0.15 and 0.65 (Figure 6b,d). Lower estimation accuracy of the mid and late-spring of 2018 (R2 = 0.12–0.15).
Figure 7a,b showed seasonal linear regression models of DHY estimation from NDVIsq_PH that improved the R2 averagely with up to 10% in 2017 and 24% in 2018 compared to plant height and NDVI alone. Looking at the combined seasonal estimation models, yearly estimation values of DHY from NDVIsq_PH were consistent with the individual season models (R2 = 0.67) (Figure 8a,b), indicating the possibility of applying the global model of HY estimation instead of specific (seasonal) models.

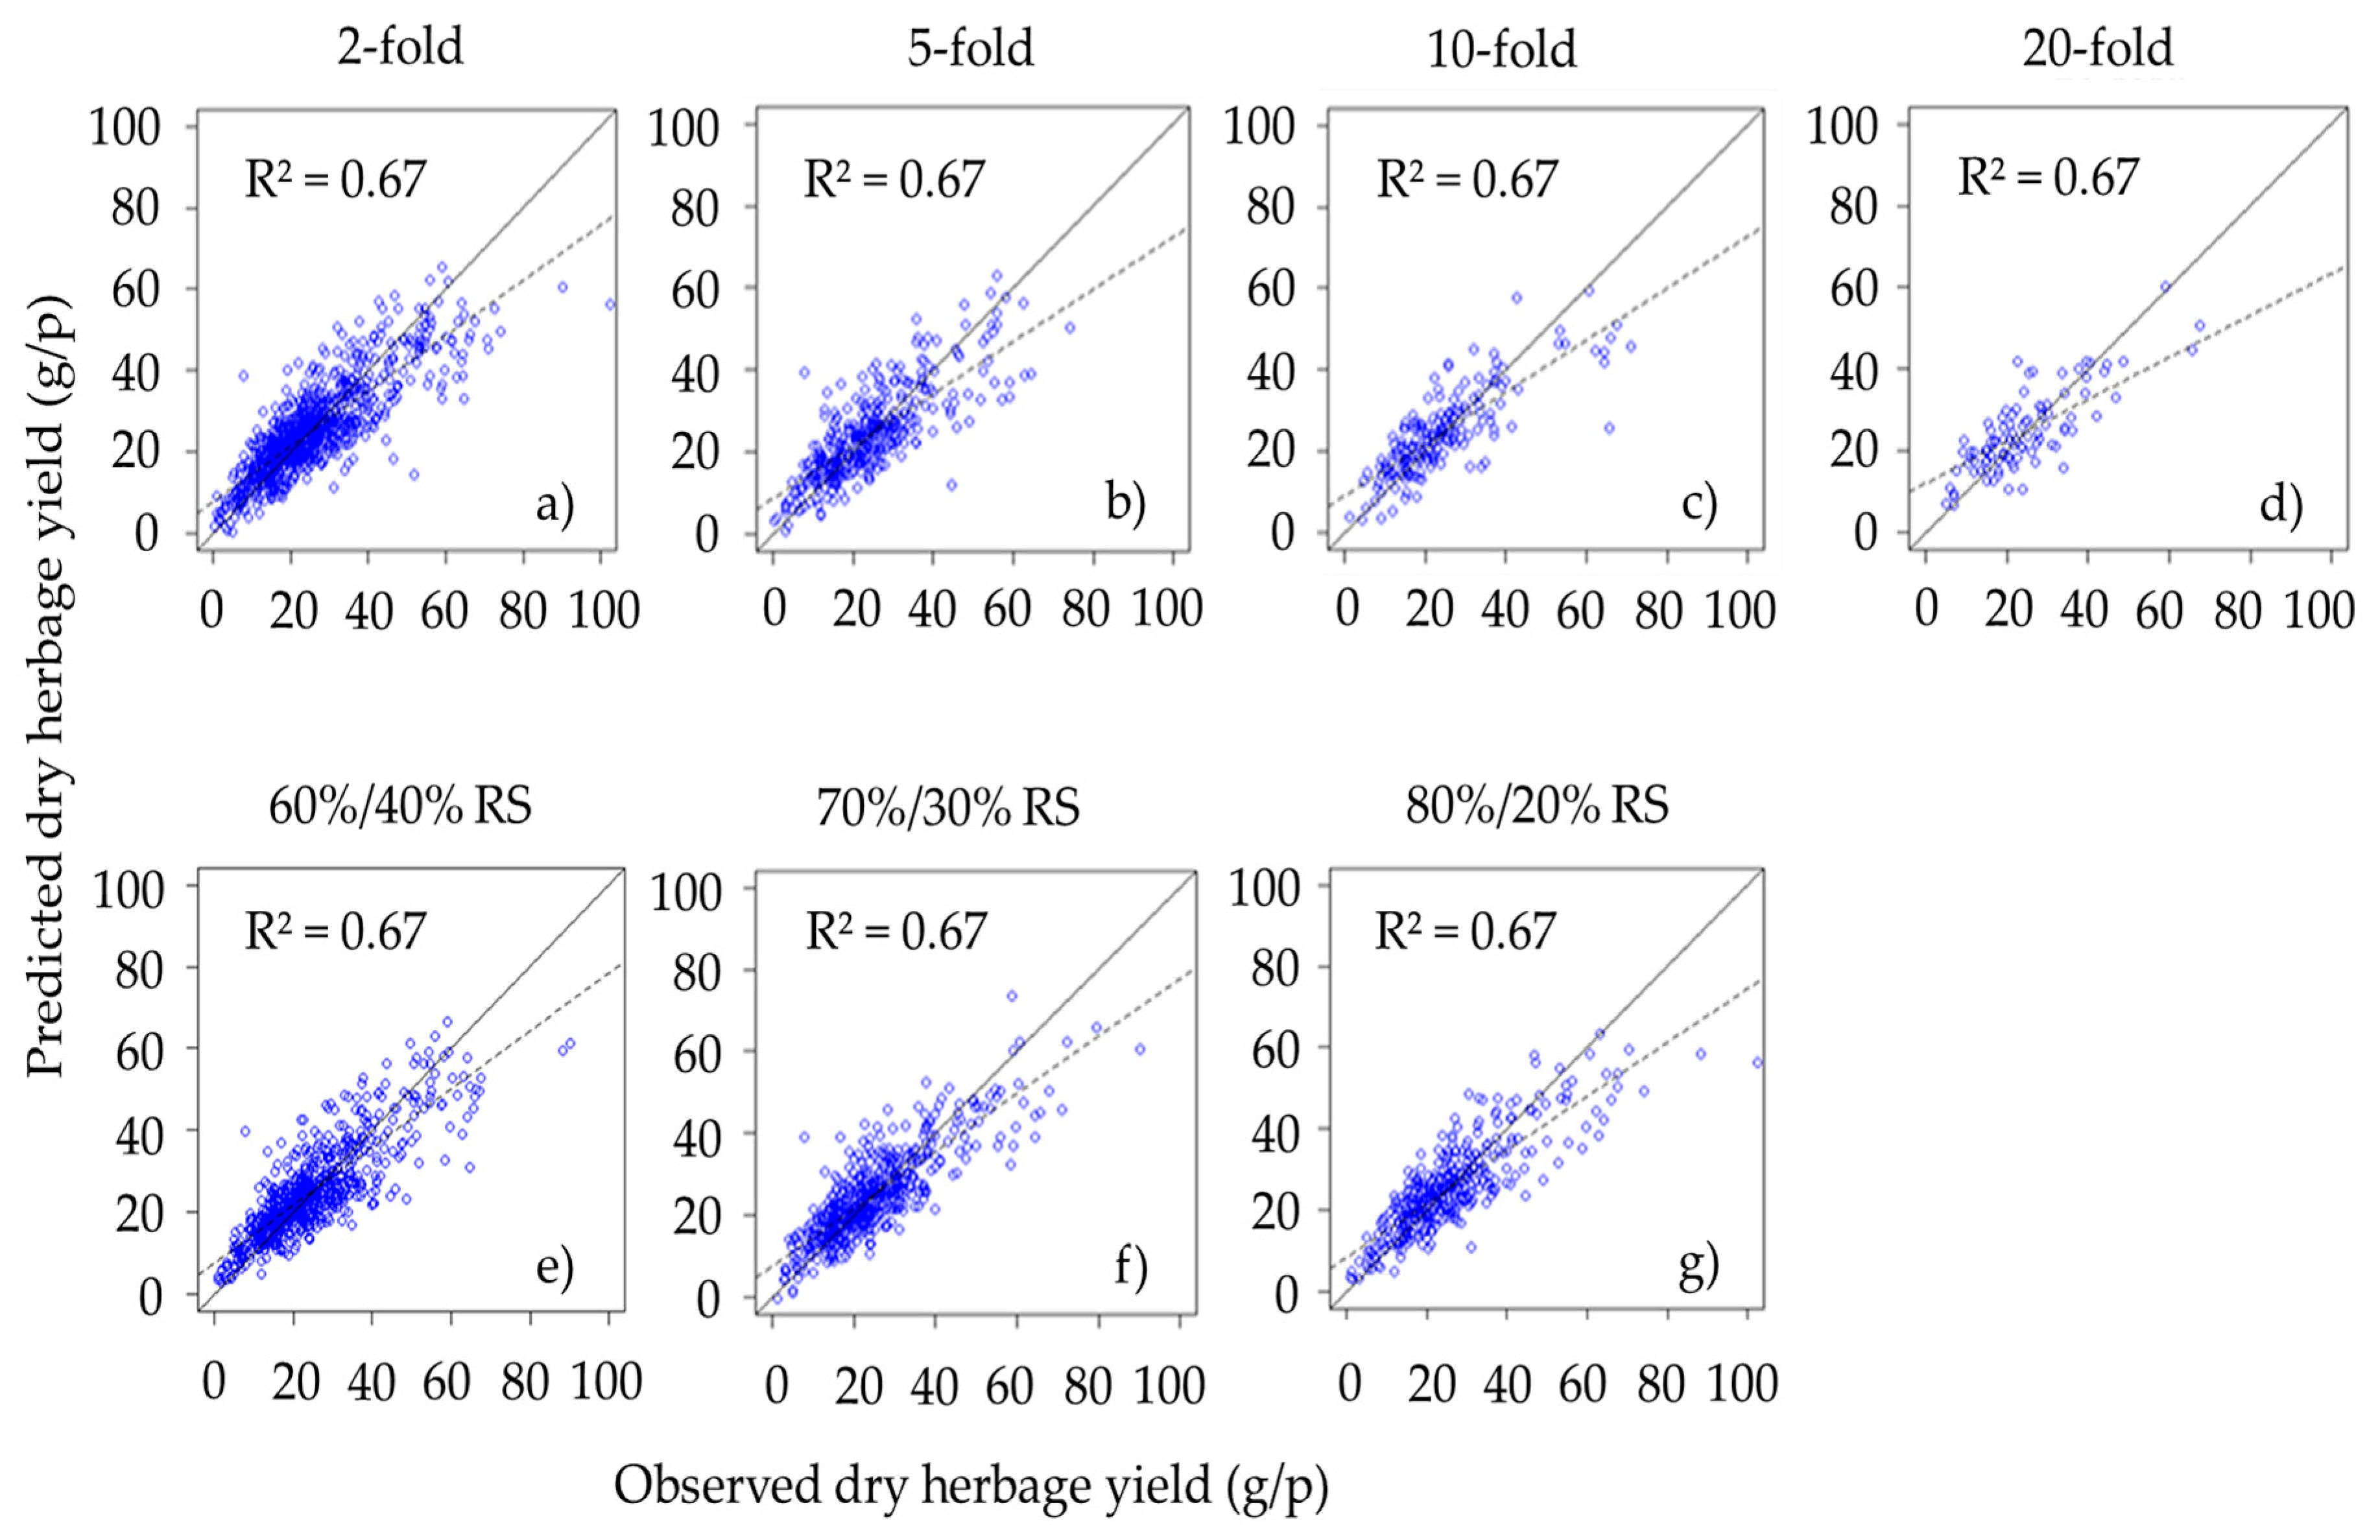
3.4. Herbage Yield Prediction

Table 3 and Table 4 show the details of cross-validations (CVs) of multiple linear regression models to estimate FHY and DHY yield, respectively. Looking at Table 3, K-fold CV at K = 2, 5, 10 and 20 indicated a similar level of estimation accuracies across the 2017 and 2018 datasets. The R2 values from the K-fold CV of the 2017 dataset remain similar to that of 2018 (0.63–0.64 vs. 0.69–0.70). However, the RMSE and MAE values from the K-fold CV of the 2017 dataset were higher than those of 2018. The MPE% of 2018 K-fold CV was higher than that of 2017. Similarly, random splits of the yearly dataset into 10,000 simulated repetitions of 60%/40%, 70%/30%, and 80%/20% indicated similar R2 values (0.64–0.69) like the K-fold CV in both experimental years. The RMSE and MAE values of the 10,000 random splits were similar to the K-fold within the year but significantly higher in 2017 than 2018.
In the DHY estimation, K-fold and random split CV showed relatively similar accuracy for the R2 values (0.66–0.67) of the 2017 and 2018. The RMSE, MAE, and MPE values from the K-fold and random split CV were in the range of 7.53–7.60 g, ~5.44 g and ~22%, respectively, for the 2017 dataset (Table 4). This indicated K-fold CV (at different values of K) and the and 10,000 simulated random splits of 60%/40%, 70%/30% and 80%/20% showed no sign of variation in these values irrespective of the sample size. Similarly, RMSE, MAE, and MPE values of the 2018 dataset were 5.44–5.52 g, 3.59–3.67 g and ~28%, respectively. The RMSE and MAE of the CV values were generally smaller in 2018 than the 2017 dataset, whereas the MPE was reverse.
The scatterplot in Figure 9 shows an example of the graphic representation of observed vs. the predicted DHY. The DHY validation shows the data points generally closer and slightly deviated from the 1:1 line, indicating DHY prediction methods may be used to accurately estimate HY of individual ryegrass plants.

4. Discussion

Current, HY phenotyping is time-consuming and relies mainly on visual scoring. HTP platforms that would improve the speed and accuracy of HY phenotyping have, so far, only been applied at the plot level [20,29], and no one has conducted phenotyping at the individual plant level except on trees [38,39,40]. Various sensor-based assessments of phenotyping at the individual plant level is required to implement molecular breeding techniques, like GS. However, the implementation of GS implies cross-validation on the evaluation of the genetic and phenotypic breeding values of individuals for accurate selection of superior genotypes [41,42]. GS, in perennial ryegrass, has currently followed the trend of evaluating the HY of sward plots of cultivars and breeding lines [43,44]. The phenotypic selection at individual plants level is required to explore the full potential of GS programs. Sensor-based phenotyping technologies offer a non-destructive, high-throughput and efficient assessment of HY replacing current inefficient phenotyping methods [5]. In this study, we explained the potentials of sensor-based HTP technologies to estimate FHY and DHY through the development and cross-validation of various prediction models.
The seasonal HY distribution in the 2017 and 2018 showed that HY from the 2017 harvest dates was higher compared to 2018 in all seasons. The notable decline in dry matter yield as the year progressed may result from the drought stress and repetitive cutting [45].
Plant height can be obtained using manual and ultrasonic sonar-based measurements [26,27,28,46]. Automation of plant height measurements using sensors offers an excellent advantage for assessing large breeding populations rapidly and objectively [5]. A high correlation was observed between plant height from a standard ruler and an ultrasonic sonar sensor. Similar results of R2 (0.56–0.7) from UAS-derived grassland height and RMSE of 3.50 cm from LiDAR-derived wheat height were reported. However, other reports achieved higher R2 (0.90–0.98) applying ground-based LiDAR on wheat and cotton, aerial based-RGB (R2 = 0.87–0.98) on barley [23,24] and ground-based sonar sensors (R2 = 0.86) on cotton [47]. Most of these studies conducted at the plot level were of the canopy structure of plants growing as a sward plot and may be different from space-planted single plants.
The correlation between log-transformed seasonal DHY vs. NDVI of individual ryegrass plants was moderate, with R2 ranging between 0.36 and 0.73 across seasons. The significant variations of R2 (up to 37%) of estimation accuracies occur among the seasons; mainly, it could result from the effect of saturation at the late growth stage [19]. In previous sward studies, similar R2 values (0.38–0.56) of NDVI vs. DHY were reported in alfalfa, Bermuda grass and tall fescue [12,28,48]. However, R2 values in these studies were slightly lower compared to studies on grain crops, including wheat, barley, and maize [49,50,51]. This could be related to the vigour of canopy growth habit difference between forage and grain crops, where NDVI could be influenced [52].
Plant height is another widely used structural and physical parameter used to estimate the biomass of various crops [20,23,53,54]. Previous studies on grasslands indicated moderate to high correlation (R2 = 0.59–0.81) on predicting dry herbage yield from plant height measurements [45]. In the current study, the R2 of plant height vs. log-transformed DHY was more variable (R2 = 0.12–0.65) than NDVI across seasons. Moreover, correlations were slightly lower compared to previous results in the literature [13,55]. Specifically, lower accuracies were obtained from the spring 2018 experiments due to early flower initiation from drought stresses. In this study, we believe the surface of these small plants may have reflected weak sound echoes, which made it difficult for the ultrasonic sonar to detect accurate distance from the top canopy of the plant. Furthermore, when the plant canopy is a mixture of leaves and sparse reproductive tillers there is a greater variability in height and the surface that interacts with the sensor. Similar results of low accuracies were reported to detect thin spikes of wheat at the time of maturity compared to clustered young leaves [26].
The NDVI values explain the spectral properties of the plant canopy, whereas plant height is related to the vertical structure and growth rate of a plant [53,56]. Combining the physical and spectral parameters was successful in grasping spectral and structural information and improved the regression estimation of aboveground biomass [20]. The results show combining NDVI and plant height (NDVIsq_PH) data exhibited up to 10–24% improvement in prediction accuracy of DHY than using either NDVI or plant height alone. Schaefer and Lamb [12] investigated the combination of NDVI and LiDAR plant height to improve the estimation accuracy of tall fescue HY by up to 20%. However, this study made on single measurement experiment without looking at combined information of changes in plant performance for multiple growing seasons.
The validation of the model performance of observed vs. predicted values of FHY and DHY showed similar accuracies across all the K-fold (k = 2, 5, 10, and 20) and random split (60/40%, 70/30% and 80/20%) with R2 = 0.63–0.70 across the two seasons dataset. We excluded FHY results in some of our results since data points deviated similarly from the 1:1 line, indicating that either FHY or DHY prediction methods will be enough to estimate HY of individual ryegrass plants. However, FHY results were included in the cross-validation results to match up with some of the results of the whole GSS result with only FHY datasets. Our cross-validation results were consistent with the results of [15], who applied random split CV to estimate fresh and dry biomass of barley from the fusion of NDVI and plant height. The authors obtained (R2 = 0.67–0.79) from linear regression. The R2, RMSE, MAE and MPE of yearly regression models performed similarly irrespective of the CV type used, suggesting that models developed are stable and reliable across all K-fold and 10,000 repetitive random splits. However, regression models from previous studies showed variability in model performance at different random split [15,23,24]. The reason for this was, a small number of samples (n = 48–194) were used in these studies, and experiments were performed with not more than three harvests compared to the current study (n = 1626–1900) with a total of eight seasonal harvests in two years. Several other studies indicated combined VIs (other than NDVI) and plant height performed better for biomass estimation than VIs alone [13,15,20,57].
In the current study, year-for-year RMSE, MAE and MPE values of the CV showed variations in values. For instance, the RMSE and MAE values of the 2017 dataset were more significantly higher than the 2018 dataset, suggesting the plants from the 2017 harvest dates were larger with larger FHY and DHY values. It was impossible to compare the RMSE and MAE values from our results with the literature as there is no work done on single plants in the previous research where works focused on measurements of kg per plot or in a given area (square metre/hectare). Contrary to the RMSE and MAE, the MPE values from the 2017 dataset were slightly smaller compared to the 2018 dataset.
We found a high correlation by combining NDVI and plant height to predict DHY of individual ryegrass plants at the 2–3 leaf growth stage. This was proved by cross-validation using multiple linear regression model, and we still need to apply more non-linear regression methods that include machine learning techniques with more datasets from larger study samples may improve the prediction models further and be able to rank genotypes non-destructively and objectively.

5. Conclusions

This study is the first to integrate various sensors on aerial and ground-based phenotyping platforms that implement combining spectral and structural information to estimate HY of space-planted perennial ryegrass in the context of the large-scale breeding program. The results of this study demonstrate that the best prediction of DHY of space-planted perennial ryegrass single plants come from the multiplicative combination of NDVI and Plant height (NDVIsq_PH). The K-fold and random split CV findings imply that the combination of NDVI and plant height improved prediction accuracy over the use of NDVI and plant height alone. This yielded an accuracy of the coefficient determinations of HY estimation more than 0.63 and RMSE for FHY, and DHY was less than 33 g/plant and 8 g/plant, respectively. The application of various K-fold and random split methods do not change the prediction accuracy. We propose this non-destructive and rapid HY phenotyping technique to replace the current slow and time-consuming HY yield phenotyping methods. Therefore, this method can be assessed for effective estimation of thousands of individual plants and develop prediction equations that can be used for phenotypic ranking of genotypes for HY.

Author Contributions

P.B., J.W., K.S. and G.S. conceived the experiment. A.G. performed the experiment. A.G. and P.B. organised and processed the PhenoRover system and UAS data. K.G. and A.G. developed the R-programmed script and finalised the data analysis. A.G. wrote the paper. P.B., J.W. and K.S. contributed to the overall experimental design and supervision. All authors assisted in editing and improving the paper.

Funding

This research was funded by Agriculture Victoria and Dairy Australia through the DairyBio initiative and The University of Melbourne.

Acknowledgments

We acknowledge the plant molecular breeding staff of Hamilton Centre (Agriculture Victoria Research, AVR) for managing the field experiments. The authors would like to thank Andrew Phelan and Carly Elliott for doing all the flights and some of the PiX4D data processing. The authors would also like to thank Daren Pickett, Russel Elton, Daren Kean, Greg Mason, Chinthaka Jayasinghe and Chaya Smith for their contribution to manual harvesting of samples. We would also like to acknowledge Senani Karunaratne of AVR (Ellinbank Centre) for his valuable comments on the data analysis section.

Conflicts of Interest

The authors declare no conflict of interest.

References

  1. Foster, J.; Cogan, N. Pasture Molecular Genetic Technologies—Pre-Competitive Facilitated Adoption by Pasture Plant Breeding Companies; Meat & Livestock Australia Limited: Sydney, Australia, 2015. [Google Scholar]
  2. McDonagh, J.; O’Donovan, M.; McEvoy, M.; Gilliland, T.J. Genetic gain in perennial ryegrass (Lolium perenne) varieties 1973 to 2013. Euphytica 2016, 212, 187–199. [Google Scholar] [CrossRef]
  3. Hunt, C.L.; Jones, C.S.; Hickey, M.; Hatier, J.H.B. Estimation in the field of individual perennial ryegrass plant position and dry matter production using a custom-made high-throughput image analysis tool. Crop Sci. 2015, 55, 2910–2917. [Google Scholar] [CrossRef]
  4. Sampoux, J.-P.; Baudouin, P.; Bayle, B.; Béguier, V.; Bourdon, P.; Chosson, J.-F.; Deneufbourg, F.; Galbrun, C.; Ghesquière, M.; Noël, D.; et al. Breeding perennial grasses for forage usage: An experimental assessment of trait changes in diploid perennial ryegrass (Lolium perenne L.) cultivars released in the last four decades. Field Crops Res. 2011, 123, 117–129. [Google Scholar] [CrossRef]
  5. Gebremedhin, A.; Badenhorst, P.E.; Wang, J.; Spangenberg, G.C.; Smith, K.F. Prospects for measurement of dry matter yield in forage breeding programs using sensor technologies. Agronomy 2019, 9, 65. [Google Scholar] [CrossRef]
  6. Haghighattalab, A.; González Pérez, L.; Mondal, S.; Singh, D.; Schinstock, D.; Rutkoski, J.; Ortiz-Monasterio, I.; Singh, R.P.; Goodin, D.; Poland, J. Application of unmanned aerial systems for high throughput phenotyping of large wheat breeding nurseries. Plant Methods 2016, 12, 35. [Google Scholar] [CrossRef] [PubMed]
  7. Crain, J.; Mondal, S.; Rutkoski, J.; Singh, R.P.; Poland, J. Combining high-throughput phenotyping and genomic information to increase prediction and selection accuracy in wheat breeding. Plant Genome 2018, 11. [Google Scholar] [CrossRef] [PubMed]
  8. Tanger, P.; Klassen, S.; Mojica, J.P.; Lovell, J.T.; Moyers, B.T.; Baraoidan, M.; Naredo, M.E.B.; McNally, K.L.; Poland, J.; Bush, D.R.; et al. Field-based high throughput phenotyping rapidly identifies genomic regions controlling yield components in rice. Sci. Rep. 2017, 7, 42839. [Google Scholar] [CrossRef] [Green Version]
  9. Slater, A.T.; Cogan, N.O.I.; Rodoni, B.C.; Daetwyler, H.D.; Hayes, B.J.; Caruana, B.; Badenhorst, P.E.; Spangenberg, G.C.; Forster, J.W. Breeding differently—The digital revolution: High-throughput phenotyping and genotyping. Potato Res. 2017, 60, 337–352. [Google Scholar] [CrossRef]
  10. Michez, A.; Lejeune, P.; Bauwens, S.; Herinaina, A.A.L.; Blaise, Y.; Castro Muñoz, E.; Lebeau, F.; Bindelle, J. Mapping and monitoring of biomass and grazing in pasture with an unmanned aerial system. Remote Sens. 2019, 11, 473. [Google Scholar] [CrossRef]
  11. Insua, J.R.; Utsumi, S.A.; Basso, B. Estimation of spatial and temporal variability of pasture growth and digestibility in grazing rotations coupling unmanned aerial vehicle (UAV) with crop simulation models. PLoS ONE 2019, 14, e0212773. [Google Scholar] [CrossRef]
  12. Schaefer, T.M.; Lamb, W.D. A combination of plant NDVI and LiDAR measurements improve the estimation of pasture biomass in tall fescue (Festuca arundinacea var. Fletcher). Remote Sens. 2016, 8, 109. [Google Scholar] [CrossRef]
  13. Bendig, J.; Yu, K.; Aasen, H.; Bolten, A.; Bennertz, S.; Broscheit, J.; Gnyp, M.L.; Bareth, G. Combining UAV-based plant height from crop surface models, visible, and near infrared vegetation indices for biomass monitoring in barley. Int. J. Appl. Earth Observ. Geoinf. 2015, 39, 79–87. [Google Scholar] [CrossRef]
  14. Thorp, K.R.; Wang, G.; Bronson, K.F.; Badaruddin, M.; Mon, J. Hyperspectral data mining to identify relevant canopy spectral features for estimating durum wheat growth, nitrogen status, and grain yield. Comput. Electron. Agric. 2017, 136, 1–12. [Google Scholar] [CrossRef] [Green Version]
  15. Tilly, N.; Aasen, H.; Bareth, G. Fusion of plant height and vegetation indices for the estimation of barley biomass. Remote Sens. 2015, 7, 11449–11480. [Google Scholar] [CrossRef]
  16. Cabrera-Bosquet, L.; Molero, G.; Stellacci, A.; Bort, J.; Nogues, S.; Araus, J. NDVI as a potential tool for predicting biomass, plant nitrogen content and growth in wheat genotypes subjected to different water and nitrogen conditions. Cereal Res. Commun. 2011, 39, 147–159. [Google Scholar] [CrossRef]
  17. Smith, R.C.G.; Wallace, J.F.; Hick, P.T.; Gilmour, R.F.; Belford, R.K.; Portmann, P.A.; Regan, K.L.; Turner, N.C. Potential of using field spectroscopy during early growth for ranking biomass in cereal breeding trials. Aust. J. Agric. Res. 1993, 44, 1713–1730. [Google Scholar] [CrossRef]
  18. Tattaris, M.; Reynolds, M.P.; Chapman, S.C. A direct comparison of remote sensing approaches for high-throughput phenotyping in plant breeding. Front. Plant Sci. 2016, 7, 1131. [Google Scholar] [CrossRef]
  19. Prabhakara, K.; Hively, W.D.; McCarty, G.W. Evaluating the relationship between biomass, percent groundcover and remote sensing indices across six winter cover crop fields in Maryland, United States. Int. J. Appl. Earth Observ. Geoinf. 2015, 39, 88–102. [Google Scholar] [CrossRef] [Green Version]
  20. Lu, N.; Zhou, J.; Han, Z.; Li, D.; Cao, Q.; Yao, X.; Tian, Y.; Zhu, Y.; Cao, W.; Cheng, T. Improved estimation of aboveground biomass in wheat from RGB imagery and point cloud data acquired with a low-cost unmanned aerial vehicle system. Plant Methods 2019, 15, 17. [Google Scholar] [CrossRef] [Green Version]
  21. Han, L.; Yang, G.; Dai, H.; Xu, B.; Yang, H.; Feng, H.; Li, Z.; Yang, X. Modeling maize above-ground biomass based on machine learning approaches using UAV remote-sensing data. Plant Methods 2019, 15, 10. [Google Scholar] [CrossRef]
  22. Niu, Y.; Zhang, L.; Zhang, H.; Han, W.; Peng, X. Estimating above-ground biomass of maize using features derived from UAV-based RGB imagery. Remote Sens. 2019, 11, 1261. [Google Scholar] [CrossRef]
  23. Brocks, S.; Bareth, G. Estimating barley biomass with crop surface models from oblique RGB imagery. Remote Sens. 2018, 10, 268. [Google Scholar] [CrossRef]
  24. Bendig, J.; Bolten, A.; Bennertz, S.; Broscheit, J.; Eichfuss, S.; Bareth, G. Estimating biomass of barley using crop surface models (CSMs) derived from UAV-based RGB imaging. Remote Sens. 2014, 6, 10395–10412. [Google Scholar] [CrossRef]
  25. Jimenez-Berni, J.A.; Deery, D.M.; Rozas-Larraondo, P.; Condon, A.T.G.; Rebetzke, G.J.; James, R.A.; Bovill, W.D.; Furbank, R.T.; Sirault, X.R.R. High throughput determination of plant height, ground cover, and above-ground biomass in wheat with LiDAR. Front. Plant Sci. 2018, 9, 237. [Google Scholar] [CrossRef] [PubMed]
  26. Yuan, W.; Li, J.; Bhatta, M.; Shi, Y.; Baenziger, S.P.; Ge, Y. Wheat height estimation using LiDAR in comparison to ultrasonic sensor and UAS. Sensors 2018, 18, 3731. [Google Scholar] [CrossRef] [PubMed]
  27. Barmeier, G.; Mistele, B.; Schmidhalter, U. Referencing laser and ultrasonic height measurements of barleycultivars by using a herbometre as standard. Crop Pasture Sci. 2016, 67, 1215–1222. [Google Scholar] [CrossRef]
  28. Pittman, J.J.; Arnall, B.D.; Interrante, M.S.; Moffet, A.C.; Butler, J.T. Estimation of biomass and canopy height in bermudagrass, alfalfa, and wheat using ultrasonic, laser, and spectral sensors. Sensors 2015, 15, 2920–2943. [Google Scholar] [CrossRef]
  29. Hu, P.; Chapman, S.C.; Wang, X.; Potgieter, A.; Duan, T.; Jordan, D.; Guo, Y.; Zheng, B. Estimation of plant height using a high throughput phenotyping platform based on unmanned aerial vehicle and self-calibration: Example for sorghum breeding. Eur. J. Agron. 2018, 95, 24–32. [Google Scholar] [CrossRef]
  30. Fricke, T.; Richter, F.; Wachendorf, M. Assessment of forage mass from grassland swards by height measurement using an ultrasonic sensor. Comput. Electron. Agric. 2011, 79, 142–152. [Google Scholar] [CrossRef]
  31. Fricke, T.; Wachendorf, M. Combining ultrasonic sward height and spectral signatures to assess the biomass of legume–grass swards. Comput. Electron. Agric. 2013, 99, 236–247. [Google Scholar] [CrossRef]
  32. Condorelli, G.E.; Maccaferri, M.; Newcomb, M.; Andrade-Sanchez, P.; White, J.W.; French, A.N.; Sciara, G.; Ward, R.; Tuberosa, R. Comparative aerial and ground based high throughput phenotyping for the genetic dissection of NDVI as a proxy for drought adaptive traits in durum wheat. Front. Plant Sci. 2018, 9, 893. [Google Scholar] [CrossRef] [PubMed]
  33. Andersson, K.; Trotter, M.; Robson, A.; Schneider, D.; Frizell, L.; Saint, A.; Lamb, D.; Blore, C. Estimating pasture biomass with active optical sensors. Adv. Anim. Biosci. 2017, 8, 754–757. [Google Scholar] [CrossRef]
  34. Yue, J.; Yang, G.; Li, C.; Li, Z.; Wang, Y.; Feng, H.; Xu, B. Estimation of winter wheat above-ground biomass using unmanned aerial vehicle-based snapshot hyperspectral sensor and crop height improved models. Remote Sens. 2017, 9, 708. [Google Scholar] [CrossRef]
  35. Thompson, A.L.; Thorp, K.R.; Conley, M.; Andrade-Sanchez, P.; Heun, J.T.; Dyer, J.M.; White, J.W. Deploying a proximal sensing cart to identify drought-adaptive traits in upland cotton for high-throughput phenotyping. Front. Plant Sci. 2018, 9, 507. [Google Scholar] [CrossRef] [PubMed]
  36. Wang, X.; Thorp, K.R.; White, J.W.; French, A.N.; Poland, J.A. Approaches for geospatial processing of field-based high-throughput plant phenomics data from ground vehicle platforms. Trans. ASABE 2016, 59, 1053–1067. [Google Scholar]
  37. Cullen, B.R.; Eckard, R.J.; Callow, M.N.; Johnson, I.R.; Chapman, D.F.; Rawnsley, R.P.; Garcia, S.C.; White, T.; Snow, V.O. Simulating pasture growth rates in Australian and New Zealand grazing systems. Aust. J. Agric. Res. 2008, 59, 761–768. [Google Scholar] [CrossRef]
  38. Ampatzidis, Y.; Partel, V. UAV-based high throughput phenotyping in citrus utilizing multispectral imaging and artificial intelligence. Remote Sens. 2019, 11, 410. [Google Scholar] [CrossRef]
  39. Patrick, A.; Li, C. High throughput phenotyping of blueberry bush morphological traits using unmanned aerial systems. Remote Sens. 2017, 9, 1250. [Google Scholar] [CrossRef]
  40. Mu, Y.; Fujii, Y.; Takata, D.; Zheng, B.; Noshita, K.; Honda, K.; Ninomiya, S.; Guo, W. Characterization of peach tree crown by using high-resolution images from an unmanned aerial vehicle. Hortic. Res. 2018, 5, 74. [Google Scholar] [CrossRef] [Green Version]
  41. Robertsen, D.C.; Hjortshøj, L.R.; Janss, L.L. Genomic selection in cereal breeding. Agronomy 2019, 9, 95. [Google Scholar] [CrossRef]
  42. Nakaya, A.; Isobe, S.N. Will genomic selection be a practical method for plant breeding? Ann. Bot. 2012, 110, 1303–1316. [Google Scholar] [CrossRef] [PubMed] [Green Version]
  43. Lin, Z.; Wang, J.; Cogan, N.O.I.; Pembleton, L.W.; Badenhorst, P.; Forster, J.W.; Spangenberg, G.C.; Hayes, B.J.; Daetwyler, H.D. Optimizing resource allocation in a genomic breeding program for perennial ryegrass to balance genetic gain, cost, and inbreeding. Crop Sci. 2017, 57, 243–252. [Google Scholar] [CrossRef]
  44. Pembleton, L.W.; Inch, C.; Baillie, R.C.; Drayton, M.C.; Thakur, P.; Ogaji, Y.O.; Spangenberg, G.C.; Forster, J.W.; Daetwyler, H.D.; Cogan, N.O.I. Exploitation of data from breeding programs supports rapid implementation of genomic selection for key agronomic traits in perennial ryegrass. Theor. Appl. Genet. 2018, 131, 1891–1902. [Google Scholar] [CrossRef] [PubMed] [Green Version]
  45. Grüner, E.; Astor, T.; Wachendorf, M. Biomass prediction of heterogeneous temperate grasslands using an SFM approach based on UAV imaging. Agronomy 2019, 9, 54. [Google Scholar] [CrossRef]
  46. Gonzalez, M.A.; Hussey, M.A.; Conrad, B.E. Plant height, disk, and capacitance meters used to estimate bermudagrass herbage mass. Agron. J. 1990, 82, 861–864. [Google Scholar] [CrossRef]
  47. Thompson, A.L.; Thorp, K.R.; Conley, M.M.; Elshikha, D.M.; French, A.N.; Andrade-Sanchez, P.; Pauli, D. Comparing nadir and multi-angle view sensor technologies for measuring in-field plant height of upland cotton. Remote Sens. 2019, 11, 700. [Google Scholar] [CrossRef]
  48. Goodwin, A.W.; Lindsey, L.E.; Harrison, S.K.; Paul, P.A. Estimating wheat yield with normalized difference vegetation index and fractional green canopy cover. Crop Forage Turfgrass Manag. 2018, 4. [Google Scholar] [CrossRef]
  49. Lamb, D.W.; Schneider, D.A.; Trotter, M.G.; Schaefer, M.T.; Yule, I.J. Extended-altitude, aerial mapping of crop NDVI using an active optical sensor: A case study using a Raptor™ sensor over wheat. Comput. Electron. Agric. 2011, 77, 69–73. [Google Scholar] [CrossRef]
  50. Zaman-Allah, M.; Vergara, O.; Araus, J.L.; Tarekegne, A.; Magorokosho, C.; Zarco-Tejada, P.J.; Hornero, A.; Albà, A.H.; Das, B.; Craufurd, P.; et al. Unmanned aerial platform-based multi-spectral imaging for field phenotyping of maize. Plant Methods 2015, 11, 35. [Google Scholar] [CrossRef]
  51. Park, C.-W.; Na, S.-I.; So, K.-H.; Ahn, H.-Y.; Lee, K.-D. Development of field scale model for estimating barley growth based on UAV NDVI and meteorological factors. SPIE 2018, 10783, 107831P. [Google Scholar]
  52. Karnieli, A.; Agam, N.; Pinker, R.T.; Anderson, M.; Imhoff, M.L.; Gutman, G.G.; Panov, N.; Goldberg, A. Use of NDVI and land surface temperature for drought assessment: Merits and limitations. J. Climate 2010, 23, 618–633. [Google Scholar] [CrossRef]
  53. Holman, F.H.; Riche, A.B.; Michalski, A.; Castle, M.; Wooster, M.J.; Hawkesford, M.J. High throughput field phenotyping of wheat plant height and growth rate in field plot trials using UAV based remote sensing. Remote Sens. 2016, 8, 1031. [Google Scholar] [CrossRef]
  54. Jiang, Y.; Li, C.; Paterson, A.H. High throughput phenotyping of cotton plant height using depth images under field conditions. Comput. Electron. Agric. 2016, 130, 57–68. [Google Scholar] [CrossRef]
  55. Rueda-Ayala, P.V.; Peña, M.J.; Höglind, M.; Bengochea-Guevara, M.J.; Andújar, D. Comparing UAV-based technologies and RGB-D reconstruction methods for plant height and biomass monitoring on grass ley. Sensors 2019, 19, 535. [Google Scholar] [CrossRef] [PubMed]
  56. Chao, Z.; Liu, N.; Zhang, P.; Ying, T.; Song, K. Estimation methods developing with remote sensing information for energy crop biomass: A comparative review. Biomass Bioenergy 2019, 122, 414–425. [Google Scholar] [CrossRef]
  57. Li, W.; Niu, Z.; Chen, H.; Li, D.; Wu, M.; Zhao, W. Remote estimation of canopy height and aboveground biomass of maize using high-resolution stereo images from a low-cost unmanned aerial vehicle system. Ecol. Indic. 2016, 67, 637–648. [Google Scholar] [CrossRef]
Figure 1. Study site: the perennial ryegrass experiment was conducted at the Hamilton Centre Research Station in Victoria State of Australia in 2017 and 2018. NDVI tiff file is used to display the field trial site sampled plants and non-sampled plants throughout the experiment time.
Remotesensing 11 02494 g001
Figure 2. Aerial and ground-based platforms for high-throughput phenotyping (a) UASs platform and sensors; (b) PhenoRover system and sensors at the experimental site.
Remotesensing 11 02494 g002
Figure 3. Workflow diagram of image processing and plant height extraction used in the GSS field trial. The steps in the left contain all procedures applied to extract single plants NDVI from the UAS images, whereas the steps in the right show the procedures followed to extract single plants plant height from the PhenoRover system. The box with the broken red line contains the methods and analysis procedures used to model the HY estimation.
Remotesensing 11 02494 g003
Figure 4. Measured fresh herbage yield at four seasons of the year 2017 and 2018 (a,c) and dry herbage yield (b,d); A: autumn; W: winter; MS: mid-spring; LW: late winter; EW: early winter; ES: early spring; LS: late spring.
Remotesensing 11 02494 g004
Figure 5. Scatterplots of plant height from ultrasonic sonar sensors vs. manually measured plant height using a standard ruler for the selected measurement date of 19 June 2018.
Remotesensing 11 02494 g005
Figure 6. Scatterplots of (a) NDVI extracted from UAS-based multispectral imaging vs. log-transformed dry herbage yield measurements of single plants in four seasons of the 2017 dataset; (b) plant height measured versus log-transformed dry herbage yield measurements of single plants in four seasons of the 2017 dataset; (c) NDVI extracted from UAS-based multispectral imaging vs. log-transformed dry herbage yield measurements of single plants in four seasons of the 2018 dataset; (d) plant height measured versus log-transformed dry herbage yield measurements of single plants in four seasons of the 2018 dataset. p-value < 0.001 for all regression equations.
Remotesensing 11 02494 g006
Figure 7. Scatterplots of (a) squared NDVI-value extracted from UAS-based multispectral imaging and plant height (NDVIsq_PH) vs. dry herbage yield measurements of single plants in four seasons of 2017; (b) NDVIsq_PH vs. dry herbage yield measurements of single plants in four seasons of 2018. p-value < 0.001 for all regression equations.
Remotesensing 11 02494 g007
Figure 8. Scatterplots of (a) combined regression of NDVIsq_PH vs. dry herbage yield measurements of single plants in four seasons of 2017; (b) combined regression of NDVIsq_PH vs. dry herbage yield measurements of single plants in four seasons of 2018. p-value< 0.001 for all regression equations.
Remotesensing 11 02494 g008
Figure 9. Scatterplots of observed and predicted dry herbage yield (grams/plant) in perennial ryegrass with linear regressions of various K-folds and random splits of cross-validation. The data points displayed in each plot represent the K-fold validation sets of (a) two-fold, (b) five-fold, (c) 10-fold, (d) 20- and (e) 60/40%, (f) 70/30% and (g) 80/20% random split from the 2017 harvest. The solid diagonals represent 1:1 line, and the dashed lines represent the fitted linear functions. p-value < 0.0001 for all regression functions.
Remotesensing 11 02494 g009
Table 1. Overview of the data collected from individual plants, data collection date, sensors applied and equipment used for measurements.
DateSeason of the YearNumber of Plants SampledData AcquisitionSensors/Equipment
9 May 2017Autumn475UAS flight, manual height and fresh and dry HYParrot Sequoia, ruler and manual cut
4 July 2017Winter
11 September 2017Early spring
20 November 2017Late spring
19 June 2018Winter426UAS flight, manual height, fresh and dry HY and ultrasonic sonar heightParrot Sequoia, ruler, manual cut and ultrasonic sonar
20 August 2018Late winter *
23 October 2018spring
20 November 2018Late spring
* No ultrasonic sonar data.
Table 2. Details of UAS data acquisition and processing quality.
DateSeasonOverlap (Forward/Side)Flight (m/s)Flight Time (Minutes)Georeferencing RMSE (m)GSD (m/pixel)
2017Autumn80%/75%640.020.02
Winter80%/75%640.010.02
Early spring80%/75%640.010.02
Late spring80%/75%640.010.022
2018Early winter75%/75%640.010.02
Late winter75%/75%640.030.02
Early spring75%/75%640.040.02
Late spring75%/75%640.030.02
Table 3. Summary of cross-validation results for predicted fresh herbage yield (g/p). CV method: cross-validation method; R2: coefficient of determination; RMSE: root mean square error; MAE: mean absolute error; MPE: mean percentage error.
20172018
CV MethodPartitionR2RMSE (g)MAEMPE%R2RMSE (g)MAEMPE%
2-folds20.6332.8124.31220.6923.8015.2130
5-folds50.6432.6624.30220.6923.6715.1130.63
10-folds100.6432.6024.29220.6923.7115.1630
20-folds200.6432.5924.30220.7023.5015.1530
Random split *60%/40%0.6432.7724.34220.6923.9615.5030.70
Random split *70%/30%0.6432.7724.33220.6923.9215.4930.68
Random split *80%/20%0.6432.7124.31220.6923.9115.4930.66
* = Random split results based on 10,000 simulations.
Table 4. Summary of cross-validation results for dry herbage yield (g/p). CV method: cross-validation method; RMSE: root mean square error; R2: coefficient of determination; MAE: mean absolute error; MPE: mean percentage error.
20172018
CV MethodPartitionR2RMSE (g)MAEMPE%R2RMSE (g)MAEMPE%
2-folds20.667.575.43220.675.503.6027.76
5-folds50.677.565.44220.675.463.6027.62
10-folds100.677.575.43220.675.503.5928
20-folds200.677.535.43220.685.433.5927.65
Random split *60%/40%0.677.595.44220.675.523.6728.34
Random split *70%/30%0.677.605.44220.675.523.6628.31
Random split *80%/20%0.677.585.44220.675.513.6628.29
* = Random split results based on 10,000 simulations.

