Article

Enhancing the Nitrogen Signals of Rice Canopies across Critical Growth Stages through the Integration of Textural and Spectral Information from Unmanned Aerial Vehicle (UAV) Multispectral Imagery

1
National Engineering and Technology Center for Information Agriculture, Nanjing 210095, China
2
Key Laboratory for Crop System Analysis and Decision Making, Ministry of Agriculture, Nanjing 210095, China
3
Jiangsu Key Laboratory for Information Agriculture, Nanjing Agricultural University, Nanjing 210095, China
4
Jiangsu Collaborative Innovation Center for Modern Crop Production, Nanjing Agricultural University, Nanjing 210095, China
*
Author to whom correspondence should be addressed.
Remote Sens. 2020, 12(6), 957; https://doi.org/10.3390/rs12060957
Submission received: 31 December 2019 / Revised: 10 March 2020 / Accepted: 13 March 2020 / Published: 16 March 2020

Abstract

:
This paper evaluates the potential of integrating textural and spectral information from unmanned aerial vehicle (UAV)-based multispectral imagery for improving the quantification of nitrogen (N) status in rice crops. Vegetation indices (VIs), normalized difference texture indices (NDTIs), and their combination were used to estimate four N nutrition parameters leaf nitrogen concentration (LNC), leaf nitrogen accumulation (LNA), plant nitrogen concentration (PNC), and plant nitrogen accumulation (PNA). Results demonstrated that the normalized difference red-edge index (NDRE) performed best in estimating the N nutrition parameters among all the VI candidates. The optimal texture indices had comparable performance in N nutrition parameters estimation as compared to NDRE. Significant improvement for all N nutrition parameters could be obtained by integrating VIs with NDTIs using multiple linear regression. While tested across years and growth stages, the multivariate models also exhibited satisfactory estimation accuracy. For texture analysis, texture metrics calculated in the direction D3 (perpendicular to the row orientation) are recommended for monitoring row-planted crops. These findings indicate that the addition of textural information derived from UAV multispectral imagery could reduce the effects of background materials and saturation and enhance the N signals of rice canopies for the entire season.

Graphical Abstract

1. Introduction

As one of the most important staple crops around the world, rice (Oryza sativa L.) crop feeds more than 50% of the world’s population. Nitrogen is the primary element for crop growth due to the crucial impact on crop yield formulation and grain quality determination. Monitoring N status in rice leaves or plants could provide valuable information for growth diagnosis [1] and precise field N management [2], so as to improve the N use efficiency and reduce environmental pollution.
Crop N status is often represented by LNC and PNC in precision agriculture. However, the majority of studies reported that it was difficult to quantify LNC and PNC precisely with the canopy reflectance data and N status monitoring was strongly influenced by growth stage [3,4]. Nitrogen signals from rice leaves and plants captured by canopy spectra at early growth stages are weak, because the background materials (e.g., soil, water) occupy a large proportion of the field of view and the biomass of rice crops increases as the N concentration decreases due to the N dilution effect [5,6]. Since those negative influences could be reduced at reproductive stages with the stabilization of leaf biomass [6], the N status is difficult to detect at early stages and could be estimated more accurately for late stages. Zhou et al. [6] found that the LNC at vegetative stages (with low canopy coverage) should be estimated with stage-specific regression models, and only the LNC at reproductive stages (with high canopy coverage and even canopy closure) could be estimated with a common model. In contrast to the influence of background materials for early stages, the low sensitivity of spectral signals to the growth dynamics of dense canopies becomes another issue for the estimation of N concentration for late stages (from booting to grain filling). Therefore, determining how to enhance N signals and build suitable models for N status monitoring over the whole season remains to be addressed.
Other than spectral information, the textural information inherent in the UAV imagery has recently been proved to have great potential in crop growth monitoring [7,8]. Image texture analysis can be applied to the identification of image tonal variation through a function of local variance in the images [9]. The texture metrics derived from spectral bands can characterize canopy structural patterns and enhance the sensitivity of remotely sensed data to biophysical properties, especially at dense canopy coverage conditions [10]. During the early growth period (from tillering to booting stages) of rice crops, the leaves often exhibit remarkable variation in color as a result of N nutrition consumption for vegetative development and the topdressing of N fertilizer [11,12]. These tonal variations within and between crop canopies could be captured by texture metrics. Therefore, the image-derived texture metrics have the potential to better characterize the N status variation at critical growth stages. The availability of different data sources enables data fusion, i.e., the combination of datasets from two or more data types with different characteristics [7]. Data fusion may allow a more holistic interpretation of the relationship between remote sensing information and crop parameters. For example, the fusion of spectral information and textural information from UAV imagery showed an increased prediction performance for crop biomass [8]. Since the textural and spectral features respond to the N status dynamics in different ways, the integration of their complementary information could be useful for improving the estimation of N nutrition parameter across critical growth stages. The performance of texture analysis depends on the choices of texture metrics, the spectral band used for texture derivation, window size, and texture direction [13,14]. While the former three factors were well studied for vegetation monitoring, the effect of texture direction has rarely been investigated. Previous studies often conducted texture analysis with the default direction (45°), because most of them focused on naturally grown forests with disorderly distributed tress [7,15]. Others exercised with different directions for naturally grown trees, but they did not explicitly provide the mechanism underlying the direction choices [10,14,16]. Rice crops are mostly planted in rows and exhibit regular spatial patterns, but how the texture direction affects the performance of derived textural information remains unclear. Whether the performance of across-row texture metrics differs from that of along-row texture metrics and whether those two directions outperform the default diagonal direction need to be investigated.
Therefore, our aims were (1) to determine the optimal texture metrics and texture indices from UAV multispectral imagery for estimating rice N nutrition parameters, (2) to investigate the directional effect of texture analysis on N status estimation for row-planted rice crops, and (3) to examine the feasibility of integrating spectral and textural information in the improvement of N status monitoring.

2. Materials and Methods

2.1. Experimental Design

In 2015 and 2016, we conducted two field experiments in Rugao, Jiangsu Province, China (120°45′E, 32°16′N) [8]. In 2015, there were four N rates (0, 100, 200, and 300 kg N ha−1). The minimum and maximum N rates had at one density (22 × 104 plants ha−1) and the intermediate N rates had two densities (13 × 104 plants ha−1 and 22 × 104 plants ha−1). The ratio of N fertilizer application was 4:1:3:2 for basal fertilizer before transplanting, tillering stage, jointing stage, and booting stage. In 2016, there were three N rates (0, 150, and 300 kg N ha−1) and two densities (13 × 104 plants ha−1 and 22 × 104 plants ha−1). The ratio of N fertilizer application was 4:2:2:2 for basal fertilizer before transplanting, tillering stage, jointing stage, and booting stage. There were two rice cultivars, (Wuyunjing 24, V1) and (Y Liangyou 1, V2). Each experiment had 36 plots (12 treatments with three replications) with 30 m2 (6 m × 5 m).

2.2. Ground Sampling and UAV Image Acquisition

The UAV campaigns and ground destructive samplings were taken at critical growth stages of rice (Table 1). After the UAV campaign, three hills of rice plants were randomly harvested in each plot and separated into different organs. All the samples were oven dried at 105 °C for 30 mins, followed by drying at 80 °C, until a constant weight was reached. Then, they were weighed, ground, and stored in plastic bags for laboratory chemical analysis. Aboveground biomass (AGB) was the total dry weight of all plant organs per unit ground area. Total N concentrations (%) were determined with the micro-Keldjahl analysis. The LNC and PNC were expressed on a dry weight basis (%), and LNA and PNA were expressed as N mass per unit ground area (g m−2). The LNA (g m−2) was obtained through multiplying LNC (%) by leaf dry biomass (LDB, t ha−1). The PNA (g m2) was obtained through multiplying PNC (%) by AGB (t ha−1).
In this study, we used an eight-rotor aircraft (Mikrokopter OktoXL) which had a maximum payload capacity of 2.5 kg and a flight duration of 10−20 min, depending on the battery and actual payload. A multispectral camera (Mini-MCA6; Tetracam, Inc., Chatsworth, CA, USA) was mounted on the UAV to acquire images in this study (Table 1). The specification of this multispectral camera can be found in Reference [17]. The UAV was flown at 100 m above ground level, resulting in a nominal resolution of 0.054 m in the multispectral images. The camera was set to continuous data capture at one frame per three seconds with a fixed aperture and exposure according to the light conditions. Aerial images were saved in the camera memory card in a 10 bit RAW format.
The UAV campaigns were conducted under a clear sky and calm wind conditions between 11:00 and 13:30 (local time). After each flight, only one image that covered all 36 plots in the nadir position was selected for subsequent analysis.

2.3. Image Processing

The UAV-based image preprocessing workflows were performed by following Reference [17] and processed in IDL/ENVI environment (Exelis Visual Information Solutions, Boulder, Colorado, USA). The pre-processing workflows included noise reduction, vignetting correction, and lens distortion correction. Subsequently, the six bands were co-registered with 25 ground control points (GCPs) evenly distributed in the study area (Figure 1). Then, we conducted radiometric correction with an empirical line correction method using a six flat calibration canvas at different reflectance intensities [17,18].
The reflectance value of each plot was extracted as the mean over a region of interest (ROI) in the non-sampling area. Then, ten VIs commonly used in crop growth monitoring were calculated from the reflectance values (Table 2).
The grey level co-occurrence matrix (GLCM) was employed in this study to evaluate the potential of texture analysis on reflectance images for improving rice N status monitoring. Eight GLCM-based texture metrics including mean (MEA), variance (VAR), homogeneity (HOM), contrast (CON), dissimilarity (DIS), entropy (ENT), second moment (SEM), and correlation (COR) were computed using the ENVI software. A detailed description of the eight texture metrics can be found in Reference [19]. Since the smallest window size (3 × 3) was comparable to the row spacing at jointing stage and larger window sizes did not exhibit significant differences (data not shown), only the window size (3 × 3) was investigated. Next, inter-correlations between different texture metrics were analyzed to decrease the data dimensionality and improve the data processing efficiency. Finally, we chose four texture metrics (i.e., MEA, CON, DIS, and COR) at the minimal window size (3 × 3) for texture analysis with five bands (blue, green, red, RE, and NIR) in four directions (D1 = 0°, D2 = 45°, D3 = 90° and D4 = 135°).
Based on individual texture bands, the normalized difference texture index (NDTI) was also derived to improve the performance of texture analysis. The NDTI was calculated in the equation below:
NDTI ( T 1 , T 2 ) = ( T 1 T 2 ) ( T 1 + T 2 )
where T1 and T2 are a random texture feature from the five bands in four directions.

2.4. Statistical Analysis

The data collected from the two field experiments were pooled to examine the relationships of agronomic variables with VIs, NDTIs, and their combinations by simple regression (SR) and stepwise multiple linear regression (SMLR). Model validation was performed on the pooled data using a k-fold (k = 10) cross-validation procedure and evaluated by the root mean square error (RMSE) and the relative RMSE (RRMSE).

3. Results

3.1. Relationships of N Nutrition Parameters with VIs

Table 3 shows the relationships among different agronomic parameters. The LNC and PNC and LNA and PNA were highly correlated to each other. In addition, biomass was highly correlated to both LNA and PNA. Table 4 shows the relationships between N nutrition parameters and VIs derived from UAV multispectral images. For foliar parameters, the relationships between VIs and LNC were remarkably low, and the highest R2 was only 0.2 obtained by CIRE and NDRE (Figure 1a). These two indices also exhibited the strongest relationships with LNA (R2 = 0.77 for both) (Figure 1b). For plant parameters, PNC was most correlated to CIRE as seen for LNC but with a lower R2 value (R2 = 0.15) (Figure 1c). The OSAVI exhibited the strongest relationships with PNA (R2 = 0.73) which was also found for NDRE (R2 = 0.73) (Figure 1d). In general, RE-based VIs exhibited better relationships with N nutrition parameters than other indices.

3.2. Texture Analysis and Performance of Texture Indices

3.2.1. Relationships between N Nutrition Parameters and Individual Texture Metrics

Figure 2 shows the relationships between N nutrition parameters and single-band texture metrics. For LNC and PNC estimation, the texture metrics in the direction D3 were generally superior to those in other directions, while directions did not influence the performance of the optimal texture feature for LNA and PNA estimation. The DIS feature and the MEA feature exhibited a higher correlation than other texture metrics with N concentration and N accumulation indicators, respectively. The DIS feature in the RE band was superior to other bands in LNC estimation with an R2 of only 0.26 (Figure 2a). The MEA feature in the red band was most related to LNA (R2 = 0.39) among all the texture metrics (Figure 2b). Similar to LNC, the DIS feature in the RE band exhibited a higher correlation with PNC compared to their counterparts (Figure 2c). The MEA feature in the NIR band obtained a higher correlation with PNA (R2 = 0.55) than other texture metrics (Figure 2d).

3.2.2. Relationships between N Nutrition Parameters and Texture Indices

Considerable improvement was obtained with texture indices for N nutrition parameters estimation comparing with individual texture metrics (Table 5). The majority of optimal NDTIs were composed of texture metrics in D3 and D4. The optimal NDTIs for LNC and PNC estimation consisted of DIS, CON, and COR features calculated from RE and NIR bands. While the optimal NDTIs for LNA estimation consisted of MEA features calculated from RE and NIR bands, and those for PNA estimation were composed of MEA features calculated from green and NIR bands. The index (NDTI(DISB5_D4, CONB4_D3)) was closely related to both LNC and PNC with R2 of 0.29 and 0.41 (Figure 3a,c). The NDTI(MEAB5_D3, MEAB4_D4) performed best in the LNA estimation (R2 = 0.72) with exponential regression (Figure 3b). The NDTI(MEAB5_D3, MEAB2_D3) performed best in the PNA estimation (R2 = 0.75), and obvious saturation occurred at high PNA levels (Figure 3d).

3.3. Performance of the Integration of VIs and Texture Indices

Table 6 shows the performance of the combination of VIs and texture indices in the estimation of N nutrition parameters with stepwise multiple linear regression. The hybrid model with VIs and NDTIs could explain 70% of the variability in LNC which was significantly higher than using VIs or texture indices alone. Compared with the optimal VI (NDRE) for LNA estimation, the combination of VIs and NDTIs produced a slightly better relationship. Similar to the LNC estimation, the multivariate model improved the regression significantly from 0.41 to 0.68 with three texture indices. Furthermore, the hybrid model explained more than 80% of the variability in PNA (R2 = 0.86) which was higher than using individual remote sensing variables alone. Interestingly, all the multivariate models for plant-level variables included NDTI(MEAB5_D3, MEAB2_D4). Furthermore, all variables in the hybrid models were statistically significant and multicollinearity effects were not observed.

3.4. Model Validation

Table 7 shows the accuracy assessment for N nutrition parameters with the best-fit model in each category. The multivariate model yielded the significantly higher estimation accuracy (RMSE = 0.22 and RRMSE = 9.70%) for LNC estimation than using VIs and NDTIs alone (Figure 4a–c). Compared with the optimal VI, the combination of VI and NDTI exhibited a slightly higher estimation accuracy for LNA (RMSE = 1.16 g m−2 and RRMSE = 21.04%) estimation. The highest estimation accuracy (RMSE = 0.19 and RRMSE = 15.34%) for PNC estimation was obtained by the hybrid model, which was significantly higher than other techniques (Figure 4d–f). Similarly, the multivariate models yielded the highest estimation accuracy for PNA (RMSE = 2.38 g m−2 and RRMSE = 24.17%) estimation when compared with other techniques. Furthermore, the optimal multivariate models for LNC and PNC in Table 6 exhibited satisfactory performance when validated with different dataset groups (Table 8).
When all the texture indices in the multivariate models used the texture metrics calculated in the direction D3 for simplicity, the validation accuracies for the majority of N nutrition parameters were marginally lower (data not shown). For example, the validation RMSE and RRMSE values of the LNC estimation decreased slightly to 0.24% and 10.52%, respectively.

4. Discussion

4.1. Differences among N Nutrition Parameters: N Concentration versus N Accumulation

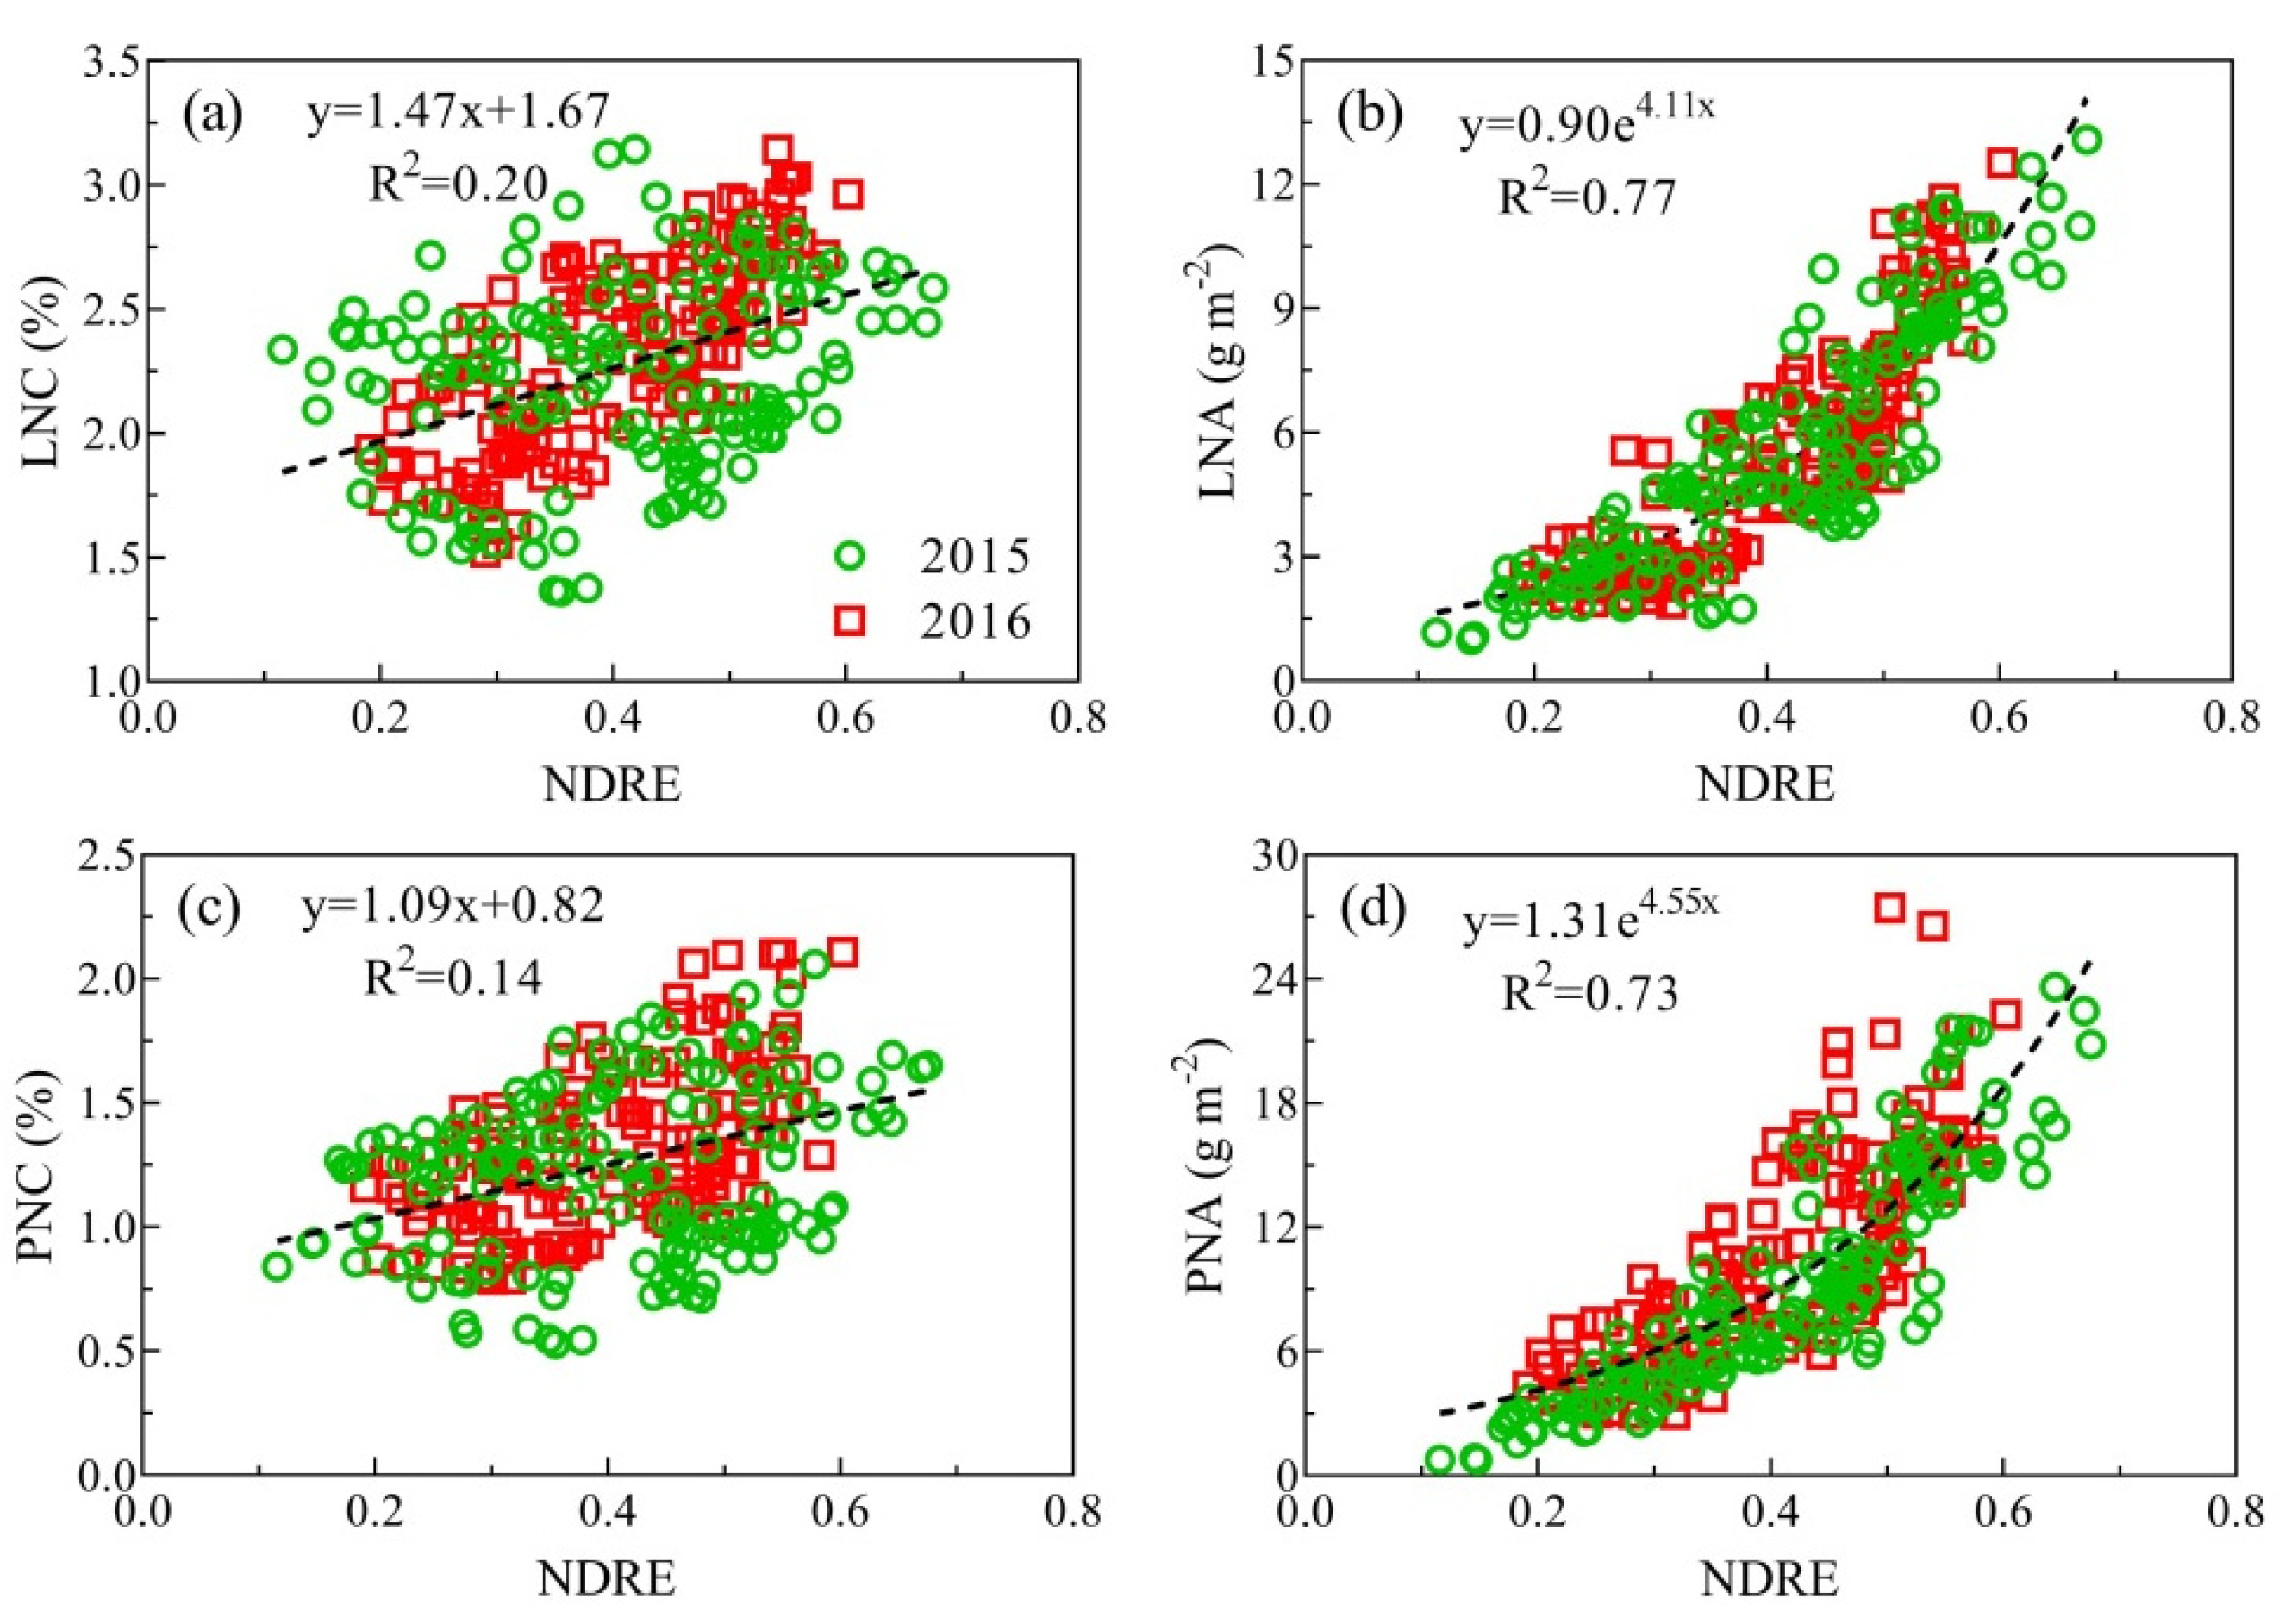
The estimation accuracies for LNC and PNC were low when using VIs and the best-performing VI could explain no more than 30% of the variability in N concentration. However, the estimation accuracies for LNA and PNA were significantly higher than those for LNC and PNC. The optimal VI (NDRE) could explain 77% and 73% of the variability in LNA and PNA, respectively. The LNC (or PNC) varied in a narrow range across the growing season of rice crops. It decreased from the beginning, leveled off in the middle and then decreased until harvesting [6]. This trend could be characterized by NDRE with a linear but weak relationship. However, LNA (or PNA) varied in a relatively wider range and kept increasing across the entire season. Particularly, NDRE tended to saturate when LNA (PNA) increased to a certain level. A linear regression would not be able to capture this decreasing rate of nitrogen accumulation. Therefore, LNC or PNC exhibited weak relationships with VIs in linear regressions and LNA or PNA in exponential regression [3,5]. Besides, the N absorption features are located in the shortwave infrared (SWIR) region rather than the visible and NIR region [30]. Li et al. [31] improved crop LNC estimation from the SWIR reflectance spectra of fresh leaves through enhancing the absorption features of nitrogen in the SWIR region. However, those VIs derived from UAV multispectral imagery were all based on visible and NIR bands, which could be easily affected by chlorophyll content and canopy structure [32]. Furthermore, the N dilution effect might be another reason for the low estimation accuracy of LNC and PNC with VIs due to the decrease of N concentration along with the increase of biomass [33]. The good relationships between NA and VIs might be attributed to the strong capabilities of VIs in retrieving biomass [34] and the close correlation between N accumulation and biomass (Table 3).
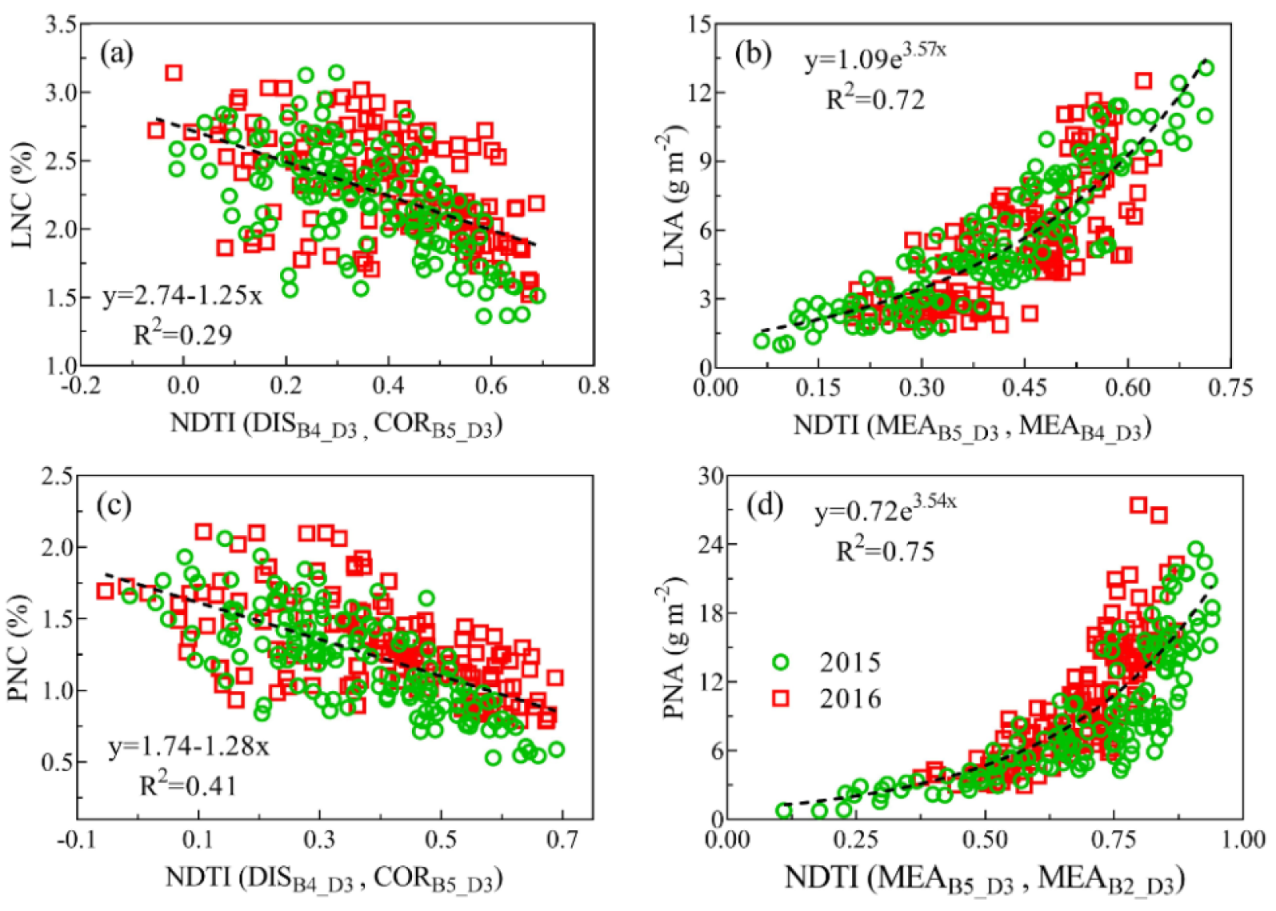
In texture analysis, the optimal NDTI for LNC and PNC estimation were all composed of NIR and RE bands with similar texture metrics (e.g., CON, DIS, COR). Although both LNC and PNC could be estimated with a common index NDTI (DISB4_D3, CORB5_D3), the relationships between texture indices and NC were not strong in both linear and exponential regressions. That might be because leaf color turned light to dark repeatedly in response to N fertilization at the vegetative stages and kept yellowing at reproductive stages [6]. This reduced the sensitivity of texture metrics to the heterogeneity of tonal variation caused by N status in crops across the whole growing season. Specifically, NDTI(MEAB5, MEAB4) and NDTI(MEAB5, MEAB2) were the optimal texture indices across the whole growing season in exponential regression for LNA and PNA estimation, respectively (Table 5). Because allometric variation of LNA or PNA in the season was largely attributed to biomass (Table 3), texture indices could characterize the biomass related variation with an exponential regression [7,8].
Furthermore, the variables in the multivariate model for LNA included one N-sensitive variable (NDTI(DISB4_D3, CORB5_D3)) and two biomass-sensitive variables (NDRE and NGRDI). Therefore, LNA could reflect part of the variation in LNC [35,36], but the exact proportion needs to be investigated in future work. However, the optimal multivariate PNA estimation model consisted of entirely AGB-sensitive indices such as NDTI(MEAB5_D3, MEAB2_D4), MTVI2 [29], and NGRDI [20]. This also suggests that the variation in PNA might be dominated by biomass and contain weak information on N concentration which corresponds well with the findings in Reference [5].

4.2. Directional Effect of Texture Analysis on Row-Planted Crops

The directional effect of texture analysis was rarely investigated in the existing literature, since the majority of previous studies executed texture analysis with the default direction (45°) [7,15]. Some studies calculated texture metrics with different directions but did not explicitly explain the reason [10,
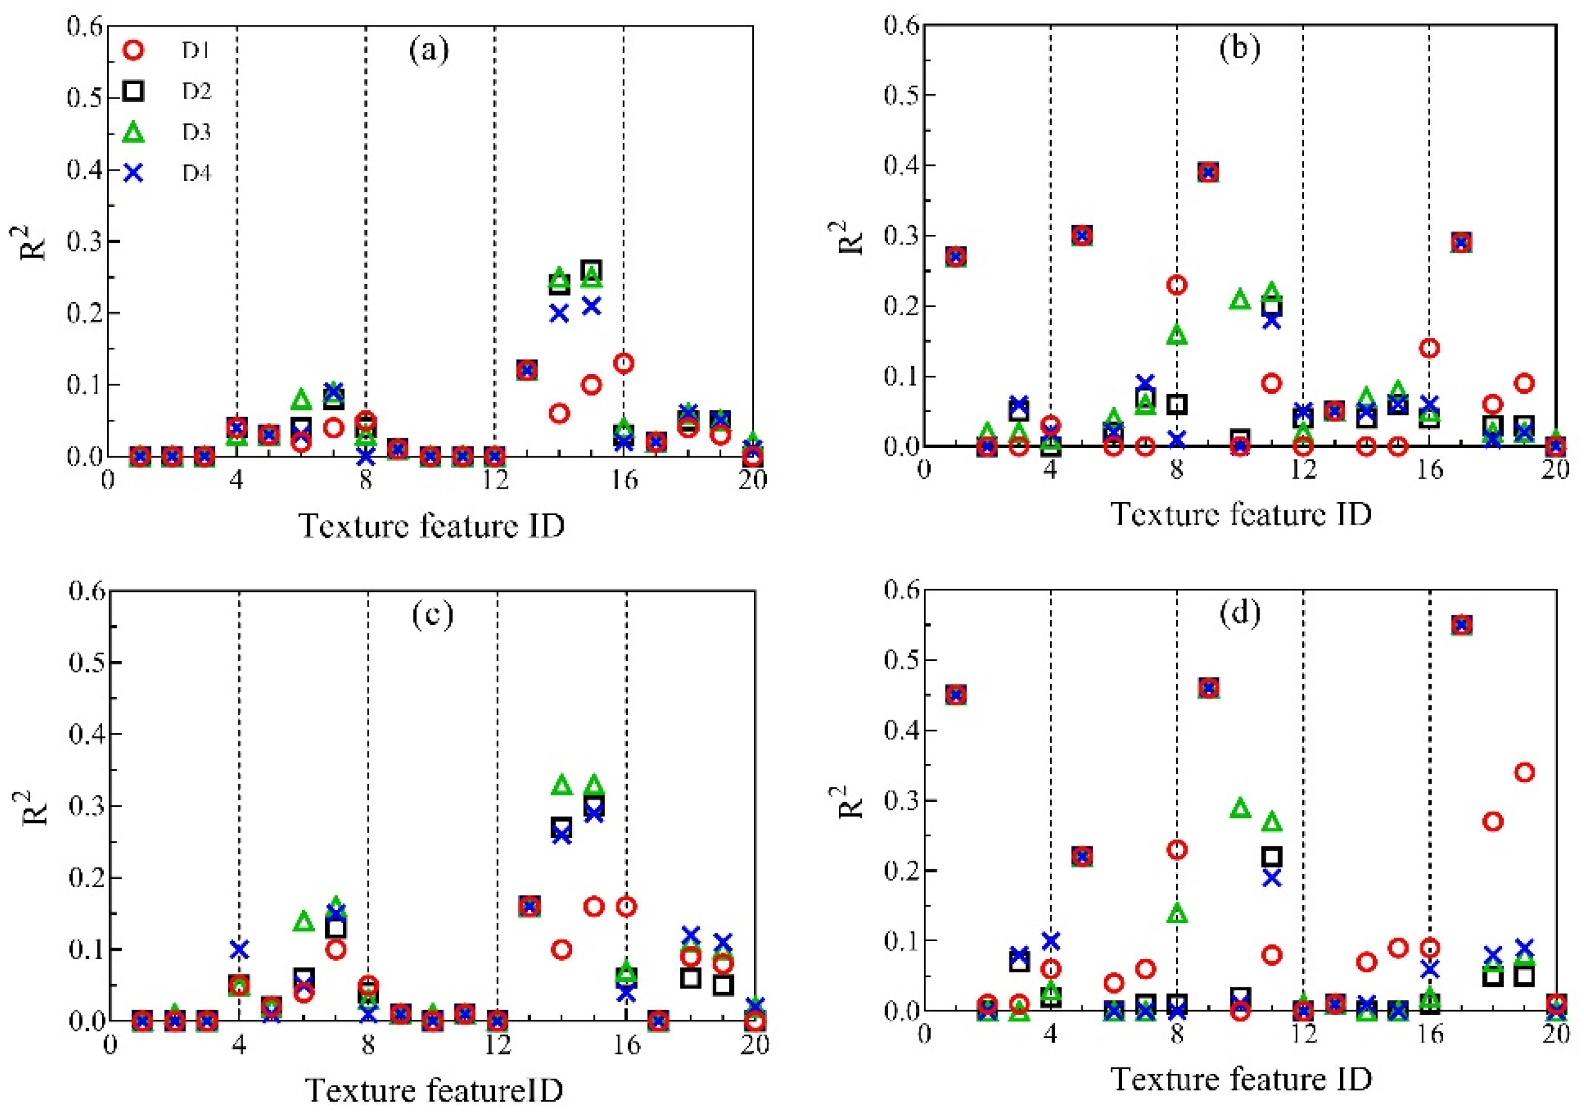
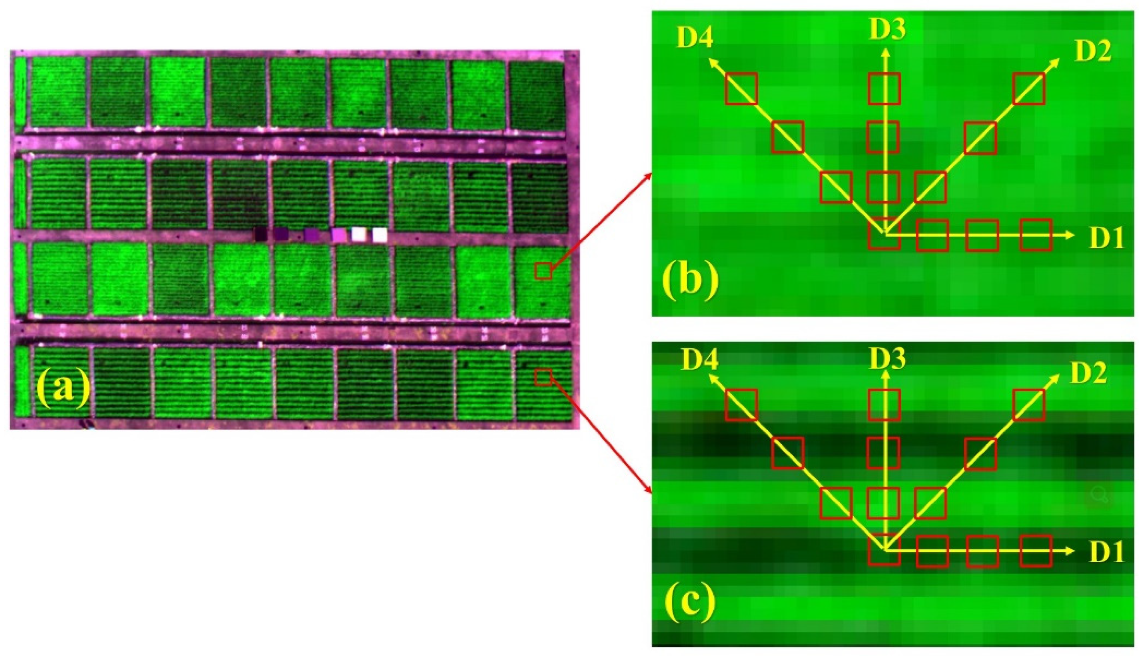
16]. That might be because most of them studied naturally grown forests, and the trees were distributed disorderly. In contrast, we found that texture metrics had a significant directional effect (Figure 2). That is because rice plants are grown in rows, and the local window sliding along the row orientation contains more homogeneous vegetation than from other directions. Furthermore, the rice plants in the same row grow more homogenously than those in different rows, resulting in lower contrast and higher correlation in the along-row direction than in other directions (Figure 5). Texture indices calculated with texture metrics from different directions had different performances on the N nutrition parameter estimation (Table 6). However, the texture feature MEA represents the average values within the moving window and the textural information extracted from the UAV images is the average value from an ROI in the non-sampling area. As a result, MEA was not affected by directions, and the same R2 value was obtained with the optimal NDTIs composed of MEA features calculated in different directions for LNA and PNA estimation (Table 6).
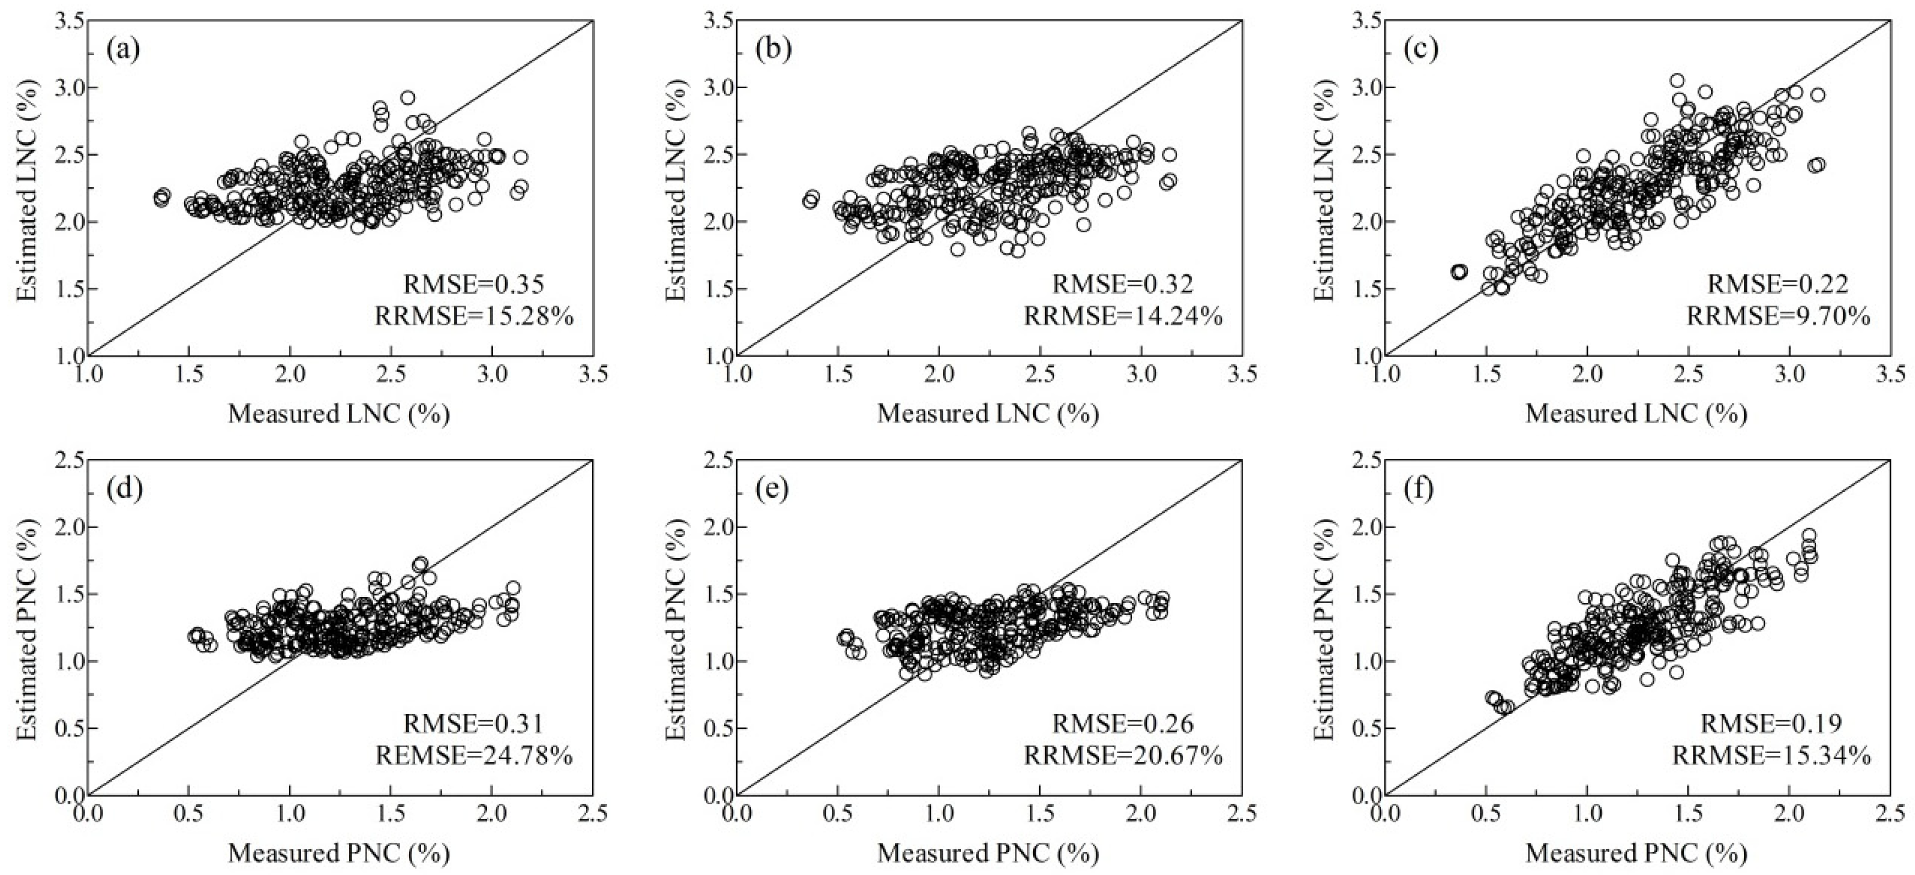
Texture metrics calculated in directions D3 and D4 constructed the optimal NDTIs for LNC and PNC estimation which might be explained by the strong capability of across-row texture metrics in differentiating the tonal variations caused by N status. Moreover, the estimation accuracy (RMSE = 0.24, RRMSE = 10.52%) of LNC decreased marginally if the texture indices in the multivariate model of LNC were derived from the direction D3 alone. Additionally, the same estimation accuracies were obtained for other N parameters (LNA, PNC, and PNA) through the multivariate models with all the texture indices calculated in the direction D3 when compared to the original multivariate models (data not shown). Therefore, all N nutrition parameters could be estimated at nearly the highest accuracies with the combination of VIs and texture indices calculated with texture metrics in the direction D3 which could simplify the use of texture analysis significantly.
Texture analysis also involved the optimal selection of texture calculation algorithm, spectral band, and window size [14]. Although window size has a considerable effect on the estimation accuracy of forest biomass due to the mismatch of spatial scale between remotely sensed pixel size and tree canopy [14,16], it showed no significant influence in the present study. This was because most window sizes contained a large proportion of crops due to the large canopy coverage since the jointing stage. Rice crops are often planted in the row distance of 24–30 cm, and multispectral images collected at 100 m usually possess a spatial resolution of 5–7 cm. Hence, a larger window size might be a good choice for texture analysis at early growth stages. Yue et al. [7] also found the optimal image resolution for using image textures to estimate AGB in winter wheat depended on the crop canopy size and row spacing. Therefore, the optimal window size has to be taken into consideration in terms of row space and image spatial resolution for other row-planted crops (e.g., soybean, corn).

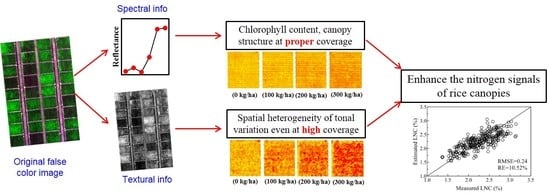
4.3. The Benefits of Fused Information for Enhancing N Signals

Numerous studies were dedicated to improving N concentration estimation with different approaches due to the importance of N nutrition status in crop management. The most commonly used way was to propose new VIs for N concentration estimation [37,38]. Although those VIs yielded high estimation accuracies as shown in the literature, the unstable performance was reported in other studies [39]. In this study, VIs had poor performance in N concentration estimation, which is in line with References [3,5]. Texture indices showed comparable performance when compared to VIs which is in contrast to the performance of texture ratios in forest AGB estimation [10,16]. However, a significant improvement in LNC estimation was obtained when using the combination of texture indices and VIs as compared to using VIs or texture indices alone, with an increase of more than 35% in RMSE (Table 7). This finding agrees well with the results of References [7] and [8] which reported that the combination of texture indices and VIs improved the estimation of crop AGB significantly. In contrast to relevant studies [6,40], a universal model could be used to estimate N concentration across the entire season, which was a substantial improvement in crop N status monitoring with remotely sensed data. Compared with the new spectral index proposed by Stroppiana et al. [38] with hyperspectral data (R2 = 0.65), our multivariate model derived from multispectral data could even yield a similar R2 value (R2 = 0.68) for PNC. A universal model suitable for the entire season could not only be used to guide N fertilization applications at the early growth stages [1,41] but also to predict crop yield and quality before harvest [42,43].
The improvement in LNC and PNC estimation induced by the addition of texture indices stemmed from the enhancement of N signals for the early stages. VIs could not be used to estimate N concentration at the early growth stages (from tillering to booting) with a universal model, because N signals were hampered by the rapid increase of biomass and the large proportion of background materials [5,6]. However, leaf color changed remarkably due to the N fertilizer applications conducted at jointing stage [11,
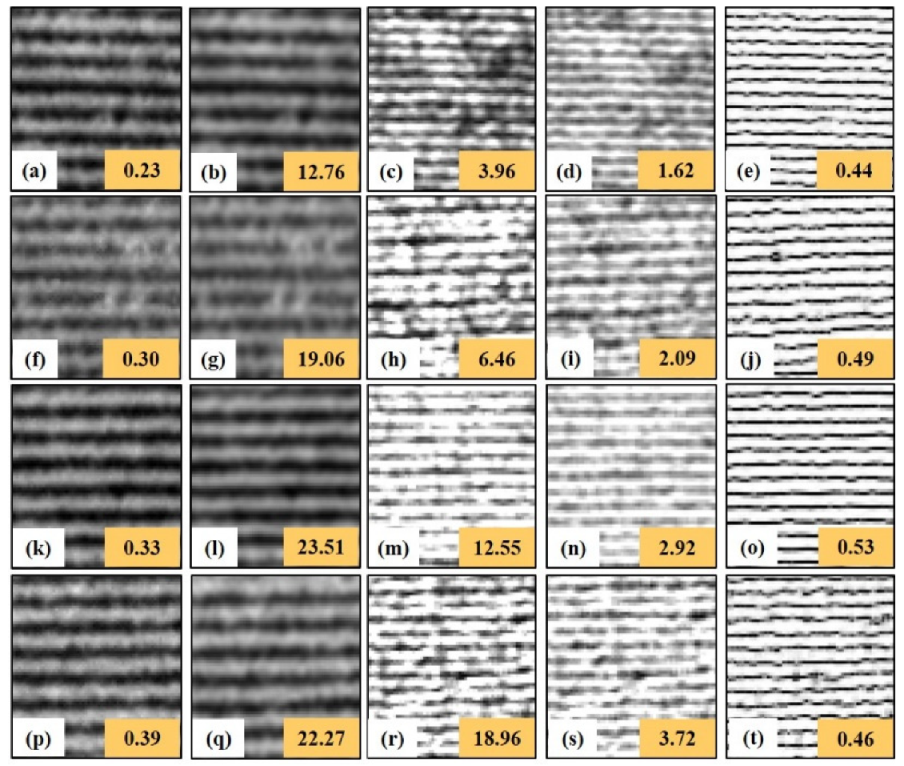
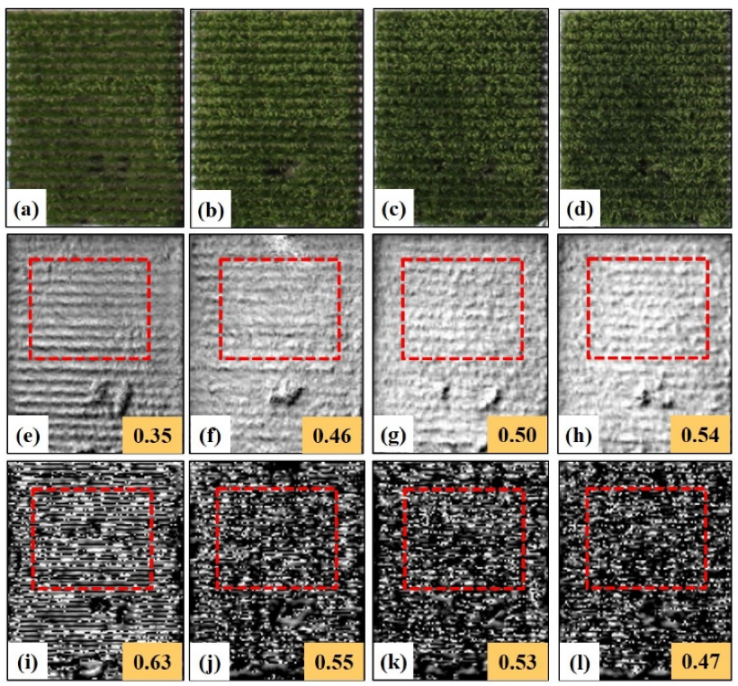
12], and texture metrics could characterize the spatial distribution of tonal variations caused by N status. The values of CON feature had a greater variation between jointing and booting stages than reflectance (Figure 6). Furthermore, VIs had weak capability in N status monitoring at reproductive stages due to the high canopy coverage [2]. However, leaf tone had a visual color change from the vegetative period to the reproductive period, and the values of CON and DIS were significantly different at reproductive stages (Figure 6). NDTI has a wider variation than NDRE at high N levels at late growth stages (Figure 7). Therefore, the N signal could also be detected by those texture metrics at the late growth stages.
Moreover, texture metrics have the capability of smoothing the spatial heterogeneity between vegetation and background materials with a sliding window [9,16]. Therefore, the complementary information between texture and VIs might be useful for solving the saturation problem and reducing background interference. Although a similar conclusion has been drawn by Yue et al. [7] and Zheng et al. [8] for AGB estimation, this study represents the first solid evidence on improving the estimation of N nutrition parameters, especially leaf and plant N concentrations.
Multi-source data fusion was commonly used in previous studies to improve the estimation of crop biomass [44,45,46]. For example, Yue et al. [45] improved wheat biomass estimation by combining VIs and plant height derived from crop surface models (CSMs), but the construction of CSMs was tedious and time consuming. Although the fusion of data from different platforms could also acquire higher estimation accuracy [44], the data (e.g., LiDAR data) processing needs more professional skill. However, UAV-based image texture and spectral data are more convenient to acquire over small fields. Furthermore, the fusion of texture and spectral data could improve the accuracy of N status estimation of multiple growth stages, which solves the problem that N status was often estimated at only one growth stage or a short time window [6,40]. Therefore, monitoring N status across the whole season could be realized through the integration of texture and spectral information into the crop growth monitoring systems.
There might be some concerns that it is challenging to build a universal model for predicting the N status of rice plants across the entire growing season [3]. With spectral information alone, VIs often exhibit weak capabilities of detecting N status at late growth stages due to the fact of crop senescence. Textural information could capture the variation of leaf color within and between plots, especially at the late stages when leaf color changes dramatically. However, our results demonstrated that the fusion of spectral and textural information could improve N status monitoring efficiently. Furthermore, the multivariate models for LNC and PNC were tested on different dataset groups with satisfactory validation performance (Table 8). The applicability of those models still needs to be improved through further testing with more datasets from different geographic sites.

4.4. Potentials for Other Platforms

In this study, we found the combination of spectral and texture information in NIR and RE bands was superior to that in other bands in rice N status monitoring. As for monitoring crop N status in large areas, satellite imagery has been widely used but with low estimation accuracy. That is because satellite imagery has low spatial resolution and low spectral resolution normally with blue, green, red and NIR wavebands. RapidEye is the first launched satellite with a RE band and successfully applied to many aspects of precision agriculture [47,48]. Other satellites with RE bands (e.g., Sentinel-2, WorldView-2, and Gaofen-6) have been launched and have yielded significant improvement in the estimation accuracy on agronomic variables [49,50]. These findings from satellite observations were consistent with our results that the RE-based VIs were superior to other indices.
To date, texture analysis on satellite imagery was mostly used for forest AGB [14,15,16]. Our findings provide a strong reference on crop N status with texture analysis of satellite images equipped with the RE band. However, in terms of spatial resolution and crop row spacing, the spatial resolution of satellite imagery (highest spatial resolution is 0.3 m by WorldView 3) is insufficient for distinguishing the narrow row spacing in cereal crops (e.g., rice, wheat). Furthermore, crops could be planted in multiple directions over large areas and the direction effect of texture metrics may not be significant in satellite images with lower spatial resolutions. Given the suitability of UAV platforms for small-scale applications for the moment, the direction of texture analysis could still exist in UAV imagery. When using texture analysis on row-planted vegetation (e.g., staple crops, vegetable crops, and fruit trees) at the farm level with high resolution images, it is still beneficial to take consideration of the direction effect for improved nitrogen nutrition monitoring.

5. Conclusions

We investigated the potential of texture analysis from UAV-based multispectral imagery for N status monitoring in terms of texture metrics, texture directions, and texture indices. For N concentration estimation, low estimation accuracies were obtained using VIs, individual texture metrics or texture indices alone. However, considerable improvements were achieved with the combination of VIs and texture indices. The multivariate models with fused information yielded the highest accuracy for LNC (RMSE = 0.22 and RRMSE = 9.70%) and PNC (RMSE = 0.19 and RRMSE = 15.34%). Moreover, the multivariate models exhibited high estimation accuracy when tested on dataset in different years and growth stages. For N accumulation estimation, NDRE yielded high estimation accuracies on LNA (RMSE = 1.35 g m−2 and RRMSE = 24.56%) and PNA (RMSE = 3.16 g m−2 and RRMSE = 32.20%). Compared with the models based on VIs or texture indices alone, the multivariate model also yielded higher accuracies for LNA (RMSE = 1.16 g m−2 and RRMSE = 21.04%) and PNA (RMSE = 2.38 g m−2 and RRMSE = 24.17%) estimation. When calculating the texture metrics, the across-row direction (D3) should be used for the best performance over row-planted crops instead of the default diagonal direction (D2). These findings could serve as useful references for deriving appropriate texture indices from multispectral UAV imagery for N nutrition monitoring. This study provides new insights on enhancing the N signals from rice canopies by adding the textural information to conventional VIs. It has great potential in conducting rapid, accurate monitoring of N status monitoring over other crops and developing effective practices of improved crop management.

Author Contributions

T.C., Y.Z. and W.C. conceived and designed the experiments; H.Z., J.M. and D.L. performed the experiments; H.Z. and M.Z. analyzed the data and wrote the original manuscript; X.Y., Y.Z., W.C. and T.C. reviewed and revised the manuscript. All authors have read and agreed to the published version of the manuscript.

Funding

This research was funded by grants from the National Key Research and Development Program of China (2016YFD0300601), China Postdoctoral Science Foundation (2019M651854), the Natural Science Fund of Jiangsu Province (SBK2019044119, BK20150663), the earmarked fund for Jiangsu Agricultural Industry Technology System (JATS[2018]290), the National Science Fund for Distinguished Young Scholars (31470084, 31725020), and the Priority Academic Program Development of Jiangsu Higher Education Institutions (PAPD).

Conflicts of Interest

The authors declare no conflict of interest.

References

  1. Ata-Ul-Karim, S.T.; Yao, X.; Liu, X.; Cao, W.; Zhu, Y. Development of critical nitrogen dilution curve of Japonica rice in Yangtze River Reaches. Field Crops Res. 2013, 149, 149–158. [Google Scholar] [CrossRef]
  2. Cao, Q.; Miao, Y.; Wang, H.; Huang, S.; Cheng, S.; Khosla, R.; Jiang, R. Non-destructive estimation of rice plant nitrogen status with Crop Circle multispectral active canopy sensor. Field Crops Res. 2013, 154, 133–144. [Google Scholar] [CrossRef]
  3. Prey, L.; Schmidhalter, U. Sensitivity of vegetation indices for estimating vegetative N status in winter wheat. Sensors 2019, 19, 3712. [Google Scholar] [CrossRef] [PubMed] [Green Version]
  4. Yao, Y.; Miao, Y.; Qiang, C.; Wang, H.; Gnyp, M.L.; Bareth, G.; Khosla, R.; Wen, Y.; Liu, F.; Cheng, L. In-season estimation of rice nitrogen status with an active crop canopy sensor. IEEE J. Sel. Top. Appl. Earth Obs. Remote Sens. 2014, 7, 4403–4413. [Google Scholar]
  5. Yu, K.; Li, F.; Gnyp, M.L.; Miao, Y.; Bareth, G.; Chen, X. Remotely detecting canopy nitrogen concentration and uptake of paddy rice in the Northeast China Plain. ISPRS J. Photogramm. Remote Sens. 2013, 78, 102–115. [Google Scholar] [CrossRef]
  6. Zhou, K.; Cheng, T.; Zhu, Y.; Cao, W.; Ustin, S.L.; Zheng, H.; Yao, X.; Tian, Y. Assessing the impact of spatial resolution on the estimation of leaf nitrogen concentration over the full season of paddy rice using near-surface imaging spectroscopy data. Front. Plant Sci. 2018, 9, 964. [Google Scholar] [CrossRef] [PubMed] [Green Version]
  7. Yue, J.; Yang, G.; Tian, Q.; Feng, H.; Xu, K.; Zhou, C. Estimate of winter-wheat above-ground biomass based on UAV ultrahigh-ground-resolution image textures and vegetation indices. ISPRS J. Photogramm. Remote Sens. 2019, SMC-3, 226–244. [Google Scholar] [CrossRef]
  8. Zheng, H.; Cheng, T.; Zhou, M.; Li, D.; Yao, X.; Tian, Y.; Cao, W.; Zhu, Y. Improved estimation of rice aboveground biomass combining textural and spectral analysis of UAV imagery. Precis. Agric. 2018, 20, 611–629. [Google Scholar] [CrossRef]
  9. Haralick, R.M.; Shanmugam, K. Textural features for image classification. IEEE Trans. Syst. Man Cybern. 1973, SMC-3, 610–621. [Google Scholar] [CrossRef] [Green Version]
  10. Dube, T.; Mutanga, O. Investigating the robustness of the new Landsat-8 Operational Land Imager derived texture metrics in estimating plantation forest aboveground biomass in resource constrained areas. ISPRS J. Photogramm. Remote Sens. 2015, 108, 12–32. [Google Scholar] [CrossRef]
  11. Yang, W.H.; Peng, S.; Huang, J.; Sanico, A.L.; Buresh, R.J.; Witt, C. Using leaf color charts to estimate leaf nitrogen status of rice. Agron. J. 2003, 95, 212–217. [Google Scholar]
  12. Singh, B.; Singh, Y.; Ladha, J.K.; Bronson, K.F.; Balasubramanian, V.; Singh, J.; Khind, C.S. Chlorophyll meter– and leaf color chart–based nitrogen management for rice and wheat in northwestern India. Agron. J. 2002, 94, 821–829. [Google Scholar] [CrossRef]
  13. Chen, D.; Stow, D.A.; Gong, P. Examining the effect of spatial resolution and texture window size on classification accuracy: an urban environment case. Int. J. Remote Sens. 2004, 25, 2177–2192. [Google Scholar] [CrossRef]
  14. Kelsey, K.C.; Neff, J.C. Estimates of aboveground biomass from texture analysis of Landsat imagery. Remote Sens. 2014, 6, 6407–6422. [Google Scholar] [CrossRef] [Green Version]
  15. Hlatshwayo, S.T.; Mutanga, O.; Lottering, R.T.; Kiala, Z.; Ismail, R. Mapping forest aboveground biomass in the reforested Buffelsdraai landfill site using texture combinations computed from SPOT-6 pan-sharpened imagery. Int. J. Appl. Earth Obs. Geoinf. 2019, 74, 65–77. [Google Scholar] [CrossRef]
  16. Sarker, L.R.; Nichol, J.E. Improved forest biomass estimates using ALOS AVNIR-2 texture indices. Remote Sens. Environ. 2011, 115, 968–977. [Google Scholar] [CrossRef]
  17. Zheng, H.; Cheng, T.; Li, D.; Zhou, X.; Yao, X.; Tian, Y.; Cao, W.; Zhu, Y. Evaluation of RGB, color-infrared and multispectral images acquired from unmanned aerial systems for the estimation of nitrogen accumulation in rice. Remote Sens. 2018, 10, 824. [Google Scholar] [CrossRef] [Green Version]
  18. Smith, G.M.; Milton, E.J. The use of the empirical line method to calibrate remotely sensed data to reflectance. Int. J. Remote Sens. 1999, 20, 2653–2662. [Google Scholar] [CrossRef]
  19. Lu, D.; Batistella, M. Exploring TM image texture and its relationships with biomass estimation in Rondônia, Brazilian Amazon. Acta Amaz. 2005, 35, 249–257. [Google Scholar] [CrossRef]
  20. Tucker, C.J. Red and photographic infrared linear combinations for monitoring vegetation. Remote Sens. Environ. 1979, 8, 127–150. [Google Scholar] [CrossRef] [Green Version]
  21. Gitelson, A.A.; Kaufman, Y.J.; Stark, R.; Rundquist, D. Novel algorithms for remote estimation of vegetation fraction. Remote Sens. Environ. 2002, 80, 76–87. [Google Scholar] [CrossRef] [Green Version]
  22. Louhaichi, M.; Borman, M.M.; Johnson, D.E. Spatially located platform and aerial photography for documentation of grazing impacts on wheat. Geocarto Int. 2001, 16, 65–70. [Google Scholar] [CrossRef]
  23. Dash, J.; Curran, P.J. The MERIS terrestrial chlorophyll index. Int. J. Remote Sens. 2004, 25, 5403–5413. [Google Scholar] [CrossRef]
  24. Gitelson, A.A.; Andrés, V.; Verónica, C.; Rundquist, D.C.; Arkebauer, T.J. Remote estimation of canopy chlorophyll content in crops. Geophys. Res. Lett. 2005, 32, 93–114. [Google Scholar] [CrossRef] [Green Version]
  25. Barnes, E.M.; Clarke, T.R.; Richards, S.E.; Colaizzi, P.D.; Haberland, J.; Kostrzewski, M.; Waller, P.; Choi, C.; Riley, E.; Thompson, T. Coincident detection of crop water stress, nitrogen status and canopy density using ground-based multispectral data. In Proceedings of the International conference on precision agriculture and other resource management, Bloomington, MN, USA, 16–19 July 2000. [Google Scholar]
  26. Rouse, J.W.; Haas, R.W.; Schell, J.A.; Deering, D.W.; Harlan, J.C. Monitoring the vernal advancement and retrogradation (Greenwave effect) of natural vegetation; NASA/GSFCT Type III final report.; Nasa: Washinton, DC, USA, 1974. [Google Scholar]
  27. Roujean, J.L.; Breon, F.M. Estimating PAR absorbed by vegetation from bidirectional reflectance measurements. Remote Sens. Environ. 1995, 51, 375–384. [Google Scholar] [CrossRef]
  28. Rondeaux, G.; Steven, M.; Baret, F. Optimization of soil-adjusted vegetation indices. Remote Sens. Environ. 1996, 55, 95–107. [Google Scholar] [CrossRef]
  29. Haboudane, D.; Miller, J.R.; Pattey, E.; Zarco-Tejada, P.J.; Strachan, I.B. Hyperspectral vegetation indices and novel algorithms for predicting green LAI of crop canopies: Modeling and validation in the context of precision agriculture. Remote Sens. Environ. 2004, 90, 337–352. [Google Scholar] [CrossRef]
  30. Curran, P.J. Remote sensing of foliar chemistry. Remote Sens. Environ. 1990, 30, 271–278. [Google Scholar] [CrossRef]
  31. Li, D.; Wang, X.; Zheng, H.; Zhou, K.; Yao, X.; Tian, Y.; Zhu, Y.; Cao, W.; Cheng, T. Estimation of area- and mass-based leaf nitrogen contents of wheat and rice crops from water-removed spectra using continuous wavelet analysis. Plant Methods 2018, 14, 76. [Google Scholar] [CrossRef]
  32. Hatfield, J.; Gitelson, A.A.; Schepers, J.S.; Walthall, C. Application of spectral remote sensing for agronomic decisions. Agron. J. 2008, 100, 117–131. [Google Scholar] [CrossRef] [Green Version]
  33. Lemaire, G.; Jeuffroy, M.-H.; Gastal, F. Diagnosis tool for plant and crop N status in vegetative stage: Theory and practices for crop N management. Eur. J. Agron. 2008, 28, 614–624. [Google Scholar] [CrossRef]
  34. Thenkabail, P.S.; Smith, R.B.; Pauw, E.D. Hyperspectral vegetation indices and their relationships with agricultural crop characteristics. Remote Sens. Environ. 2000, 71, 158–182. [Google Scholar] [CrossRef]
  35. Yao, X.; Zhu, Y.; Tian, Y.C.; Feng, W.; Cao, W.X. Exploring hyperspectral bands and estimation indices for leaf nitrogen accumulation in wheat. Int. J. Appl. Earth Obs. Geoinf. 2010, 12, 89–100. [Google Scholar] [CrossRef]
  36. Zhu, Y.; Yao, X.; Tian, Y.; Liu, X.; Cao, W. Analysis of common canopy vegetation indices for indicating leaf nitrogen accumulations in wheat and rice. Int. J. Appl. Earth Obs. Geoinf. 2008, 10, 1–10. [Google Scholar] [CrossRef]
  37. Tian, Y.; Yao, X.; Yang, J.; Cao, W.; Hannaway, D.; Zhu, Y. Assessing newly developed and published vegetation indices for estimating rice leaf nitrogen concentration with ground-and space-based hyperspectral reflectance. Field Crops Res. 2011, 120, 299–310. [Google Scholar] [CrossRef]
  38. Stroppiana, D.; Boschetti, M.; Brivio, P.A.; Bocchi, S. Plant nitrogen concentration in paddy rice from field canopy hyperspectral radiometry. Field Crops Res. 2009, 111, 119–129. [Google Scholar] [CrossRef]
  39. Li, F.; Miao, Y.; Hennig, S.D.; Gnyp, M.L.; Chen, X.; Jia, L.; Bareth, G. Evaluating hyperspectral vegetation indices for estimating nitrogen concentration of winter wheat at different growth stages. Precis. Agric. 2010, 11, 335–357. [Google Scholar] [CrossRef]
  40. Xue, L.; Cao, W.; Luo, W.; Dai, T.; Zhu, Y. Monitoring leaf nitrogen status in rice with canopy spectral reflectance. Agron. J. 2004, 96, 135–142. [Google Scholar] [CrossRef]
  41. Lelong, C.C.; Burger, P.; Jubelin, G.; Roux, B.; Labbé, S.; Baret, F. Assessment of unmanned aerial vehicles imagery for quantitative monitoring of wheat crop in small plots. Sensors 2008, 8, 3557–3585. [Google Scholar] [CrossRef]
  42. Cao, Q.; Miao, Y.; Shen, J.; Yu, W.; Yuan, F.; Cheng, S.; Huang, S.; Wang, H.; Yang, W.; Liu, F. Improving in-season estimation of rice yield potential and responsiveness to topdressing nitrogen application with Crop Circle active crop canopy sensor. Precis. Agric. 2016, 17, 136–154. [Google Scholar] [CrossRef]
  43. Wang, L.; Tian, Y.; Yao, X.; Zhu, Y.; Cao, W. Predicting grain yield and protein content in wheat by fusing multi-sensor and multi-temporal remote-sensing images. Field Crops Res. 2014, 164, 178–188. [Google Scholar] [CrossRef]
  44. Tilly, N.; Aasen, H.; Bareth, G. Fusion of plant height and vegetation indices for the estimation of barley biomass. Remote Sens. 2015, 7, 11449–11480. [Google Scholar] [CrossRef] [Green Version]
  45. Yue, J.; Yang, G.; Li, C.; Li, Z.; Wang, Y.; Feng, H.; Xu, B. Estimation of winter wheat above-ground biomass using unmanned aerial vehicle-based snapshot hyperspectral sensor and crop height improved models. Remote Sens. 2017, 9, 708. [Google Scholar] [CrossRef] [Green Version]
  46. Bendig, J.; Yu, K.; Aasen, H.; Bolten, A.; Bennertz, S.; Broscheit, J.; Gnyp, M.L.; Bareth, G. Combining UAV-based plant height from crop surface models, visible, and near infrared vegetation indices for biomass monitoring in barley. Int. J. Appl. Earth Obs. Geoinf. 2015, 39, 79–87. [Google Scholar] [CrossRef]
  47. Kross, A.; Mcnairn, H.; Lapen, D.; Sunohara, M.; Champagne, C. Assessment of RapidEye vegetation indices for estimation of leaf area index and biomass in corn and soybean crops. Int. J. Appl. Earth Obs. Geoinf. 2015, 34, 235–248. [Google Scholar] [CrossRef] [Green Version]
  48. Magney, T.S.; Eitel, J.U.H.; Vierling, L.A. Mapping wheat nitrogen uptake from RapidEye vegetation indices. Precis. Agric. 2017, 18, 429–451. [Google Scholar] [CrossRef]
  49. Battude, M.; Bitar, A.A.; Morin, D.; Cros, J.; Huc, M.; Sicre, C.M.; Dantec, V.L.; Demarez, V. Estimating maize biomass and yield over large areas using high spatial and temporal resolution Sentinel-2 like remote sensing data. Remote Sens. Environ. 2016, 184, 668–681. [Google Scholar] [CrossRef]
  50. Huang, S.; Miao, Y.; Yuan, F.; Gnyp, M.; Yao, Y.; Cao, Q.; Wang, H.; Lenzwiedemann, V.; Bareth, G. Potential of RapidEye and WorldView-2 satellite data for improving rice nitrogen status monitoring at different growth stages. Remote Sens. 2017, 9, 227. [Google Scholar] [CrossRef] [Green Version]
Figure 1. Relationships of NDRE with N nutrition parameters: leaf N concentration (a), leaf N accumulation (b), plant N concentration (c), and plant N accumulation (d). The dashed line represents the best-fit function for the data point in each plot. All regressions are statistically significant (p < 0.0001).
Remotesensing 12 00957 g001
Figure 2. Relationships (R2) between N nutrition parameters and texture metrics in different directions: leaf N concentration (a), leaf N accumulation (b), plant N concentration (c), and plant N accumulation (d). Texture metrics were ordered in five spectral bands (1–4: blue, 5–8: green, 9–12: red, 13–16: RE and 17–20: NIR) with four texture metrics (MEA, CON, DIS, and COR).
Remotesensing 12 00957 g002
Figure 3. Relationships between the optimal texture indices and N nutrition parameters: leaf N concentration (a), leaf N accumulation (b), plant N concentration (c), and plant N accumulation (d). The dashed line represents the best-fit function for the data point in each plot. All regressions are statistically significant (p < 0.0001).
Remotesensing 12 00957 g003
Figure 4. Validation results of LNC (ac) and PNC (df) estimation using VI (a,d), NDTI (b,e), and their combination (c,f).
Remotesensing 12 00957 g004
Figure 5. False color image (a) and sketch map of 3 × 3 moving windows in different directions (D1 = 0°, D2 = 45°, D3 = 90°, D4 = 135°) for dense canopy (b) and sparse canopy (c) plots.
Remotesensing 12 00957 g005
Figure 6. Reflectance images of the NIR band and four corresponding texture metrics calculated in the direction D3 at different growth stages. Note that the number on the lower right corner of each image represents the average of all pixel values. The columns from left to right correspond to reflectance, MEA, CON, DIS, and COR. The rows from top to bottom correspond to jointing, booting, late-booting, and grain filling stages.
Remotesensing 12 00957 g006
Figure 7. RGB images and corresponding NDRE and NDTI (DISB4_D3, CORB5_D3) images at different N levels at grain filling stage. Note that the numbers on the lower right corner are the mean values of all pixels in the red rectangle in each image. The columns from left to right correspond to N0 (LNC = 1.37), N1 (LNC = 1.81), N2 (LNC = 2.05), and N3 (LNC = 2.07) levels. The rows from top to bottom correspond to RGB, NDRE, and NDTI images.
Remotesensing 12 00957 g007
Table 1. Experimental designs and dates of data collection on the ground.
Year20152016
N rate (kg ha−1)0 (N0), 100 (N1), 200 (N2), 300 (N3)0 (N0), 150 (N1), 300 (N2)
Planting density (plants ha−1)13 × 104, 22 × 10413 × 104, 22 × 104
UAV flight date5 August, 14 August, 26 August, 9 September6 August, 14 August, 28 August, 9 September
Sampling date31 July, 15 August, 26 August, 10 September6 August, 14 August, 28 August, 8 September
Growth stageJointing, Early-booting, Late-booting, Grain fillingJointing, Booting, Heading, Grain filling
Table 2. List of vegetation indices (VIs) used in this study.
IndexFormulaReference
Color indices Normalized green red difference index (NGRDI) N G R D I = ( R 550 R 680 ) / ( R 550 + R 680 ) [20]
Visible atmospherically resistance index (VARI) V A R I = ( R 550 R 680 ) / ( R 550 + R 680 R 490 ) [21]
Green leaf index (GLI) G L I = ( 2 R 550 R 680 R 490 ) / ( 2 R 550 + R 680 + R 490 ) [22]
RE indicesMERIS terrestrial chlorophyll index M T C I = ( R 800 R 720 ) / ( R 720 + R 680 ) [23]
red edge chlorophyll index (CIRE) C I R E = R 800 / R 720 1 [24]
Normalized difference red edge index (NDRE) N D R E = ( R 800 R 720 ) / ( R 800 + R 720 ) [25]
NIR indicesNormalized difference vegetation index (NDVI) N D V I = ( R 800 R 680 ) / ( R 800 + R 680 ) [26]
Renormalized difference vegetation index (RDVI) R D V I = ( R 800 R 680 ) / ( R 800 + R 680 ) [27]
Optimized soil adjusted vegetation index (OSAVI) O S A V I = ( 1 + 0.16 ) ( R 800 R 680 ) / ( R 800 + R 680 + 0.16 ) [28]
Modified triangular vegetation index 2 (MTVI2) M T V I 2 = 1.5 [ 1.2 ( R 800 R 550 ) 2.5 ( R 670 R 550 ) ] ( 2 R 800 + 1 ) 2 ( 6 R 800 5 R 670 ) 0.5 [29]
The bands used in the formula corresponded to the bands in the multispectral imagery.
Table 3. Relationships (R2) among different N nutrition parameters.
LDBAGBLNCLNAPNCPNA
LDB1.00
AGB0.551.00
LNC0.200.001.00
LNA0.910.350.461.00
PNC0.130.020.780.341.00
PNA0.810.710.190.770.131.00
LDB is leaf dry biomass, AGB is aboveground biomass, LNC is leaf nitrogen concentration, LNA is leaf nitrogen accumulation, PNC is plant nitrogen concentration, PNA is plant nitrogen accumulation. Bold numbers indicate values over 0.70.
Table 4. Coefficient of determination (R2) values for the relationships between VIs and N nutrition parameters in rice.
LNC (%)LNA (g m−2)PNC (%)PNA (g m−2)
VILELELELE
NGRDI0.00ns0.00ns0.24***0.27***0.00ns0.01ns0.33***0.40***
VARI0.00ns0.00ns0.32***0.34***0.00ns0.00ns0.33***0.41***
GLI0.01ns0.01ns0.12***0.15***0.03*0.05***0.26***0.32***
MTCI0.17***0.16***0.73***0.68***0.12***0.10***0.66***0.62***
CIRE0.20***0.20***0.77***0.72***0.15***0.13***0.68***0.65***
NDRE0.20***0.19***0.74***0.77***0.14***0.13***0.68***0.73***
NDVI0.03*0.03*0.39***0.47***0.02*0.01ns0.44***0.63***
RDVI0.07***0.07***0.44***0.50***0.06***0.05***0.60***0.72***
OSAVI0.07***0.06***0.45***0.52***0.06***0.05***0.58***0.73***
MTVI20.06***0.06***0.45***0.46***0.05***0.04**0.59***0.66***
The numbers in bold correspond to the best-fit function for each N nutrition parameter. Significance level: “ns” represents no significance, * p < 0.01, ** p < 0.001, *** p < 0.0001. “L” and “E” indicate linear and exponential regression.
Table 5. Relationships (R2) between N nutrition parameters and the top four best-performing texture indices.
NDTI1NDTI2NDTI3NDTI4
LNC (%)(DISB5_D4, CONB4_D3)(DISB4_D2, CORB5_D3)(DISB4_D3, CORB5_D2)(DISB4_D3, CORB5_D3)
R20.310.300.300.29
LNA (g m−2)(MEAB5_D3, MEAB4_D4)(MEAB5_D3, MEAB4_D3)(MEAB5_D4, MEAB4_D4)(MEAB5_D4, MEAB4_D3)
R20.720.720.720.72
PNC (%)(DISB4_D3, CORB5_D3)(DISB5_D4, CONB4_D3)(CONB4_D3, CORB5_D2)(DISB4_D4, CORB5_D3)
R20.410.380.370.36
PNA (g m−2)(MEAB5_D3, MEAB2_D4)(MEAB5_D4, MEAB2_D4)(MEAB5_D3, MEAB2_D3)(MEAB5_D4, MEAB2_D3)
R20.750.750.750.75
All regressions are statistically significant (p < 0.0001).
Table 6. Stepwise multiple linear regression output for the relationship between each of the four N nutrition parameters and the best combination of vegetation and textural indices.
R2Variables and InterceptBpTolVIF
LNC (%)0.70Intercept1.0220.00
NDTI(DISB4_D2, CORB5_D3)−0.4500.000.9311.074
NDRE2.2560.000.1606.264
NDTI(MEAB5_D4, MEAB2_D4)−1.3920.000.1616.217
LNA (g m−2)0.85Intercept0.1730.00
NDRE5.0440.000.3323.009
NGRDI−1.1200.000.3203.121
NDTI(DISB4_D3, CORB5_D3)−0.4640.000.7721.296
PNC (%)0.68Intercept0.4970.00
NDTI(DISB4_D3, CORB5_D3)−0.6460.000.7791.284
NDTI(MEAB5_D3, MEAB4_D3)2.3160.000.2104.757
NDTI(MEAB5_D4, MEAB2_D4)−1.4850.000.2174.604
PNA (g m−2)0.86Intercept−0.4980.00
NDTI(MEAB5_D3, MEAB2_D4)3.4540.000.2743.644
MTVI22.6210.000.4052.470
NGRDI−1.8500.000.2963.384
VIF and Tol indicate variance inflation factor and tolerance.
Table 7. Accuracy assessment with RMSE and RRMSE values for the estimation of N nutrition parameters with different predictor variables.
Predictor VariableLNC (%)LNA (g m−2)PNC (%)PNA (g m−2)
RMSERRMSERMSERRMSERMSERRMSERMSERRMSE
VI0.3515.28%1.3524.56%0.3124.78%3.1632.20%
NDTI0.3214.24%1.5427.91%0.2620.67%3.3333.90%
NDTI+VI0.22 9.70%1.1621.04%0.19 15.34%2.38 24.17%
Table 8. Accuracy assessment with RMSE and RE values for the optimal multivariate models of LNC and PNC on different dataset groups.
YearStageLNC (%)PNC (%)
RMSERRMSERMSERRMSE
2015Jointing0.2711.03%0.2719.95%
Early-booting0.229.48%0.2014.09%
Late-booting0.2510.95%0.1915.65%
Filling0.189.45%0.1214.58%
All0.2310.41%0.2016.82%
2016Jointing0.176.95%0.1811.55%
Booting0.2610.83%0.2014.27%
Heading0.177.15%0.2217.80%
Filling0.2210.72%0.1211.21%
All0.218.99%0.1813.93%

