Breeding Colony Dynamics of Southern Elephant Seals at Patelnia Point, King George Island, Antarctica


1
Institute of Biochemistry and Biophysics, Polish Academy of Sciences, Pawińskiego 5A, 02-106 Warsaw, Poland
2
Faculty of Animal Breeding, Bioengineering and Conservation, Warsaw University of Life Sciences—SGGW, Nowoursynowska 166, 02-787 Warsaw, Poland
*
Author to whom correspondence should be addressed.
Remote Sens. 2020, 12(18), 2964; https://doi.org/10.3390/rs12182964
Submission received: 23 July 2020
/
Revised: 31 August 2020
/
Accepted: 9 September 2020
/
Published: 11 September 2020
(This article belongs to the Special Issue Applications of UAVs in Cold Region Ecological and Environmental Studies)
Abstract
:During the 2019 breeding season (October-December), a battery-powered DIJ Inspire 2 drone was used to investigate a breeding southern elephant seal colony located at Patelnia Point (ASPA 128, King George Island, South Shetland Islands, maritime Antarctica). Twelve unmanned aerial vehicle (UAV) missions conducted 50–70 m above ground level (AGL) were completed to monitor the breeding ground with a maximum of 0.348 km2. The missions were planned in Pix4D Capture software. A drone, with the support of ground cameras and observations, was used to derive population counts, map harems, and track the phenology of the southern elephant seals. Based on data obtained from the UAV missions, orthophotomaps were created in PIX4D Mapper and then analyzed in QGIS. Calculated values of body size parameters such as body length and orthogonal body surface area were used to determine the age and sex of individuals. Analysis of the ranges of the harems on particular days, supported by an analysis of land conditions that generate physical barriers to the movement of animals, allowed zones in which the transformations of groups of harems took place to be determined. The hypothesized hermeticity of the designated zones was supported by statistical tests. The use of drones allows for comprehensive population analyses of the breeding colonies of elephant seals such as censuses of pups and adult individuals, determination of the sex ratio, and spatial analysis of the distribution of breeding formations. In addition, it allows for a more accurate result than ground counting.
1. Introduction
The southern elephant seal is the most studied pinniped species in Antarctica [1] and is divided into four genetically distinct populations: those from South Georgia, the Valdes Peninsula, Kerguelen, and Macquarie Island [2,3]. The first three populations are stable or increasing [4], while the last population is decreasing [5]. Hindell et al. [4] recognized 17 subpopulations within these four populations. The statuses of three subpopulations are unknown including that from the South Shetland Islands.
Southern elephant seals on the South Shetland Islands have been found breeding only on King George Island [6], Livingston Island [7], and Nelson Island [8]. On the western shore of Admiralty Bay (Antarctic Specially Protected Area (ASPA) No. 128, Figure 1C), counts have been performed irregularly over the last 45 years, with the greatest continuity from 1988–2000 [9]. At Stranger Point (ASPA No. 132, Figure 1B), censuses were conducted only between 1980 and 1988 [10] and in 1999 [11]. Further research focused mainly on the sex structure and physiology of southern elephant seals at Stranger Point [12,13,14,15] and in two additional areas on King George Island (ASPA Nos. 128 and 151, Figure 1B), where southern elephant seals are known to occur during the breeding period.
Importantly, sex ratios strongly influence the population viability of polygynous species, and such data may be used as an early indicator of population decline [16]. For example, the lack of male southern elephant seals on Marion Island was hypothesized to be a reason for the population decline [17]. There are significant differences in the harem sex ratio among populations; for instance, on Sea Lion Island, the ratio is 1♂:14♀ [18]; on Kerguelen Island, the ratio is 1♂:30♀ [19]; and at Stranger Point (ASPA No. 132), the ratio is 1♂:38♀ [10]. McMahon and Bradshaw [20] highlighted that the probability of pup survival depends on the age of the females and their previous breeding experience. The survival probability is also dependent on the environment in which the pups are born. The same researchers suggested that larger and more stable harems have significantly better breeding [20]. Since such data are lacking for the colony located at Patelnia Point, we propose improving the observations of southern elephant seals in that location by using select remote sensing methods, i.e., unmanned aerial vehicle (UAV) flights and time-lapse photography, which should facilitate the determination of the number of individuals, population age structure, harem density and location in association with land cover, particularly in nearly inaccessible locations.
Remote sensing methods are well-developed tools used in ecology [21,22] at both low [23] and high [24] latitudes. In Antarctica, UAV flights have mainly been used to assess the population size of penguins and pinnipeds [24,25,26,27,28]. Ground photogrammetry [29] and satellite images [30,31] have also been successfully used in Antarctica and on sub-Antarctic islands to support regular ecological monitoring and animal identification. Goebel et al. [28] was one of the first researchers to use drones to estimate the size of individual leopard seals (Hydrurga leptonyx) and suggested that aerial photogrammetry can also be used to estimate the mass of the animals. On the other hand, Adame et al. [32] used UAVs to categorize (sex and age) California sea lions (Zalophus californianus) and claimed that traditional, boat-based counts may underestimate abundance and influence categorization uncertainty. Lowry [33] and Hodgson et al. [34] argued that, in contrast to ground count data, data from manned [33] and unmanned [34] aerial images provide a permanent record. Such material may be re-examined years after collection for error checking and re-counting of monitored individuals using new detection methods that are likely to emerge in the future [33,34].
In this study, the use of drones was supplemented by ground counting by observers and ground photogrammetry. Thus, the goals were to (1) derive population counts, map harems, and track the phenology of the southern elephant seal breeding colony at Patelnia Point, western shore of Admiralty Bay, based on data from UAV missions; (2) propose a tool that allows more efficient measurements of the seals’ body size via drone and, based on these measurements, estimates of the age and phenological cycle stage of females; and (3) trace the spatial relationships between harems on consecutive days, taking the terrain conditions into account.
2. Materials and Methods
2.1. Study Area
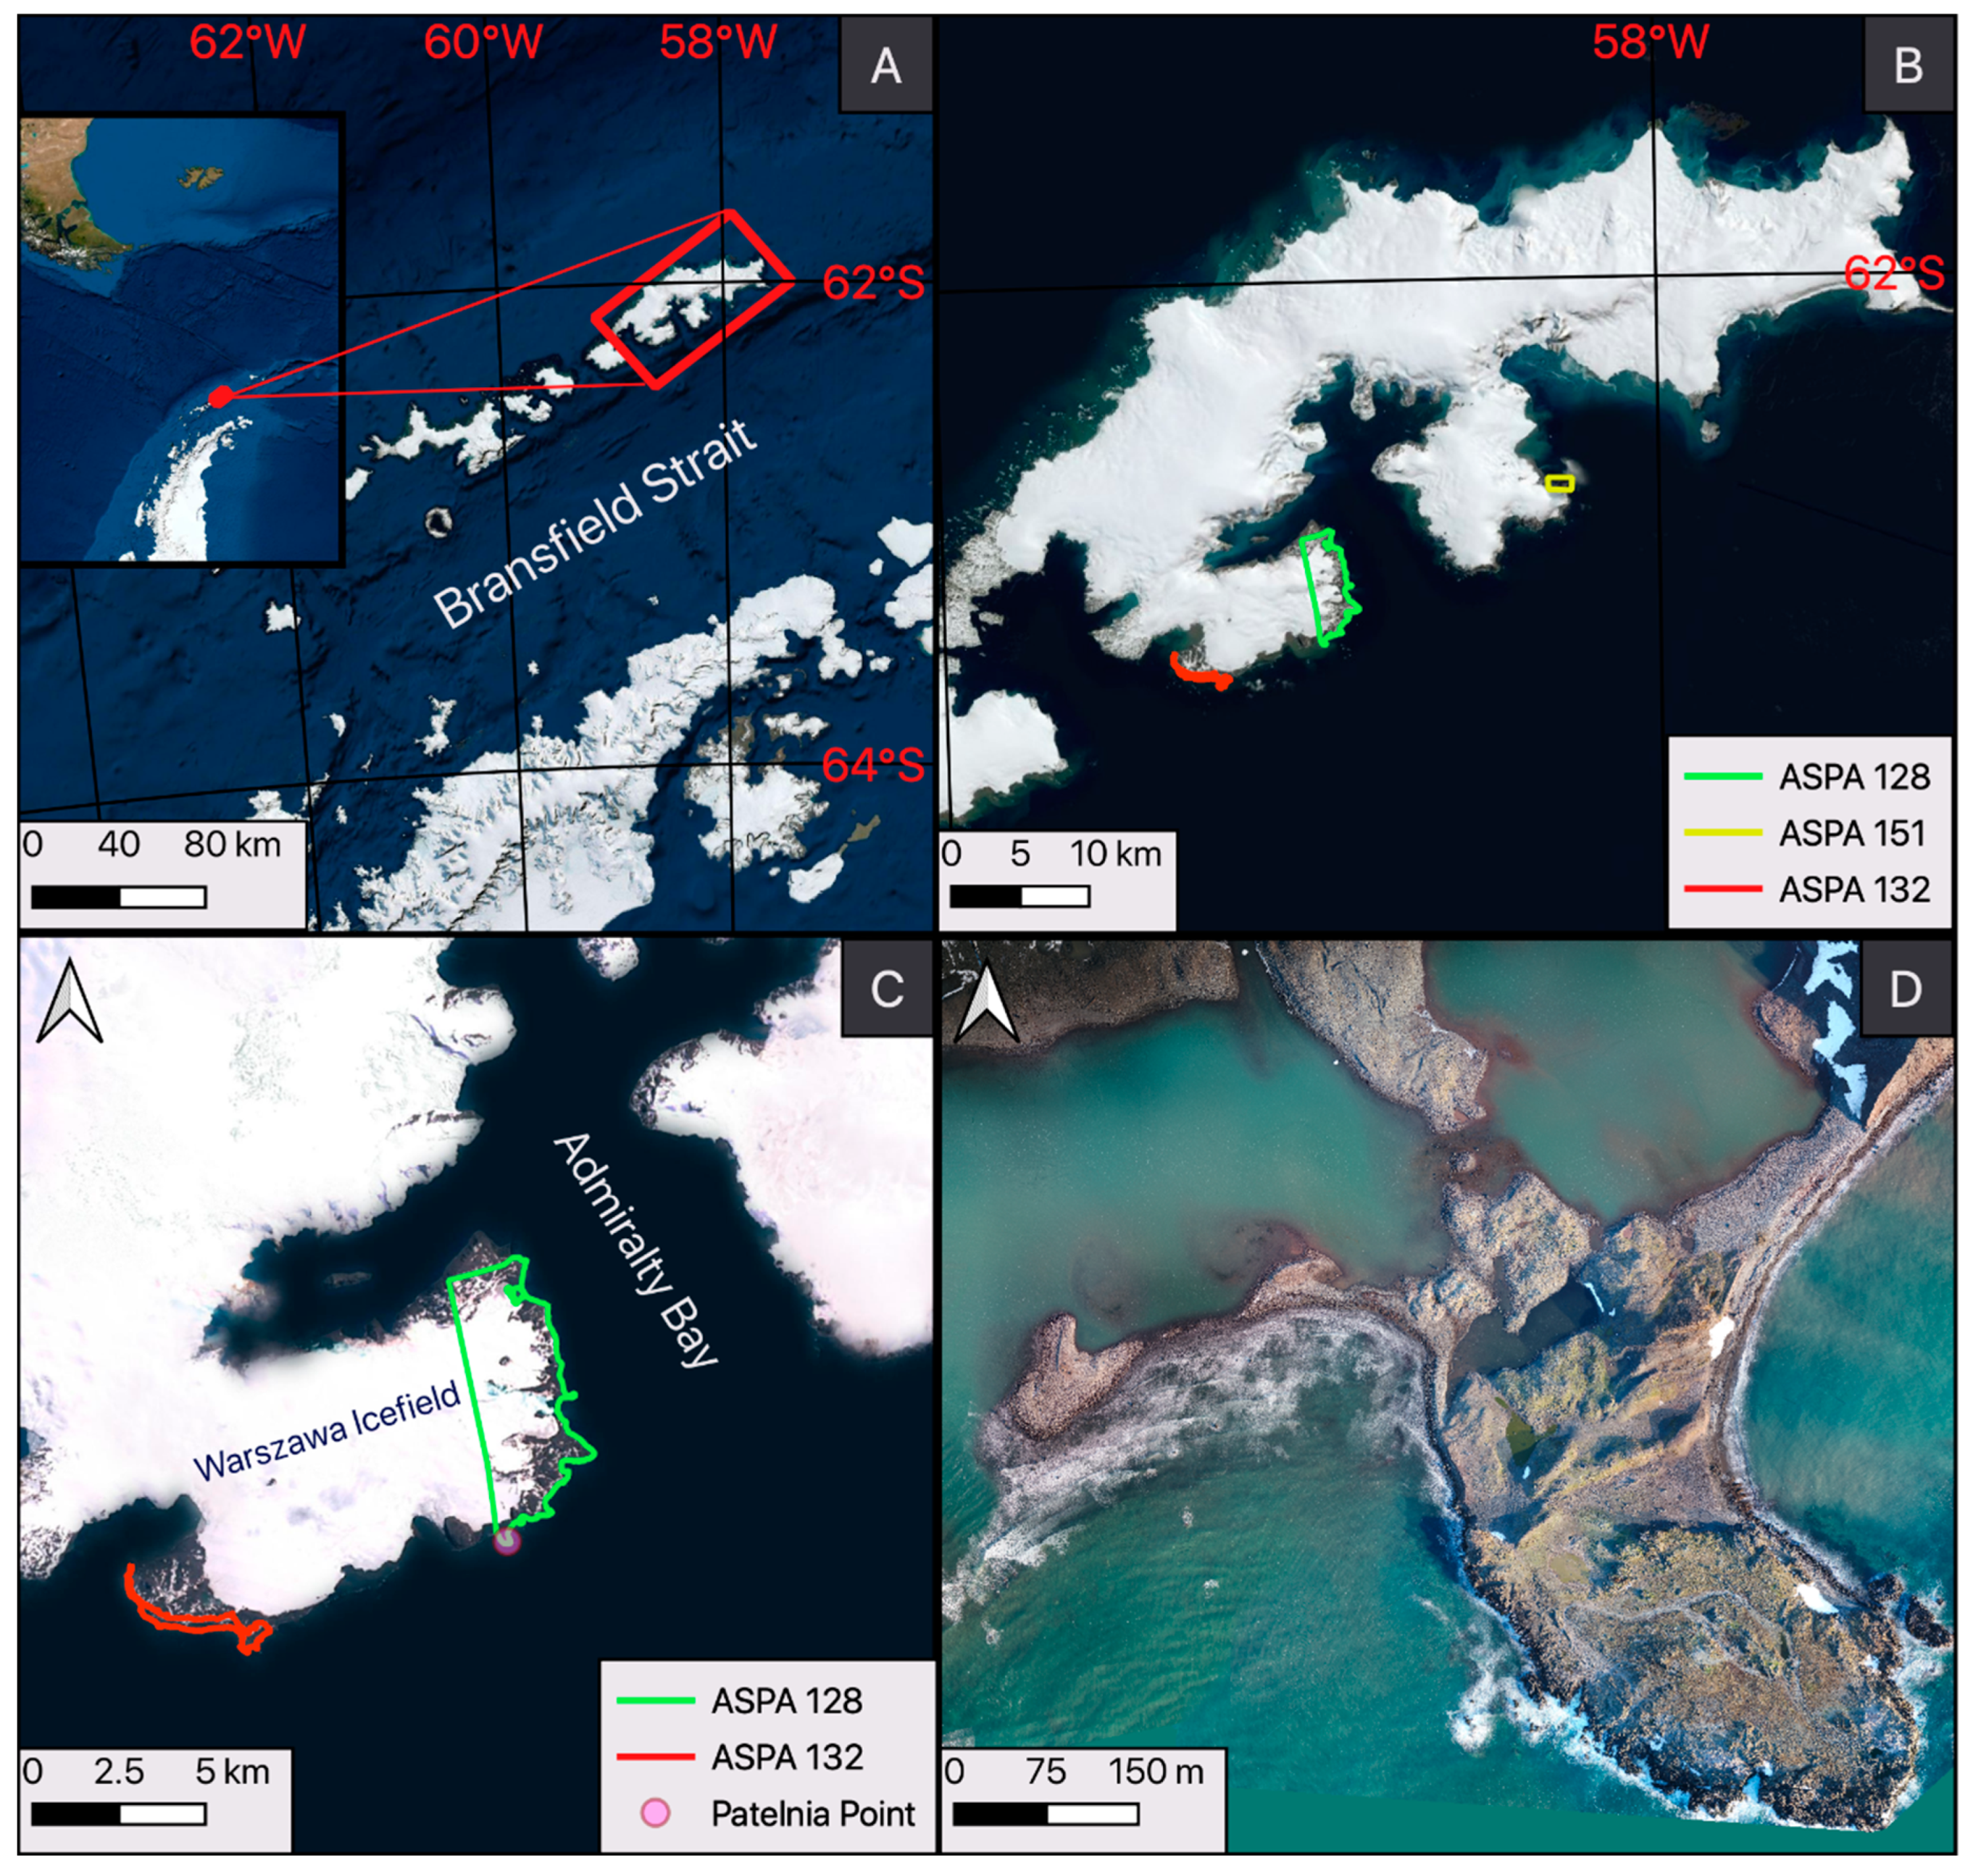
King George Island (Figure 1A), which is nearly 90% covered by an icecap [35], is the largest of the South Shetland Islands and is located approximately 125 km north of the Antarctic Peninsula. The island is separated from the peninsula by Bransfield Strait. ASPA No. 128, which was established to protect breeding colonies of birds and pinnipeds, is located on the western shore of Admiralty Bay, which is in the central part of the island. The southern boundary of the area is called Patelnia Point (58°28′28″W, 62°14′03″S, Figure 1D), where the southern elephant seals’ breeding colony has been observed since 1978 [36]. Patelnia is located approximately 9 km from the Arctowski Polish Antarctic Station along the straight line through the Warszawa Icefield (Figure 1C). However, as shown in Figure 1D, although the location has the characteristics of a peninsula and is surrounded by the waters of Bransfield Strait, its noticeable glaciers and weather conditions make it very difficult to access. Notably, the first southern elephant seal bull usually appears at Patelnia Point in September, when the waters of Admiralty Bay are covered with patches of sea ice and temperatures remain well below 0 °C, with average values of −3.9 °C and −1.7 °C in September and October (according to measurements from 2013–2017), respectively [37].
2.2. Unmanned Aerial Vehicle (UAV) Flight Parameters
Twelve missions were carried out autonomously from October 13 until December 6, 2019, using a quadcopter Inspire 2 with a Zenmuse X5S 20.8 MP camera (DJI MFT 15 mm/1.7 ASPH lens with a 30-mm-equivalent focal length; DJI, Shenzhen, Guangdong, China). The mission path was programmed in Pix4D Capture (Pix4D S.A., Prilly, Switzerland). The flights were at least 50 m above ground level (AGL) and usually performed at 65 m to follow the environmental guidelines for the operation of UAVs over mammals on land in Antarctica recommended by Mustafa et al. [38] and Harris et al. [39]. This flight height allowed images with an average of 1.38 cm pixels to be obtained and, according to Mustafa et al. [26], provides a 100% detection rate for southern elephant seals. The largest mission area over Patelnia was 0.348 km2, with a total flight time of 75 min. Flight specifications, which varied due to weather conditions, sea water tides, or ice cover of the water surface, are presented for each mission in Table 1.
2.3. Time-Lapse Photography and Ground Counts
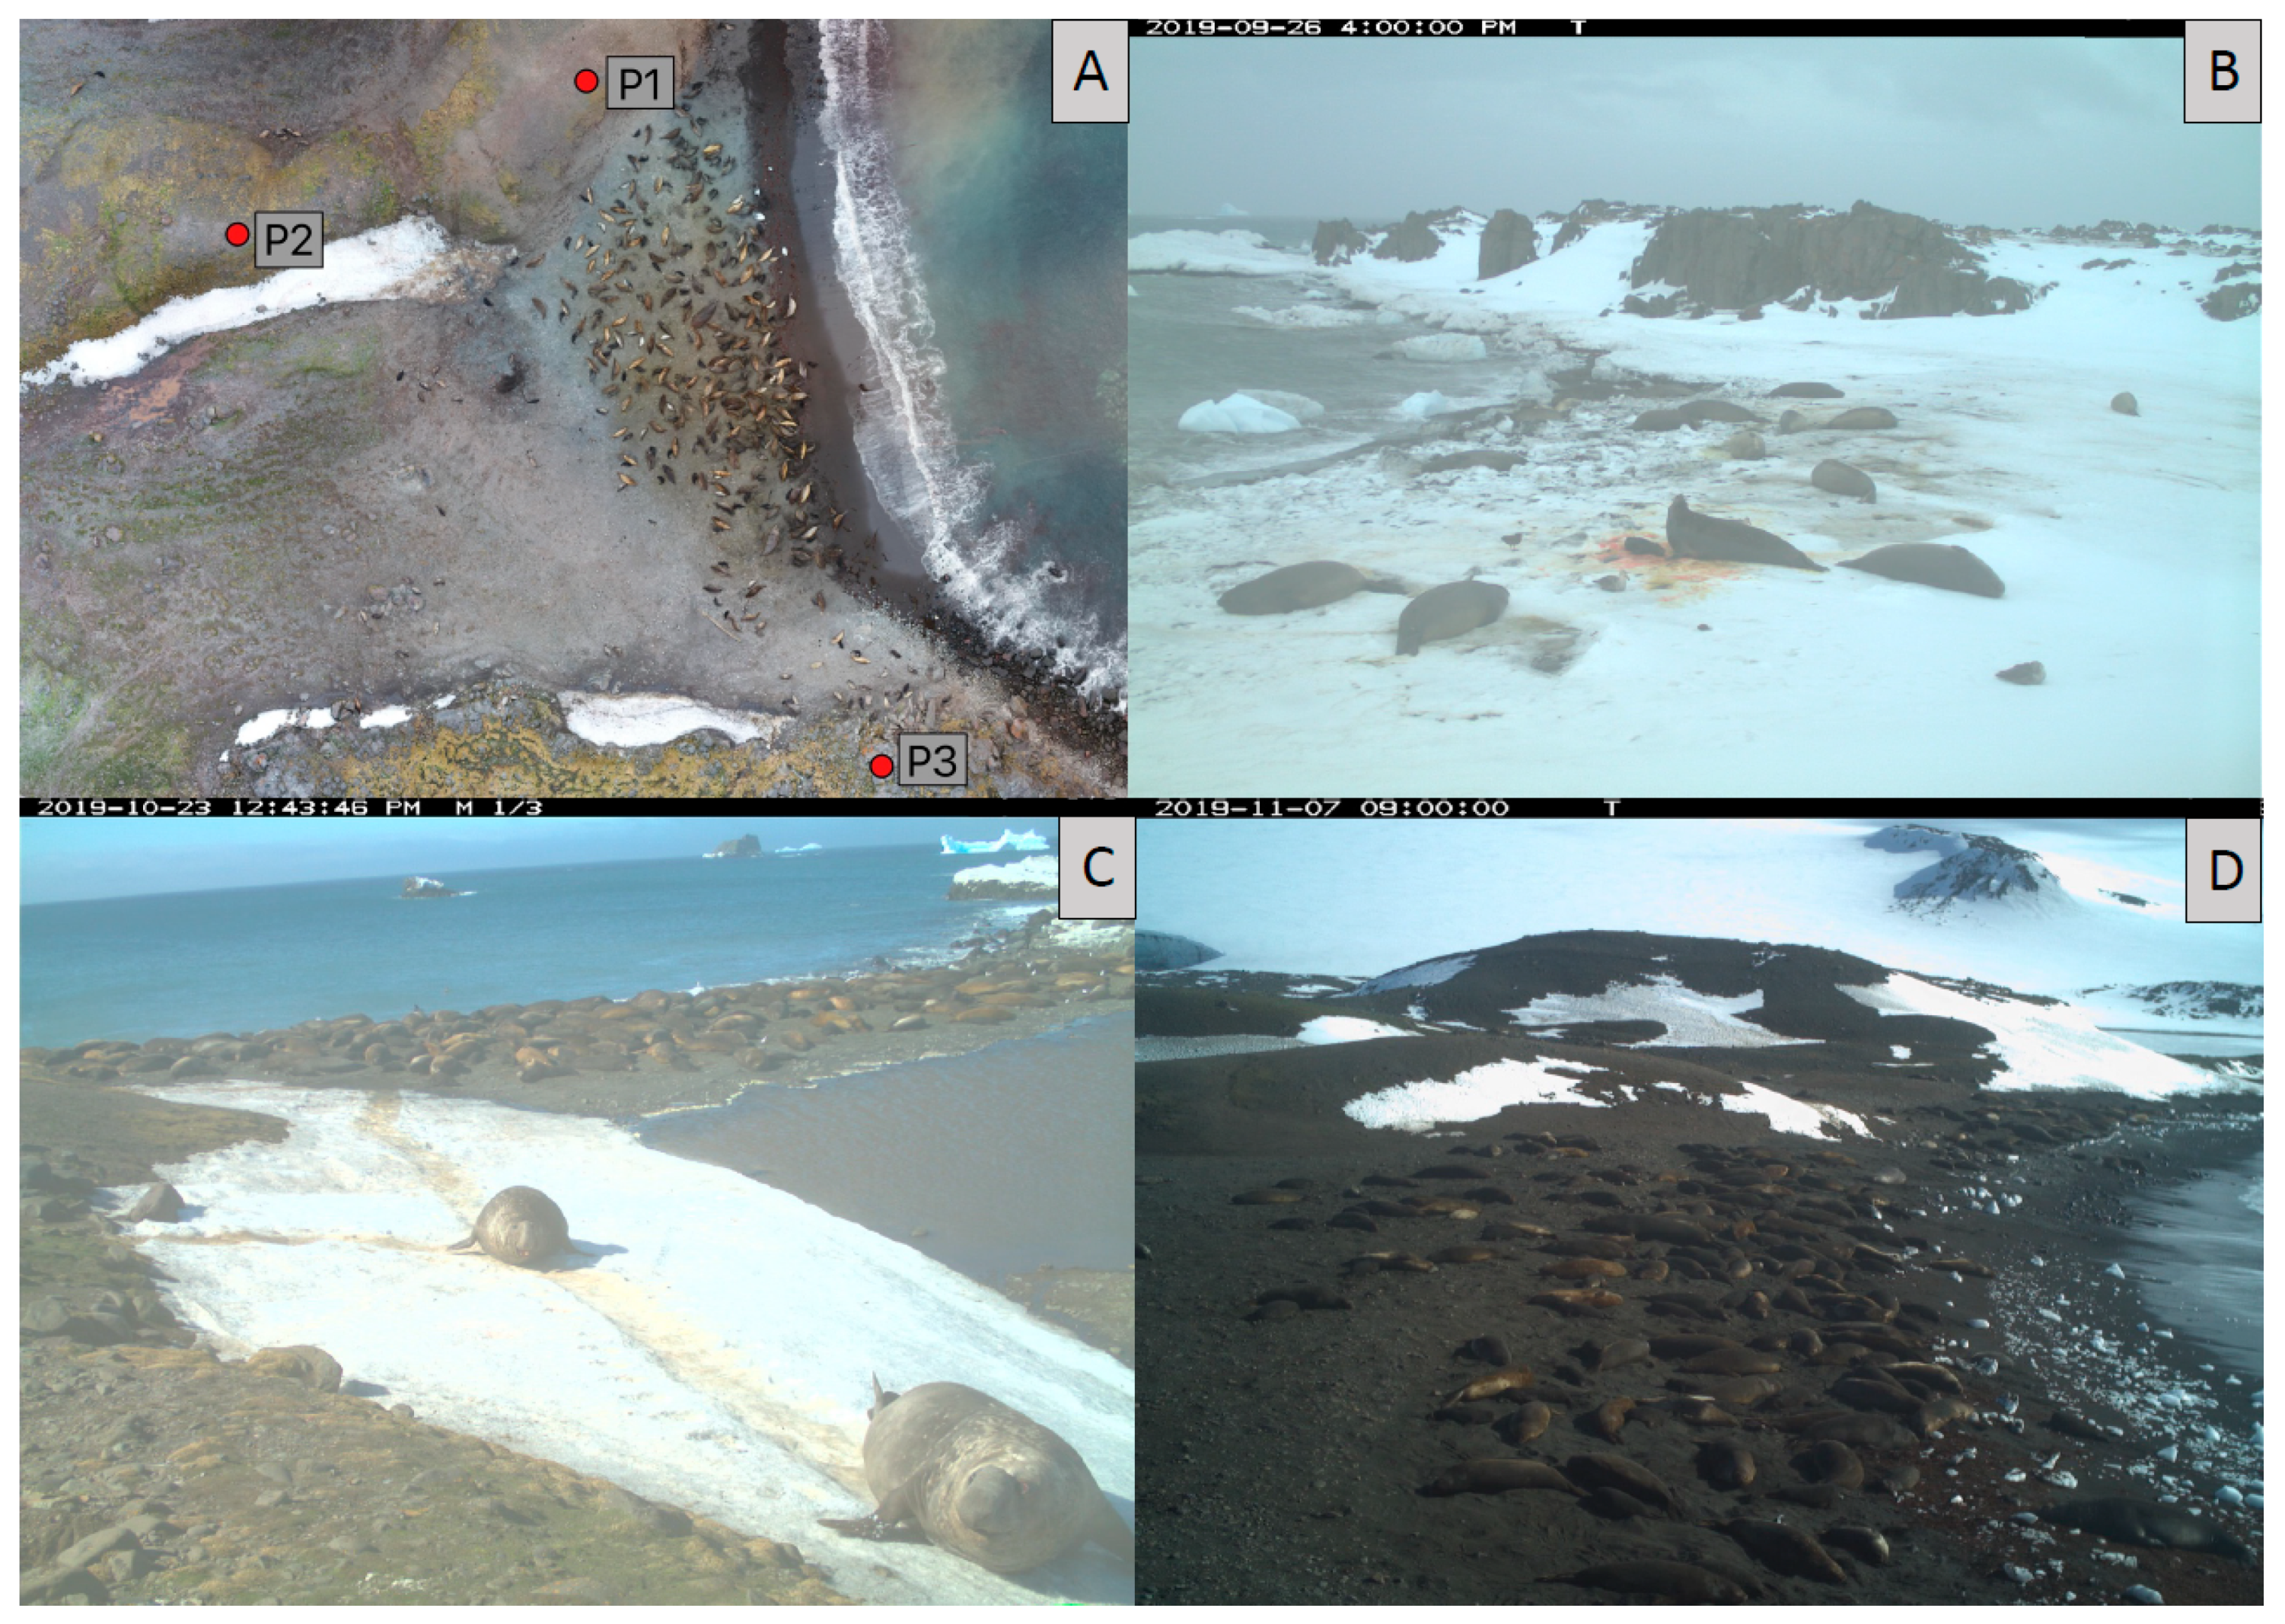
Three HP2X Hyperfire 2 cameras (Reconyx, USA) were used for continuous monitoring of the largest harem with high-definition images. The first camera (P1, Figure 2) was mounted before the haul-out in August 2019. Notably, the tripod was destroyed by weather conditions on October 8; a new location was chosen for mounting this trap, and two additional locations were chosen on October 15. These cameras were active until the end of the breeding season. The locations of cameras and example photos taken by the cameras are presented in Figure 2. The devices were installed in an area located at a higher ground level than the breeding ground. Two different camera recording modes were selected, namely, P1 and P3 recorded with a time-lapse interval of 0.5 h, which provided continuous documentation of harem dynamics and registration of shoreline conditions. The P2 camera set in motion sensor recording mode documented the area preceding the main harem. Thus, it was possible to determine the stages important for phenological cycle chronology and the number of individuals, especially during the harem’s initiation and formation periods. Counting based on one selected ground camera image was performed by three independent observers. For data verification, ground counts of individuals were made by at least two observers in the field. The ground counting performed by independent observers was repeated until the difference between the results did not exceed 5%. The results presented in Table 2 are the average values of these counts. Ground observations were made on September 14 and 23; October 1, 11, 17, and 24; November 1, 16, and 26; and December 6.
2.4. Image Processing and Statistical Analysis
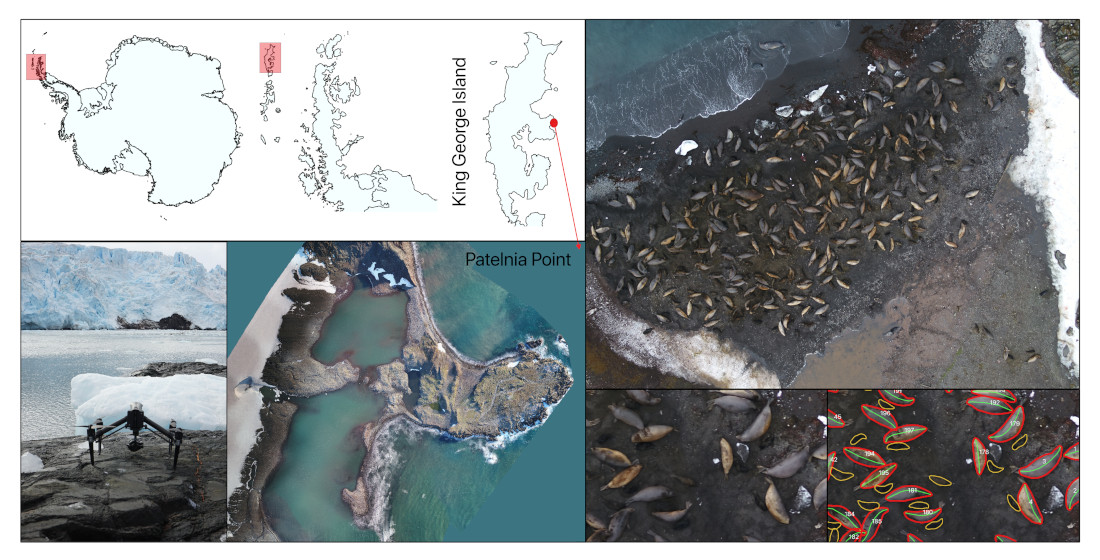
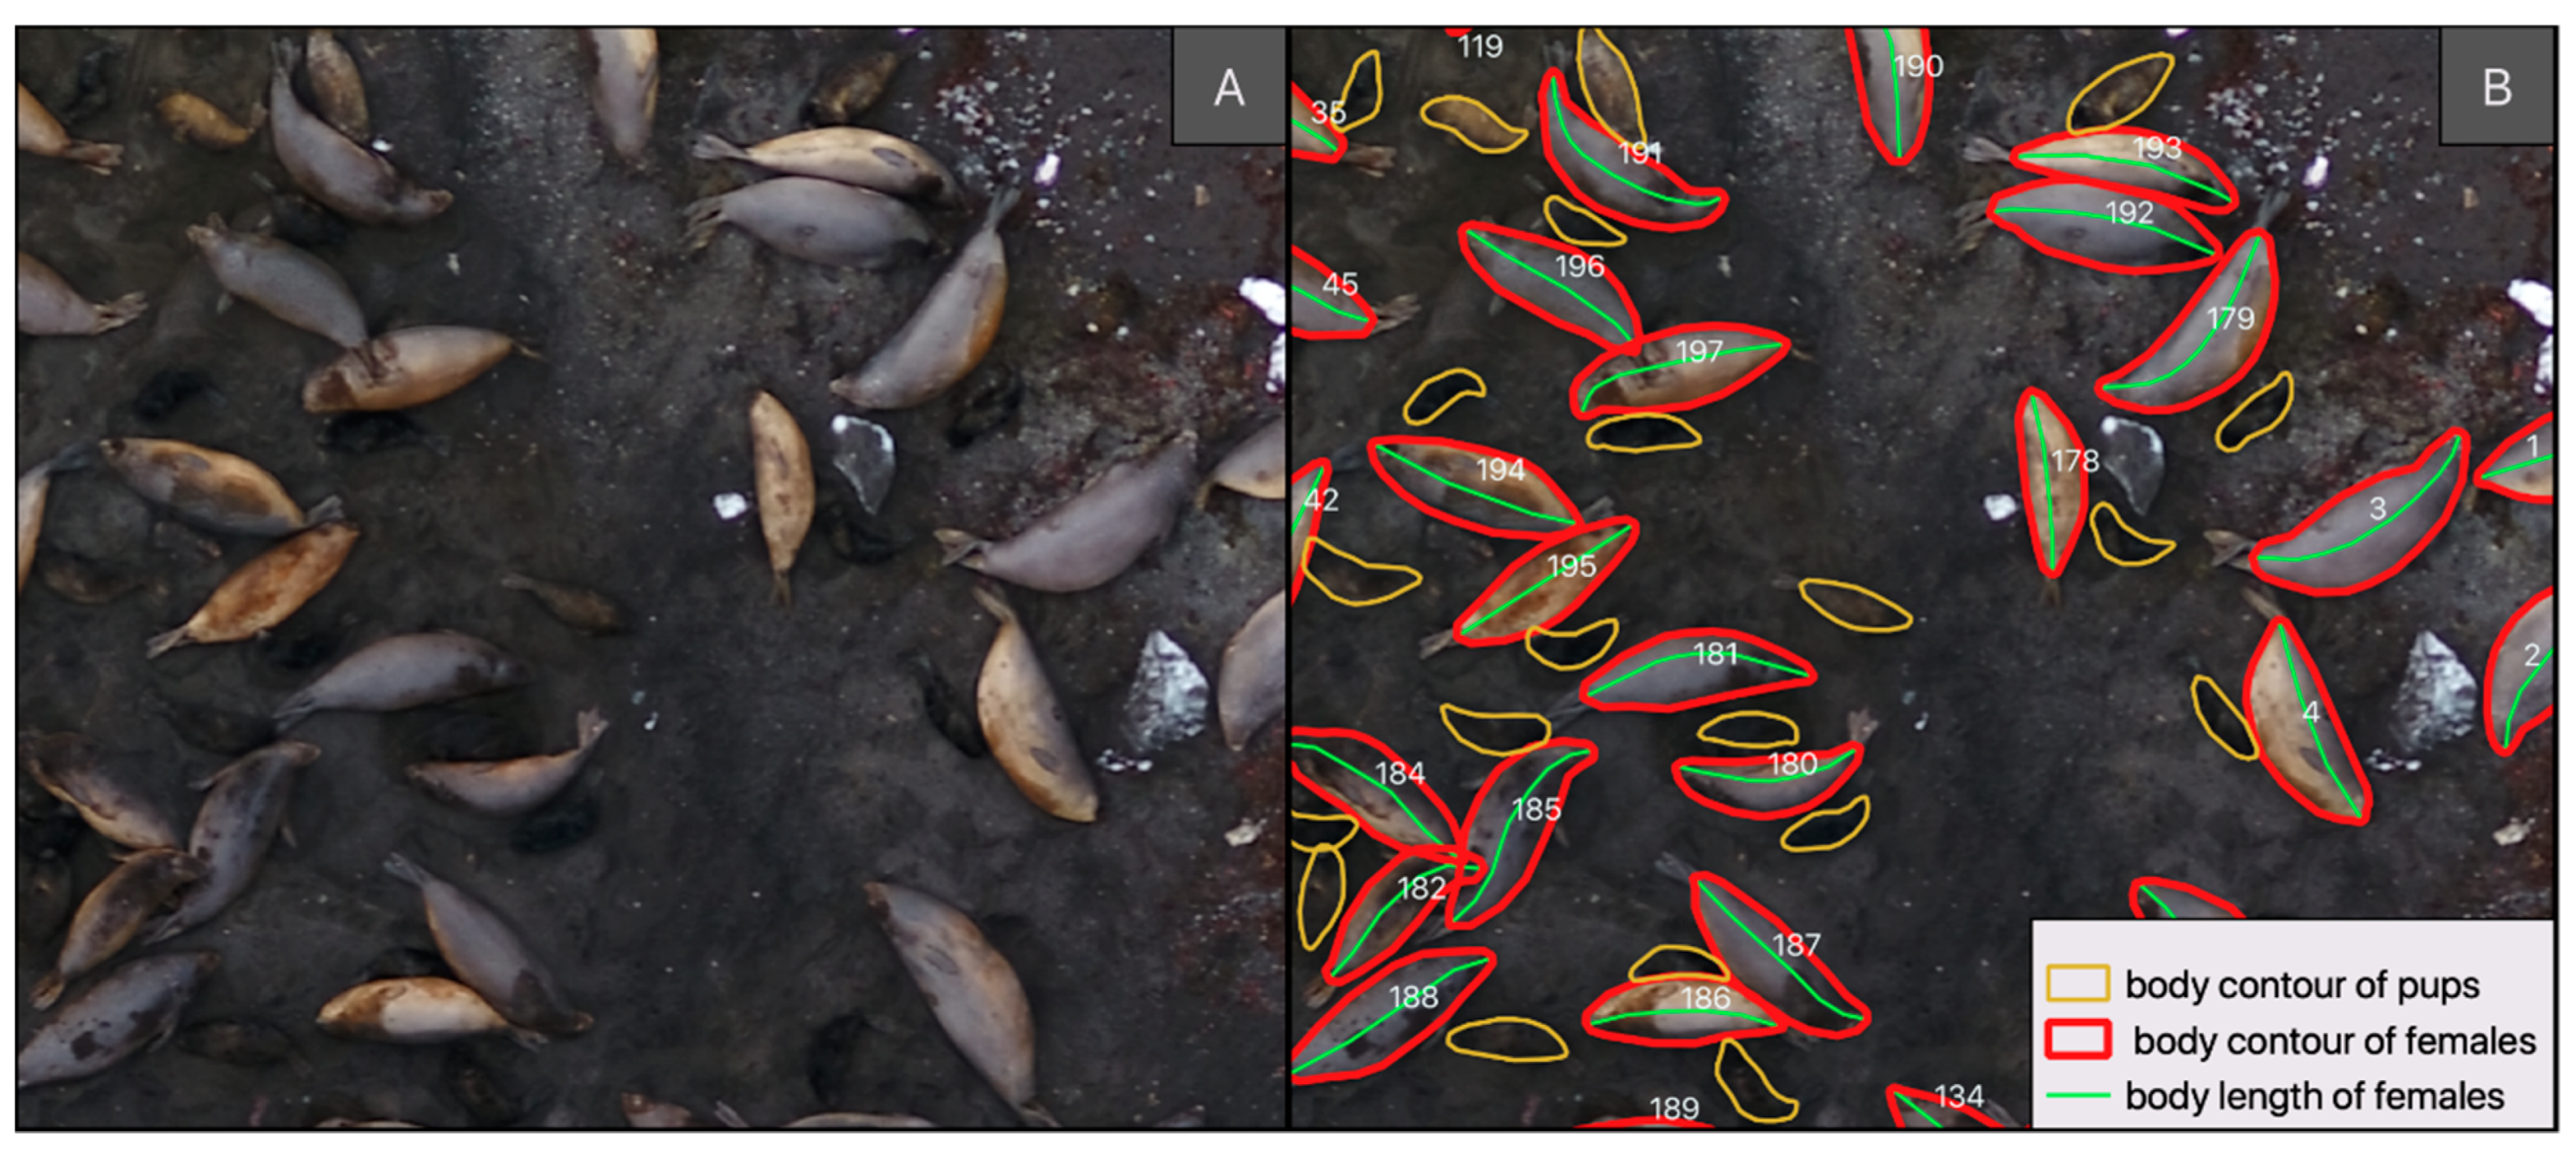
Pix4D Mapper (Pix4D S.A., Prilly, Switzerland) was used to prepare orthomosaics as GeoTIFF files, and then the number of individual southern elephant seals in each harem was calculated manually using QGIS software (QGIS version 3.10.1, OSGeo). Then, for each individual on each day, the body contour area was calculated with the QGIS Geometry function $area, and body length (from nose tip to tail tip) was calculated with the QGIS Geometry function $length. An example of obtaining individual parameters is presented in Figure 3. Virtual measurements of body length were performed separately for each individual due to variation in body positioning. Eleven ground control surfaces (GCSs, i.e., stones and boxes) with known dimensions located in different parts of Patelnia Point were used to determine the accuracy of our measurements. For each day, the length and width of GCSs were measured from the obtained orthomosaic, and then, the root mean square error (RMSE) was determined, which was 0.012 m.
To show the statistically significant differences in body surface area and body length in each zone between the consecutive days and differences in body surface area and body length between zones for different days and to compare calculation precision among the three independent observers as suggested by Krause et al. [40], one-way analysis of variance (ANOVA) was performed separately for each dataset. Three types of post-hoc tests, namely, Tukey’s, Tamhane’s, and Fisher’s least significant difference, were carried out, depending on adherence to ANOVA test assumptions. To check the variance homogeneity of the analyzed data, Levene’s test was used, and to check whether these data were normally distributed, the Shapiro–Wilk test was performed. In addition, a Chi-squared test was used to check group equality, which is required to select a post-hoc test. Details of the statistical analysis are presented in Table A1 in Appendix A.
According to the definition adopted in this paper, a harem of southern elephant seals is a group of individuals consisting of at least two females, one unweaned pup, and one bull, and for which the distance between females does not exceed three body lengths of the concerned female, and the distance between the male and the female group does not exceed three body lengths of the concerned male, unless photo analysis clearly indicates that the male chases another male from his area of influence. To standardize the harem’s contouring scheme, the following rules for establishing an outline were adopted: the line constituting the contour of an individual reproductive formation recognized as a harem contains a margin allowing animals located on the edge of the group to potentially rotate 360 degrees around the axis of their body, where the tip of the nose is the pivot point. Objects such as rocks or blocks of ice, inaccessible to animals as a potential laying ground are excluded from the outline margin. The high variability and dynamics of the harem as a spatial unit, to which specific individuals are assigned, led us to designate zones in which the individuals belonging to the land division unit were relatively invariable. After overlapping the contours of the harems made according to the previously adopted rules based on the definition of a harem from all days, four distinct zones with harem transformations and potential exchange of individuals were selected. Terrain conditions (especially terrain obstacles obstructing the migration route of animals) and field observations were considered. The zone boundary covered an area of approximately three female body lengths (median value from our measurements) from the external outline of the harem included in the zone. All zones were considered individually. To facilitate graphical visualization of the designated zones they are presented as rectangles.
3. Results
According to the data from the ground cameras, the first bull appeared at the shore on September 11 and was followed by another challenger, which was recognized in a photo on September 13. The first female came ashore on September 14, and after four days of female absence, the presence of another female on September 18 was noted. On September 19, three females were present in the main harem, and from that date, their number increased. The first pup was born on September 26. Until October 1, only one harem was formed, which reached 50 females on that day.
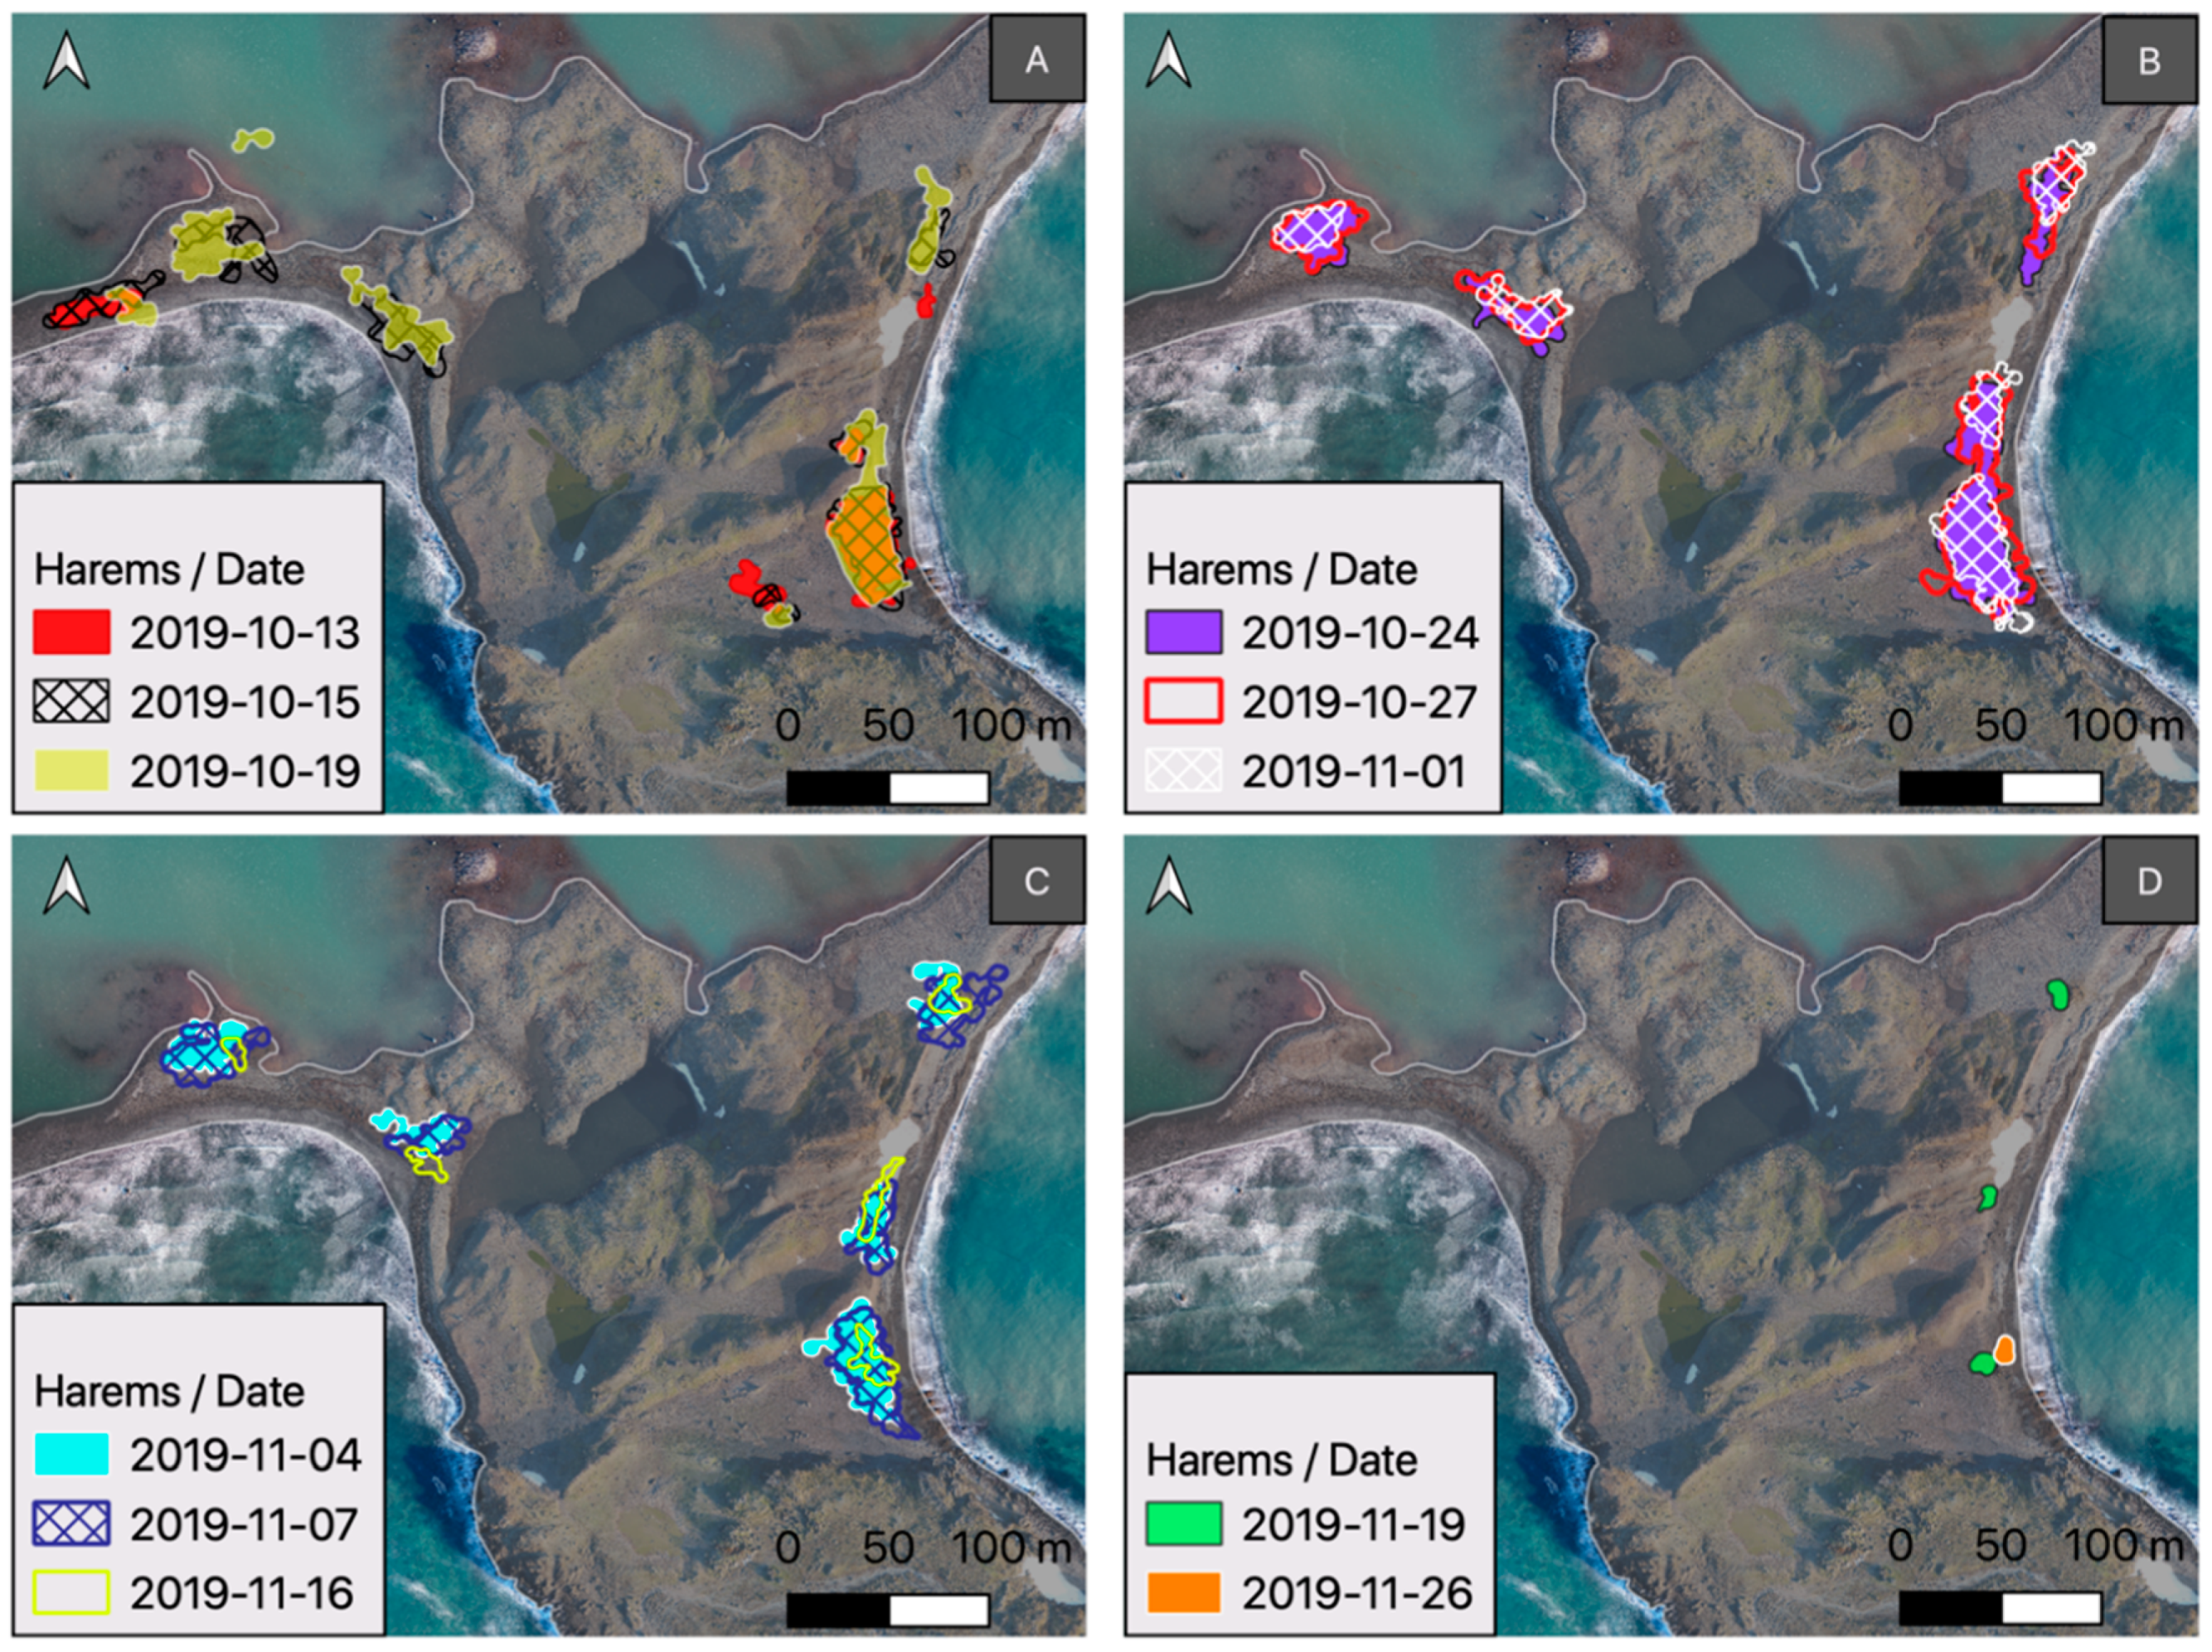
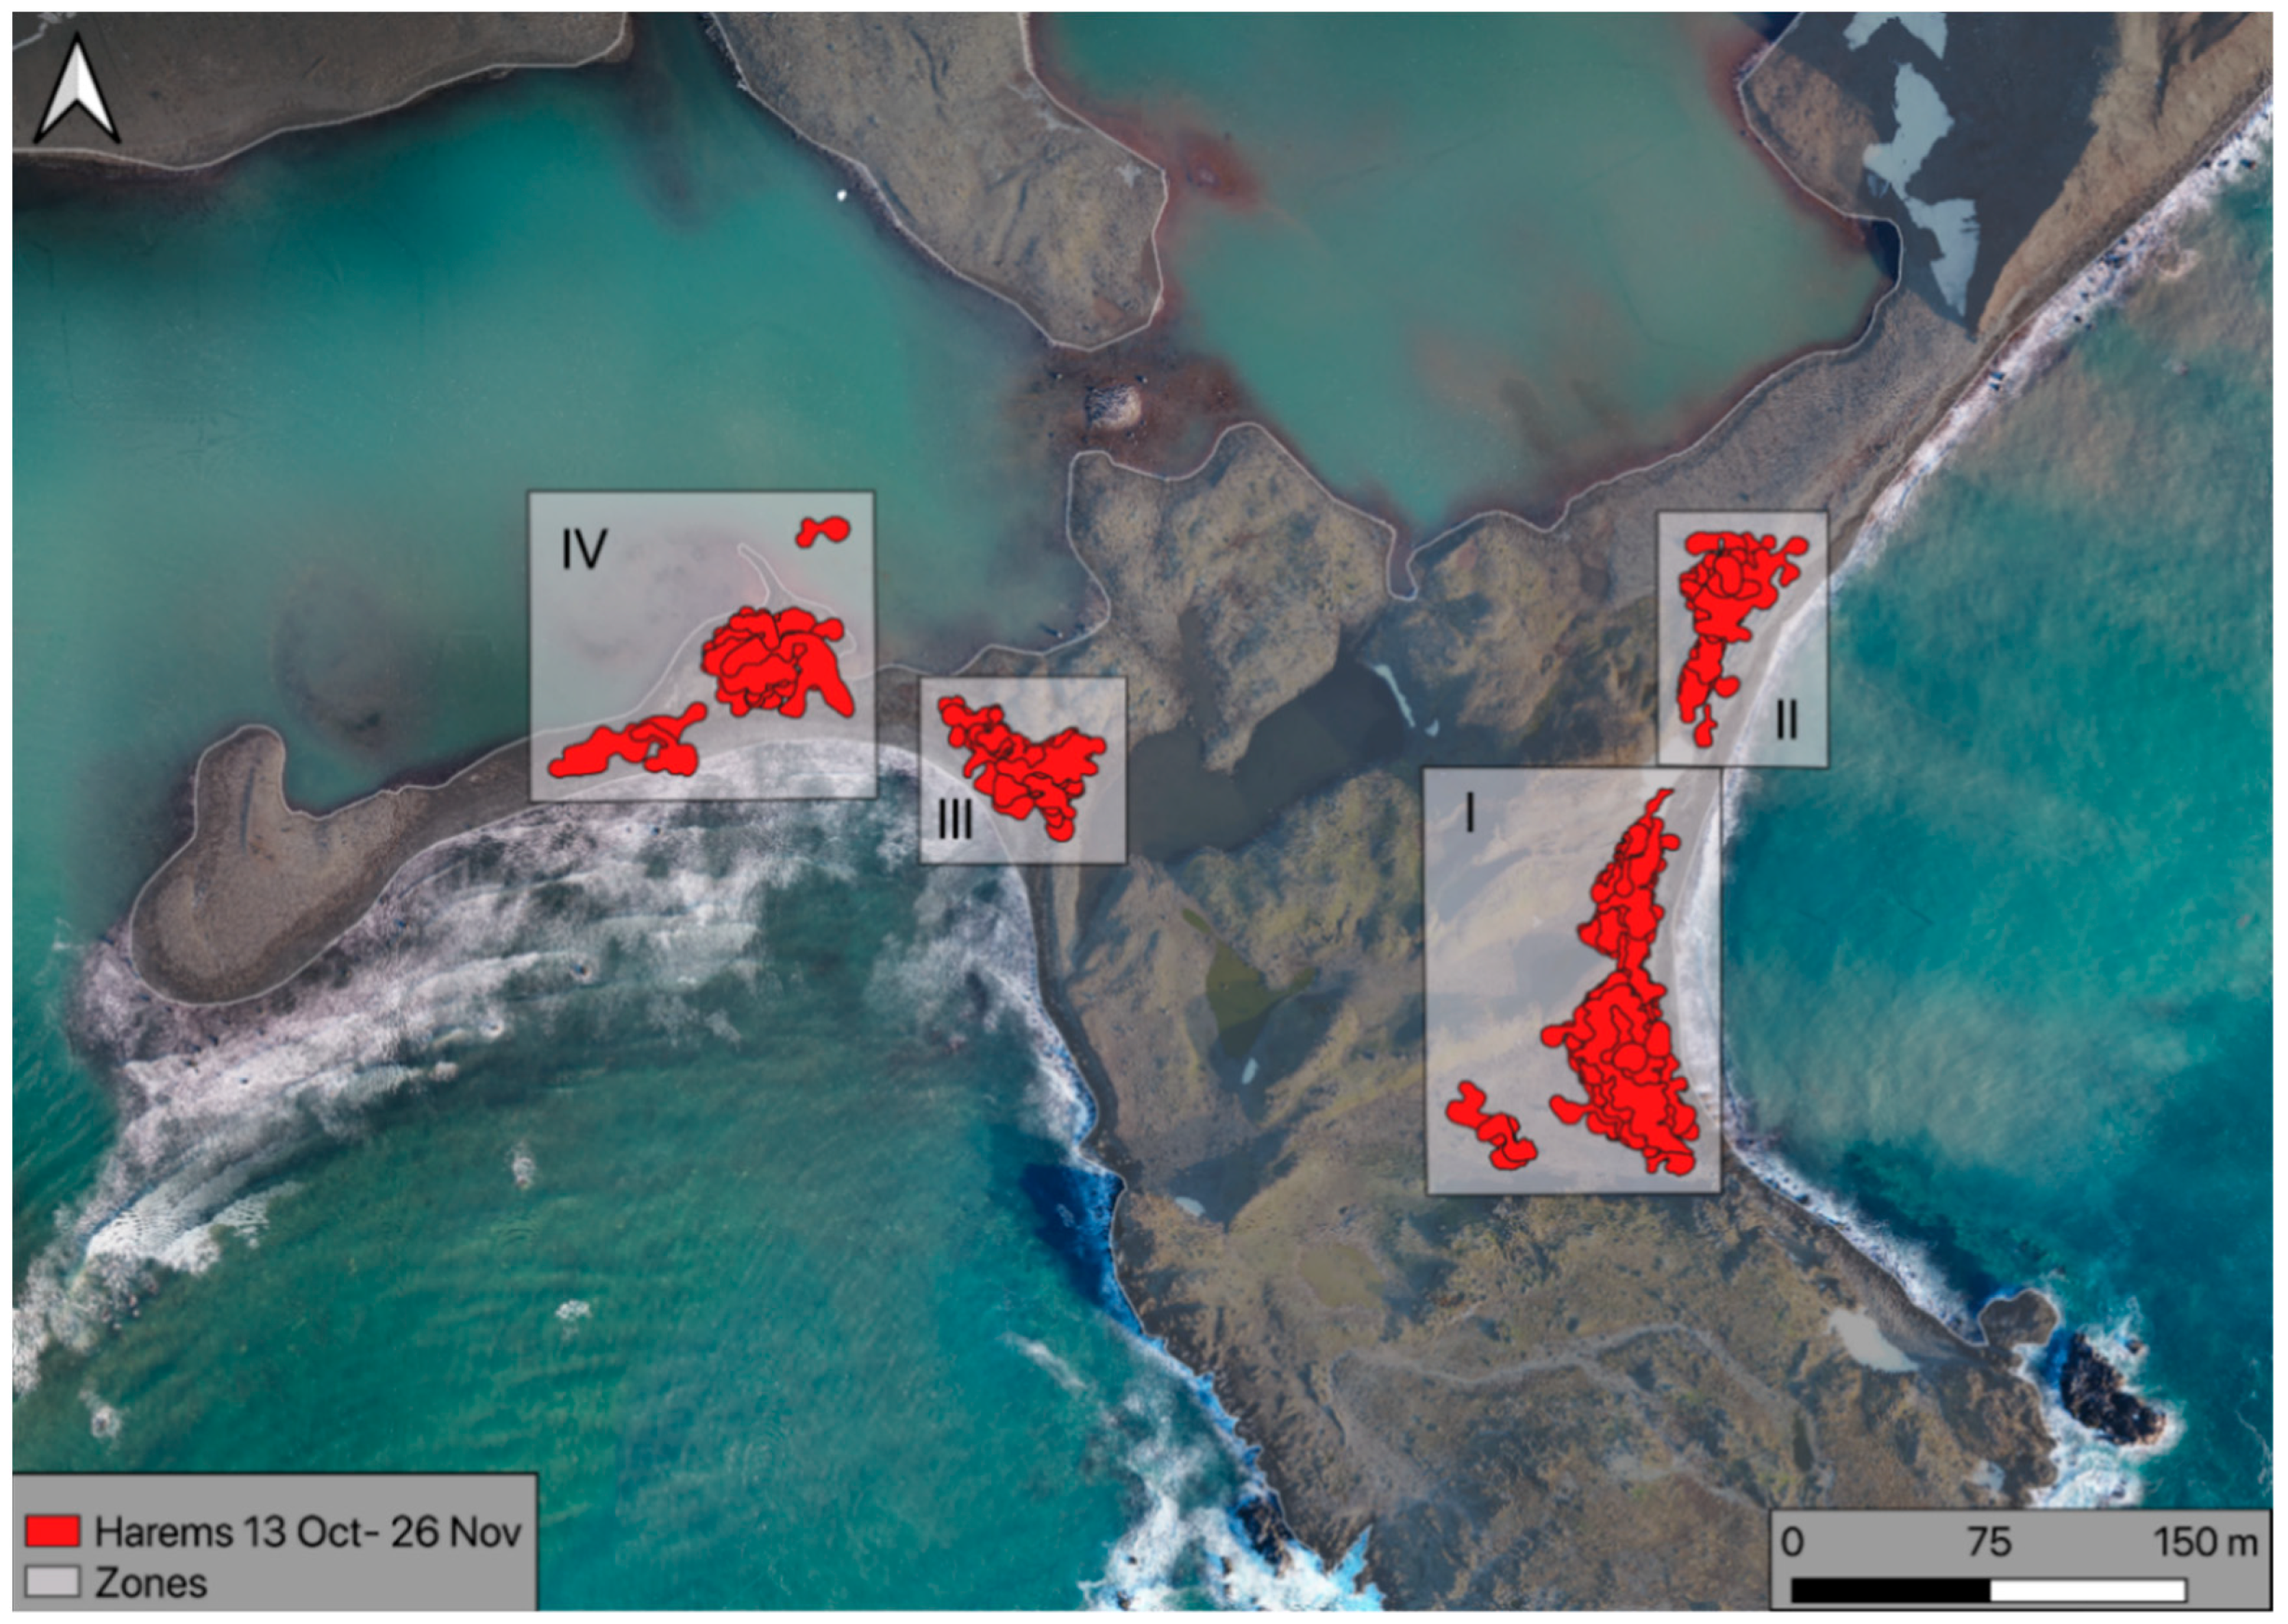
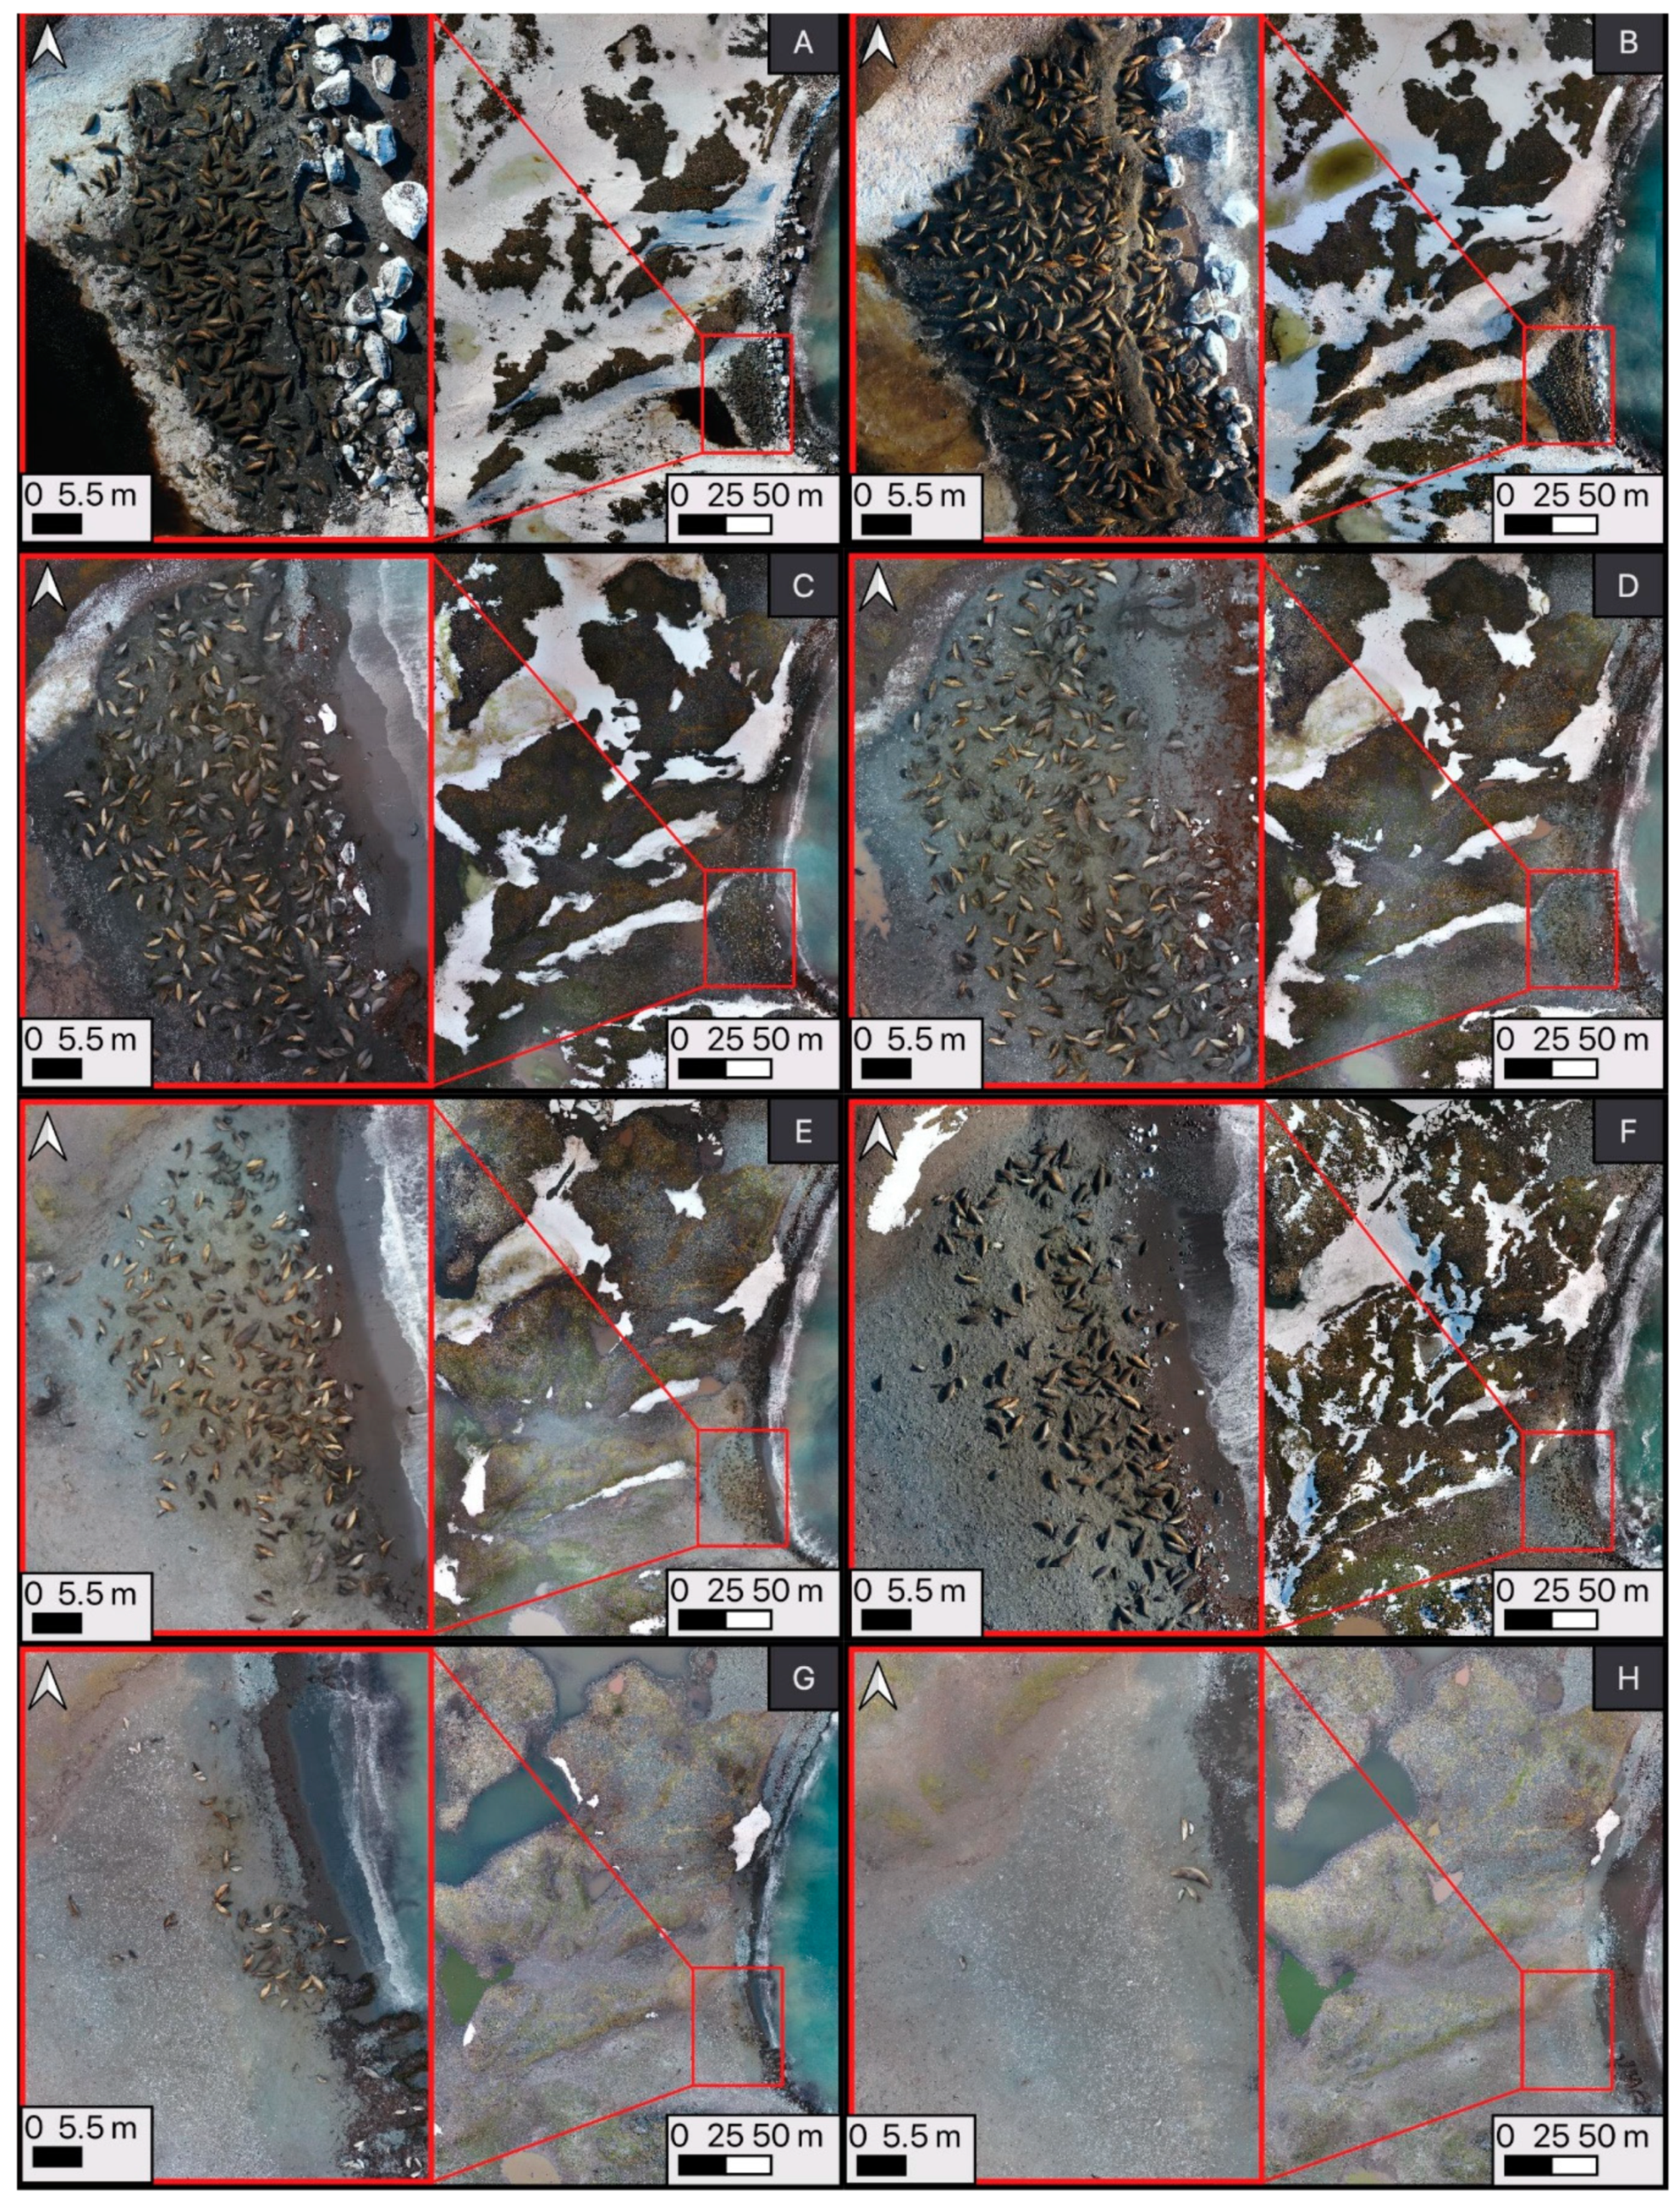
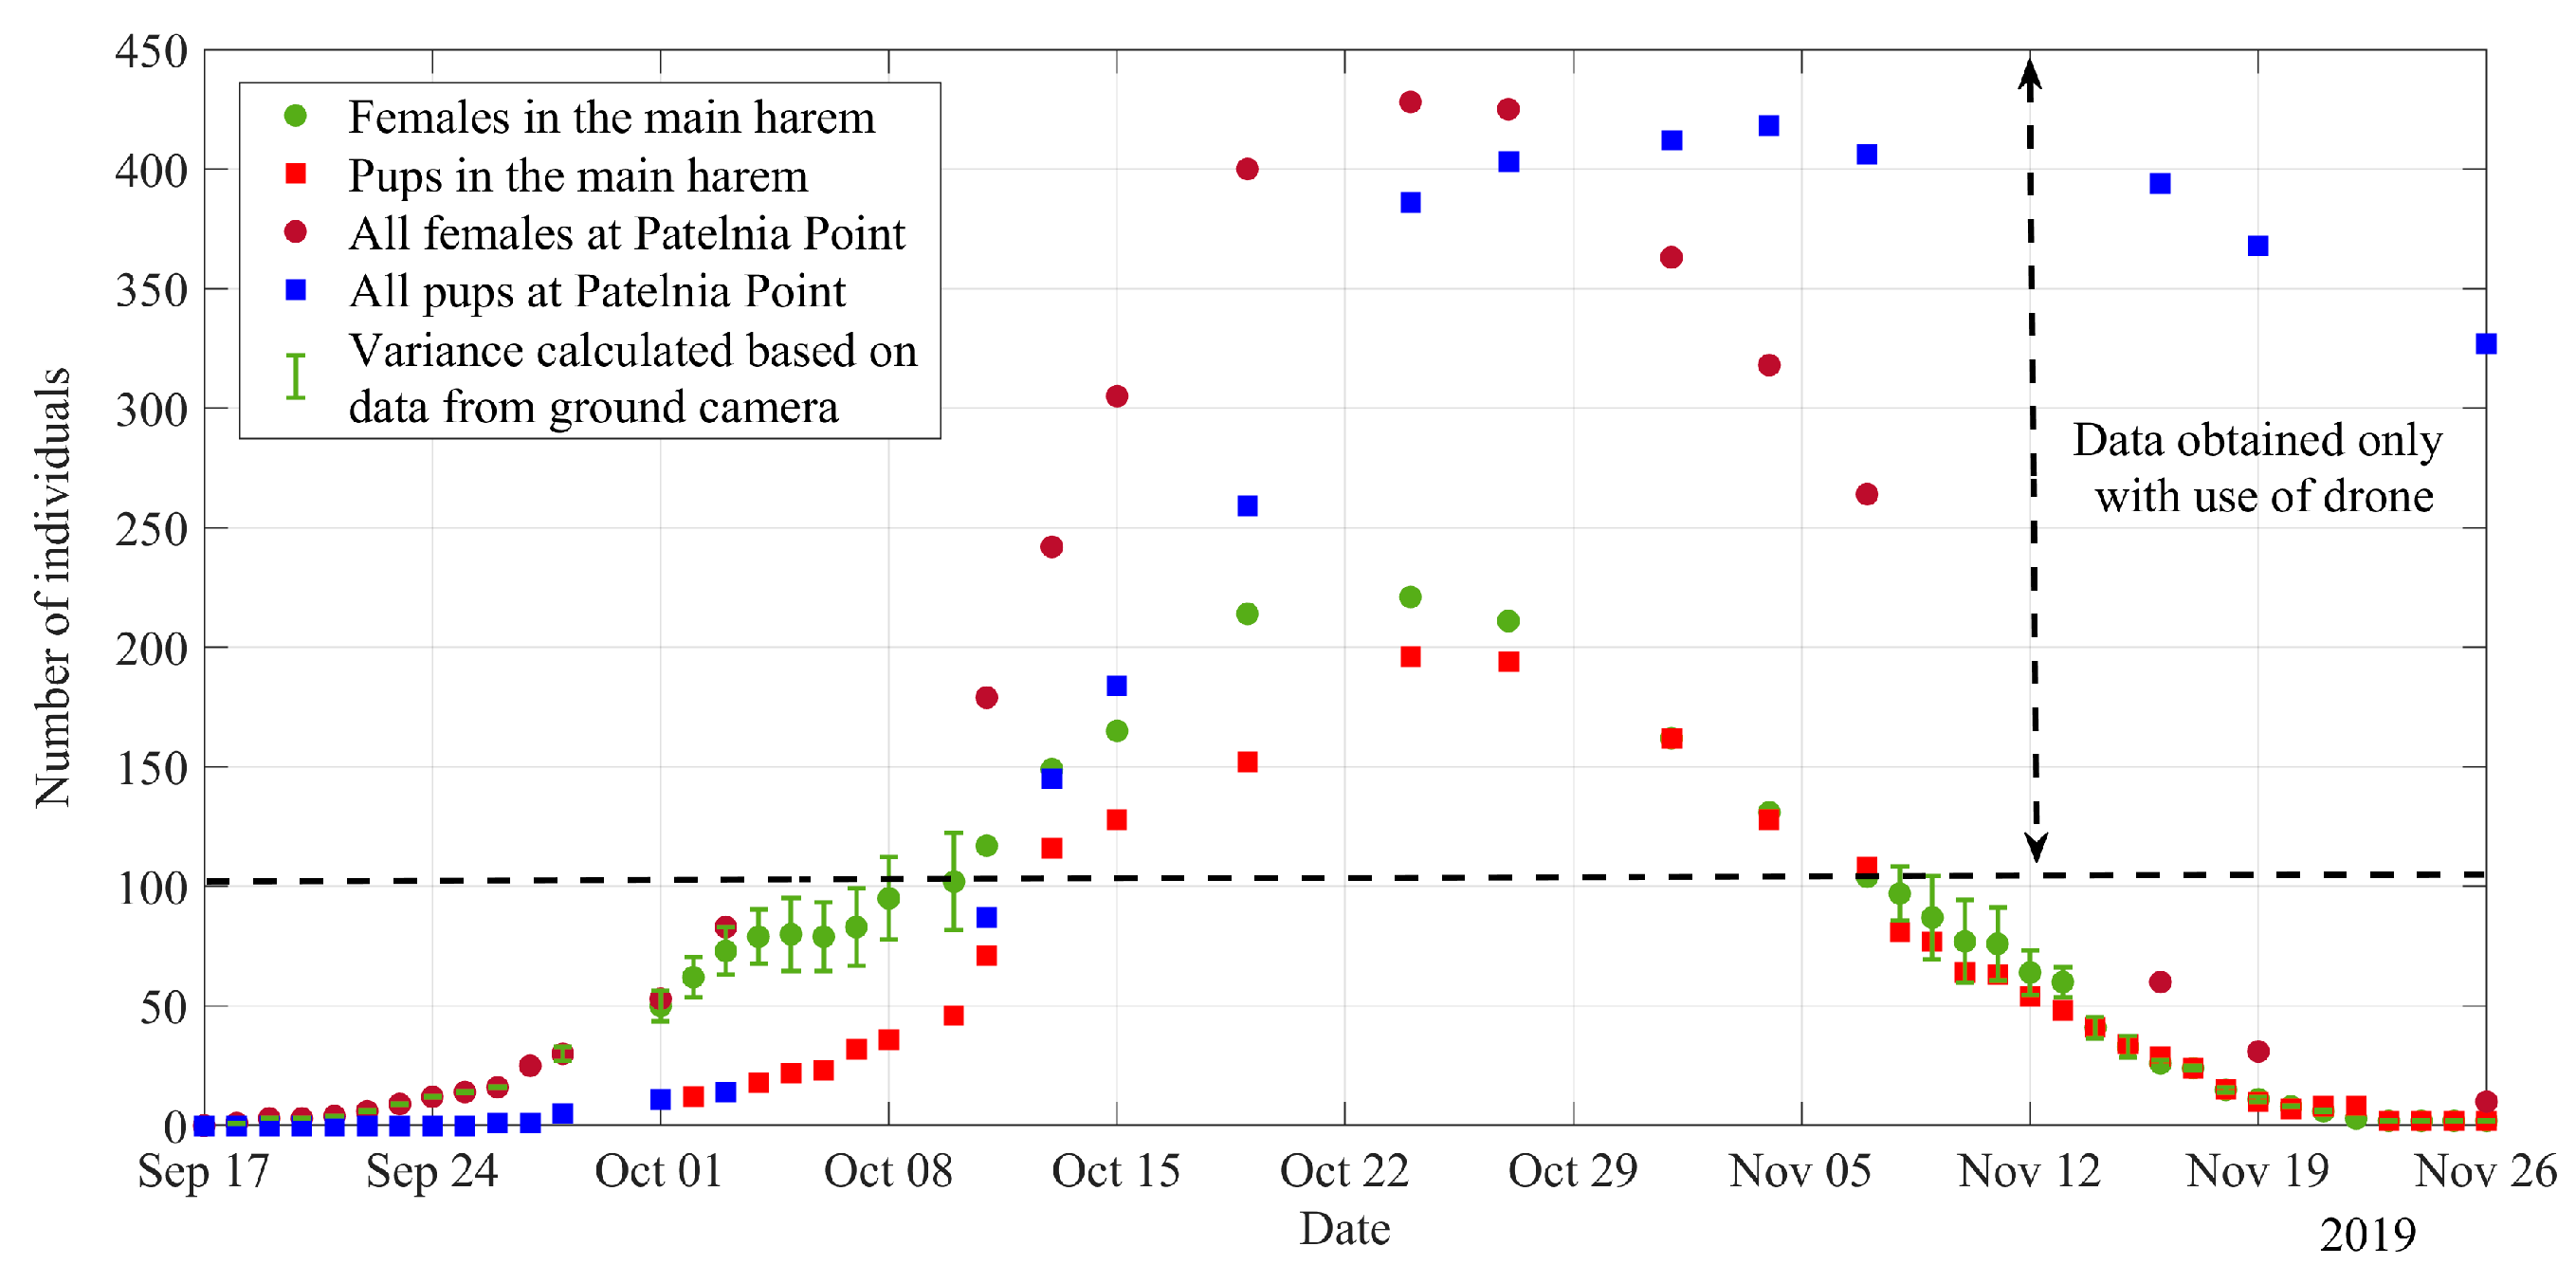
Localizations of all harems within the area of Patelnia Point during the period from October 13 to November 26 are summarized in Figure 4. As stated in the Section 2, all harems were divided into zones (Figure 5). Figure 6 shows aerial images of the largest harem at Patelnia Point, which was formed in Zone I. In the initial period of harem formation, the coastline was covered with blocks of ice, which made it difficult for females to reach land. Figure 7 compares the numbers of females and pups against the total number of individuals (females and pups) in the same period for the entire Patelnia Point area. The percentage of females in the main harem relative to the total number in the whole area decreased from 54% on October 15 to 40% on November 7. In contrast, the percentage of pups decreased from 70% on October 15 to 25% on November 7. The maximum numbers of females for the main harem and the entire area were observed on October 24, at 221 and 428 individuals, respectively (Table 2, Figure 7). The maximum number of pups in the main harem also occurred on October 24, at 196 individuals, while in the entire area, there were 418 individuals on November 4 (Table 2, Figure 7). In addition, we calculated the average sex ratio for the whole area, which varied from 1♂:27♀ on October 19 to 1♂:16♀ on November 4.
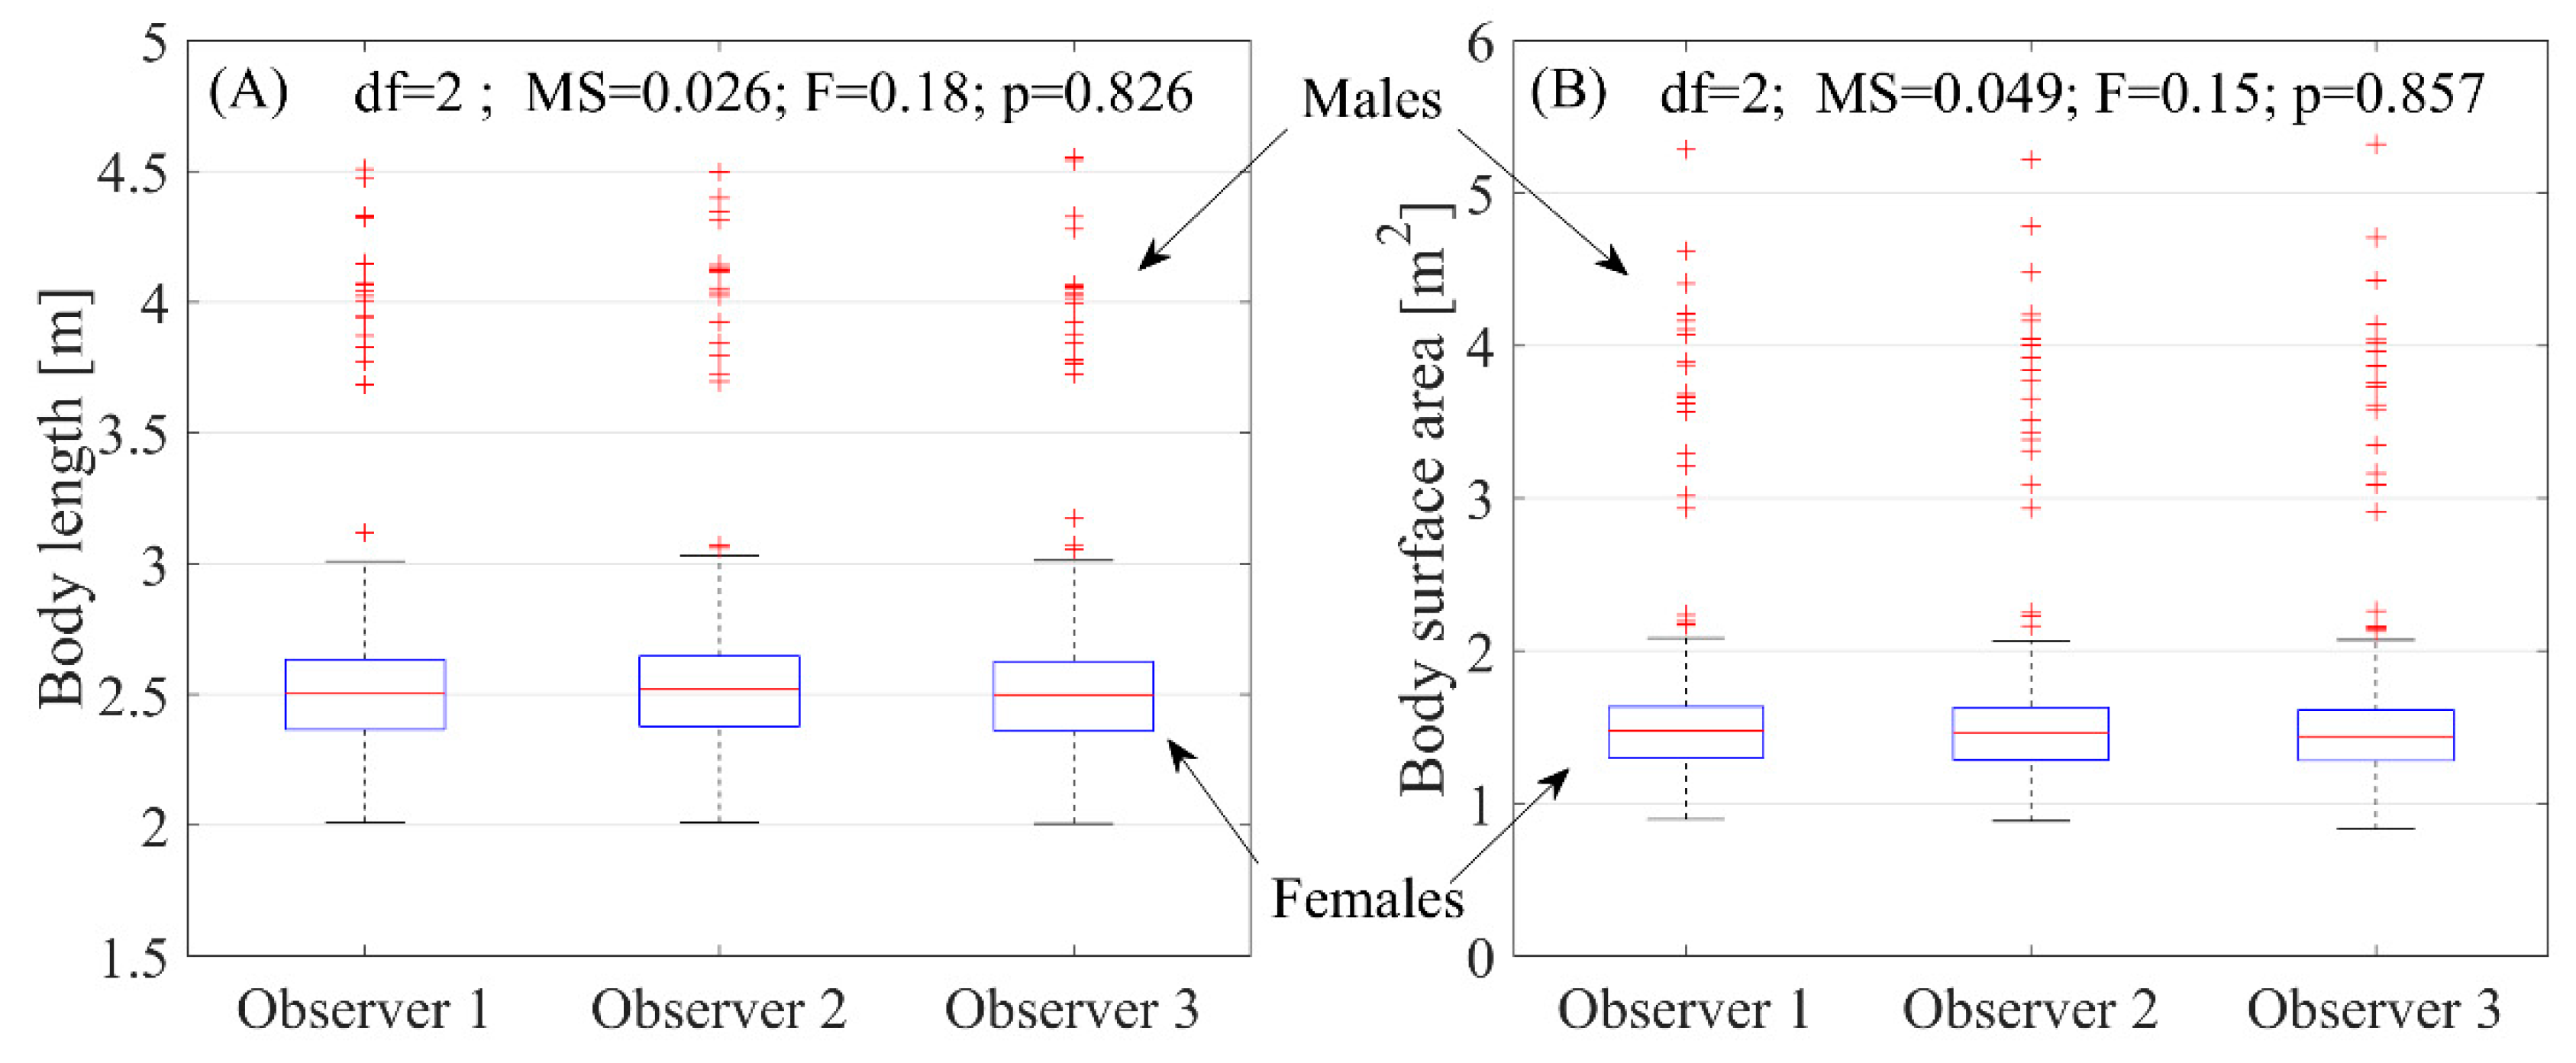
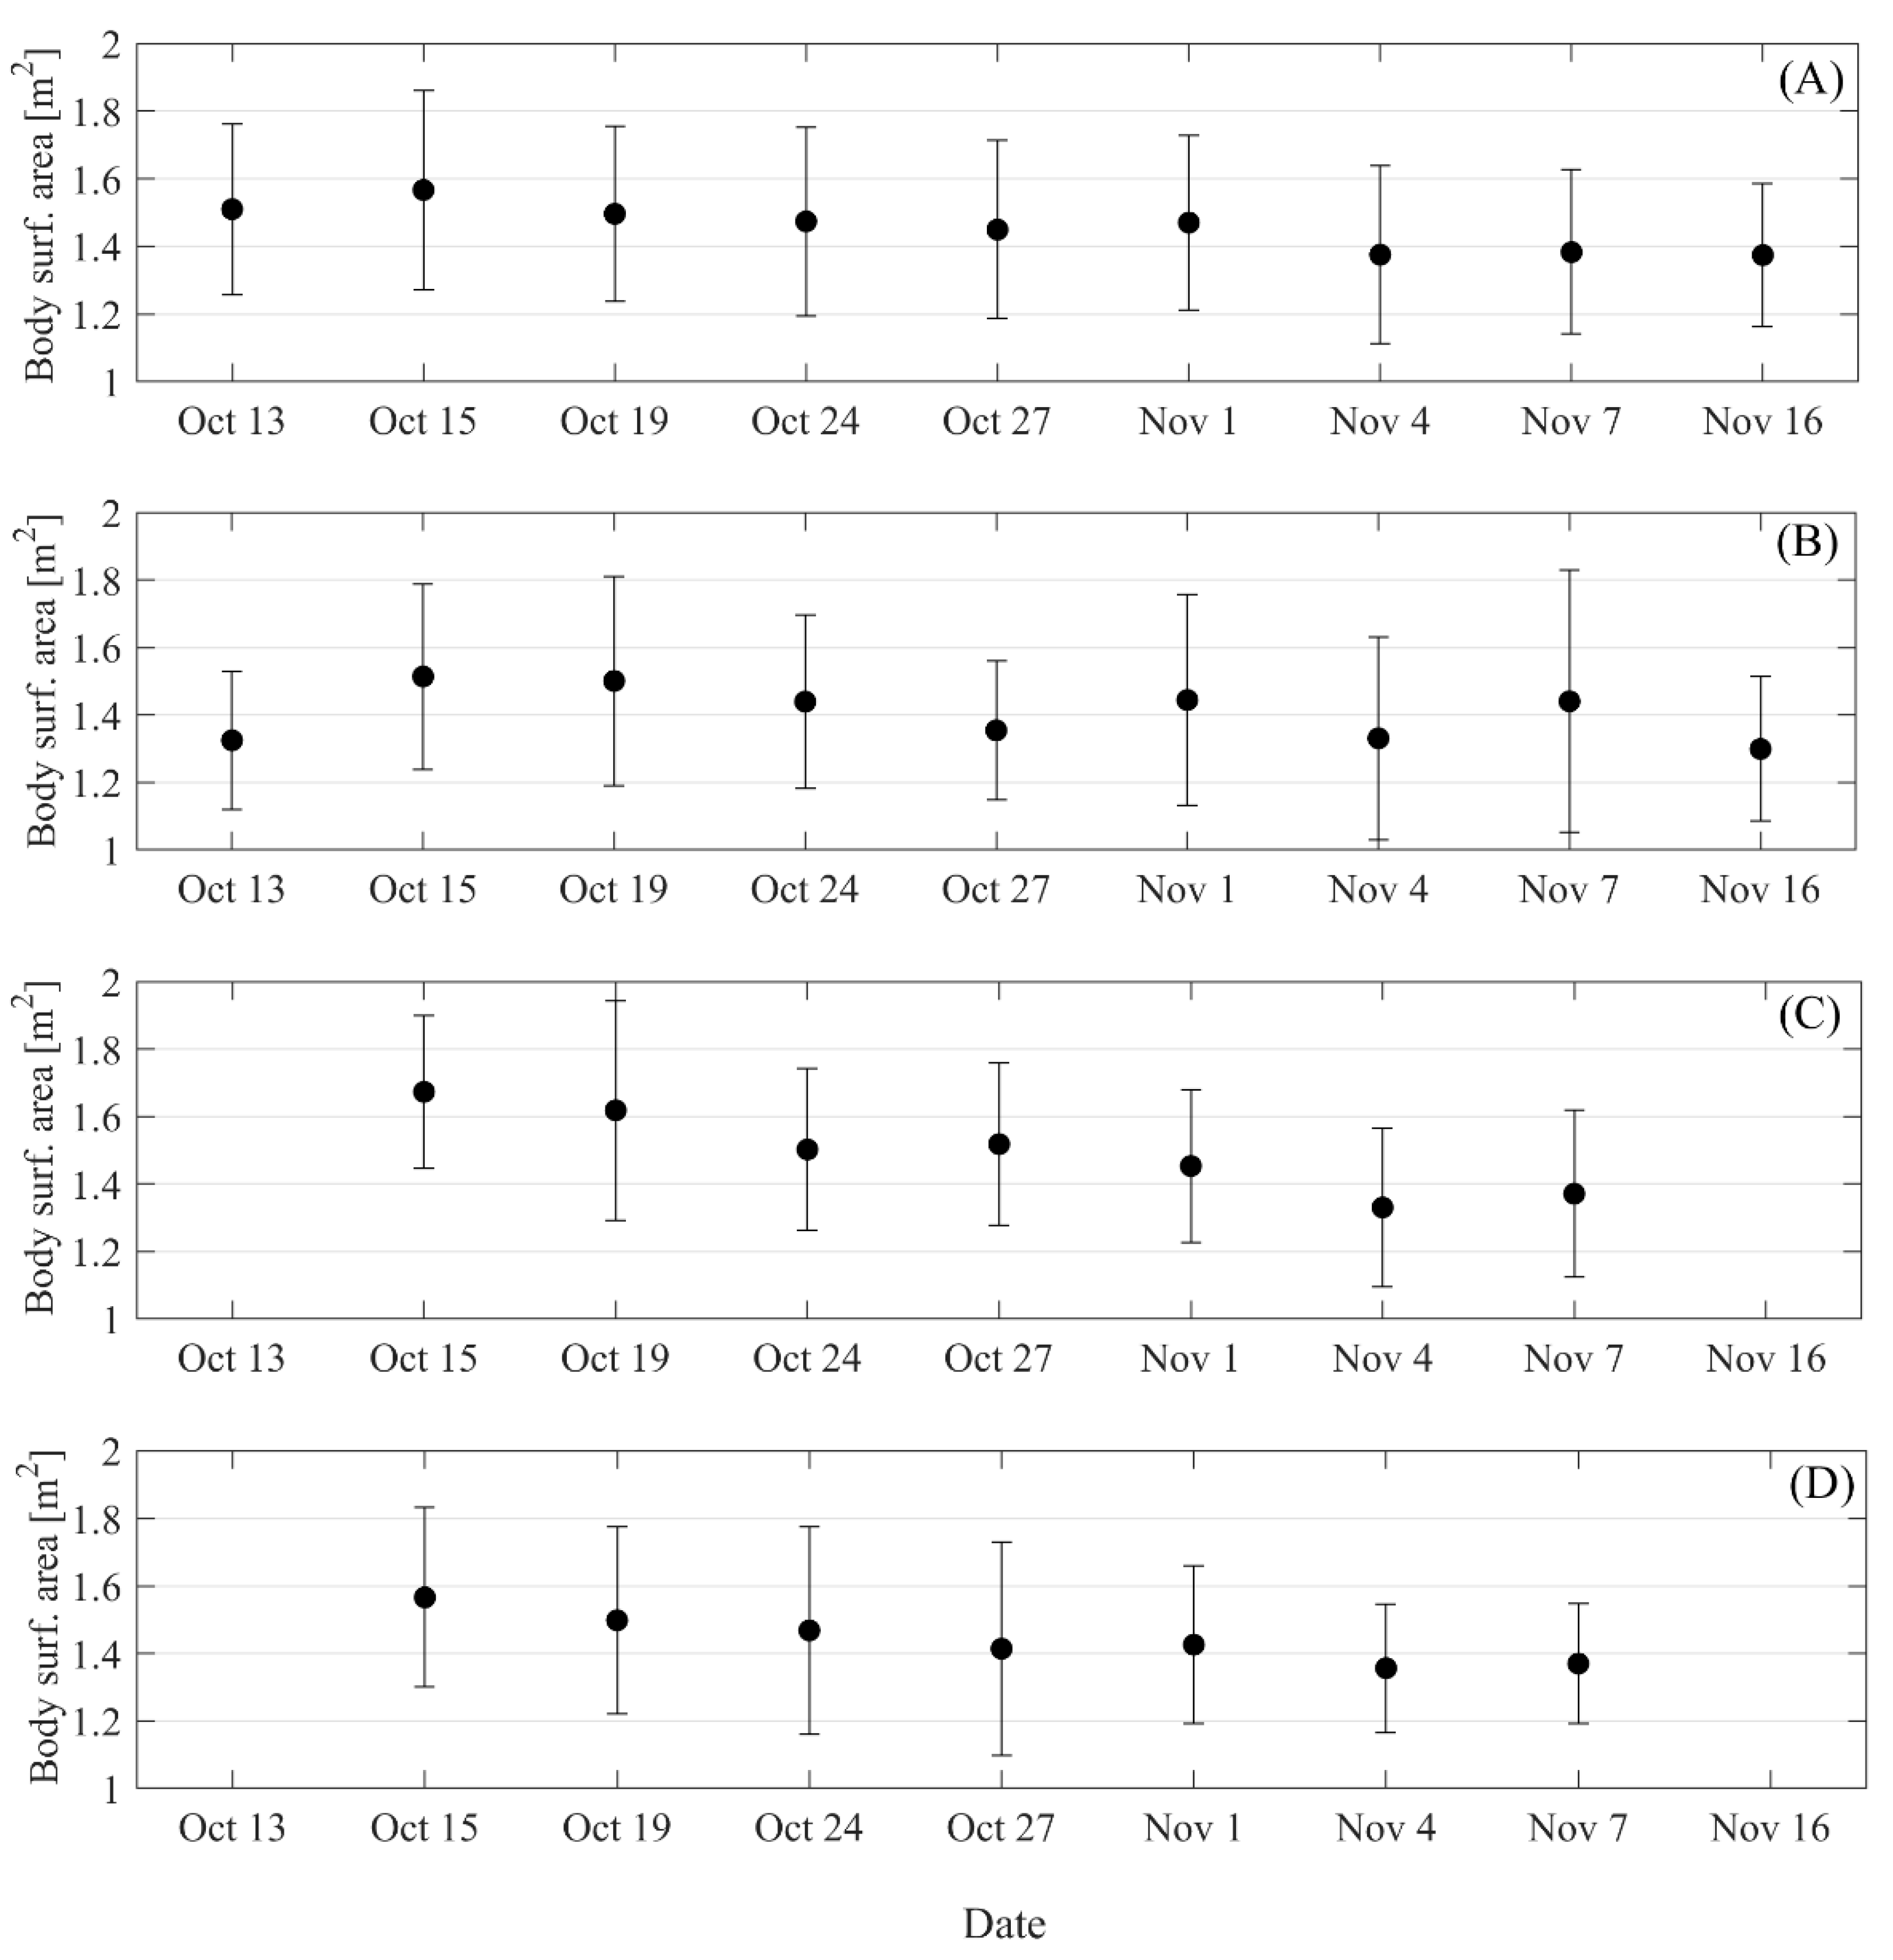
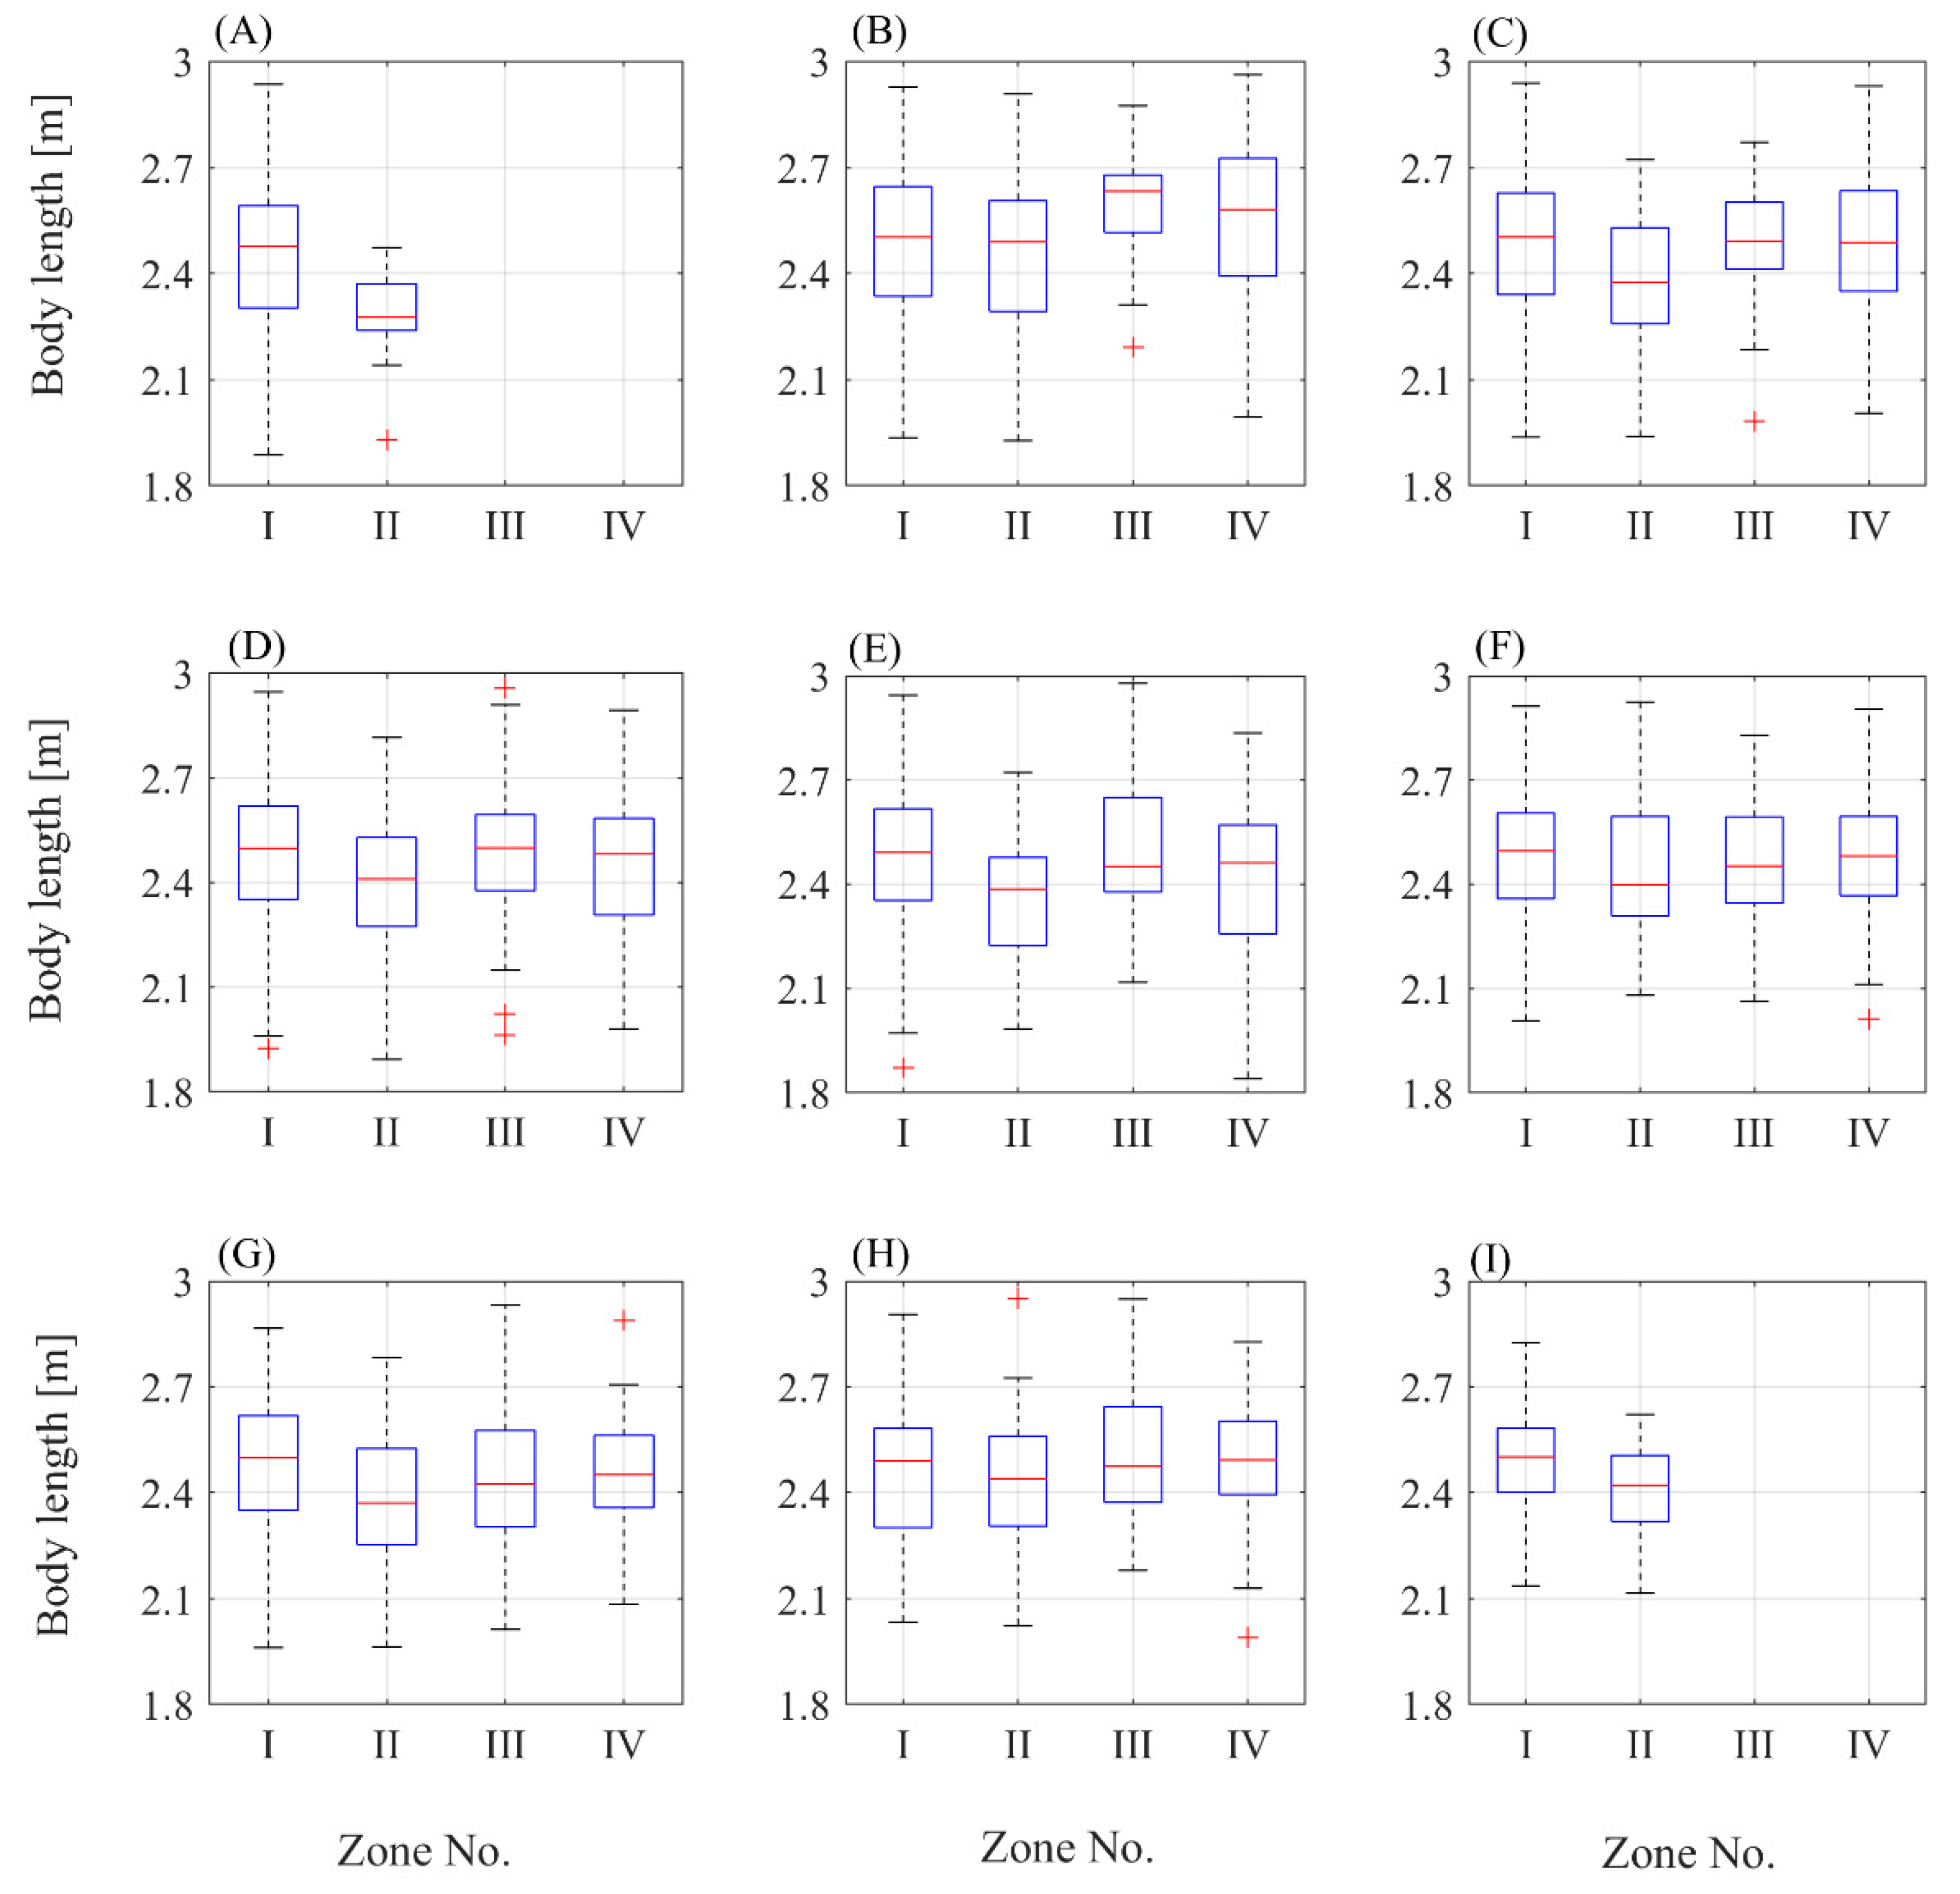
The result of the precision test (Figure 8) revealed no significant differences in the calculation of body length or body surface area for southern elephant seals on November 1 among the three independent observers. Moreover, the presented results allow for clear sex distinction, as males involved in reproduction are clearly larger than females. The results obtained for orthogonal projection of the body surface area and the length of the females of southern elephant seals showed statistically significant differences in body surface area in each zone between consecutive days (p-value < 0.05, Figure 9) and statistically significant differences in body length between zones for different days (p-value < 0.05, Figure 10). With regard to Zone I, statistically significant decreases in body surface area were recognized between October 15 and 19, October 19 and 27, October 24 and 27, and November 1 and 4, while for Zone II, differences were observed between October 13 and 15, October 15, 19 and 27, October 24 and November 4, and November 1 and 4. For Zone III, statistically significant decreases in body surface area were observed between October 15 and November 1 and October 19, 24, 27 and November 4, while for Zone IV, statistically significant decreases were observed between October 15 and 27, October 15 and November 1, and October 19 and November 4. In the case of body length, a statistically significant difference (p-value < 0.05, Figure 10) occurred on October 13 between Zone I and Zone II; on October 15 between Zone III and Zones I and II; on October 19 between Zone II and Zones I, III, IV; on October 27 between Zone II and Zones I and III; on November 4 between Zone I and Zone II; and on November 16 between Zone I and Zone II.
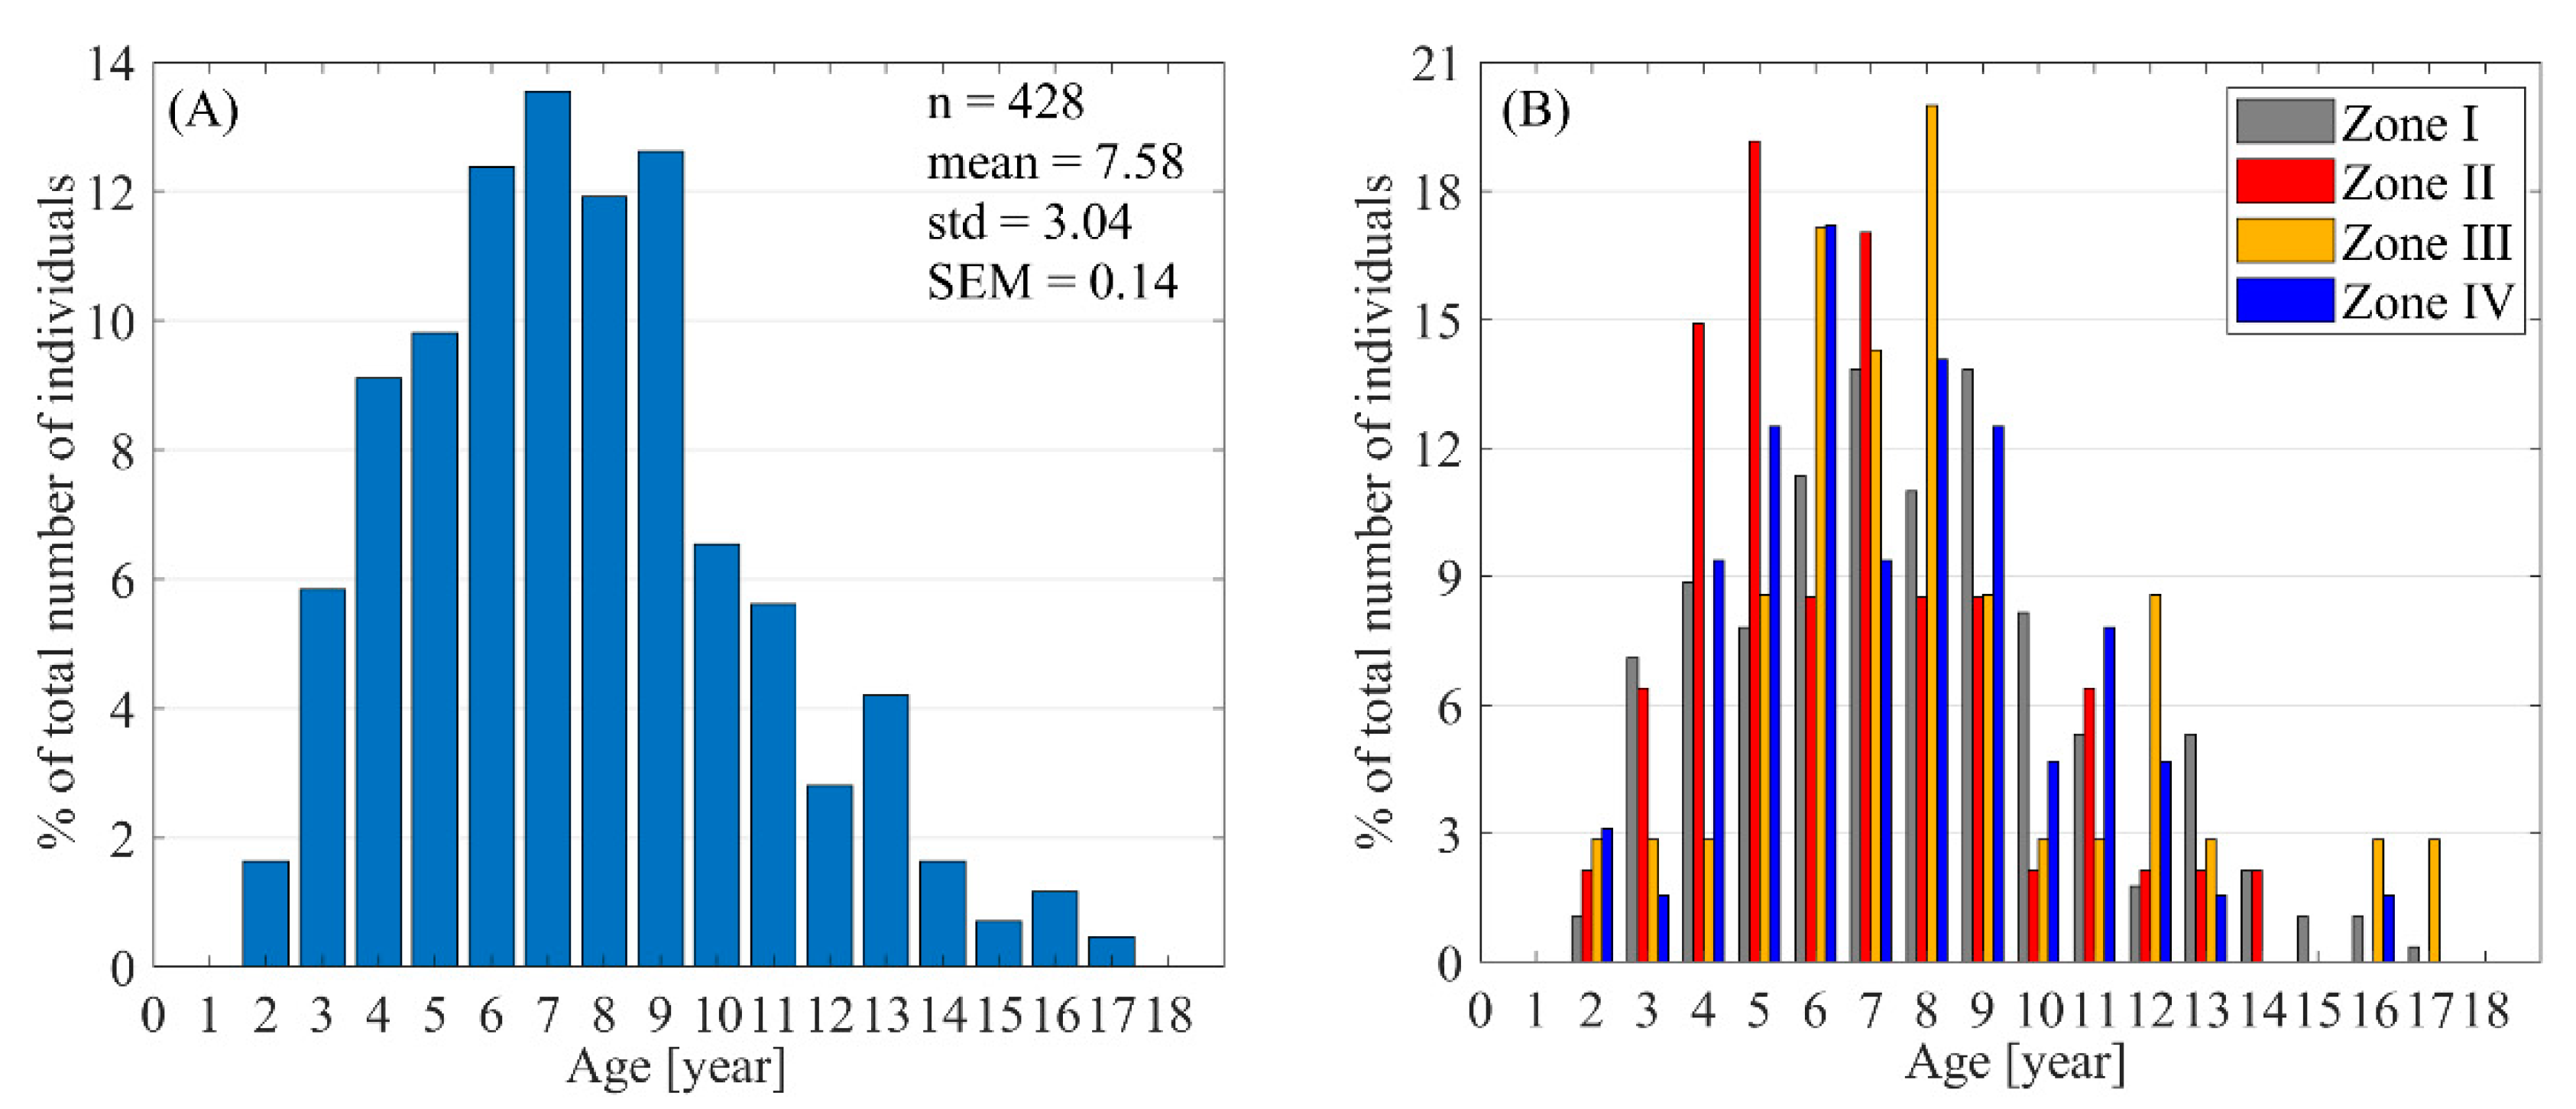
Finally, an additional advantage of obtaining such observations and measurements of female southern elephant seals using drones is the ability to assess their age. Several expressions are available in the literature that combine the length and age of females [41]. However, based on one of the simplest, BL = 1.67*age0.20, we can determine the relationship between body length (BL) and age. Figure 11 shows the age distribution of females at Patelnia Point (Figure 11A) and the division of the number of individuals into zones based on age (Figure 11B). On this basis, we concluded that the average age of females for October 27 was 7.58 ± 3.04 years. Unfortunately, the other available models have asymptotic limitations; for example, when using BL = 2.57exp(−exp(−0.65(age + 0.23))) [41], the ages of females whose lengths exceed 2.57 m cannot be determined. Nevertheless, there is still significant potential in such estimation methods.
4. Discussion
The utility of drones in monitoring animal populations has been repeatedly confirmed, and our analysis shows that when counting southern elephant seals, as in other recently investigated species [34,42,43], the use of UAVs was more accurate than ground counting by humans. However, the sizes and locations of harems can be very highly dynamic, suggesting that counting them at 10-day intervals, as in the previous seasons [9], may not provide a complete view, potentially leading to a loss of information about the maximum number of individuals.
A different temporal distribution of the phenological cycle was noticeable in the main (I) zone compared with the other three zones. In the main zone, where the largest harem occurred and in which the number of females was approximately 50% of the total number of females in the analyzed area, the first parturition took place on September 26, while the maximum number of females assessed based on photos from the mission occurred on October 24. The maximum occurred on October 27 in Zones III and IV and on November 1 in Zone II. When considering the entire area of observation, the maximum occurred on October 24, consistent with the results published by Muller-Schwarze et al. [44] (October 24), Galimberti and Sanvito [45] (October 25), and Carlini et al. [11], who suggested that the haul-out peak for King George Island was on October 28.
To trace the spatial relationships between harems on consecutive days, taking into account the terrain conditions, the area of Patelnia Point was divided into zones. Female southern elephant seals differed significantly in body length between these zones on particular days. Zone I differed from Zone II on October 13, 19, and 27 and November 4 and 16. ANOVA confirmed the differences between Zone II and Zone III on October 15, 19, and 27. In contrast, we did not detect statistically significant differences in female body length among consecutive days in particular zones, which suggests no significant exchange of individuals between zones. The analysis of glacier ranges from 1978/1979 [46,47] clearly shows that in this period, Zones II, III, and IV were covered with ice from the Windy Glacier; therefore, there was no possibility of harem formation in this or preceding years. This excludes simple philopatry (i.e., an elephant seal’s experience and potential return to places where harems were found in previous years) as a possible explanation for the difference. The periods of deglaciation (exposure from ice) for Zones II, III, and IV were similar. These zones were partially uncovered in 1989 and completely uncovered in 2001 [46,47].
Our results also revealed clear (statistically significant) differences in female body surface area between consecutive days in different zones. The most common noticeable difference was between October 19 and 27, which was observed for three zones (I, II, and IV), and between October 19, 24, and 27 and November 4 (Zones I, II, and III). Later, there were no statistically significant differences. Our observations suggest that this parameter is associated with a reduction in female body surface area due to subsequent parturition and lactation. According to Carlini et al. [13], females on King George Island stay in the breeding ground from parturition to departure at 22 days, and during this time, they lose approximately 221 +/−37 kg of body weight, which is 35% of their body mass at the beginning of lactation. Thus, the first parturition took place on September 26 in the study area. Based on Carlini’s [13] results, this suggests that the first females left the harem on October 18, assuming that their young survived. This was confirmed by our results, which suggest that between October 19 and 27, most females were in the period of body mass reduction due to lactation. On the other hand, the peak number of pups was observed on November 4, suggesting that the majority of females had already given birth, and in the following days, they returned to sea without being included in the statistics. On this basis, it can be deduced that females with a smaller body surface area do not lead to underestimation in the statistical analyses. Moreover, a significant increase is visible, for example, for Zone II between November 4 and 7. We believe that monitoring the body surface area of female individuals allows us to assess the degree of development for particular zones, and this type of monitoring should be conducted in future studies. It should be emphasized, however, that the first UAV mission, based on which we were able to calculate the length and body surface area of females, occurred approximately 10 days later than the beginning of harem formation, if we consider at least Zones III and IV. Therefore, the monitoring may not have been sufficient to completely meet the goals posed in the current paper, leaving an open question in this area.
5. Conclusions
The following statements summarize our findings:
- This paper confirmed that counting southern elephant seals using UAVs is more accurate than counting by humans, and it is therefore strongly recommended that drones be used to monitor breeding colonies of southern elephant seals.
- The body surface area of southern elephant seals can be used to assess the development of a particular zone, as it is associated with body mass lost due to parturition and latency in females.
- Harems are highly dynamic and unstable groups (in the sense of spatial changes and individuals movement), so the situation considered here is temporary. To better understand reproductive dynamics, all interactions between existing harems and their transformations should also be taken into account. For this reason, it is better to consider the belonging of an individual to a certain hermetic area (zone) than to a specific harem. Zones provide an opportunity to determine the phase of the phenological cycle.
- Based on body length measurements of female southern elephant seals, we suggest assessing the age of such females using the well-known power equation that links body length and age. Our calculations showed that the mean age of females involved in breeding at Patelnia was 7.58 years with a standard deviation equal to 3.04 years.
Author Contributions
Conceptualization, K.F. and R.J.B.; methodology, K.F. and R.J.B.; investigation, K.F. and R.J.B.; data curation, K.F. and R.J.B.; writing, K.F. and R.J.B.; resources, K.F.; project administration, R.J.B.; All authors have read and agreed to the published version of the manuscript.
Funding
This research received funding from the Ministry of Science and Higher Education of Poland, grant no. 6812/IA/SP/2018.
Acknowledgments
We appreciate the support provided by the Arctowski Polish Antarctic Station. We are particularly grateful to Arctowski Station staff for their help in collecting data. Special thanks are due to Pix4D S.A. as most of the images were analyzed with the support of Pix4DMapper (Professor License). Lastly, we would like to thank four anonymous reviewers for their helpful comments.
Conflicts of Interest
The authors declare no conflict of interest.
Appendix A

Table A1.
Details of the statistical analysis.
| Factor | Investigated Characteristics | ANOVA | Levene’s Test | Post-Hoc Test | ||
|---|---|---|---|---|---|---|
| df | F | p | ||||
| Zone I | Body Length | 8 | 0.941 | 0.481 | 0.178 | none |
| Body Surf. | 8 | 9.778 | 0.000 | 0.083 | Tukey’s | |
| Zone II | Body Length | 8 | 1.725 | 0.092 | 0.340 | none |
| Body Surf. | 8 | 3.403 | 0.001 | 0.268 | Tukey’s | |
| Zone III | Body Length | 6 | 1.735 | 0.114 | 0.935 | none |
| Body Surf. | 6 | 7.198 | 0.000 | 0.991 | Tukey’s | |
| Zone IV | Body Length | 6 | 2.339 | 0.031 | 0.093 | Tukey’s |
| Body Surf. | 6 | 5.673 | 0.000 | 0.010 | Tamhane’s | |
| October 13 | Body Length | 1 | 7.117 | 0.008 | 0.059 | LSD |
| Body Surf. | 1 | 5.258 | 0.023 | 0.628 | LSD | |
| October 15 | Body Length | 3 | 3.007 | 0.031 | 0.317 | LSD |
| Body Surf. | 3 | 1.543 | 0.203 | 0.375 | none | |
| October 19 | Body Length | 3 | 3.053 | 0.028 | 0.404 | LSD |
| Body Surf. | 3 | 0.730 | 0.534 | 0.493 | none | |
| October 24 | Body Length | 3 | 1.887 | 0.131 | 0.841 | none |
| Body Surf. | 3 | 0.488 | 0.691 | 0.332 | none | |
| October 27 | Body Length | 3 | 5.981 | 0.001 | 0.646 | LSD |
| Body Surf. | 3 | 3.767 | 0.011 | 0.291 | LSD | |
| November 1 | Body Length | 3 | 0.391 | 0.760 | 0.853 | none |
| Body Surf. | 3 | 0.790 | 0.500 | 0.670 | none | |
| November 4 | Body Length | 3 | 2.978 | 0.032 | 0.297 | LSD |
| Body Surf. | 3 | 1.141 | 0.333 | 0.229 | none | |
| November 7 | Body Length | 3 | 1.142 | 0.333 | 0.591 | none |
| Body Surf. | 3 | 0.154 | 0.927 | 0.043 | none | |
| November 16 | Body Length | 3 | 5.131 | 0.004 | 0.007 | Tamhane’s |
| Body Surf. | 3 | 3.326 | 0.027 | 0.308 | LSD | |
| November 26 | Body Length | 3 | 2.335 | 0.099 | 0.266 | none |
| Body Surf. | 3 | 1.943 | 0.150 | 0.863 | none | |
References
- Rogers, A.D.; Frinault, B.A.V.; Barnes, D.K.A.; Bindoff, N.L.; Downie, R.; Ducklow, H.W.; Friedlaender, A.S.; Hart, T.; Hill, S.L.; Hofmann, E.E.; et al. Antarctic Futures: An Assessment of Climate-Driven Changes in Ecosystem Structure, Function, and Service Provisioning in the Southern Ocean. Annu. Rev. Mar. Sci. 2020, 12, 87–120. [Google Scholar] [CrossRef] [PubMed] [Green Version]
- Slade, R.W.; Moritz, C.; Hoelzel, A.R.; Burton, H.R. Molecular population genetics of the southern elephant seal Mirounga leonina. Genetics 1998, 149, 1945–1957. [Google Scholar] [PubMed]
- Corrigan, L.J.; Fabiani, A.; Chauke, L.F.; McMahon, C.R.; De Bruyn, M.; Bester, M.N.; Bastos, A.D.S.; Campagna, C.; Muelbert, M.M.; Hoelzel, A.R. Population differentiation in the context of Holocene climate change for a migratory marine species, the southern elephant seal. J. Evol. Biol. 2016, 29, 1667–1679. [Google Scholar] [CrossRef] [PubMed] [Green Version]
- Hindell, M.A.; McMahon, C.R.; Bester, M.N.; Boehme, L.; Costa, D.; Fedak, M.A.; Guinet, C.; Herraiz-Borreguero, L.; Harcourt, R.; Hückstädt, L.A.; et al. Circumpolar habitat use in the southern elephant seal: Implications for foraging success and population trajectories. Ecosphere 2016, 7, 01213. [Google Scholar] [CrossRef] [Green Version]
- McMahon, C.R.; Bester, M.N.; Burton, H.R.; Hindell, M.A.; Bradshaw, C.J. Population status, trends and a re-examination of the hypotheses explaining the recent declines of the southern elephant seal Mirounga leonina. Mammal Rev. 2005, 35, 82–100. [Google Scholar] [CrossRef]
- Aguayo, A.L. Census of pinnipedia in the South Shetland Islands. In Antarctic Ecology; Holdgate, M.W., Ed.; Academic Press: London, UK, 1970; pp. 395–397. [Google Scholar]
- Gil-Delgado, J.A.; Villaescusa, J.A.; Diazmacip, M.E.; Velázquez, D.; Rico, E.; Toro, M.; Quesada, A.; Camacho, A. Minimum population size estimates demonstrate an increase in southern elephant seals (Mirounga leonina) on Livingston Island, maritime Antarctica. Polar Biol. 2012, 36, 607–610. [Google Scholar] [CrossRef]
- Carlini, A.R.; Poljak, S.; Casaux, R.; Daneri, G.A.; Gasco, M. Southern elephant seals breeding at Nelson Island, South Shetland Islands. Pol. Polar Res. 2003, 24, 143–147. [Google Scholar]
- Salwicka, K.; Rakusa-Suszczewski, S. Long-term monitoring of Antarctic pinnipeds in Admiralty Bay (South Shetlands, Antarctica). Acta Thériol. 2002, 47, 443–457. [Google Scholar] [CrossRef]
- Vergani, D.F.; Stanganelli, Z.B. Fluctuations in Breeding Populations of Elephant Seals Mirounga leonina at Stranger Point, King George Island 1980–1988. In Antarctic Ecosystems; Kerry, K.R., Hempel, G., Eds.; Springer: Berlin/Heidelberg, Germany, 1990. [Google Scholar]
- Carlini, A.R.; Polijak, S.; Daneri, G.A.; Márquez, M.E.I.; Plötz, J. Dynamics of male dominate of southern elephant seals (Mirounga leonine) during breeding season at King George Island. Pol. Polar Res. 2002, 23, 153–159. [Google Scholar]
- Carlini, A.R.; Márquez, M.E.I.; Soave, G.; Vergani, D.F.; De Ferrer, P.A.R. Southern elephant seal, Mirounga leonina: Composition of milk during lactation. Polar Biol. 1994, 14, 37–42. [Google Scholar] [CrossRef]
- Carlini, A.R.; Daneri, G.A.; Márquez, M.E.I.; Soave, G.E.; Poljak, S. Mass transfer from mothers to pups and mass recovery by mothers during the post-breeding foraging period in southern elephant seals (Mirounga leonina) at King George Island. Polar Biol. 1997, 18, 305–310. [Google Scholar] [CrossRef]
- Daneri, G.; Carlini, A. Fish prey of southern elephant seals, Mirounga leonina, at King George Island. Polar Biol. 2002, 25, 739–743. [Google Scholar] [CrossRef]
- Daneri, G.A.; Carlini, A.R.; Marschoff, E.R.; Harrington, A.; Negrete, J.; Mennucci, J.A.; Márquez, M.E.I. The feeding habits of the Southern elephant seal, Mirounga leonina, at Isla 25 de Mayo/King George Island, South Shetland Islands. Polar Biol. 2014, 38, 665–676. [Google Scholar] [CrossRef]
- Gerber, L.R. Including behavioral data in demographic models improves estimates of population viability. Front. Ecol. Environ. 2006, 4, 419–427. [Google Scholar] [CrossRef] [Green Version]
- Skinner, J.D.; Van Aarde, R.J. Observations on the Trend of the Breeding Population of Southern Elephant Seals, Mirounga leonina, at Marion Island. J. Appl. Ecol. 1983, 20, 707. [Google Scholar] [CrossRef]
- Galimberti, F.; Boitani, L. Demography and breeding biology of a small localized population of Southern elephant seals (Mirounga leonina). Mar. Mammal Sci. 1999, 15, 159–178. [Google Scholar] [CrossRef]
- Van Aarde, R.J. Harem structure of the southern elephant seal Mirounga leonina at Kerguelen Island. Revue d’Ecologie 1980, 34, 41–44. [Google Scholar]
- McMahon, C.R.; Bradshaw, C.J. Harem choice and breeding experience of female southern elephant seals influence offspring survival. Behav. Ecol. Sociobiol. 2004, 55, 349–362. [Google Scholar] [CrossRef]
- Anderson, K.; Gaston, K.J. Lightweight unmanned aerial vehicles will revolutionize spatial ecology. Front. Ecol. Environ. 2013, 11, 138–146. [Google Scholar] [CrossRef] [Green Version]
- Pettorelli, N.; Nagendra, H.; Rocchini, D.; Rowcliffe, M.; Williams, R.; Ahumada, J.; De Angelo, C.; Atzberger, C.; Boyd, D.S.; Buchanan, G.; et al. Remote Sensing in Ecology and Conservation: Three years on. Remote. Sens. Ecol. Conserv. 2017, 3, 53–56. [Google Scholar] [CrossRef] [Green Version]
- Vermeulen, C.; Lejeune, P.; Lisein, J.; Sawadogo, P.; Bouché, P. Unmanned Aerial Survey of Elephants. PLoS ONE 2013, 8, e54700. [Google Scholar] [CrossRef] [PubMed] [Green Version]
- Zmarz, A.; Rodzewicz, M.; Dąbski, M.; Karsznia, I.; Korczak-Abshire, M.; Chwedorzewska, K.J. Application of UAV BLOS remote sensing data for multi-faceted analysis of Antarctic ecosystem. Remote Sens. Environ. 2018, 217, 375–388. [Google Scholar] [CrossRef]
- Korczak-Abshire, M.; Zmarz, A.; Rodzewicz, M.; Kycko, M.; Karsznia, I.; Chwedorzewska, K.J. Study of fauna population changes on Penquin Island and Turret Point oasis (King George Island, Antarctica) using an unmanned aerial vehicle. Polar Biol. 2019, 42, 217–224. [Google Scholar] [CrossRef] [Green Version]
- Mustafa, O.; Braun, C.; Esefeld, J.; Knetsch, S.; Maercker, J.; Pfeifer, C.; Rummler, M.C. Detecting Antarctic seals and flying seabirds by UAV. ISPRS Ann. Photogramm. Remote. Sens. Spat. Inf. Sci. 2019, 141–148. [Google Scholar] [CrossRef] [Green Version]
- Pfeifer, C.; Barbosa, A.; Mustafa, O.; Peter, H.U.; Brenning, A.; Rummler, M.C. Using fixed wing UAV for Detecting and mapping the distribution and abundance of penquins on the South Shetlands Islands. Antarctica. Drones 2019, 3, 39. [Google Scholar] [CrossRef] [Green Version]
- Goebel, M.E.; Perryman, W.L.; Hinke, J.T.; Krause, D.J.; Hann, N.A.; Gardner, S.; Leroi, D.J. A small unmanned aerial system for estimating abundance and size of Antarctic predators. Polar Biol. 2015, 38, 619–630. [Google Scholar] [CrossRef] [Green Version]
- Hinke, J.T.; Barbosa, A.; Emmerson, L.; Hart, T.; Juáres, M.A.; Korczak-Abshire, M.; Milinevsky, G.; Santos, M.; Trathan, P.N.; Watters, G.M.; et al. Estimating nest-level phenology and reproductive success of colonial seabirds using time-lapse cameras. Methods Ecol. Evol. 2018, 9, 1853–1863. [Google Scholar] [CrossRef] [Green Version]
- McMahon, C.R.; Howe, H.; Hoff, J.V.D.; Alderman, R.; Brolsma, H.; Hindell, M.A. Satellites, the All-Seeing Eyes in the Sky: Counting Elephant Seals from Space. PLoS ONE 2014, 9, e92613. [Google Scholar] [CrossRef] [Green Version]
- LaRue, M.; Ainley, D.G.; Pennycook, J.; Stamatiou, K.; Salas, L.; Nur, N.; Stammerjohn, S.; Barrington, L. Engaging ‘the crowd’ in remote sensing to learn about habitat affinity of the Weddell seal in Antarctica. Remote. Sens. Ecol. Conserv. 2019, 6, 70–78. [Google Scholar] [CrossRef] [Green Version]
- Adame, K.; Pardo, M.A.; Salvadeo, C.; Beier, E.; Elorriaga-Verplancken, F.R. Detectability and categorization of California sea lions using an unmanned aerial vehicle. Mar. Mammal Sci. 2017, 33, 913–925. [Google Scholar] [CrossRef]
- Lowry, M.S. Count of California sea lion (Zalophus californianus) pups from aerial color photographs and from the ground: A comparison of two methods. Mar. Mammal Sci. 1999, 15, 143–158. [Google Scholar] [CrossRef]
- Hodgson, J.C.; Mott, R.; Baylis, S.; Pham, T.; Wotherspoon, S.; Kilpatrick, A.D.; Segaran, R.R.; Reid, I.; Terauds, A.; Koh, L.P. Drones count wildlife more accurately and precisely than humans. Methods Ecol. Evol. 2018, 9, 1160–1167. [Google Scholar] [CrossRef] [Green Version]
- Blindow, N.; Suckro, S.; Rückamp, M.; Braun, M.; Schindler, M.; Breuer, B.; Saurer, H.; Simões, J.C.; Lange, M. Geometry and status of the King George Island ice cap (South Shetland Islands, Antarctica). Ann. Glaciol. 2010, 51, 103–109. [Google Scholar] [CrossRef] [Green Version]
- Krzemiński, W. Southern elephant seal (Mirounga leonina L.) of Admiralty Bay (King George Islands). Its numbers and activity during the moulting season in summer 1978/1979. Pol. Polar Res. 1981, 2, 143–152. [Google Scholar]
- Plenzler, J.; Budzik, T.; Puczko, D.; Bialik, R.J. Climatic conditions at Arctowski Station (King George Island, West Antarctica) in 2013–2017 against the background of regional changes. Pol. Polar Res. 2019, 40, 1–27. [Google Scholar]
- Mustafa, O.; Barbosa, A.; Krause, D.J.; Peter, H.-U.; Vieira, G.; Rümmler, M.-C. State of knowledge: Antarctic wildlife response to unmanned aerial systems. Polar Biol. 2018, 41, 2387–2398. [Google Scholar] [CrossRef]
- Harris, C.M.; Herata, H.; Hertel, F. Environmental guidelines for operation of Remotely Piloted Aircraft Systems (RPAS): Experience from Antarctica. Biol. Conserv. 2019, 236, 521–531. [Google Scholar] [CrossRef]
- Krause, D.J.; Hinke, J.T.; Perryman, W.L.; Goebel, M.E.; Leroi, D.J. An accurate and adaptable photogrammetric approach for estimating the mass and body condition of pinnipeds using an unmanned aerial system. PLoS ONE 2017, 12, e0187465. [Google Scholar] [CrossRef] [Green Version]
- Bell, C.M.; Burton, H.R.; Lea, M.-A.; Hindell, M.A. Growth of female southern elephant seals Mirounga leonina at Macquarie Island. Polar Biol. 2005, 28, 395–401. [Google Scholar] [CrossRef]
- Hodgson, J.C.; Baylis, S.; Mott, R.; Herrod, A.; Clarke, R.H. Precision wildlife monitoring using unmanned aerial vehicles. Sci. Rep. 2016, 6, 22574. [Google Scholar] [CrossRef] [Green Version]
- Sorrell, K.; Clarke, R.H.; Holmberg, R.; McIntosh, R.R. Remotely piloted aircraft improve precision of capture–mark–resight population estimates of Australian fur seals. Ecosphere 2019, 10, 02812. [Google Scholar] [CrossRef] [Green Version]
- Muller-Schwarze, D.; Waltz, E.C.; Trivelpiece, W.; Volkman, N.J. Breeding status of southern elephant seals at King George Island. Antarct. J. U. S. 1978, 13, 157–158. [Google Scholar]
- Galimberti, F.; Sanvito, S. Modeling female haul-out in southern elephant seals (Mirounga leonina). Aquat. Mamm. 2001, 27, 92–104. [Google Scholar]
- Pudełko, R.; Angiel, P.J.; Potocki, M.; Jędrejek, A.; Kozak, M. Fluctuation of Glacial Retreat Rates in the Eastern Part of Warszawa Icefield, King George Island, Antarctica, 1979–2018. Remote. Sens. 2018, 10, 892. [Google Scholar] [CrossRef] [Green Version]
- Da Rosa, K.K.; Perondi, C.; Veettil, B.K.; Auger, J.D.; Simões, J.C. Contrasting responses of land-terminating glaciers to recent climate variations in King George Island, Antarctica. Antarct. Sci. 2020, 1–10. [Google Scholar] [CrossRef]
Figure 1.
Location of the study areas: (A) Antarctic Peninsula; (B) King George Island; (C) western shore of Admiralty Bay; and (D) Patelnia Point.
Figure 1.
Location of the study areas: (A) Antarctic Peninsula; (B) King George Island; (C) western shore of Admiralty Bay; and (D) Patelnia Point.

Figure 2.
Locations of the cameras around the main harem in the study area (A); the first parturition recorded on September 26 by camera P1 (B); two bulls registered on October 23 by camera P2 (C); and view of the entire harem on November 7 by camera P3 (D).
Figure 2.
Locations of the cameras around the main harem in the study area (A); the first parturition recorded on September 26 by camera P1 (B); two bulls registered on October 23 by camera P2 (C); and view of the entire harem on November 7 by camera P3 (D).

Figure 3.
Selected area of the main harem on October 24 (A); the same area showing the method used for image processing (B).
Figure 3.
Selected area of the main harem on October 24 (A); the same area showing the method used for image processing (B).

Figure 4.
Localizations of all harems within the area of Patelnia Point divided into four main periods of time: (A) formation; (B) haul-out; (C) weaning; and (D) breakup. The base map was obtained for November 20, and the harem in the top left corner on October 19 was identified on sea ice, which covered the cove on that day.

Figure 5.
Division of harems into zones at Patelnia Point.

Figure 6.
Aerial images of Patelnia Point with magnification of the main harem on (A) October 15; (B) October 19; (C) October 24; (D) October 27; (E) November 1; (F) November 7; (G) November 16; and (H) November 26.
Figure 6.
Aerial images of Patelnia Point with magnification of the main harem on (A) October 15; (B) October 19; (C) October 24; (D) October 27; (E) November 1; (F) November 7; (G) November 16; and (H) November 26.

Figure 7.
Number of females and pups in the entire area of Patelnia Point and in the main harem.

Figure 8.
Observer precision in measurements of body length (A) and body surface area (B). The test was carried out for November 1.
Figure 8.
Observer precision in measurements of body length (A) and body surface area (B). The test was carried out for November 1.

Figure 9.
Average body surface area with one standard deviation (whisker) for Zone I (A); Zone II (B); Zone III (C); and Zone IV (D).
Figure 9.
Average body surface area with one standard deviation (whisker) for Zone I (A); Zone II (B); Zone III (C); and Zone IV (D).

Figure 10.
Body length of females on different days: (A) October 13; (B) October 15; (C) October 19; (D) October 24; (E) October 27; (F) November 1; (G) November 4; (H) November 7; and (I) November 16. The line in the middle of the box indicates the median, the box edges represent the first and third quantiles, the whiskers correspond to the minimum and maximum values, and crosses represent outliers.

Figure 11.
Age distribution of females at Patelnia Point calculated based on the power model of female body length and age: BL = 1.67*age0.20 for October 27 (A), where BL stands for female body length, and normalized class categorization of female age based on the power model for all four zones (B).

Table 1.
Unmanned aerial vehicle (UAV) flight specifications.
| Mission No. | Mission Date (2019) | Area Coverage | Number of Images Taken (Calibrated) | Flight Altitude | Image Overlap | Ground Sampling Distance (GSD)—Pixel Resolution |
|---|---|---|---|---|---|---|
| 1 | October 13 | 0.104 km2 | 910 (729) | 50 m | 85–75% | 1.04 cm |
| 2 | October 15 | 0.237 km2 | 1375 (1231) | 75 m | 85–75% | 1.57 cm |
| 3 | October 19 | 0.200 km2 | 1218 (984) | 65 m | 85–75% | 1.36 cm |
| 4 | October 24 * | 0.203 km2 | 890 (741) | 65 m | 85–75% | 1.39 cm |
| 5 | October 27 | 0.253 km2 | 1217 (1074) | 65 m | 85–75% | 1.50 cm |
| 6 | November 1 | 0.181 km2 | 1211 (865) | 65 m | 85–75% | 1.34 cm |
| 7 | November 4 | 0.203 km2 | 1217 (963) | 65 m | 85–75% | 1.32 cm |
| 8 | November 7 | 0.192 km2 | 1261 (890) | 65 m | 85–75% | 1.39 cm |
| 9 | November 16 | 0.179 km2 | 1425 (863) | 65 m | 85–70% | 1.42 cm |
| 10 | November 19 | 0.224 km2 | 1410 (1009) | 65 m | 85–75% | 1.39 cm |
| 11 | November 26 | 0.338 km2 | 1399 (1184) | 65 m | 85–70% | 1.44 cm |
| 12 | December 6 | 0.348 km2 | 1702 (1181) | 65 m | 80–75% | 1.37 cm |
* A Zenmuse X5S was used for the mission on that day; however, during mission planning in Pix4D Capture, a Zenmuse X4S was chosen, which affected image overlap and ultimately changed the ground sampling distance (GSD, pixel resolution).
Table 2.
Numbers of adult females (F), pups (P), and males (M) in different zones. Blue represents the results from ground counting.
Table 2.
Numbers of adult females (F), pups (P), and males (M) in different zones. Blue represents the results from ground counting.
| Data | Zone I | Zone II | Zone III | Zone IV | Patelnia | ||||||||||
|---|---|---|---|---|---|---|---|---|---|---|---|---|---|---|---|
| F | P | M | F | P | M | F | P | M | F | P | M | F | P | M | |
| October 1 | 53 | 11 | 3 | 0 | 0 | 3 | 0 | 0 | 0 | 0 | 0 | 0 | 53 | 11 | 6 |
| October 11 | 140 | 85 | 4 | 6 | 1 | 1 | 0 | 0 | 0 | 33 | 1 | 1 | 179 | 87 | 13 |
| October 15 | 202 | 153 | 9 | 24 | 4 | 4 | 25 | 7 | 2 | 53 | 20 | 3 | 305 | 184 | 24 |
| October 19 | 259 | 182 | 6 | 42 | 15 | 4 | 31 | 24 | 2 | 67 | 9 | 2 | 400 | 260 | 15 |
| October 24 | 284 | 256 | 8 | 46 | 38 | 3 | 35 | 31 | 5 | 64 | 61 | 3 | 428 | 386 | 21 |
| 265 | 166 | 7 | 49 | 36 | 4 | 35 | 31 | 4 | 57 | 38 | 2 | 406 | 271 | 17 | |
| % Error | 6.7 | 35.2 | 12.5 | 6.1 | 5.3 | 25.0 | 0 | 0 | 20.0 | 10.9 | 37.7 | 33.3 | 5.1 | 29.8 | 19.0 |
| October 27 | 273 | 267 | 9 | 46 | 37 | 3 | 36 | 34 | 4 | 68 | 66 | 4 | 423 | 405 | 22 |
| November 1 | 218 | 253 | 3 | 47 | 46 | 4 | 35 | 36 | 2 | 61 | 64 | 3 | 363 | 412 | 17 |
| 216 | 177 | 4 | 50 | 38 | 3 | 36 | 13 | 1 | 60 | 50 | 3 | 362 | 278 | 11 | |
| % Error | 0.9 | 30.0 | 25.0 | 6.0 | 17.4 | 25.0 | 2.8 | 63.9 | 50.0 | 1.6 | 21.9 | 0 | 0.3 | 32.5 | 35.3 |
| November 4 | 180 | 210 | 8 | 44 | 47 | 4 | 36 | 35 | 3 | 58 | 63 | 2 | 318 | 418 | 20 |
| November 7 | 145 | 199 | 1 | 42 | 47 | 6 | 24 | 32 | 2 | 45 | 66 | 5 | 318 | 411 | 15 |
| November 16 | 34 | 118 | 6 | 15 | 38 | 7 | 2 | 101 | 2 | 3 | 28 | 2 | 59 | 395 | 18 |
| 34 | 70 | 5 | 15 | 12 | 4 | 2 | 100 | 3 | 2 | 26 | 3 | 53 | 388 | 15 | |
| % Error | 0 | 40.7 | 16.7 | 0 | 68.4 | 42.9 | 0 | 1.0 | 33.3 | 33.3 | 7.1 | 33.3 | 10.2 | 1.8 | 16.7 |
| November 26 | 4 | 30 | 3 | 1 | 16 | 3 | 4 | 121 | 1 | 1 | 97 | 1 | 10 | 329 | 13 |
| December 6 | 0 | 9 | 6 | 0 | 13 | 0 | 0 | 50 | 7 | 0 | 51 | 5 | 0 | 316 | 28 |
© 2020 by the authors. Licensee MDPI, Basel, Switzerland. This article is an open access article distributed under the terms and conditions of the Creative Commons Attribution (CC BY) license (http://creativecommons.org/licenses/by/4.0/).
Share and Cite
MDPI and ACS Style
Fudala, K.; Bialik, R.J. Breeding Colony Dynamics of Southern Elephant Seals at Patelnia Point, King George Island, Antarctica. Remote Sens. 2020, 12, 2964. https://doi.org/10.3390/rs12182964
AMA Style
Fudala K, Bialik RJ. Breeding Colony Dynamics of Southern Elephant Seals at Patelnia Point, King George Island, Antarctica. Remote Sensing. 2020; 12(18):2964. https://doi.org/10.3390/rs12182964
Chicago/Turabian StyleFudala, Katarzyna, and Robert Józef Bialik. 2020. "Breeding Colony Dynamics of Southern Elephant Seals at Patelnia Point, King George Island, Antarctica" Remote Sensing 12, no. 18: 2964. https://doi.org/10.3390/rs12182964
Note that from the first issue of 2016, this journal uses article numbers instead of page numbers. See further details here.