Article

Geographic Distribution of Desert Locusts in Africa, Asia and Europe Using Multiple Sources of Remote-Sensing Data

1
State Key Laboratory of Desert and Oasis Ecology, Xinjiang Institute of Ecology and Geography, Chinese Academy of Sciences, Urumqi 830011, China
2
Research Center for Ecology and Environment of Central Asia, CAS, Urumqi 830011, China
3
Shenzhen Institutes of Advanced Technology, Chinese Academy of Sciences, Shenzhen 518055, China
4
University of Chinese Academy of Sciences, Beijing 100049, China
5
Key Laboratory of GIS & RS Application Xinjiang Uygur Autonomous Region, Urumqi 830011, China
*
Author to whom correspondence should be addressed.
Remote Sens. 2020, 12(21), 3593; https://doi.org/10.3390/rs12213593
Submission received: 4 October 2020 / Revised: 23 October 2020 / Accepted: 27 October 2020 / Published: 2 November 2020

Abstract

:
In history, every occurrence of a desert locust plague has brought a devastating blow to local agriculture. Analyses of the potential geographic distribution and migration paths of desert locusts can be used to better monitor and provide early warnings about desert locust outbreaks. By using environmental data from multiple remote-sensing data sources, we simulate the potential habitats of desert locusts in Africa, Asia and Europe in this study using a logistic regression model that was developed based on desert locust monitoring records. The logistic regression model showed high accuracy, with an average training area under the curve (AUC) value of 0.84 and a kappa coefficient of 0.75. Our analysis indicated that the temperature and leaf area index (LAI) play important roles in shaping the spatial distribution of desert locusts. A model analysis based on data for six environmental variables over the past 15 years predicted that the potential habitats of desert locust present a periodic movement pattern between 40°N and 30°S latitude. The area of the potential desert locust habitat reached a maximum in July, with a suitable area exceeding 2.77 × 10⁷ km2 and located entirely between 0°N and 40°N in Asia-Europe and Africa. In December, the potential distribution of desert locusts reached its minimum area at 0.68 × 10⁷ km2 and was located between 30°N and 30°S in Asia and Africa. According to the model estimates, desert locust-prone areas are distributed in northern Ethiopia, South Sudan, northwestern Kenya, the southern Arabian Peninsula, the border area between India and Pakistan, and the southern Indian Peninsula. In addition, desert locusts were predicted to migrate from east to west between these areas and in Africa between 10°N and 17°N. Countries in these areas should closely monitor desert locust populations and respond rapidly.

Graphical Abstract

1. Introduction

Desert locusts have posed a major threat to agricultural activities since ancient times [1]. Approximately 300 species out of the more than 10,000 known desert locusts in more than 100 countries can cause serious damage to agriculture, forestry and animal husbandry activities. Some countries in Africa and Asia are more vulnerable than others [1]. There are approximately 60 countries with very high vulnerability to the desert locust [2]. Desert locusts reproduce rapidly, migrate very quickly, consume enormous amounts of plant matter, and cause destruction in agricultural areas. They are a serious threat to food security in some countries in Africa and Asia and can even cause socioeconomic problems [3].
In normal years, desert locusts usually live in remote deserts located from North Africa to Southwest Asia. However, changes in ecological conditions, such as the emergence of lush vegetation due to abnormal rainfall, can cause a rapid increase in the number of desert locusts [4]. For example, from July 2003 to April 2004, the desert locust disaster that occurred in the Sahel region of northwestern Africa was caused by above-average rainfall [5]. The population of desert locusts increases by approximately 20 times in each generation, and as desert locusts continue to gather, their movement direction tends to become more consistent [6]. A group of desert locusts can fly 150 km a day with favourable winds. An adult desert locust can consume an amount of fresh food equivalent to its weight every day. In 2004, an invasion of desert locusts caused massive decreases in food production in Burkina Faso, Mali and Mauritania [5]. In October 2018, Tropical Cyclone Laban landed in the coastal area of Yemen, causing desert locusts to breed uncontrollably. By January 2019, desert locust disasters had already occurred on the plains of Eritrea and Sudan. Currently, desert locusts have spread to more than 10 countries in Southwest Asia, the Arabian Peninsula and eastern Africa, and they have yet to be controlled.
Monitoring desert locusts and providing early warning and timely control of desert locust disasters have always been an important part of the work of the United Nations Food and Agriculture Organization (FAO) [7,8]. Existing studies have found that ground vegetation coverage has a close relationship with the growth of locust populations [9]. Vegetation coverage also directly affects the incubation time of desert locusts [10]. Precipitation and soil moisture play important roles in locust egg hatching [11,12]. Similarly, studies have indicated that locusts are sensitive to temperature changes during their hatching and growth [10]. Desert locusts may not be harmful soon after they hatch, and many factors influence whether desert locust populations develop into large-scale locust disasters. Locusts require suitable environmental conditions and several generations to complete the density-dependent phase transition process from the solitary phase to the gregarious phase [1]. Therefore, the FAO launched the Desert Locust Information Service (DLIS) to provide early warnings of possible desert locust outbreak disasters [13].
Remote sensing-based desert locust disaster monitoring research usually uses indirect methods to track areas of desert locust outbreaks by monitoring desert locust habitat [14]. In the early days of remote sensing, the most common method of monitoring and predicting locust outbreak disasters was to analyse changes in the vegetation that provides desert locust habitat [4,15]. As the spatial resolution of remote sensing images increases, multi-source remote sensing data has been used to monitor desert locust plagues, which is accompanied by the diversification of locust monitoring indicators [11]. In recent years, with the increasing popularity of machine-learning algorithms, desert locust disaster monitoring methods have been improved [16]. Many algorithms such as random forest have been used to analyse outbreaks of desert locusts and have achieved good results [17,18].
It is worth noting that most previous studies have monitored and analysed desert locusts over small areas but have not conducted research on the overall movement trends of desert locusts over a large area. This issue can be addressed with current remote-sensing technology, and the advantages of remote-sensing technology become very clear when monitoring large-scale areas, especially areas that are difficult for researchers to reach [3]. Many remote-sensing datasets with surface environmental parameters are available, such as those from the Polar Orbit Environmental Satellites, the two medium-resolution imaging spectrometers (MODIS) on Aqua and Terra, Landsat Multispectral Scanner (MSS) from National Aeronautics and Space Administration (NASA), Advanced Very High Resolution Radiometer (AVHRR) from National Oceanic and Atmospheric Administration (NOAA) and the Japanese Geostationary Meteorological Satellite (GMS) [19]. In this study, desert locust disaster monitoring data and multiple remote-sensing data sources were used to simulate the potential distribution of desert locusts, and research on the distribution area of desert locusts and its change mechanisms was conducted. This study has three objectives: (1) to assess the main factors affecting the distribution of desert locusts; (2) to analyse the potential distribution areas of desert locusts in different months; and (3) to identify hot spots and migration paths suitable for the survival and reproduction of desert locusts in order to increase awareness, prevention and countermeasure preparation in these areas.

2. Materials and Methods
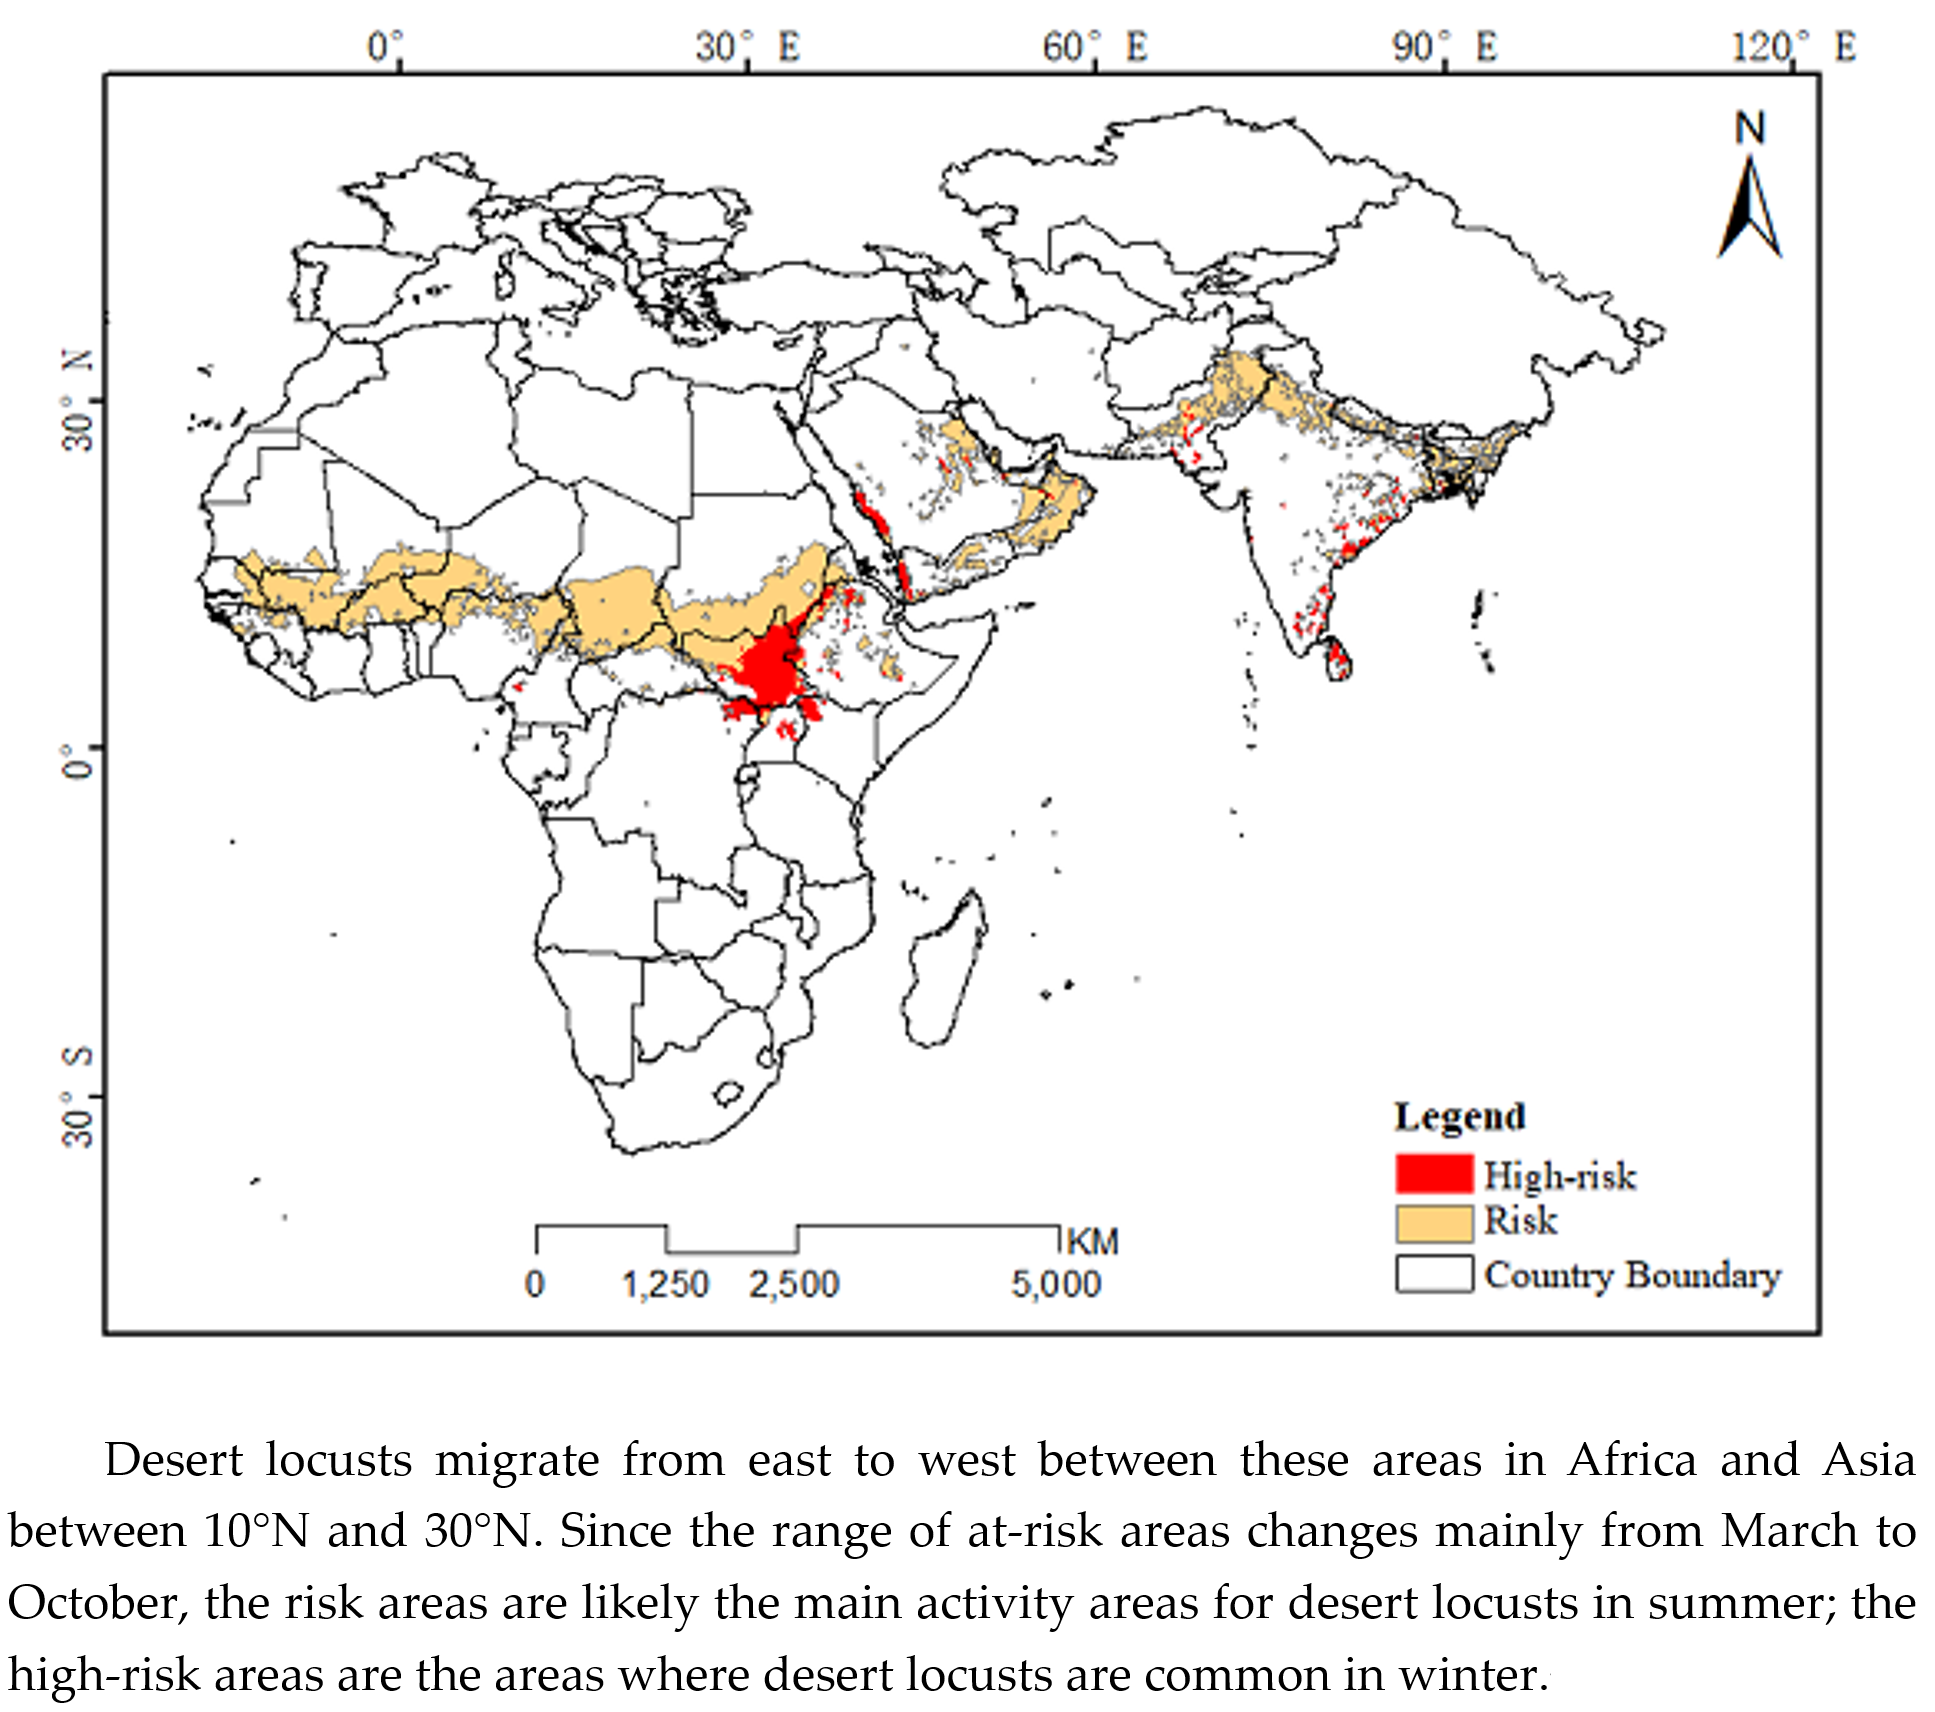
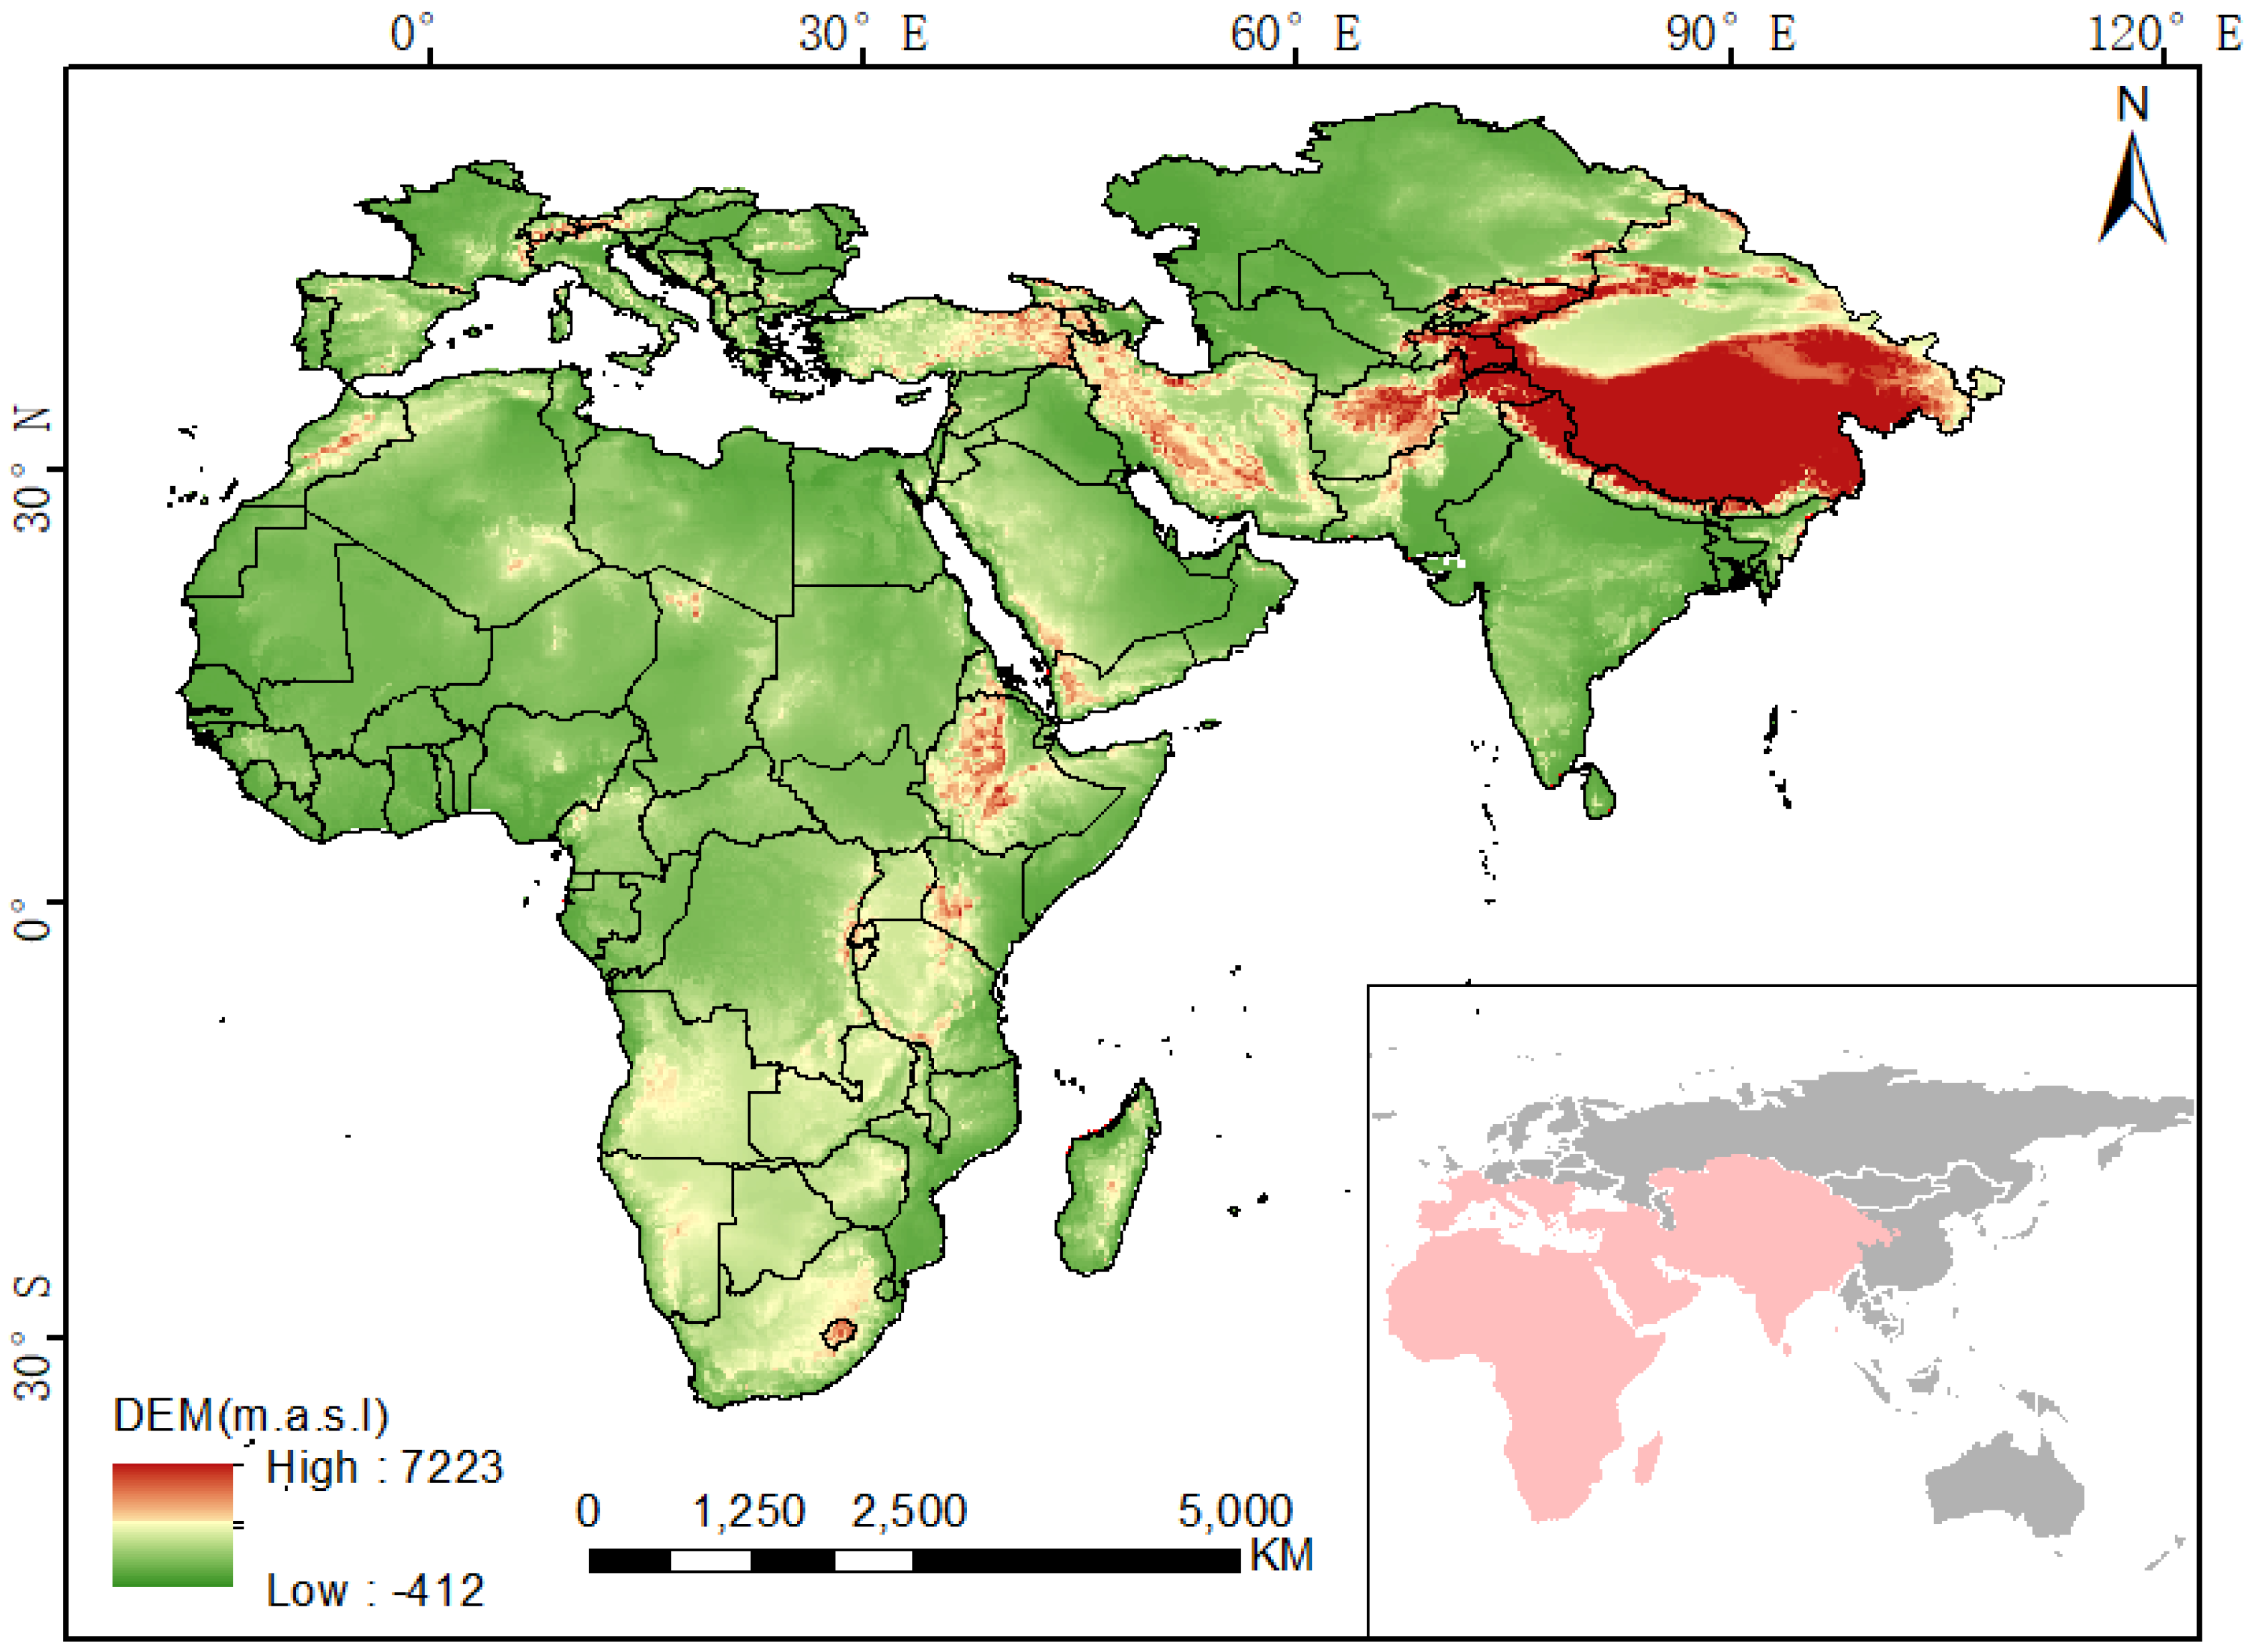
2.1. Study Area

The study area for this research combines the spatial distributions of previous studies [1,2] with the current monitoring results. The study area ranges from Senegal, the westernmost point of Africa, to Gansu Province, China, in the east and from the northernmost point of Kazakhstan to the Cape of Good Hope in Africa in the south. It covers all of Africa and most of southwestern to central Eurasia, and has a total area of more than 5.15 × 10⁷ km2. The study area contains different climatic zones, including tropical, arid, humid, and cold zones as defined in the updated Köppen–Geiger climatic classification [20]. Arid and semiarid climate regions that are usually distributed at altitudes of 0–2000 m account for more than half of the study area, including the Sahara, Kalahari, Arubali, Karakum, Taklimakan, and Tal deserts and many other tropical and temperate deserts (Figure 1). These regions are favourable breeding grounds for desert locusts.

2.2. Data Collection and Pre-Processing
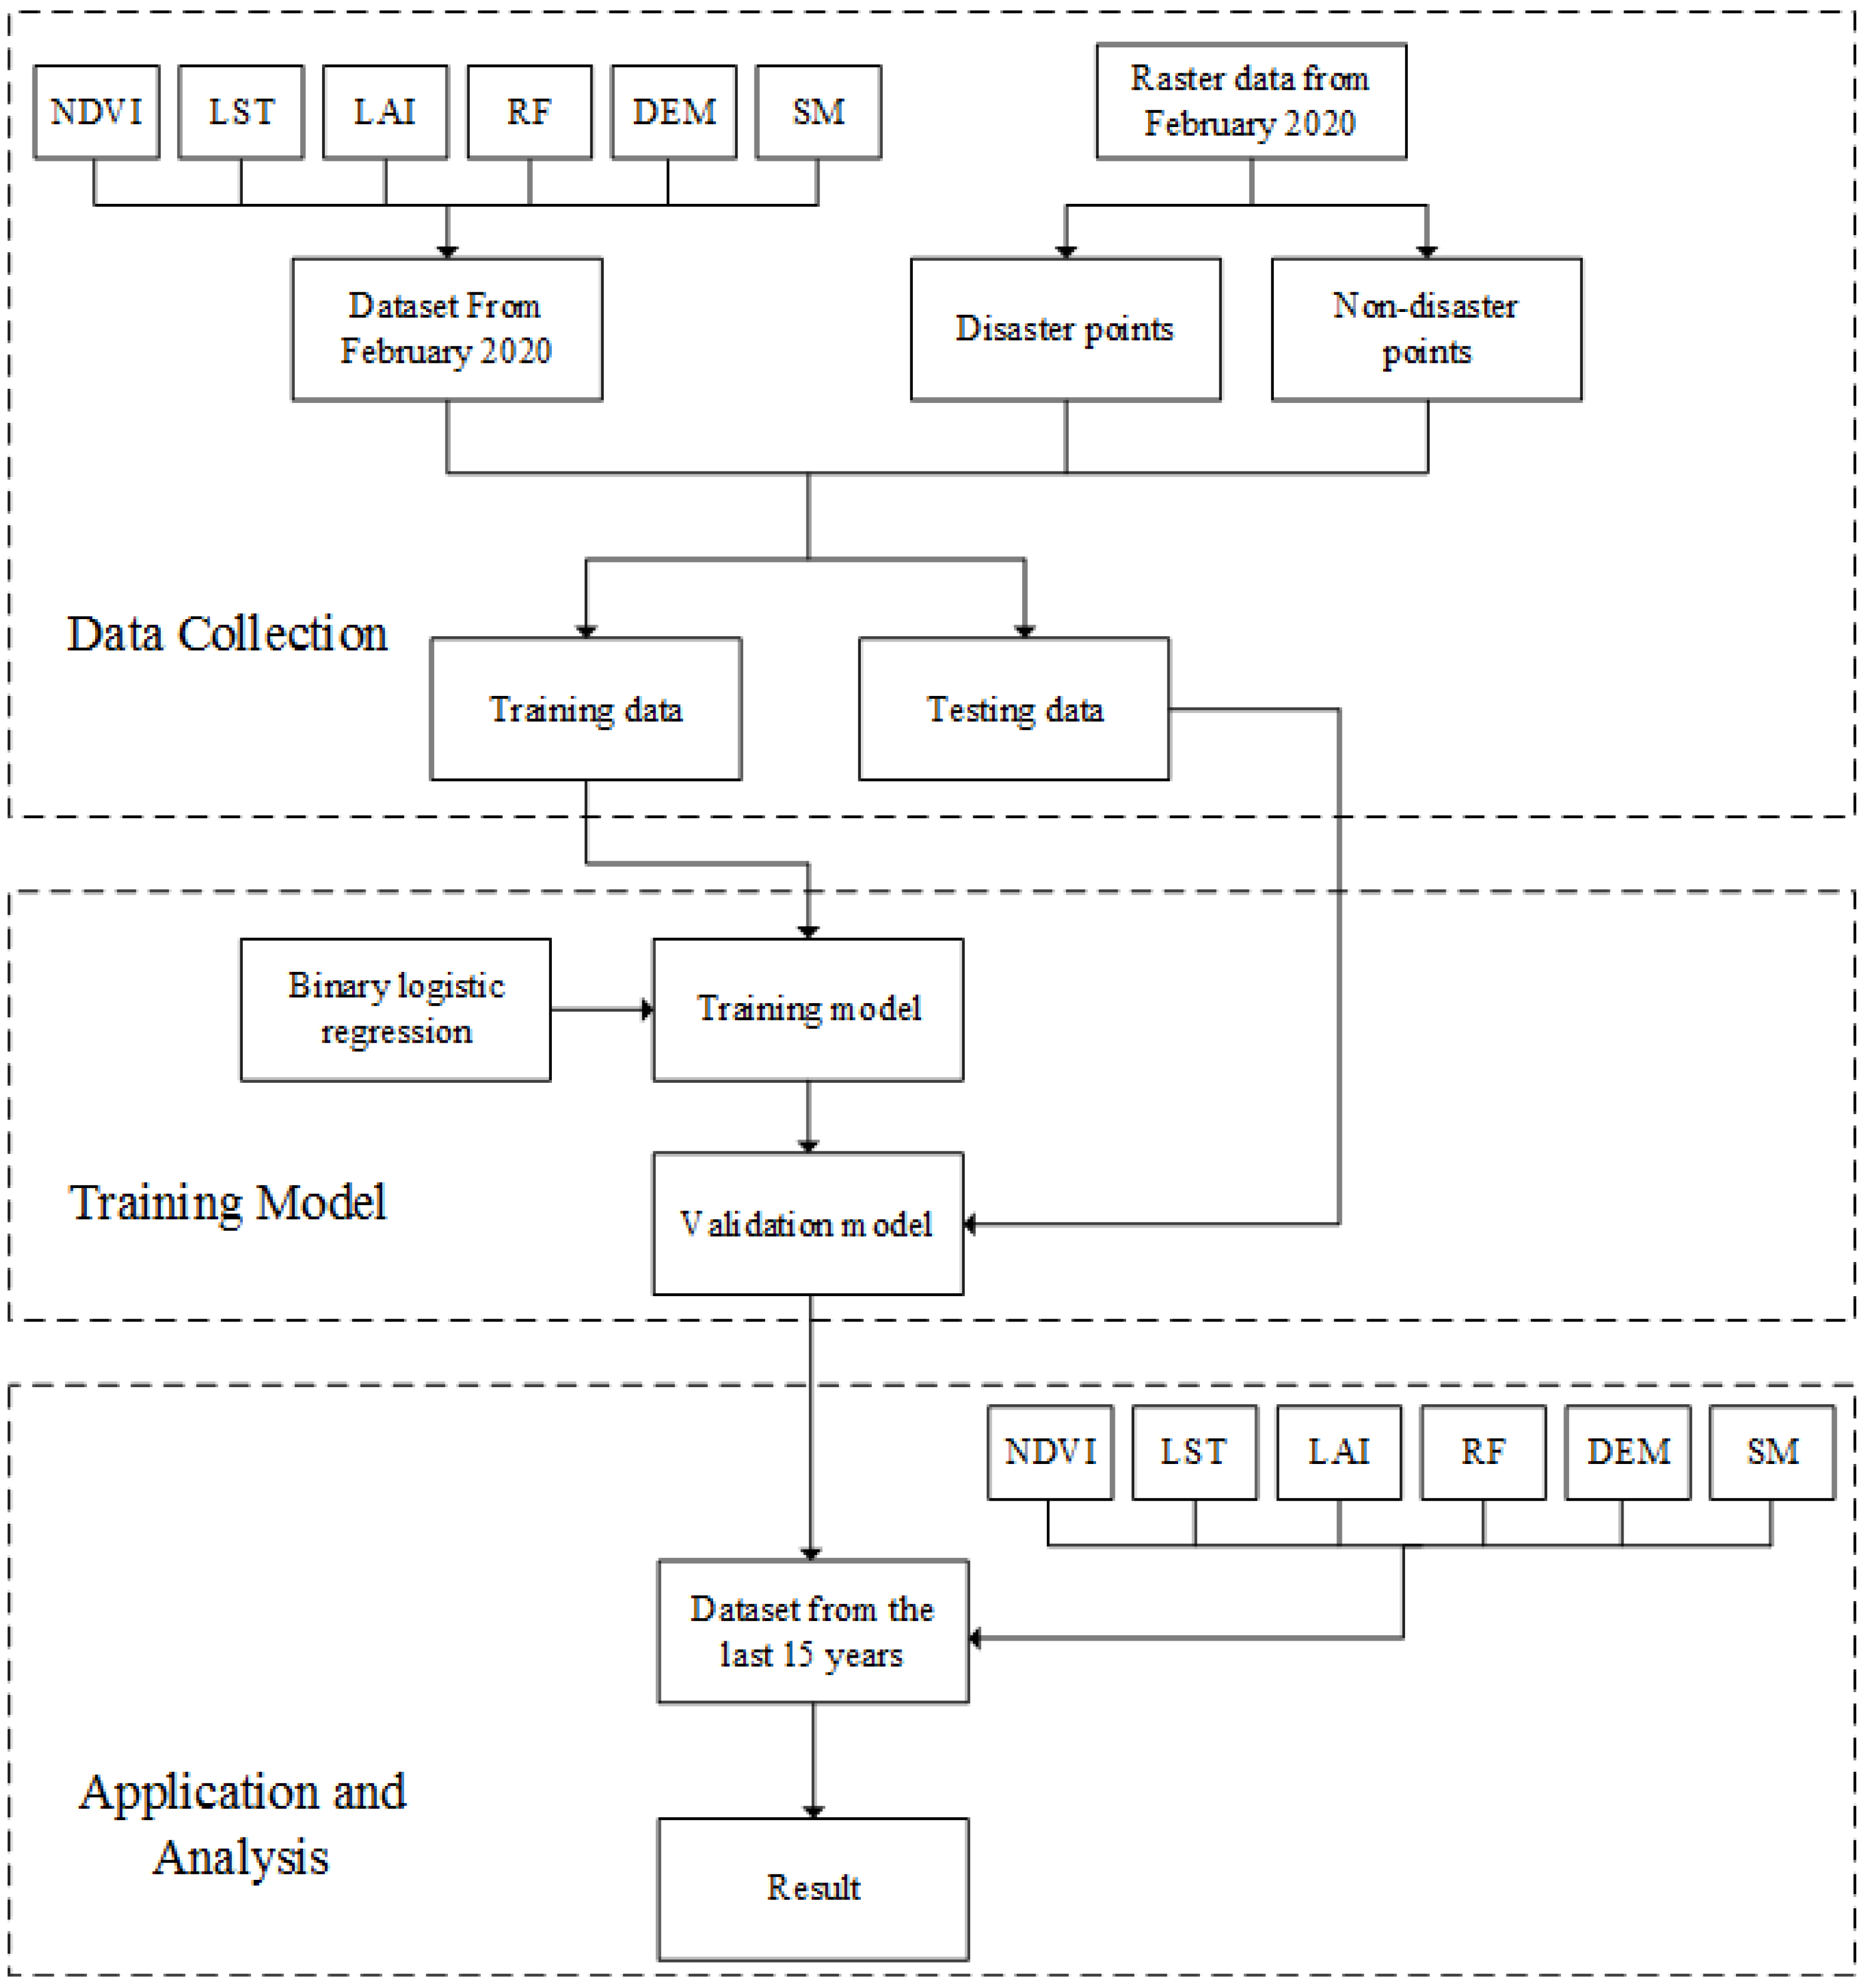
Based on the biological characteristics of desert locusts, this study selected six environmental variables, including the Normalized Difference Vegetation Index (NDVI), Leaf Area Index (LAI), Soil Moisture (SM), Rainfall (RF), Land Surface Temperature (LST) and Elevation, to establish a model of the potential geographic distribution of the desert locust (Table 1). The NDVI and LAI data were extracted from the Terra-MODIS version 6 leaf area index product MOD15A2H (500 m resolution) and the vegetation index product MOD11A2 (1 km resolution) (https://modis.gsfc.nasa.gov/; [21,22]). The SM data were obtained from the global land surface data assimilation system (GLDAS 2.1) (3 h and 0.25° × 0.25° resolutions) (http://disc.gsfc.nasa.gov/; [23]). The RF data were extracted from the next-generation global satellite precipitation product from the Global Precipitation Mission (0.1° × 0.1° resolution) (http://disc.gsfc.nasa.gov/; [24]). The LST and surface elevation data were obtained from the 30-arc-second WorldClim global digital elevation model (http://www.worldclim.org/; [25]). The desert locust outbreak monitoring data were obtained from the Big Earth Data Science Engineering Project (http://data.casearth.cn/).
The data were further processed before being used in the analysis following these steps: (1) the average values of the NDVI, LAI, LST and SM were calculated on a monthly basis; (2) the sum of the monthly RF was calculated; (3) the World Geodetic System1984 benchmark was used to project all geographic data into a geographic coordinate system; and (4) the data for all environment variables were resampled to 0.25° × 0.25° resolution to match the resolution of the SM data.

2.3. Methods

2.3.1. Model Establishment

Two thousand points were randomly extracted from the locust outbreak occurrence area and from the non-outbreak area in February 2020 as locust outbreak points and non-outbreak points, respectively. As is shown in workflow of analysis of the potential distribution of desert locusts (Figure 2), these points were then overlaid on the standardized evaluation index layer. ArcGIS’s spatial analysis function was used to map the 2000 random points and determine the values of the six evaluation index layers at the random points. Then, 80% of the point data (1600 groups) was used to train the model, and 20% of the point data (400 groups) were used to test the accuracy of the model. To reduce errors caused by the improper selection of predictors, a complete dataset containing all environmental variables was used for the initial operation [26]. According to the principles of binary logistic regression, the random points in the locust outbreak occurrence area were assigned a value of 1, and the random points in the non-outbreak occurrence area were assigned a value of 0. The environmental data were used to analyse the potential habitats of desert locust based on the monthly averages from the past 15 years. Then, SPSS software was used to perform a binary logistic regression analysis on the 76,245 data cells.
In this study, multicollinearity was evaluated using the variance inflation factor (VIF) [27]. The six environmental variables had VIF values lower than 4, indicating that there was no multicollinearity. Two different evaluation methods were used to assess the performance of the models: the receiver operating characteristic (ROC) curve method [28] and Cohen’s Kappa [29]. We used the lower area of the receiver’s working curve (AUC) to estimate the accuracy of the model prediction [30,31]. A relative weight estimation method based on the maximum correlation orthogonal change was used to analyse the relative importance of the six environmental variables [32].
If P is the probability of an event occurring, and its value range is [0, 1], the probability of the event not occurring is 1 P . When the value of P is close to 0 or 1, changes in P are difficult to capture, so the value of P needs to be transformed. Generally, the natural logarithm of P ( 1 P ) , ln ( P ( 1 P ) ) is used in this situation, and logit conversion is performed on P, which is written as logit P . The value range of logit P is (−∞, +∞). Using P as the dependent variable, a linear regression equation can be established:
logit P = l n ( P 1 P ) = α + β 1 X 1 + β 2 X 2 + + β n X n
P can be solved as follows:
P = e α + β 1 X 1 + β 2 X 2 + + β n X n 1 + e α + β 1 X 1 + β 2 X 2 + + β n X n
In Equation (2), X 1 , X 2 , X n are evaluation indexes that affect the probability of the results for the dependent variable; α is a constant that represents the logarithmic value of the ratio of the probability of occurrence of this event to the probability of non-occurrence when no evaluation index is involved; β 1 , β 2 , β n are the logistic regression coefficients of each evaluation index, which means that when a single evaluation index changes, the logarithmic change value of the ratio of the occurrence and non-occurrence probability of the event; and P indicates the probability of the event occurring under the combined action of various evaluation indicators.

2.3.2. Assessment of Potential Desert Locust Habitat

The logistic regression model was used to predict the probability of desert locust survival (0–100%) in each grid at a spatial resolution of 0.25° in the study area. To produce a map of the desert locust distribution, the continuous probability values were converted to binary predictions based on a threshold value. This probability threshold was determined by matching the model predictions to the extracted distribution of desert locusts according to the maximum training sensitivity plus specificity criterion [33]. This criterion uses training data to optimize the trade-off between specificity and sensitivity; it has been recognized as one of the most effective threshold selection methods [34,35]. Grids with predicted probabilities higher than the threshold value were assigned a value of 1, representing high to moderate habitat suitability, and were labelled suitable habitats. Grids with predicted probabilities lower than the threshold value were assigned a value of 0, representing low habitat suitability or an unsuitable habitat, and were labelled unsuitable habitats.
The above model was used to analyse the monthly average data over 12 months, and the predicted probability map for each month was converted into a binary distribution map as described above. Finally, the changes in the potential distribution area of desert locusts over the 12 months were analysed by comparing the habitat suitability/unsuitability maps for all the months. The changes in the potential locust distribution area were classified as (1) increased habitat, (2) decreased habitat, and (3) unchanged habitat [36]. This paper evaluates the changes in the spatial pattern of the desert locust potential distribution area from two perspectives: habitat area change and habitat range change. By calculating the location of the potential distribution area of desert locusts in the different months, the potential habitat change trends and directions of desert locust dispersal can be obtained.

3. Results

3.1. Model Validation and Variable Contribution

Logistic models have not achieve great accuracy, and this is likely due to the broad distribution across several climatic regions. Although the modelling accuracy also depends on the factors like spatial resolution, size of the study area, methods and quality of input datasets [37], our study overall shows an acceptable model performance based on these two statistics. The ROC method and the kappa coefficient were used to test the accuracy of the model. After the calculations, the AUC value for the model was 0.84, and kappa was 0.75. Both methods indicated that the model performed well. The relative weight estimation method was used to recalculate the logistic regression coefficients of the various environmental variables to determine their contributions to the model results. The results showed that LST (27.02%) and LAI (25.63%) were the main contributors to the potential desert locust distribution. Their cumulative contribution was 52.65%.

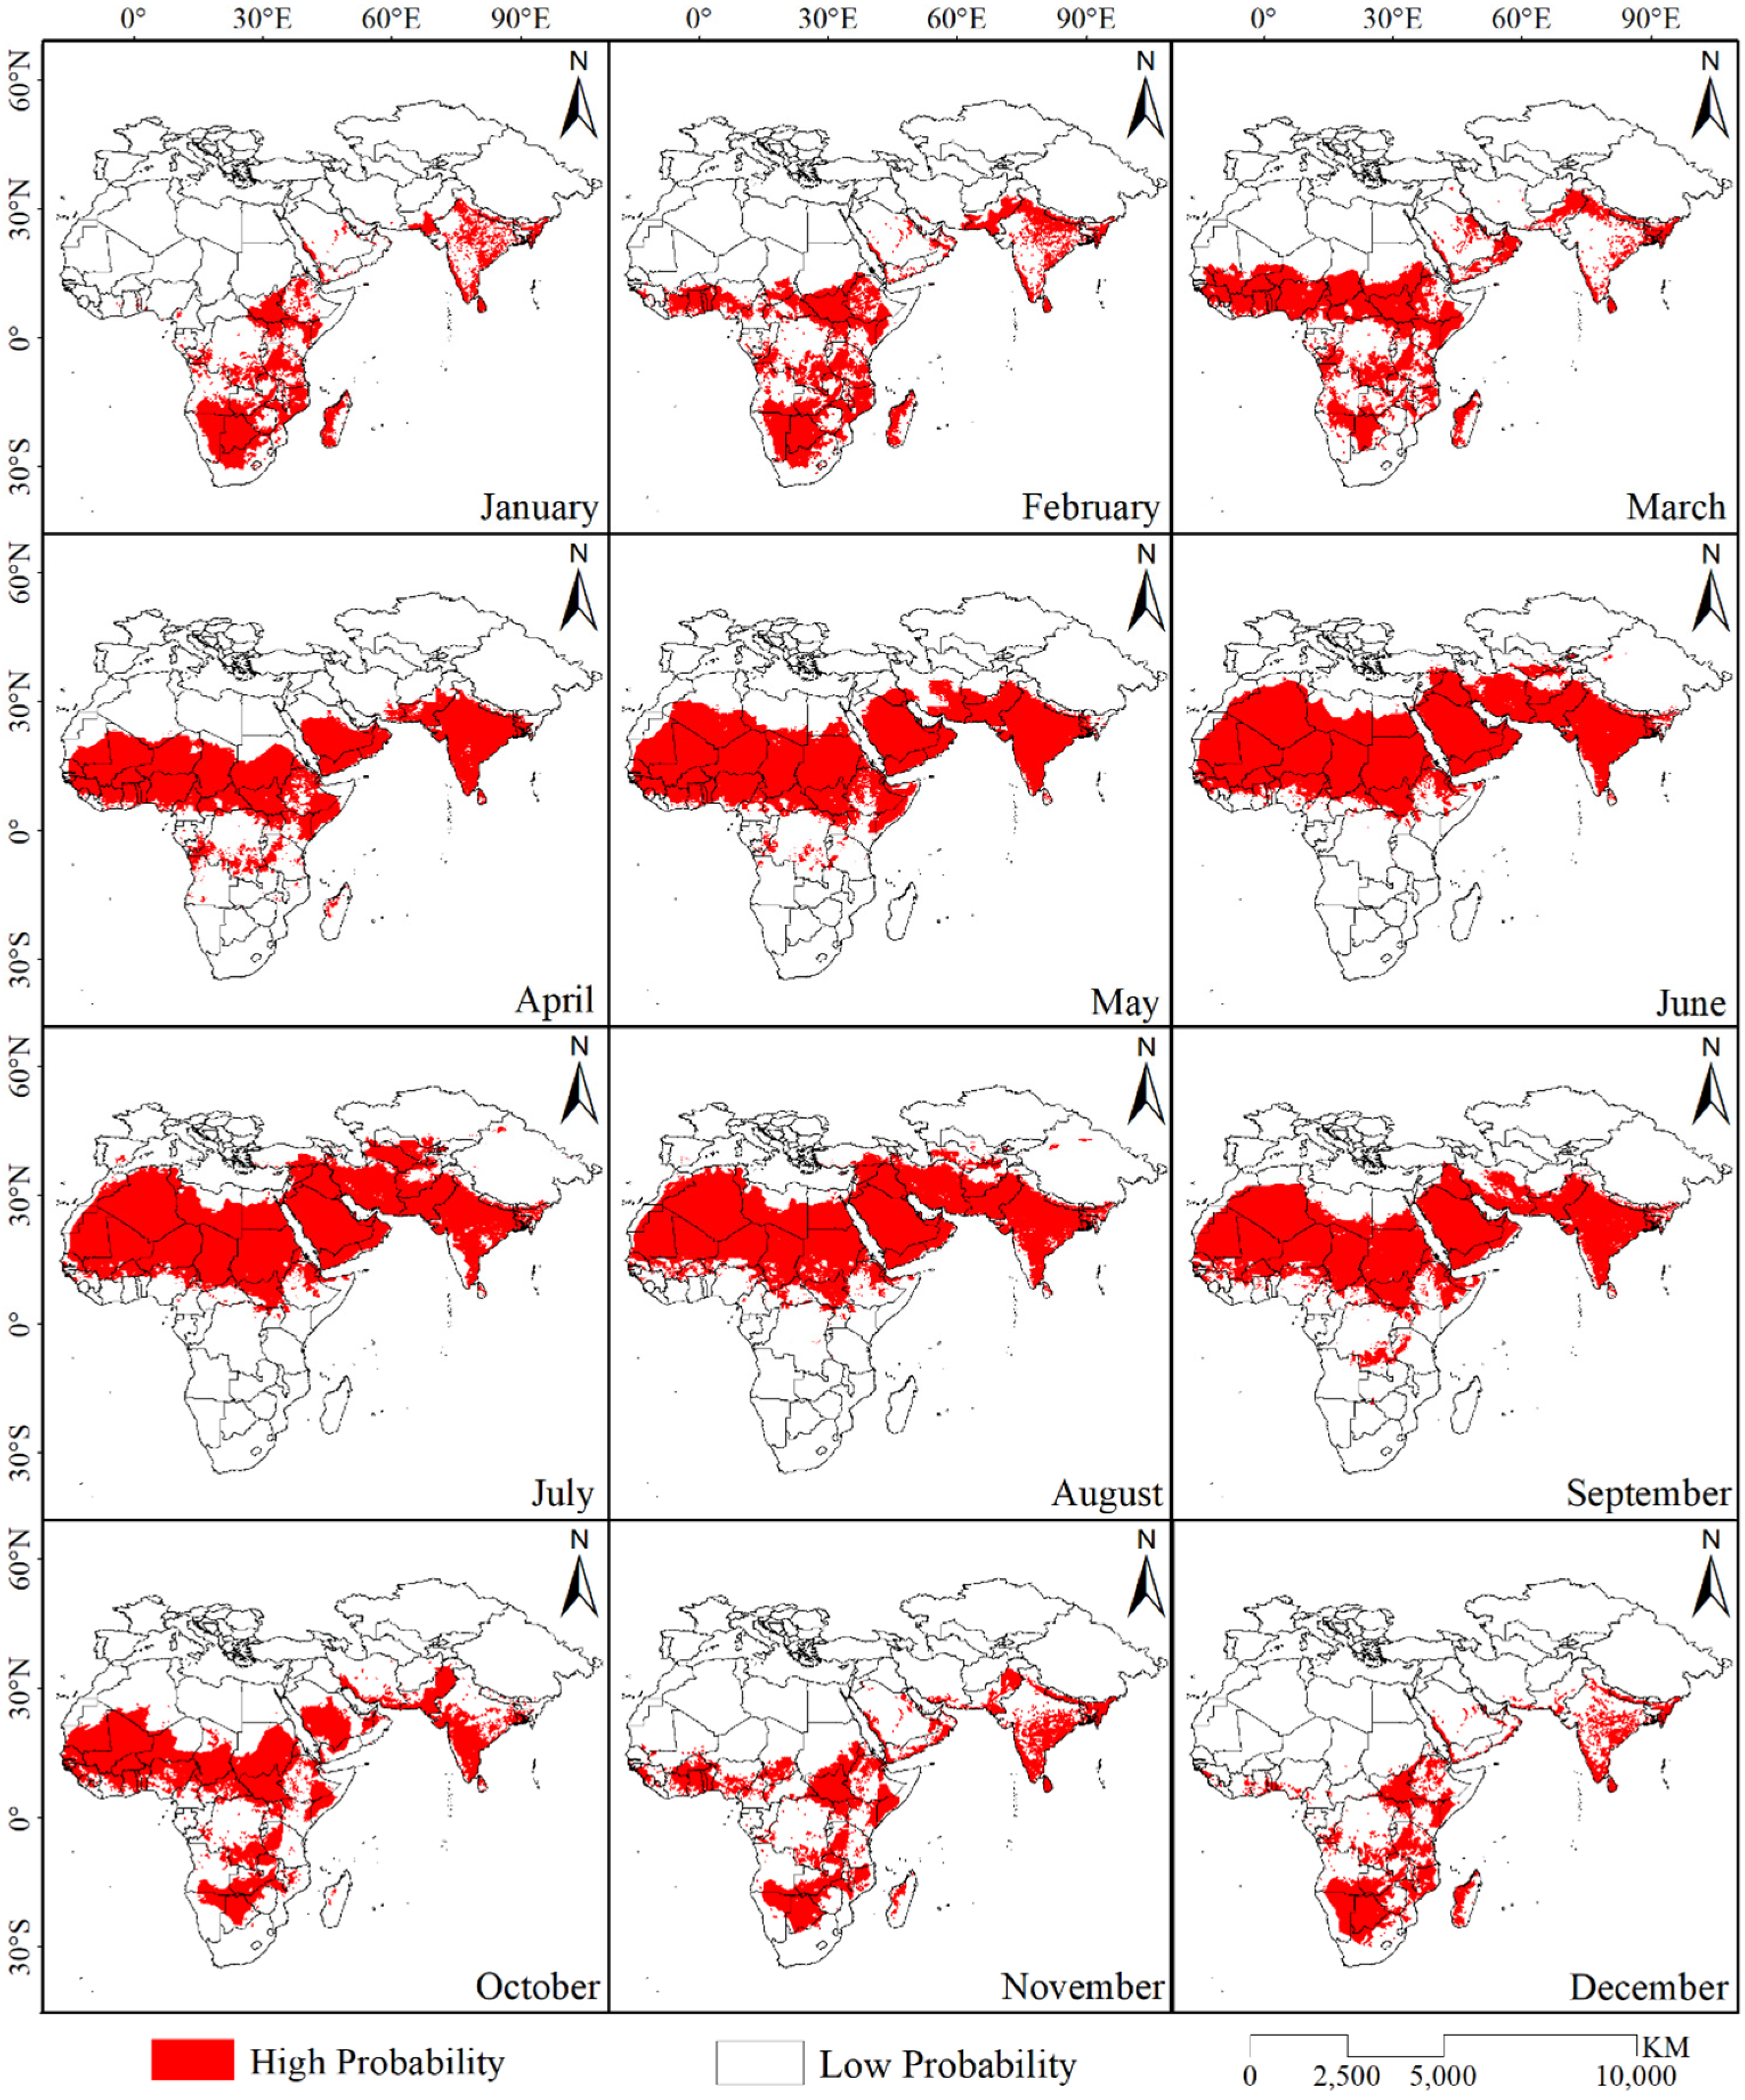
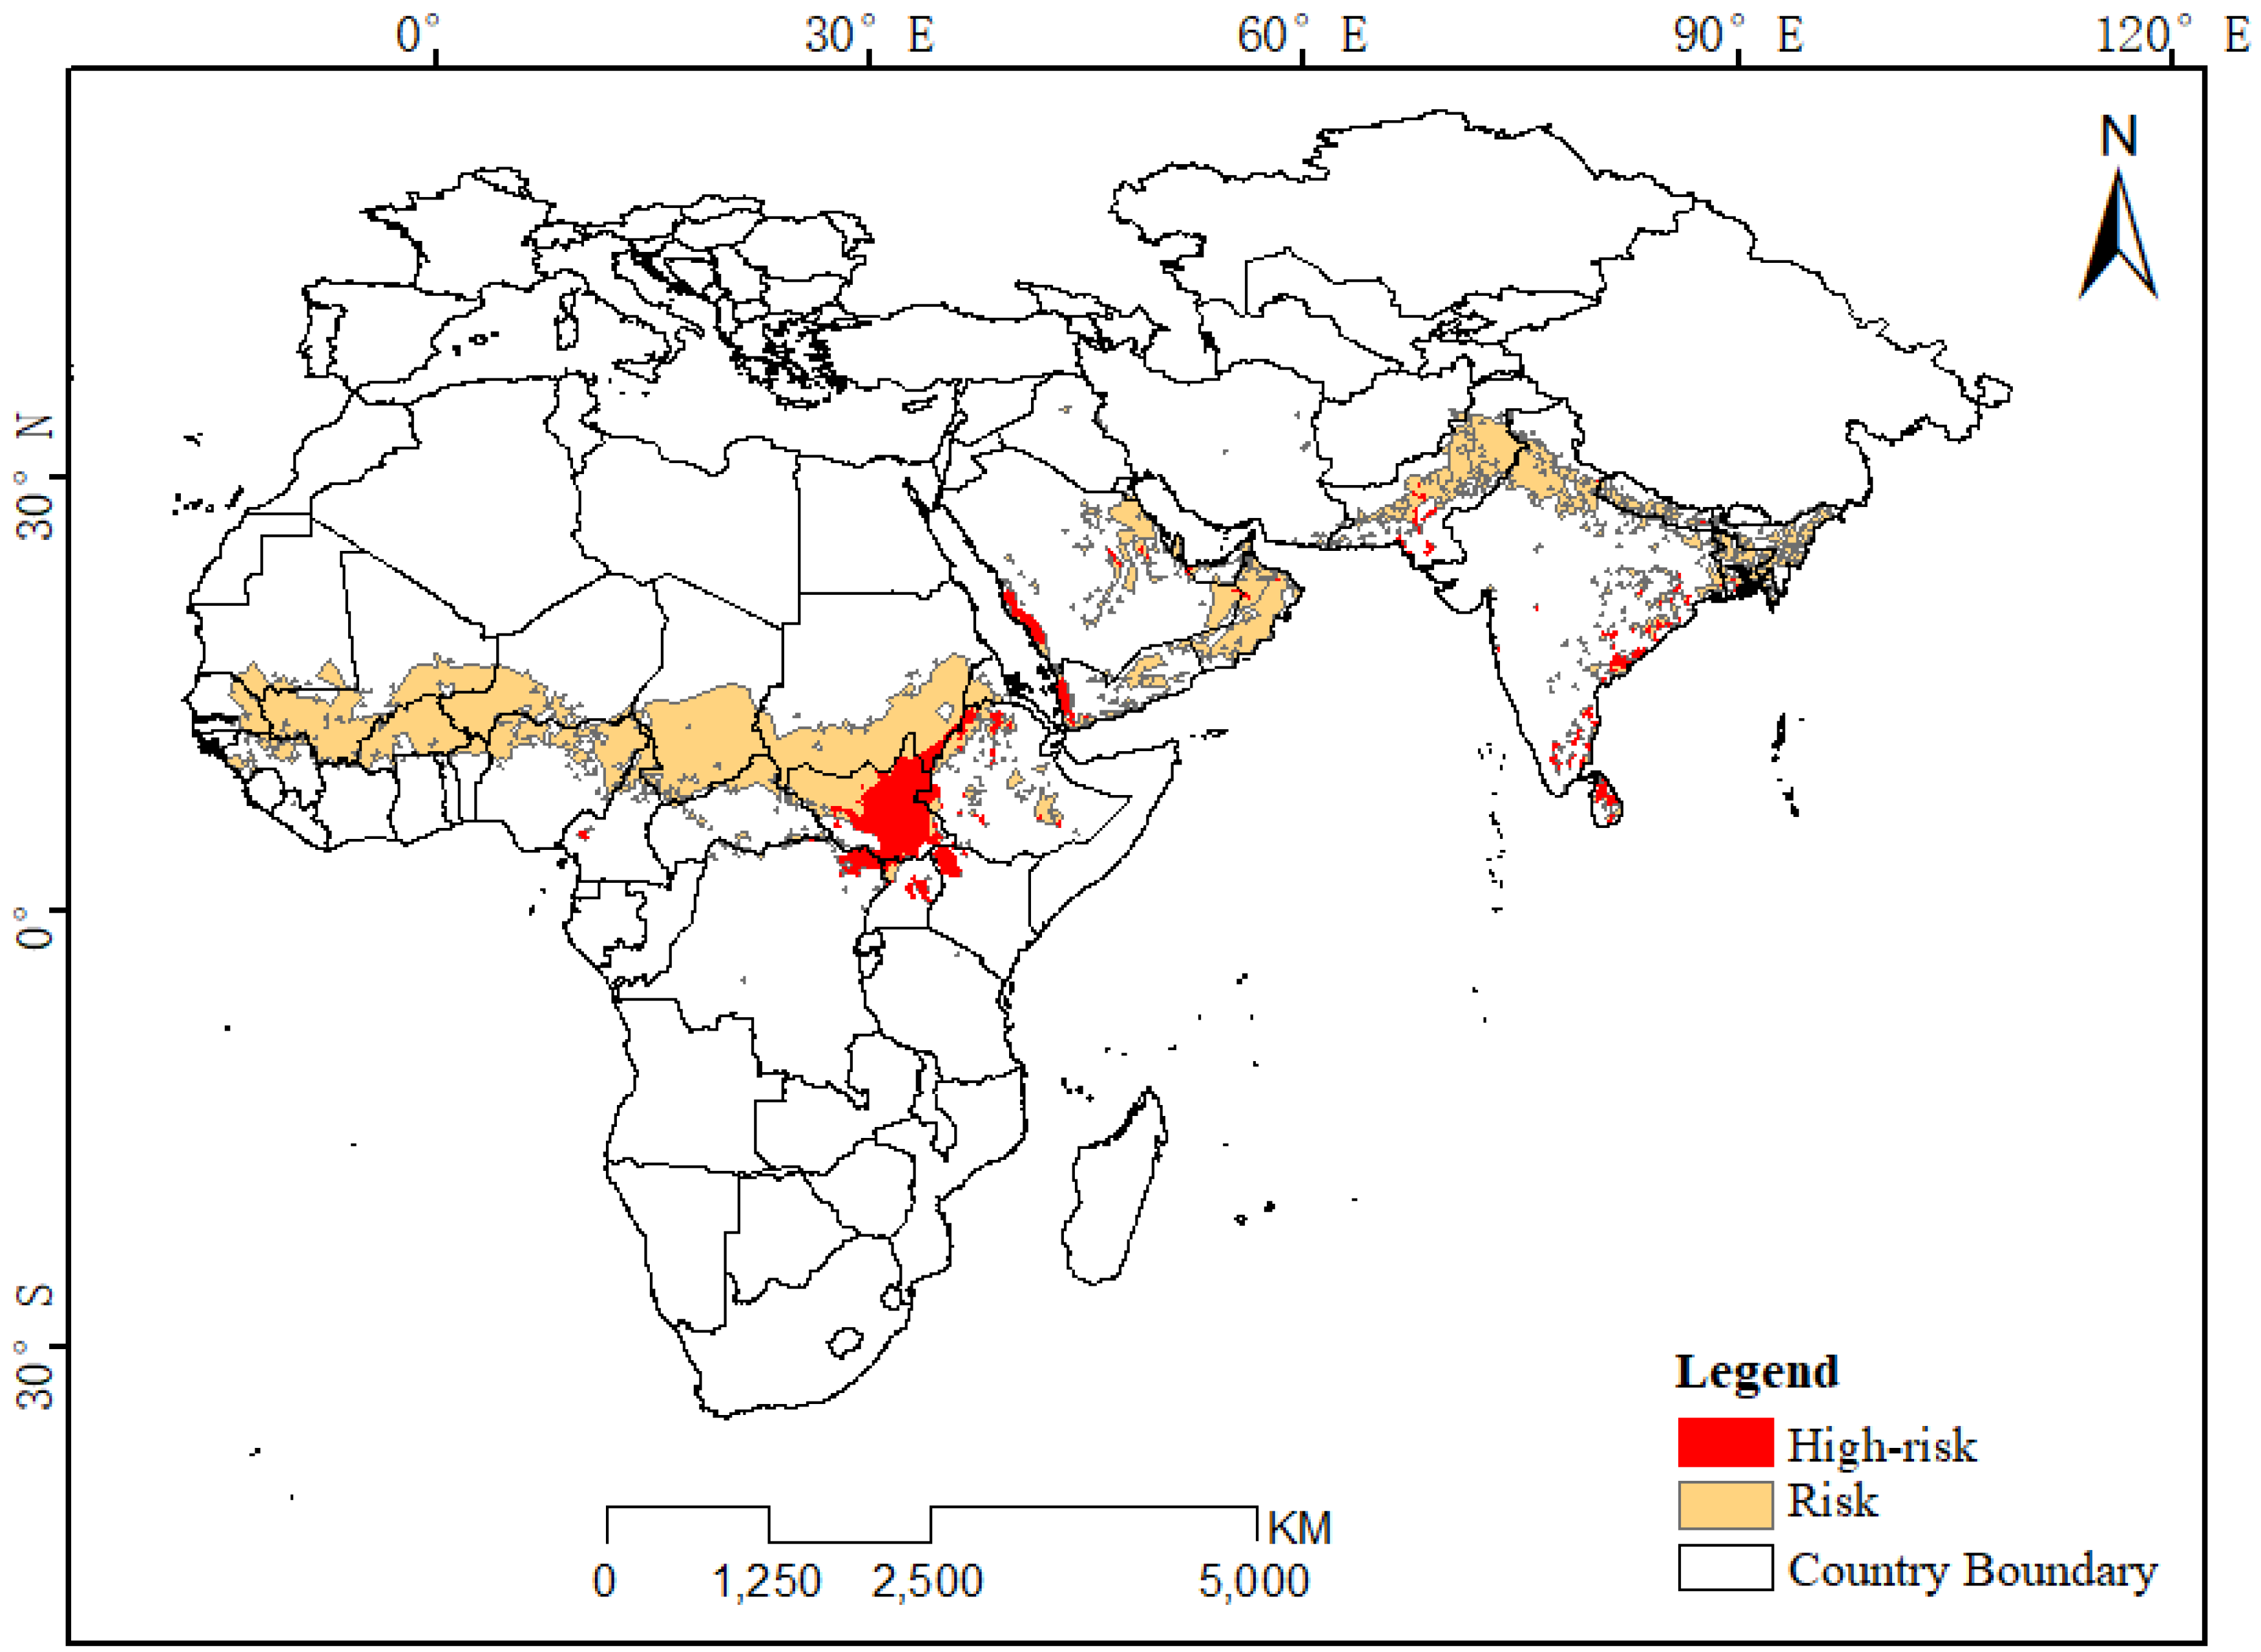
3.2. Potential Distribution of Desert Locusts

The trained desert locust distribution model and the monthly average data for six environmental variables were used to simulate the potential distribution range of desert locusts in the study area over 12 months (Figure 3). The results show that the potential distribution area of desert locusts gradually increased from January to July. The distribution area reached its maximum in July, at approximately 2.77 × 10⁷ km2, and was concentrated in the northern countries of Africa, the Arabian Peninsula, the southern tip of Turkey, the southern tip of Uzbekistan and Kazakhstan that reaches Central Asia, Iran, Pakistan, and the Indian Peninsula and extended to the southern part of Tibet, China. In addition, there were scattered distribution areas in northern Xinjiang and southern Spain. Starting in July, the distribution area gradually decreased, and it reached a minimum of 0.68 × 10⁷ km2 in December. This area was mainly distributed in the eastern part of Africa, from 10°N to 30°S latitude. North of the equator, the potential distribution area was only in South Sudan, northern Ethiopia, southern Somalia, the western Red Sea coast of the Arabian Peninsula and southern Yemen, Oman, the southernmost tip of Iran, the central and southern parts of the Indian Peninsula, and the border area between India and Pakistan.

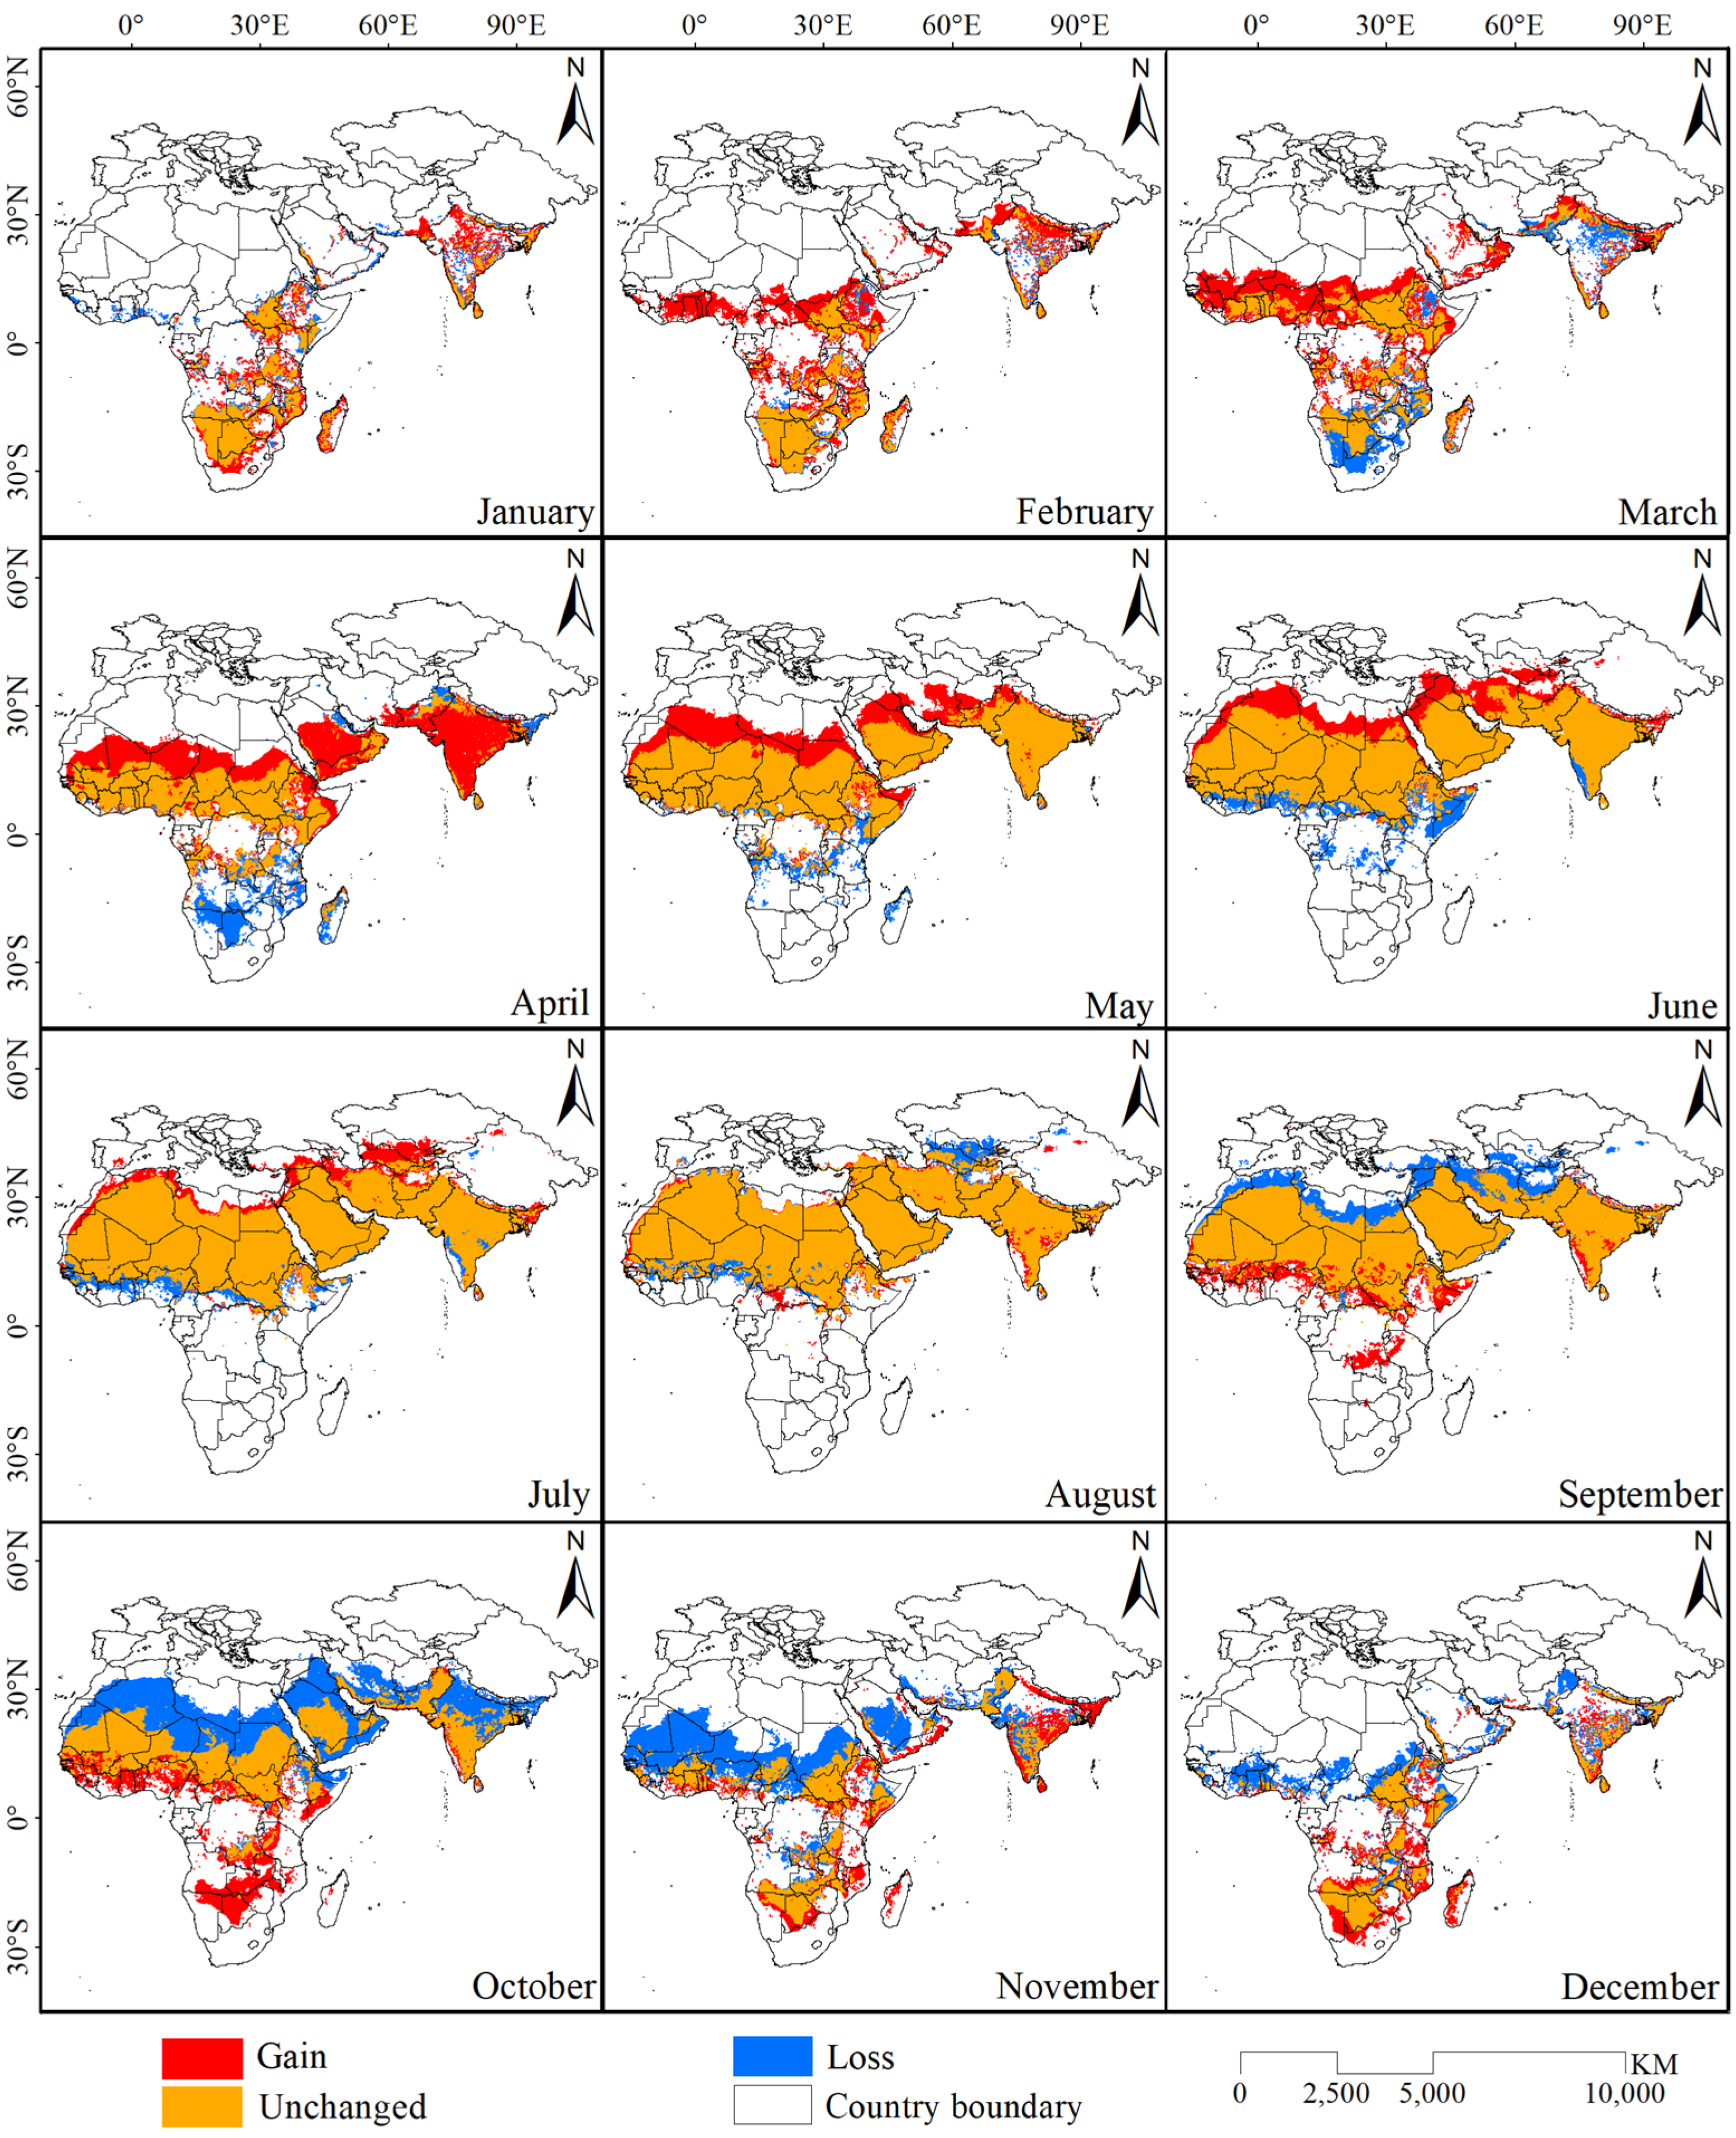
3.3. Changes in the Potential Distribution Area

Based on the results of the potential desert locust distribution model with the highest training sensitivity and specificity, binary potential distribution maps for the desert locust (Figure 3) were developed, and the areal changes in the potential distribution range in different months were calculated (Table 2). The results showed that the potential distribution area of desert locusts began to gradually increase in January and reached a maximum in July. Starting in August, the difference between the increased and decreased areas became negative, indicating that the potential distribution area of desert locusts was gradually decreasing; the distribution area reached its lowest value in December. In addition, the spatial differences between the potential desert locust distribution maps in adjacent months were determined to obtain the geographic and spatial distribution of the increased and decreased habitat areas in each month (Figure 4). Beginning in February, the potential distribution area of desert locusts gradually moved from south to north, and this phenomenon continued until July. Additionally, all of the increased habitat area was located in the southern part of the potential distribution area of desert locusts starting in August, at which point the whole area began to gradually move southward. The distribution area reached its southernmost point in January and began to move northward in February. The potential distribution area of desert locusts showed obvious periodic north–south movement within the year.
We extracted the geographic location of the areas where the desert locust population increased in each month and the corresponding temperature and SM data for these areas (Figure 5). In the areas where the locust outbreak area increased, the temperature was fairly consistent within each month, but the SM varied substantially. We believe that SM and temperature impacted the locust distribution to different degrees because of this difference in their variability.

4. Discussion

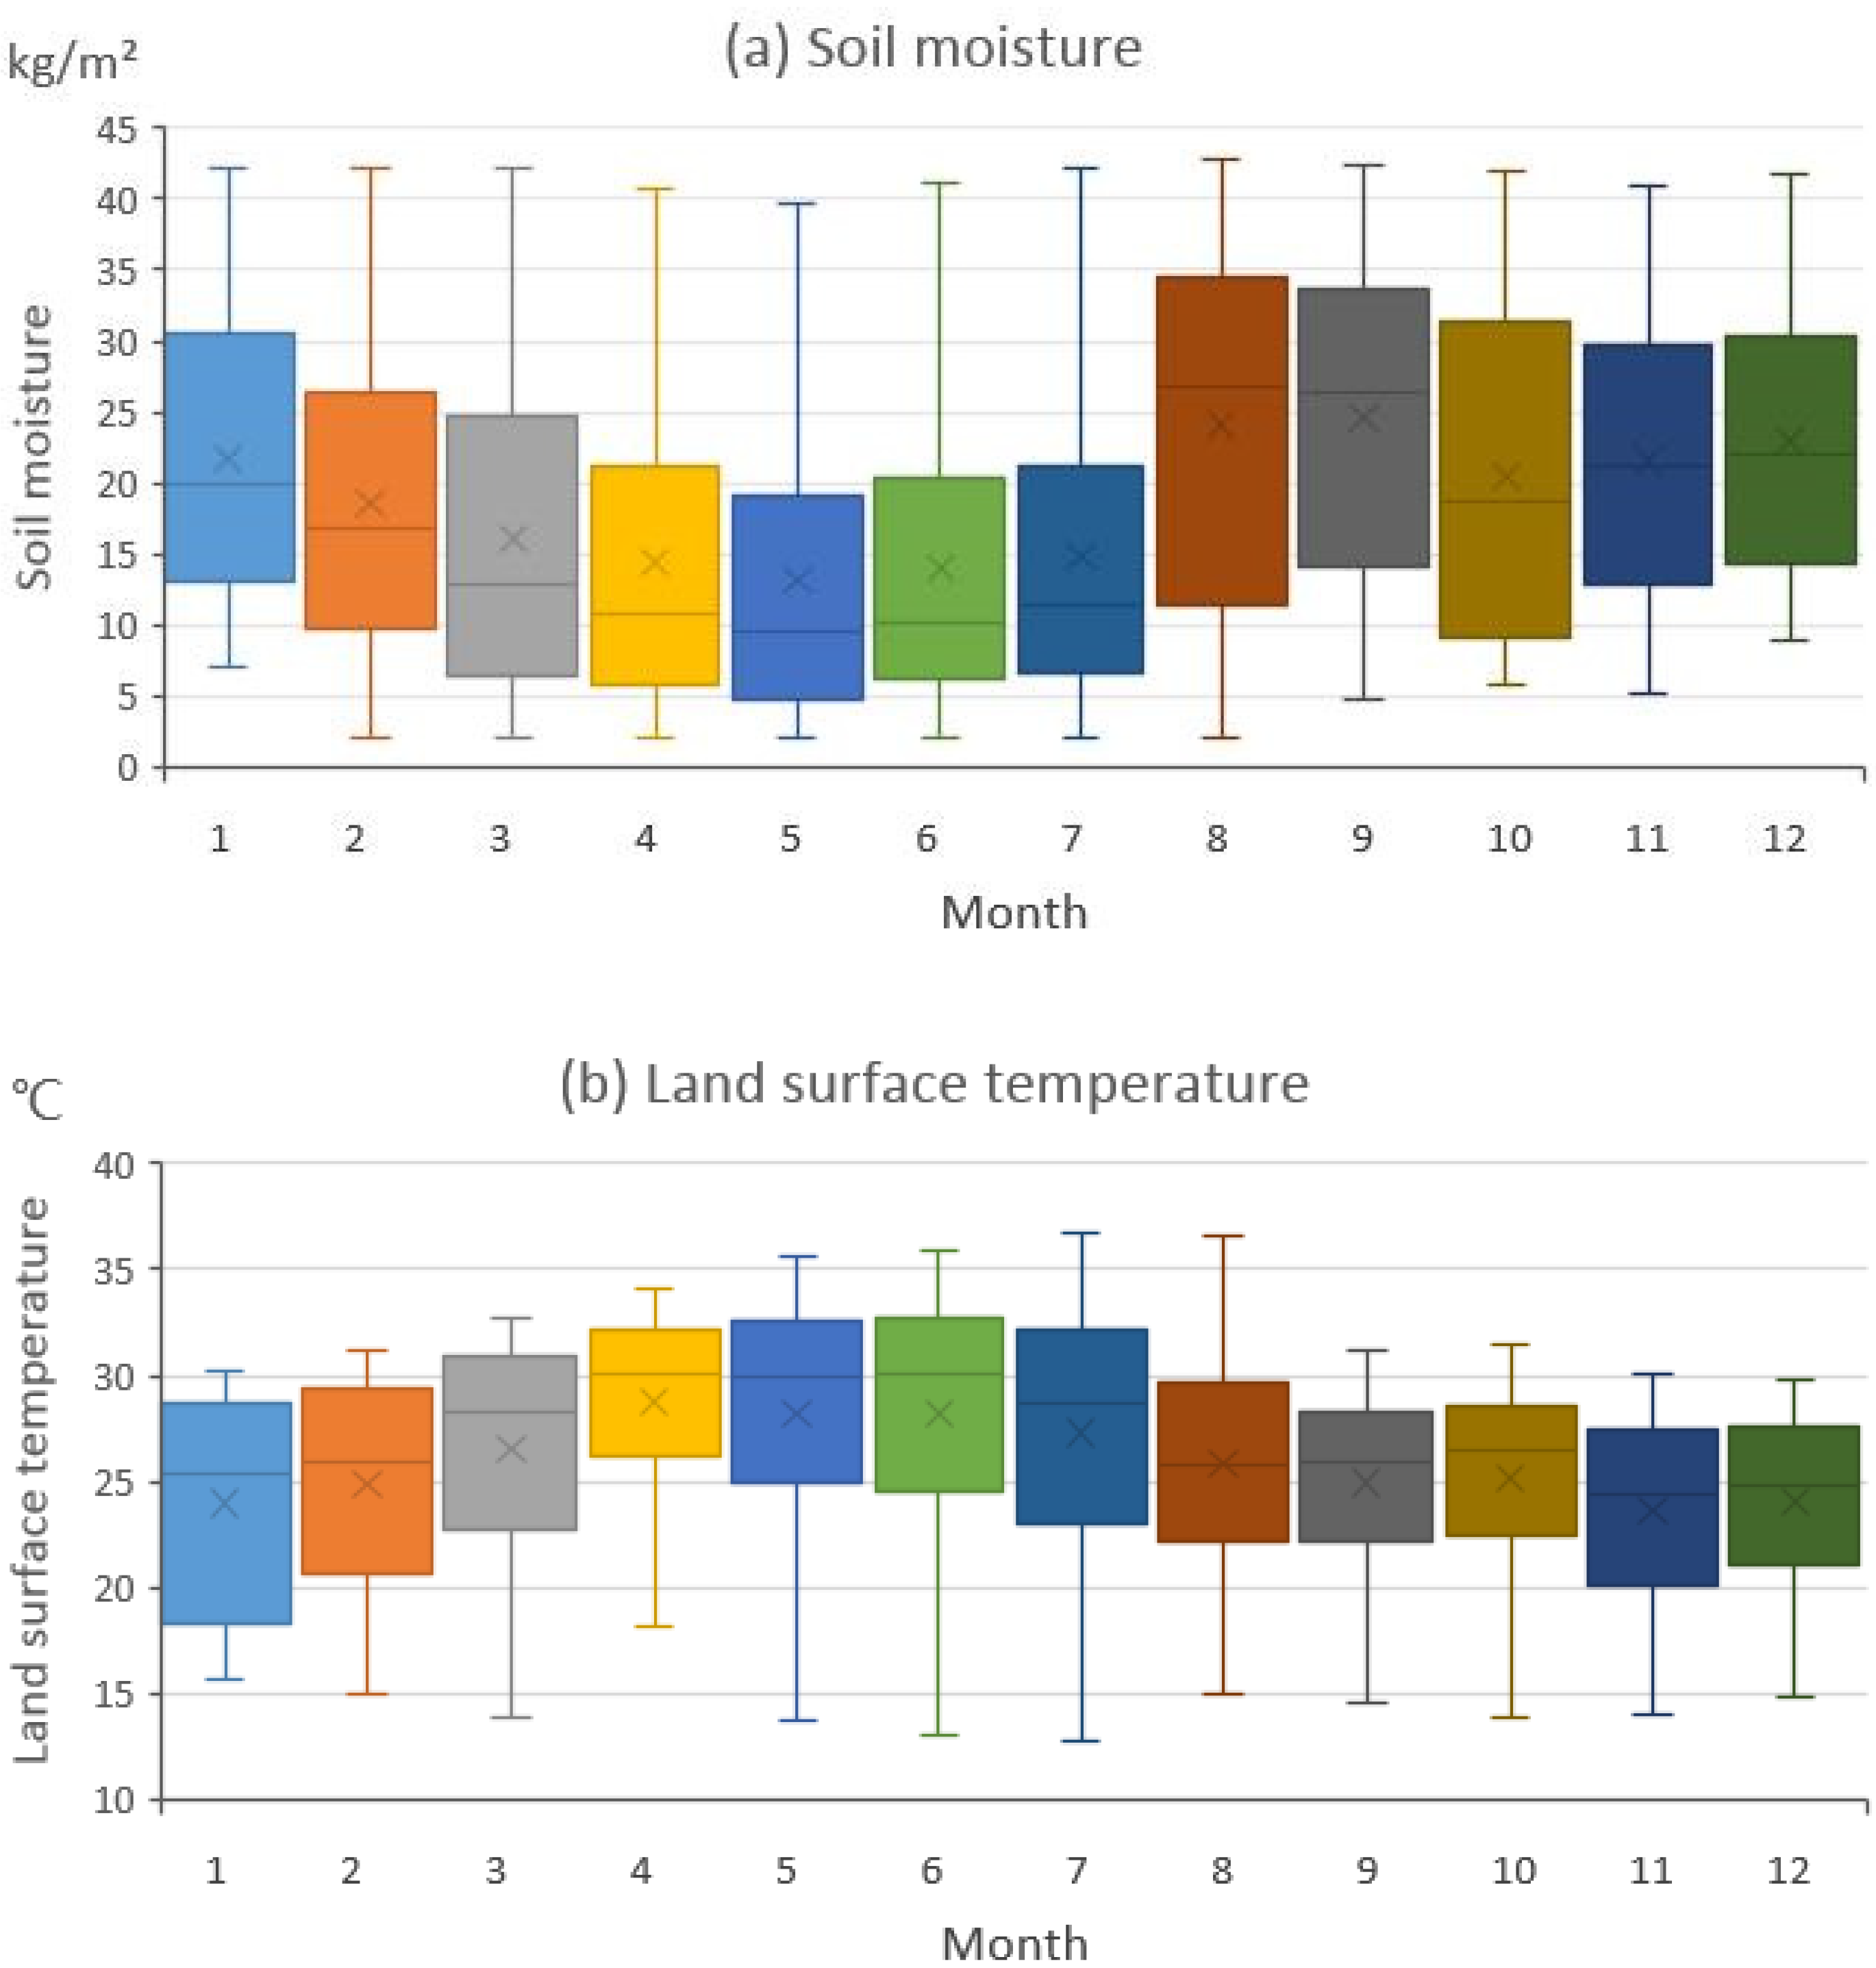
4.1. The Important Influence of Temperature Change on Desert Locusts Distribution

For this model, we demonstrated the partial effect of the two most important variables on the spatial distribution of desert locust, having first ranked the relative importance of each of the significant variables. Studies have shown that temperature is the major factor controlling the migration and distribution of desert locusts (Table 3). Among the six environmental variables, LST contributed the most to the desert locust distribution (27.02%), followed by the monthly average LAI (25.63%), and SM had the lowest impact (2.7%) (Table 3). This result may be explained by the fact that desert locusts occur over much of the area of warmer and more lush vegetation. Similar to the results of Gómez et al. [3], our results show that the average LST and NDVI are the main factors affecting locust development. Waldner [13] showed that the dynamic greenness map in summer had a strong correlation with the desert locust breeding area (F score = 0.64–0.87). This result can be explained in two ways: (1) during the migration stage of locusts, temperature is the main factor that affects whether or not they migrate. At the same time, they need to eat to survive, so locusts usually choose to land in areas with high vegetation coverage; (2) according to the results of previous studies [17], SM is the main factor affecting locust incubation, but our analysis showed that SM had little influence on locust migration and movement.

4.2. Prediction and Analysis of the Migration Path of Desert Locust

Through the analysis of the potential distribution range of desert locusts each month, the overall potential distribution range of the desert locust in Asia, Europe and Africa has been obtained (Figure A1). The result shows that the potential distribution area of the desert locust is widely distributed over tens of millions of square kilometers of the Asian and African continents, including the entire Indian Peninsula, the Arabian Peninsula, and all countries in northern Africa, and extends along the eastern side of Africa to South Africa, in Spain and Europe. It is also distributed in southern Turkey, with the northernmost point reaching southern Kazakhstan. However, there is no suitable area in the western part of Tibet of China. Only the southern part of Tibet, China, is suitable for desert locusts.
In addition, based on the potential distribution areas of desert locusts in each month (Figure 3), we extracted the areas suitable for desert locust survival throughout the year and for two-thirds of the year and classified them as high-risk and moderate-risk areas, respectively (Figure A2). The high-risk areas were located in South Sudan, the northeastern part of the Congo, central Uganda, the northwestern part of Kenya, the northern and central regions of Ethiopia, the western side of the Arabian Peninsula, southern Pakistan and the eastern coastal areas of the Indian Peninsula. The risk areas included countries such as Mauritania, Mali, Niger, Nigeria, Chad and Sudan between 10°N latitude and 17°N latitude in Africa and were also distributed near the Persian Gulf in eastern Saudi Arabia, Oman, Yemen, and Asia. Another risk area was located in northern India and central Pakistan. Since the range of at-risk areas changes mainly from March to October, the risk areas are likely the main activity areas for desert locusts in summer; the high-risk areas are the areas where desert locusts are common in winter; and the locusts will be in at-risk areas in winter and summer during their migration and proliferation.

4.3. Uncertainties and Limitations

Several studies predict that global warming will alter areas of suitable bioclimatic conditions and shift climate suitability toward the high-latitude areas for a range of invertebrate species [38,39]. In recent decades, the temperature in Central Asia has increased significantly (0.4 °C/decade); at the same time, the region has experienced several early springs [40]. Taking into account the uncertainty of future environmental data, confidence in the prediction results of Central Asia and Southern Africa is low, and the potential distribution area of the desert locust may be slightly changed. This model did not account for desert locust life history traits and population biology or their interaction in a changing climate. However, by comparing the predicted results of the model with the actual distribution of the reports of desert locusts, if the environmental factors do not change drastically in the coming months, the model can accurately predict the potential distribution areas of desert locusts.
Although two vegetation factors are used to analyse the land surface, we did not demonstrate the influence of land use on the desert locust. The principal anthropic interactions with locusts are agricultural land use and locust control operations [18]. While some regions in central Africa are forested areas which are not suitable for desert locust, however, it is possible that forest areas turn to grasslands or cultivated field in the future due to climate change and land degradation to some extent. Many other factors also affect locust distribution, such as wind speed and direction, grass productivity and soil physical properties. Improvements in the prediction of the spatial distribution of desert locust outbreaks are, theoretically, possible by integrating these relational variables. However, it is still an open question due to the range of complex and non-linear interactions between these variables.

5. Conclusions

The primary goal of this research was to analyse the potential distribution range of desert locusts in different months. In addition, high-risk areas were identified in the study area, and the possible migration patterns of desert locusts were analysed. To achieve the primary goal, a logistic regression method combined with remote-sensing images from multiple sources was used to establish a prediction model for the potential distribution range of desert locusts. The accuracy of the model, as evaluated by the receiver operating curve (AUC = 0.84) and kappa coefficient (kappa = 0.75), was good. The results of the study show that the areas at risk from desert locusts are located in countries such as Mauritania, Mali, Niger, Nigeria, Chad, and Sudan between 10°N and 17°N latitude in Africa, in the northeastern part of the Congo, central Uganda, northwestern Kenya, and northern Ethiopia; in Central Asia, the risk areas include the eastern and western sides of the Arabian Peninsula, Yemen, Oman, central Pakistan, and the northern and eastern coastal areas of India. The temperature (LST) and leaf area index (LAI) have important impacts on changes in the potential distribution area of desert locusts. Due to the north–south movement of the sun’s position, the potential distribution range of the desert locust shows a periodic movement pattern. However, because the potential distribution area reaches high-latitude areas for only a short time, the desert locusts do not show obvious north–south migration; instead, they migrate east–west in Africa from 10° to 17° north. These results provide the possible distribution range and development path of the desert locust, and from an operational point of view, which may be useful for desert locust surveillance and control operations.

Author Contributions

Conceptualization, X.C.; Methodology, J.Q. and C.C.; Software, C.C. and J.S.; writing—original draft preparation, J.Q. and C.C.; writing—review and editing, Z.H.; visualization, S.W. and K.X. All authors have read and agreed to the published version of the manuscript.

Funding

This research was funded by Strategic Priority Research Program of Chinese Academy of Sciences, Pan-Third Pole Environment Study for a Green Silk Road (Pan-TPE XDA20060303), Shenzhen International S&T Cooperation Project (GJHZ20190821155805960) and CAS Research Center for Ecology and Environment of Central Asia (Grant No. Y934031).

Acknowledgments

We thank the academic editor and reviewers for their constructive comments which greatly helped us to improve the quality of this manuscript.

Conflicts of Interest

The authors declare no conflict of interest. The founding sponsors had no role in the design of the study; in the collection, analyses, or interpretation of data; in the writing of the manuscript; or in the decision to publish the results.

Appendix A

Figure A1. The potential distribution range of desert locusts.
Remotesensing 12 03593 g0a1
Figure A2. Distribution map of desert locust high-risk areas.
Remotesensing 12 03593 g0a2

References

  1. Latchininsky, A.V. Locusts and remote sensing: A review. J. Appl. Remote Sens. 2013, 7, 075099. [Google Scholar] [CrossRef] [Green Version]
  2. Skaf, R.; Popov, G.B.; Roffey, J. The Desert Locust: An international challenge. Philos. Trans. R. Soc. B Biol. Sci. 1990, 328, 525–538. [Google Scholar] [CrossRef]
  3. Gómez, D.; Salvador, P.; Sanz, J.; Casanova, C.; Taratiel, D.; Casanova, J. Desert locust detection using Earth observation satellite data in Mauritania. J. Arid Environ. 2019, 164, 29–37. [Google Scholar] [CrossRef]
  4. Hielkema, J.U.; Roffey, J.; Tucker, C.J. Assessment of ecological conditions associated with the 1980/81 desert locust plague upsurge in West Africa using environmental satellite data. Int. J. Remote Sens. 1986, 7, 1609–1622. [Google Scholar] [CrossRef]
  5. Ceccato, P.; Cressman, K.; Giannini, A.; Trzaska, S. The desert locust upsurge in West Africa (2003–2005): Information on the desert locust early warning system and the prospects for seasonal climate forecasting. Int. J. Pest Manag. 2007, 53, 7–13. [Google Scholar] [CrossRef]
  6. Buhl, J.; Sumpter, D.J.T.; Couzin, I.D.; Hale, J.J.; Despland, E.; Miller, E.R.; Simpson, S.J. From Disorder to Order in Marching Locusts. Science 2006, 312, 1402–1406. [Google Scholar] [CrossRef] [Green Version]
  7. Al-Ajlan, A.M. Relationship between desert locust, Schistocerca gregaria (Forskål), infestation, environmental factors and control measures in Gazan and Makkah Regions, Saudi Arabia. Pak. J. Biol. Sci. 2007, 10, 3507. [Google Scholar]
  8. Cressman, K. Role of remote sensing in desert locust early warning. J. Appl. Remote Sens. 2013, 7, 075098. [Google Scholar] [CrossRef]
  9. Navratil, P.; Wilps, H. Object-based locust habitat mapping using high-resolution multispectral satellite data in the southern Aral Sea basin. J. Appl. Remote Sens. 2013, 7, 075097. [Google Scholar] [CrossRef]
  10. Nishide, Y.; Tanaka, S.; Saeki, S. Adaptive difference in daily timing of hatch in two locust species, Schistocerca gregaria and Locusta migratoria: The effects of thermocycles and phase polyphenism. J. Insect Physiol. 2015, 72, 79–87. [Google Scholar] [CrossRef]
  11. Tucker, C.J.; Hielkema, J.U.; Roffey, J. The potential of satellite remote sensing of ecological conditions for survey and forecasting desert-locust activity. Int. J. Remote Sens. 1985, 6, 127–138. [Google Scholar] [CrossRef]
  12. Powell, L.; Berg, A.A.; Johnson, D.; Warland, J. Relationships of pest grasshopper populations in Alberta, Canada to soil moisture and climate variables. Agric. For. Meteorol. 2007, 144, 73–84. [Google Scholar] [CrossRef] [Green Version]
  13. Waldner, F.; Ebbe, M.A.O.B.; Cressman, K.; Defourny, P. Operational Monitoring of the Desert Locust Habitat with Earth Observation: An Assessment. ISPRS Int. J. Geo-Infor. 2015, 4, 2379–2400. [Google Scholar] [CrossRef] [Green Version]
  14. Lazar, M.; Piou, C.; Doumandji-Mitiche, B.; Lecoq, M. Importance of solitarious desert locust population dynamics: Lessons from historical survey data in Algeria. Ѐntomol. Exp. Appl. 2016, 161, 168–180. [Google Scholar] [CrossRef] [Green Version]
  15. Bryceson, K.P.; Wright, D. An analysis of the 1984 locust plague in Australia using multitemporal landsat multispectral data and a simulation model of locust development. Agric. Ecosyst. Environ. 1986, 16, 87–102. [Google Scholar] [CrossRef]
  16. Deveson, E.D. Satellite normalized difference vegetation index data used in managing Australian plague locusts. J. Appl. Remote Sens. 2013, 7, 075096. [Google Scholar] [CrossRef] [Green Version]
  17. Gómez, D.; Salvador, P.; Sanz, J.; Casanova, C.; Taratiel, D.; Casanova, J.L. Machine learning approach to locate desert locust breeding areas based on ESA CCI soil moisture. J. Appl. Remote Sens. 2018, 12, 036011. [Google Scholar] [CrossRef] [Green Version]
  18. Wang, B.; Deveson, E.D.; Waters, C.; Spessa, A.; Lawton, D.; Feng, P.; Liu, D.L. Future climate change likely to reduce the Australian plague locust (Chortoicetes terminifera) seasonal outbreaks. Sci. Total Environ. 2019, 668, 947–957. [Google Scholar] [CrossRef]
  19. Hunter, D.; Walker, P.W.; Elder, R.J. Adaptations of locusts and grasshoppers to the low and variable rainfall of Australia. J. Orthoptera Res. 2001, 10, 347–351. [Google Scholar] [CrossRef] [Green Version]
  20. Beck, H.E.; Zimmermann, N.E.; McVicar, T.R.; Vergopolan, N.; Berg, A.; Wood, E.F. Present and future Köppen-Geiger climate classification maps at 1-km resolution. Sci. Data 2018, 5, 180214. [Google Scholar] [CrossRef] [Green Version]
  21. Wan, Z.; Li, Z. A physics-based algorithm for retrieving land-surface emissivity and temperature from EOS/MODIS data. IEEE Trans. Geosci. Remote Sens. 1997, 35, 980–996. [Google Scholar] [CrossRef]
  22. Wan, Z.; Zhang, Y.; Zhang, Q.; Li, Z.-L. Validation of the land-surface temperature products retrieved from Terra Moderate Resolution Imaging Spectroradiometer data. Remote Sens. Environ. 2002, 83, 163–180. [Google Scholar] [CrossRef]
  23. Rodell, M.; Houser, P.R.; Jambor, U.; Gottschalck, J.; Mitchell, K.; Meng, C.-J.; Arsenault, K.; Cosgrove, B.; Radakovich, J.; Bosilovich, M.; et al. The Global Land Data Assimilation System. Bull. Am. Meteorol. Soc. 2004, 85, 381–394. [Google Scholar] [CrossRef] [Green Version]
  24. Chen, Y.; Yang, K.; Qin, J.; Zhao, L.; Tang, W.; Han, M. Evaluation of AMSR-E retrievals and GLDAS simulations against observations of a soil moisture network on the central Tibetan Plateau. J. Geophys. Res. Atmos. 2013, 118, 4466–4475. [Google Scholar] [CrossRef]
  25. Hijmans, R.J.; Cameron, S.E.; Parra, J.L.; Jones, P.G.; Jarvis, A. Very high resolution interpolated climate surfaces for global land areas. Int. J. Clim. 2005, 25, 1965–1978. [Google Scholar] [CrossRef]
  26. Zeng, Y.; Low, B.W.; Yeo, D.C. Novel methods to select environmental variables in MaxEnt: A case study using invasive crayfish. Ecol. Model. 2016, 341, 5–13. [Google Scholar] [CrossRef]
  27. Sun, P.; Zhang, Q.; Wen, Q.; Singh, V.P.; Shi, P. Multisource Data-Based Integrated Agricultural Drought Monitoring in the Huai River Basin, China. J. Geophys. Res. Atmos. 2017, 122, 10751–10772. [Google Scholar] [CrossRef]
  28. Hanley, J.A.; McNeil, B.J. The meaning and use of the area under a receiver operating characteristic (ROC) curve. Radiology 1982, 143, 29–36. [Google Scholar] [CrossRef] [Green Version]
  29. Monserud, R.A.; Leemans, R. Comparing global vegetation maps with the Kappa statistic. Ecol. Model. 1992, 62, 275–293. [Google Scholar] [CrossRef]
  30. Elith, J.; Graham, C.H.; Anderson, R.P.; Dudík, M.; Ferrier, S.; Guisan, A.; Hijmans, R.J.; Huettmann, F.; Leathwick, J.R.; Lehmann, A.; et al. Novel methods improve prediction of species’ distributions from occurrence data. Ecography 2006, 29, 129–151. [Google Scholar] [CrossRef] [Green Version]
  31. Phillips, S.J. Transferability, sample selection bias and background data in presence-only modelling: A response to Peterson et al. (2007). Ecography 2008, 31, 272–278. [Google Scholar] [CrossRef]
  32. Johnson, J.W.; Lebreton, J.M. History and Use of Relative Importance Indices in Organizational Research. Organ. Res. Methods 2004, 7, 238–257. [Google Scholar] [CrossRef]
  33. Jiménez-Valverde, A.; Lobo, J.M. Threshold criteria for conversion of probability of species presence to either–or presence–absence. Acta Oecologica 2007, 31, 361–369. [Google Scholar] [CrossRef]
  34. Manel, S.; Williams, H.C.; Ormerod, S.J. Evaluating presence-absence models in ecology: The need to account for prevalence. J. Appl. Ecol. 2001, 38, 921–931. [Google Scholar] [CrossRef]
  35. Zhang, K.; Yao, L.; Meng, J.; Tao, J. Maxent modeling for predicting the potential geographical distribution of two peony species under climate change. Sci. Total Environ. 2018, 634, 1326–1334. [Google Scholar] [CrossRef] [PubMed]
  36. Li, J.; Chang, H.; Liu, T.; Zhang, C. The potential geographical distribution of Haloxylon across Central Asia under climate change in the 21st century. Agric. For. Meteorol. 2019, 275, 243–254. [Google Scholar] [CrossRef]
  37. Chitale, V.S.; Behera, M.D.; Roy, P.S. Future of Endemic Flora of Biodiversity Hotspots in India. PLoS ONE 2014, 9, e115264. [Google Scholar] [CrossRef]
  38. MacFadyen, S.; McDonald, G.; Hill, M.P. From species distributions to climate change adaptation: Knowledge gaps in managing invertebrate pests in broad-acre grain crops. Agric. Ecosyst. Environ. 2018, 253, 208–219. [Google Scholar] [CrossRef] [Green Version]
  39. Ramirez-Cabral, N.Y.Z.; Kumar, L.; Shabani, F. Suitable areas of Phakopsora pachyrhizi, Spodoptera exigua, and their host plant Phaseolus vulgaris are projected to reduce and shift due to climate change. Theor. Appl. Clim. 2018, 135, 409–424. [Google Scholar] [CrossRef]
  40. Hu, Z.; Zhang, C.; Hu, Q.; Tian, H. Temperature Changes in Central Asia from 1979 to 2011 Based on Multiple Datasets. J. Clim. 2014, 27, 1143–1167. [Google Scholar] [CrossRef]
Figure 1. Map showing the location of the study area (Based on map sources: GS(2016)2948).
Remotesensing 12 03593 g001
Figure 2. Process diagram for establishing a model of the potential distribution of desert locusts with logistic regression.
Remotesensing 12 03593 g002
Figure 3. Binary distribution map of the potential distribution range of desert locust in different months.
Remotesensing 12 03593 g003
Figure 4. Changes in the potential habitat of desert locusts from January to December.
Remotesensing 12 03593 g004
Figure 5. The monthly soil moisture and temperature data from the areas in which the potential desert locust distribution area increased. The solid black lines represent the median values; the four horizontal lines (from top to bottom) are the upper bound, the upper quartile, the lower quartile and the lower bound, respectively; and the black dots represent the average values.
Remotesensing 12 03593 g005
Table 1. Environmental variables used in this study and their data sources.
VariablesData Source/ProducerUnitPeriod
NDVIhttps://modis.gsfc.nasa.gov/——2005–2020
LAIhttps://modis.gsfc.nasa.gov/——2005–2020
SMhttp://disc.gsfc.nasa.gov/kg/m22005–2020
RFhttp://disc.gsfc.nasa.gov/mm2005–2020
LSThttp://www.worldclim.org/°C2005–2020
Elevationhttp://www.worldclim.org/m2005–2020
Table 2. Changes in the potential habitat area of desert locusts over 12 months.
MonthDesert Locust Area (×107 km2)
IncreasedDecreasedUnchanged
January0.180.160.52
February0.450.120.59
March0.540.330.70
April0.910.280.96
May0.640.131.74
June0.530.262.12
July0.300.182.48
August0.070.242.53
September0.230.492.11
October0.371.191.15
November0.260.990.67
December0.210.390.47
Table 3. Environmental variables used in this study and their percentage contributions and variance expansion factors.
CodeEnvironmental VariablesFactor Contribution (%)VIF
NDVIAverage Monthly Normalized Difference Vegetation Index12.592.29
LAIAverage Monthly Leaf Area Index25.633.92
LSTAverage Monthly Land Surface Temperature27.022.75
RFAverage Monthly Precipitation22.251.21
SMAverage Monthly Soil Moisture2.73.72
ElevationElevation9.812.58
Publisher’s Note: MDPI stays neutral with regard to jurisdictional claims in published maps and institutional affiliations.

