
Remotely Sensed Tree Characterization in Urban Areas: A Review
by
 ,
,
Luisa Velasquez-Camacho
1,2,* ,
,
Adrián Cardil
2,3,4,
Midhun Mohan
5,
Maddi Etxegarai
1,
Gabriel Anzaldi
1 and
Sergio de-Miguel
2,3 1
Unit of Applied Artificial Intelligence, Eurecat, Centre Tecnològic de Catalunya, 08005 Barcelona, Spain
2
Department of Crop and Forest Sciences, University of Lleida, 25198 Lleida, Spain
3
Joint Research Unit CTFC—Agrotecnio—CERCA, 25280 Solsona, Spain
4
Technosylva Inc., La Jolla, CA 92037, USA
5
Department of Geography, University of California-Berkeley, Berkeley, CA 94709, USA
*
Author to whom correspondence should be addressed.
Remote Sens. 2021, 13(23), 4889; https://doi.org/10.3390/rs13234889
Submission received: 22 October 2021
/
Revised: 26 November 2021
/
Accepted: 29 November 2021
/
Published: 2 December 2021
(This article belongs to the Special Issue Applications of Individual Tree Detection (ITD))
Abstract
:Urban trees and forests provide multiple ecosystem services (ES), including temperature regulation, carbon sequestration, and biodiversity. Interest in ES has increased amongst policymakers, scientists, and citizens given the extent and growth of urbanized areas globally. However, the methods and techniques used to properly assess biodiversity and ES provided by vegetation in urban environments, at large scales, are insufficient. Individual tree identification and characterization are some of the most critical issues used to evaluate urban biodiversity and ES, given the complex spatial distribution of vegetation in urban areas and the scarcity or complete lack of systematized urban tree inventories at large scales, e.g., at the regional or national levels. This often limits our knowledge on their contributions toward shaping biodiversity and ES in urban areas worldwide. This paper provides an analysis of the state-of-the-art studies and was carried out based on a systematic review of 48 scientific papers published during the last five years (2016–2020), related to urban tree and greenery characterization, remote sensing techniques for tree identification, processing methods, and data analysis to classify and segment trees. In particular, we focused on urban tree and forest characterization using remotely sensed data and identified frontiers in scientific knowledge that may be expanded with new developments in the near future. We found advantages and limitations associated with both data sources and processing methods, from which we drew recommendations for further development of tree inventory and characterization in urban forestry science. Finally, a critical discussion on the current state of the methods, as well as on the challenges and directions for future research, is presented.
1. Introduction
Trees are some of the most important elements in urban areas due to the ecosystem services (ES) they provide, and they often play a critical role in urban environmental management [1,2]. Currently, urban forests, such as greenery inside urban areas [3,4,5,6,7] (i.e., individual street trees, parks, connector areas, and wetlands), are the main sources of ES for more than 50% of people in the world who live in cities [8,9,10,11]. Given the expected percentage rise—up to 68% of people living in urban areas in the next 30 years—it is critical that existing urban forest areas expand and are nurtured [12,13,14]. The ES provided by trees in urban ecosystems have a direct positive impact on human health and security through air quality improvement [2,15,16], noise reduction, microclimate regulation (due to high island mitigation) [16,17,18,19,20], pedestrian comfort increase, higher motivation for physical activity, better emotional and mental health [6,15], and runoff mitigation [21,22,23]. Urban forest and individual street trees have also contributed actively to the conservation of biodiversity, through habitat and niche enhancement for many animal species [24,25], some of them threatened and/or highly important for global biodiversity [24]. Furthermore, in the current climate change scenario, where more than 70% of the global greenhouse gas emissions are attributed to city activities [26], urban forests have been in the spotlight. Their ability to sequester carbon dioxide, mitigating the negative effects of anthropogenic activity, is crucial for supporting initiatives, addressing climate change [17,25,27,28,29].
The identification, delineation, characterization, and mapping of urban trees are essential for a proper assessment of biodiversity and ES in urban environments [10], as these are strongly influenced by tree and forest attributes, such as vegetation structure, above-ground biomass, and species composition [10,30,31,32]. However, most of the urban areas suffer from a lack of systematized and/or updated information on trees and their contribution to biodiversity and ES. The traditional way to collect tree information through ground-based forest inventories is expensive and requires a large amount of human resources, limiting their application to small areas [4]. Moreover, the characterization and identification of trees with field examinations become highly demanding for sparsely distributed trees over large urban areas [15,16,33]. These limitations combined with the need for quantifying biodiversity and ES at multiple spatial [15,16,34] and temporal scales in urban environments [35], have led to the development and implementation of several remote sensing-oriented approaches.
The scientific community has progressed in its use of multiple remotely sensed information sources, including satellite imagery [35,36,37], light detection and ranging or laser scanning detection and ranging (LiDAR) [8,21,36,38,39,40,41], aerial imagery [7,11,42,43], and digital ground-level images (GLI) [44,45,46]. Although satellites, such as Landsat and Sentinel, do not have the spatial resolution necessary for tree characterization (below four or three meters, according to some authors [10,47,48]), in recent decades, satellite sensors with advanced capabilities have been developed. For instance, digital aerial orthophotos from the National Agricultural Imagery Program (NAIP, USA) provide a resolution lower than five meters in the USA [49], allowing accurate assessments of forest and trees at a local scale, open and free of charge. Moreover, some private companies, such as DigitalGlobe [50] and Planet Labs [51], are today capable of acquiring images with a resolution of less than one meter [37]. Regarding laser technology, LiDAR has shown great capabilities in urban forestry applications, from crown extraction to the analysis of forest composition and structure [8,10], representing an important complementary data source [36]. Recently, the development of unmanned aerial vehicles (UAV) has contributed to expanding the use of LiDAR technology and aerial imagery. UAV-LiDAR provides a better 3D structural representation of forests than aerial LiDAR [40], at a moderate cost. On the other hand, digital GLI, such as Google Street View (GSV) [52] and Tencent [53], capture optical information that other aerial and satellite sensors do not achieve, as they provide a vertical and contextual view of urban vegetation to extract and characterize urban vegetation [1,54].
Apart from the data sources, the detection and classification of urban trees also depends on algorithms that allow for the extraction of specific tree attributes, such as species, height, diameter, and geographic position. Spatiotemporal high-resolution sources bring with them significant challenges regarding their processing and analysis. However, remote sensing data processing and modeling require a high level of expertise in the design of classifiers that can detect and label patterns in images [55]. For many years, traditional parametric methods were widely used for classification of remote sensing data, nonetheless the have fallen behind in solving more complex problems such as the classification of individual objects. In turn, more sophisticated algorithms, such as clustering and segmentation methods [48,56], integrated into geographical information systems (GIS), have facilitated the analysis of large-scale remotely sensed data. Computational developments during the last decades brought novel artificial intelligence (AI) techniques, which tap into the ability of computers to mimic human reasoning [57], solving complex problems such as object classification and damage assessment [58,59,60,61,62]. These advances are especially recent in the field of machine learning (ML) [63], where algorithms, such as random forest (RF) and support vector machine (SVM), and more recently, neural network-based deep learning (DL), algorithms have been developed [48,59], improving classification problems, such as individual tree characterization.
The aforementioned complexities of the data sources and algorithms used for the characterization of urban trees has not been systematized in a document in recent years; however, such a document will allow for a summary of the computational and scientific achievements. The closest approximation during the past 5 years (starting 2016) was published by Lin et al. [5]. This review was focused on the models used for the characterization of trees in general, leaving aside the details of the data sources and urban trees characterization specifically, topics that are explored in the present work. Due to the rapid growth of computational advances and remote sensing technologies, we present trends in recent (i.e., last five years, 2016–2020) scientific research through an analysis of 48 selected studies on the characterization of urban trees and forests based on remote sensing (RS) and processing methods. Specifically, we identified and analyzed publications related to the algorithms, methods, and data sources for urban tree and greenery detection and characterization, and summarized the main scientific advances presented in the literature. This comprehensive review is expected to help researchers familiarize themselves with the state-of-the-art techniques and thereby enable cost-effective evolution of urban forestry sciences. Finally, we discuss the main outcomes of this scientific review, provide a critical summary, and point out steps for future research.
2. Materials and Methods
To analyze the data sources and data processing methods used in previous research to characterize urban trees, we conducted a scientific literature review based on the methodology proposed by Pullin and Stewart [64], including data and articles searches, selection, synthesis, and reporting. The analysis covers the most relevant works on the topic published during the last five years from January 2016 to December 2020.
To conduct the information search stage, we mainly used two databases, Scopus and Web of Science (WOS), and found other papers through several citation networks, such as Google Scholar. In the bibliographic database searches, we selected different sets of search terms to identify publications studying urban tree characterization (see Table 1). We found a total of 103 articles published on open access during this period, which were further filtered and selected based on their content and relevance.
Once the list of papers was consolidated, we removed 38 duplicate articles. Later, we eliminated those papers not focused on urban areas and/or urban tree or urban greenery studies (28 papers) as well. Finally, a set of 37studies for analysis were selected after data cleaning. However, we noted that some relevant papers referenced in the selected papers were not detected in the aforementioned keyword-based searches. Thus, we completed our database through a “citation network search” including 11 additional papers cited in selected papers. Therefore, we finally analyzed 48 relevant papers in this review.
In the synthesis and reporting stage, we highlighted the most important findings in terms of urban tree and greenery characterization through remote sensing, focused on data sources, processing methods, and data analysis. The following sections provide a detailed presentation of the results obtained from the qualitative analysis of the selected studies. Three different sections summarize the main findings of this review: (i) overview, scale, and geographic distribution of previous research; (ii) data sources used for the characterization of urban trees; and (iii) data processing and analytical methods.
3. Results
3.1. Overview, Study Scale, and Geographic Distribution of Previous Research
From the 48 papers considered in this review (Figure 1), 54% were published during 2018 and 2019. Regarding the scale, 72% of them were developed at a local scale, such as specific neighborhoods (<3 km buffer) [65] or streets [66], while the remaining 28% were focused on a city scale. There happens to be a knowledge gap in studies covering broader scales such as country, continent, or global scale. This lack of knowledge has also been detected by other authors, who attribute it to the difficulty of scaling up the models, especially in cities where landscape heterogeneity makes such extrapolation difficult [67].
We also observed (Figure 2) that most of the studies were developed in the Northern Hemisphere, especially in the USA (29%) and China (14%). Only two studies were conducted in the Southern Hemisphere, specifically in Australia. We also noticed that urban greenery and tree characterization studies within Europe were predominantly undertaken in France (8%), United Kingdom, and Germany (6% each).
3.2. Data Sources
A wide variety of remote sensing data sources have been used in the studies analyzed, for tree characterization (detection, specie identification, structural analysis) and mapping. Note that, in most of these studies, more than two sources of information were employed. The most prominent information sources were LiDAR data (40%), aerial images (37%), ground-level images (37%), satellite images (31%), and video (2%) (Figure 3). We further found that vector data, such as cadastral and vegetation maps, were frequently included, as well as information collected in the field. These secondary sources of information were mostly used for the training and validation of the models.
3.2.1. LiDAR
In urban areas, LiDAR provides data for tree structure characterization with the potential to improve tree species classification [8,10,68,69] when enough point density is available [10], i.e., more than 10 points per square meter [11]. LiDAR, derived from different platforms, such as airborne laser scanner (ALS), space-borne LiDAR, and terrestrial laser scanning (TLS), is an active sensor, capable of extracting the vertical urban structure, including tree canopy shape, height, and diameter with high accuracies [10,21,70].
Nevertheless, similar to satellite imagery, the main current open LiDAR data sources do not usually have the necessary features for individual tree characterization or are limited geographically [10]. On the other hand, the limitations to access high-quality LiDAR data are becoming less frequent since platforms such as Unmanned Aerial Vehicles (UAVs) have significantly reduced operational costs [71]. The use of UAVs is considered by many authors as an efficient way to access tree canopy information and individual tree detection at a smaller scale [10,41].
In regard to the types of LiDAR, we found that ALS was widely used in previous research (36%), although in two studies the characteristics of the data used (spatial resolution, pulse density, etc.) were not specified [42,72] (Table 2).
Most studies used LiDAR technologies for tree positioning, height estimation [8,37,75,76], and crown area measurement [37,41]. Alonzo et al. [21], used 28 structural metrics (such as the median height of LiDAR returns in the canopy, average LiDAR return intensity below median height) derived from LiDAR (Table 2) measurements for mapping urban tree species, and for measuring leaf area index (LAI) and carbon storage in Santa Barbara, California. This study revealed that including LiDAR and hyperspectral data within the model significantly increased Overall Accuracy (OA) to 75% in the individual species recognition, with an accuracy ranging from 37% (Metrosideros excelsa), to 96% (Eucalyptus globulus and Ficus microcarpa). Similarly, Katz et al. [11] found that using LiDAR data alone resulted in an accuracy of 43% when identifying 16 tree species in Detroit; when used in combination with other data sources, such as aerial imagery, the accuracy was found to almost double, achieving 74%.
We also found four studies that characterized urban vegetation from LiDAR data only. For example, Bayat et al. [41] developed a point-based model for tree detection, where the distances between points as well as their density were taken into account for individual tree detection. Wang et al. [73] proposed a DL model allowing for semantic classification of each point based only on 3D coordinates and point cloud return strength to classify urban trees, achieving an OA of 86%. Azeez et al. [8] also based their study on LiDAR data for urban tree detection, reaching an accuracy of 92%. Although Jiang et al. [46], Azeez et al. [8], and Wilkes et al. [2] recommend using 3D reconstruction models (ALS and TLS) for tree identification, Calders et al. [79] state that the use of TLS is not currently operational in cities, and still requires different treatment methodologies for the characterization of isolated trees or trees outside the forest, in addition to being a costly method that can be overcome by other data sources or methods, such as citizen science. Furthermore, Wu et al. [78] claim that TLS in cities is ineffective in the identification of individual trees since the heterogeneity of elements in cities generates noisy data. Wu et al. [78], through an ultra-dense point cloud approach (point-density higher than 1000 points m−2) based on mobile terrestrial LiDAR (MLS), proved that this type of datum source is also a powerful tool for the extraction of tree geometric characteristics. However, they achieved better results in tree detection with ALS (40 points/m2), 83% of detection rate on single tree detection, than with ultra-dense MLS-TLS, 77.27%. Regarding tree species classification, ALS also showed better performance (72.19%) compared with TLS accuracy, i.e., 65.16%. They found that the best tree classifications came from ALS since this type of sensor might be able to obtain information from the whole canopy, which is an important feature for species identification.
Jiang et al. [46] in their article describe a disadvantage associated with ALS-LiDAR data, which is the related costs. Free and open LiDAR data with good specifications, such as enough pulse intensity or point density, suitable for tree species characterization at global scale, are limited. For example, the Global Ecosystem Dynamics Investigation (GEDI) project of the National Aeronautics and Space Administration (NASA), uses three lasers, with a frequency of 242 pulses/second with 25 m footprints [80], this laser footprint is too large to classify tree species individually; however, it cannot be dismissed as an important source of open data for urban ecosystem assessment, as it can provide valuable insights into regional land use patterns and landscape structure [10].
These limitations, with some exceptions, such as the United States, England, and other European countries, where good-quality and open LiDAR data are more easily available [74], have been addressed by the scientific community and forest managers, who have found in UAV flights a solution to the acquisition of quality LiDAR data, even with the limitation of geographic scale, representing an advance in the use of this technology in urban forestry science [81,82]. The versatility and reasonable cost of LiDAR data acquired from UAV has allowed for a more abundant use of this data source in forestry research [61]. Although many of the studies analyzed conclude that LiDAR data work well as auxiliary information, Degerickx et al. [83] and Wang et al. [73] found that LIDAR data could play a central role in the characterization of urban trees, as it provides the most important information for structural, and textural features of trees. In addition, it offers very precise data on the location of the trees in the city [38].
Despite representing a valuable data source, LiDAR data also have certain limitations in the segmentation of individual trees in cities. The main one is related to the heterogeneity of the objects in the city, which makes this task arduous and computational power consuming [69]. Moreover, the overlapping of tree canopies prevents the detection of the smallest trees [84], and finally the complexity in the classification of species due to the great diversity of trees in cities [75].
3.2.2. Satellite Imagery
Satellite images usually provide spectral data, spatially continuous at different temporal resolutions depending on equipment. This makes them a valuable resource for forest monitoring and management [36], especially in large forest stands. Through the information collected by satellite projects for more than 40 years, scientists can obtain information on the change that the forests have undergone over time, allowing its monitoring [72].
We found a variety of satellite data sources used for urban vegetation analysis ranging from moderate resolution images such as Landsat (30 m), Sentinel (10 m), and RapidEye (5 m) to very high spatial resolution imagery (0.5 m–0.3 m). Different satellites also differ in their related wavelength information [81]. Landsat and Sentinel provide open-access data of higher spectral resolution, which makes them a powerful data source for vegetation analysis [29], compared with for instance QuickBird, which, despite its high spatial resolution, only covers the wavelength corresponding to the visible and near-infrared (VNIR) (Table 3) [85].
Some moderate-resolution satellites (10–30 m pixel size [89]), such as RapidEye, Landsat-OLI (Operational Land Imager), and Sentinel (Table 3), were used to evaluate the urban forest diversity based on the texture and vegetation indices in four (8%) of the reviewed studies [44,49,72,74]. For instance, Ozkan et al. [44], found that spectral and textural properties derived from satellite imagery can be related to woody species diversity and ES assessment in the urban forests even using moderate spatial resolution imagery (Landsat (30 m) and RapidEye (5 m)). The authors found that these satellites offer temporal resolution and other characteristics, such as wavelength, were deemed useful for the analysis of urban forest at the landscape scale. However, He et al. [87], argue that spectral indices derived from medium resolution imagery are still limited in extensive use in cities since many elements have similar spectral signatures, which cause strong heterogeneity and make object classification difficult.
For the aforementioned reason, mapping individual trees in urban environments requires high spatial image resolutions that allow the extraction and segmentation of tree crowns through different methods. Note that urban trees have a fragmented and dispersed distribution throughout the city, making it even more difficult to classify them based on their texture. This situation has led to a significant delay in the detection of individual urban trees from satellite imagery [10,37]. Recently, some projects (e.g., DigitalGlobe [50,90], SkySat from Planet Lab [51], and others) have enabled, through very high spatial resolutions (<1 m per pixel), the accurate identification of objects, such as trees, in urban lands.
Among the several types of satellite images presented in the reviewed papers (Table 3), the DigitalGlobe satellites family [50] (WorldView 2, 3) were the most commonly used (13%). This satellite has a spectral and spatial scale appropriate for the characterization of individual urban trees [10,21,37,91].
Data from WorldView 2 (WV2) were used in three studies [10,36,67] as ancillary information based on eight VNIR bands (Table 3). Hartling et al. [37] found an OA of 75.91% in the detection and characterization of the urban trees in the city of St. Louis, USA. Sun et al. [76] reported a slight decrease in accuracy in DL models when using WV2 VNIR bands information as complementary data compared with the performance based on Red, Green, and Blue (RGB) aerial images collected simultaneously with LiDAR data, (Table 2), due to the distortion caused by the size of the study area (very large) on the satellite images, which made the detection characteristics of the DL models less effective. Likewise, Katz et al. [11] reported a low performance in urban tree species characterization (50%) while utilizing the normalized difference vegetation index (NDVI) derived from WV2 bands, compared to vegetation indices from aerial images, where an accuracy of 68% was achieved.
The difference between the accuracies achieved by different studies in the characterization of urban trees may be related to several factors. First, there are differences in the input data. While studies such as Katz et al. [11], which used indices such as NDVI alone to perform the classification, or Sun et al. [76], which used the spectral information of the bands directly within the model, studies such as Hartling et al. [37] used several vegetation indices as input variables within the classification model. Second, there are differences between methods for processing satellite information. Hartling et al. [37] worked with the Gram–Schmidt pan-sharpening method to improve the detection and delineation of tree crowns in the resampling bands, while the other two studies used the traditional up-sampling method. Sun et al. [76] reported that one reason for the poor performance of WV2 within the model is its optimization since it was not originally developed to receive multiple sources of information. In the end, these studies showed that the proper processing of high spatial resolution satellite information such as WV2 together with optimized and robust models, might allow the classification of individual trees from satellite images with moderate accuracy.
WorldView 3 (WV3), which achieves a higher spatial resolution (2 m) in the spectral bands compared to WV2, was used as the unique data source in two studies [86,87]. Namely, Vahidi et al. [86] used WV3 for tree identification in urban orchards obtaining 91% accuracy. This research was able to identify green areas in neighborhoods, and characterize and segment trees on private properties, based on a spatial analysis of pattern identification and contextual information, in addition to the use of segmentation algorithms. However, these characteristics make use of this method limited to the inventory of trees in small and homogeneous areas within the city. Meanwhile, He et al. [87] used WV3 for automatic mapping of wooded areas in the Yuhang District in China. This research was based on the use of vegetation indices from the visible spectrum bands of WV3 and the NIR. The authors were able to achieve an accuracy of 92% in the segmentation of urban trees. The aforementioned study by Hartling et al. [37] also used eight SWIR bands (short-wave infrared) of WV3 as complementary information to WV2 and LiDAR, improving model accuracy by at least 2%. Choudhury et al. [88] used spectral and textural attributes derived from WV3 and photogrammetry techniques to map five dominant urban trees in Sassuolo, Italy, and study their carbon sequestration capacity, achieving an accuracy of 78% on tree identification.
Satellites, such as Pleiades [92] and QuickBird [90], offer a limited number of bands (RGB and NIR). However, two studies—[38,54]—produced urban tree segmentation and identification with an accuracy above 90%. The level of OA achieved was also related to the methodology followed by the authors. For example, Louarn et al. [54] used a bi-temporal analysis for tree classification covering their analysis in two seasons (spring and summer), which allowed them to find phenological patterns between coniferous and deciduous species, thus improving the classification of individual species with satellite images. Meanwhile, Timilsina et al. [38] used the satellite imagery combined with LiDAR data to segment tree canopies.
Passive remote sensing systems, such as high-resolution satellite imagery, today represent rich data sources, allowing the delineation of tree crowns in urban landscapes [5]. However, although the spectral range proves to be an advantage for detecting tree crowns and species (through spectral signatures or textural properties [7]), the limitations of these types of input data in complex urban environments, which need to rely on ancillary data sources, such as LiDAR information, are evident [5,93]. Moreover, it is noteworthy that open satellite imagery has enabled the creation of ready-to-use urban forest and landscape characterization products and models, for example, NDVI images produced from Landsat imagery, which remains an important input for landscape-level analysis, with higher temporal resolution available for understanding urban forest dynamics [68,81].
3.2.3. Aerial Imagery
Aerial imagery is one of the most used data sources in recent research on urban tree characterization (36% of previous studies; Figure 3). In all of the studies analyzed, aerial images had sufficient resolution for urban tree identification, i.e., less than 3 m (Table 4). Aerial images can primarily come from two different platforms: aircraft and drones or UAVs. Aircrafts can cover larger areas than UAVs, however, they are costly, especially when monitoring based on periodic time-series is desired [94], and, similar to satellite data, are more exposed to cloud interferences [95]. To overcome some of these drawbacks, drone flights have gained popularity in vegetation and land cover analysis as they are less expensive, easy to obtain and transport, and can be used in shorter time overpasses compared to aircraft [11,95].
Indeed, some UAVs can reach sizes of less than 70 cm and one kilogram [95,99]. These devices can collect RGB imagery, stereo imagery that allows for generating photogrammetric point clouds (PPCs), and LiDAR data simultaneously, covering up to 12 km2 in 50 min [99]. Although, these data are geographically limited, they are of high quality, leading to their widespread use in the characterization of individual urban trees [94,95].
In half of the analyzed studies using aerial imagery, the authors not only addressed the characterization and segmentation of urban trees, but also achieved species identification. Regarding the studies where the main objective was tree segmentation, all of them used the visible and NIR regions of the spectrum and calculated the NDVI. When analyzing the differences in accuracy between the studies, we observed that OA was more dependent on the segmentation techniques rather than on the data sources. For instance, Sun et al. [76] and Haas et al. [96] achieved an accuracy of 89% and 97%, respectively, both using DL in their analysis, whereas Grafius et al. [42], and Sun et al. [76], achieved an accuracy in tree segmentation of 66% and 68%, respectively, based on digital image processing (DIP) algorithms.
Regarding tree species identification, Alonzo et al. [21], relied on an airborne visible/infrared imaging spectrometer for the identification of species using NIR wavelengths to evaluate foliage abundance and structure, and utilized SWIR to assess cellulose, water, and lignin contents, creating a spectral signature for each tree species analyzed. In the same vein, Marrs and Ni-Meister [43] used 44 vegetation indices calculated from 144 bands ranging from the visible (400–650 nm) to the SWIR (1300–2500 nm) spectrum for characterization of 24 tree species. Achieving an accuracy around 59% showed the potential of spectral and structural information to classify species. However, the incorporation of LiDAR data improved the classification based on hyperspectral indices by at least 4%.
Brabant et al. [49] used vegetation indices for each of the hyperspectral sensors used in their study, i.e., 19 for Hypex, 19 for HYPXIM, and 17 for HYPXIM achieving an OA of 78.4%. Each of those sensors also had a different spatial resolution, of two, four, and eight meters, respectively. Based on such a combination of sensors and indexes, they were able to accurately classify 14 urban tree species. Katz et al. [11] also used hyperspectral aerial imagery (Nearmap) for the identification of 19 tree species in Detroit, USA, using vegetation and texture indices, achieving an accuracy of 60% when only hyperspectral imagery was used.
PCCs are products derived from aerial images from which, through image matching techniques of the overlapping stereo images, a 3D image or point cloud can be obtained [101]. As with LiDAR data, some metrics such as tree height can be obtained from a digital elevation model (DEM) or a canopy height model (CHM) [88]. PPCs were used in two studies. Minařík et al. [100] used PPCs collected through a UAV to identify and delineate canopies in an urban mixed forest. They analyzed the effect of point density on individual tree delineation and found an OA of 82% in crown detection from a PPC. On the other hand, Birdal et al. [99] used a PPC generated by image matching for mapping and height detection of trees in an urban park, achieving a correlation of 94% with field tree height measurements.
Thus, aerial imagery (hyperspectral, RGB or PPC) may play an important role in tree mapping, both in the characterization and delineation of tree crowns and in species identification, since these data have enough spectral and spatial resolution [29,81,102]. However, Katz et al. [11] reported that one of the main limitations of aircraft aerial imagery is the reduced availability of these images over time, given that images are taken at specific times, making it difficult to analyze vegetation at different phenological stages. Therefore, UAV represents a solution to this problem, since it can obtain good quality data at any date at a low cost [41].
Another reported limitation is the impossibility of making 3D models to analyze the vegetation structure, making it difficult to estimate tree metrics (e.g., height or diameter) from aerial spectral images, as they do not allow for a ground-level perspective of trees [15]. In this regard, among the analyzed data sources, PPCs represent an alternative to overcome this problem. Through PPCs generated from UAV flights, metrics, such as tree height and crown data, can be analyzed [99]. Minařík et al. [100] found that, when processing PPCs, point density is more important than the selection of a given processing method, recommending a range between 10 and 85 points/m2 for tree canopy identification and delineation in urban environments, while Birdal et al. [99] suggested at least 40 points/m2 for proper height characterization.
Meanwhile, although hyperspectral information from aerial images represent a valuable resource for species identification through spectral signatures and shape study, several studies showed that two individuals of the same species may have different spectral and structural characteristics due to the growth form and phenology [93,102]. Another limitation regarding the use of aerial images in the identification of trees in the city is the heterogeneity of the landscape where elements, such as facades, roofs, and others can be mistaken for trees or partly hide them [5], in addition to objects adjacent to the trees that can lead to misclassifications when using PPCs [100,103].
3.2.4. Ground-Level Images and Videos
Ground-level data from remote sensors such as LiDAR (TLS and MLS) are usually costly. Although ground-level PPC data can represent a more affordable alternative compared with LiDAR data, the latter can provide a broader perspective (360 degrees), while PPCs are more limited in terms of the field of view of the camera [102]. In addition, digital ground-level imagery (DGI) has grown in popularity in recent years as a source of information in cities [65]. DGI is mostly available online, easy to acquire, and has contributed to further enhancing the analysis of the urban landscape [16]. This type of image can become an approximation to the human visual perception of the urban space, as it reflects its complexity from a panoramic perspective [45,104]. Recent studies demonstrated the potential of DGI to characterize objects, including trees, in urban lands [91,98]. The most popular sources of DGI include Google Street View (GSV) [52] images and Tencent [53] images (for China).
GSV data ease object recognition and constitute reliable tools for measuring elements in urban lands (cities, roads, industries, etc.) [45,104]. In recent years, GSV images have been increasingly used in urban forestry research. We found a total of 19 scientific papers that used GLI (2 PPC, 16 DGI, and 1 video) to perform urban greenery and tree characterization (Table 5).
Tree segmentation in ground-level data is affected by the size of the tree and the distance of the tree from the camera lens. Therefore, to complete a vegetation analysis with GLI, the images must be captured along sections that allow for analyzing the whole scene in order to detect and characterize urban trees [109]. Thus, for tree characterization and species identification, shorter section distances between consecutive images, e.g., 10–15 m with DGI [15,45,47,104,105] or 30 m with PPC or MLS are required [102] (Table 5).
Roberts et al. [102] used mobile PPCs for mapping and measuring the diameter of 88 roadside trees, achieving a R2 of 0.95, and found that the accuracy increased by 8% compared to static PPCs. Choudhury et al. [88] used static PPCs at ground level to measure tree heights in 22 plots (100 m2), and required a total of 150 photos per plot to properly map and reconstruct each plot. The mean height error was 0.3 cm for the largest trees (25 m), indicating high model accuracy.
Although the use of PPCs at ground-level have been little studied in the characterization of urban trees, they represent a source of data with potential for mapping and measuring structural characteristics of urban trees, such as diameter and height [100]. Research efforts are required, especially in the development of processing and modeling techniques, which allow exploiting all potentialities of this data source [110].
Regarding DGI, a study conducted by Stubbings et al. [15] used a street tree vegetation index, calculated from GSV imagery, to quantify urban trees at the street level in cities, achieving an accuracy of 97%. This study highlights the importance of data sources such as GSV and OpenStreetCam for updating information on urban forests and their ability to offer ES. On the other hand, studies, such as the one developed by Laumer et al. [105], advanced not only in tree recognition (91% of accuracy), but also in tree positioning, achieving 56% accuracy in the assignment of geographic coordinates’ through GSV images and the Geocoding API from Google. Moreover, Branson et al. [45] focused on tree species identification, in addition to the detection of individual trees, from GLI and achieved an accuracy of 70% in tree segmentation and an accuracy of 80% in species identification of urban trees of Pasadena, California.
Moreover, a few other studies [1,40,106,107,109] analyzed the vegetation cover in cities based on the sky view factor, assessing how much of the sky is obscured by vegetation [40]. This measure has been widely used as a measure of shading capacity of street trees in cities [66]. They employed panoramic images of the streets, which allowed them to use fewer photographs, by downloading images more distantly from each other. On the other hand, a study developed by Wang et al. [108] describes the potential of GSV in obtaining information on three dimensions, which is necessary when estimating other ES such as carbon sequestration. They were able to estimate the diameter, height, and crown dimension of street line trees with an accuracy of 92%, 87%, and 80%, respectively. Among the articles reviewed, Hong et al. [111] presented a novel approach to quantify a greenness index as a measure of urban tree cover in the streets of Vancouver, Canada, from video (29.97 frames per second for 3 h). The second objective of that study was to correlate temperature with street greenness, where a 61% correlation between the two measures was obtained. The authors found significant limitations related to the extraction of vegetation from the videos, highlighting the poor ability to recognize trees in dark (low saturation greenery) areas from the classification of pixel by (HSI) color that was confused with some shadows, suggesting that these limitations could be addressed using more refined and robust methods such as DL.
Currently, all the new sources of structured and unstructured open data (e.g., data from social networks, places reviews, etc.) available online represent a mine of information on urban and city trees [16]. These sources, notwithstanding their proliferation, have not been sufficiently explored to date, and represent a largely uncharted resource for urban landscape analysis. In fact, these data may represent new sources of information useful in urban tree management, especially for updating inventories and/or monitoring, but they also represent a challenge in terms of processing, as their complexity requires more powerful models and high computational capabilities [106]. However, as suggested by Stubbings et al. [15], it is necessary that data owners, such as Google [52] or Tencent [53], improve their geographical coverage in some regions.
3.2.5. Combining Multiple Data Sources
In general, the evolving trend of previous research directs us to combination data source strategies, to overcome the inherent limitations of LiDAR data sources and spectral imagery (satellite and aerial). Indeed, in our review, we found that more than 60% of the studies performed data combination. For instance, Marrs and Ni-Meister [43] used multiple data sources, including Goddard’s LiDAR, Hyperspectral ad Thermal Imager (G-LiHT). The latter is a NASA project that provides 3D LiDAR data that allows for the reconstruction of the tree canopy through stereoscopic images, and thermal images, all with a spatial resolution of approximately 1 m. However, this technology is only available for the United States of America and Mexico [112].
Katz et al. [11] used multispectral imagery (WV2), aerial imagery (Nearmap), and LiDAR data for the detection and classification of urban trees. They found that using LiDAR data alone the accuracy reached a maximum of 43%, while combining different datasets such as WV2 or Nearmap the accuracy increased up to 20%. On the other hand, when comparing the performance of the images, Nearmap reached an accuracy of 68.2% while WV2 reached its maximum performance with 57%. When feeding the model with the three data sources (Nearmap, WV2 and LiDAR), an OA of 74% was achieved.
Hartling et al. [37] analyzed the performance of different data sources including WV2, WV3, and LiDAR. Initially, their model achieved an OA of 75% using only WV2 VNIR data. By merging WV2 VNIR bands and resampling WV3 SWIR bands from 7.5 m to 0.5 m, and LiDAR return intensity image, and WV2 Panchromatic the OA reached up to 82% in the classification of eight dominant tree species in St. Louis, USA. In some other cases, the performance of models for urban vegetation characterization improved with data integration. For instance, Alonzo et al. [21], who used hyperspectral imagery and LiDAR data, achieved the same OA (82%) in the identification of 10 urban species.
It is also worth highlighting that 80% of the studies based on GSV images did not use any other remote sensing data as complementary or ancillary information. This reflects the potential of new data sources, such as DGI in urban tree research.
3.3. Data Processing and Analytical Methods
The increasing amount of data and data sources described above has underscored the need for developing complex data processing and analytical methods. For the ease of description of the different approaches, in this manuscript we have classified them as follows: (i) traditional parametric methods describing statistical methods such as linear and logistic regression, and others; (ii) DIP methods based on algorithms already available in GIS software; (iii) AI methods based on more conventional ML algorithms, such as RF and SVM; and iv) ML algorithms based on DL methods.
The most commonly used algorithms are those related to DIP and DL; 19 papers were found to use convolutional neural networks (CNN) architectures for urban tree detection, and 20 papers used algorithms related to digital image processing, and 14 used ML algorithms.
3.3.1. Traditional Parametric Methods
These parametric methods refer to statistical approaches traditionally used for classification purposes. These classifiers are rarely used in urban tree classification as the main processing method, due to the heterogeneity of the landscape and the complexity of the data [35,67]. However, some authors found great accuracy in urban cover classification [44,97], stem measurement [102], object detection [78], and tree identification [108] using this approach. Among the 48 papers focused on urban tree characterization, only 10% of the studies evaluated used analytical approaches such as linear regression, variable correlation, logistic regression, and continuous-time Markov-chain. Roberts et al. [102] analyzed the accuracy of their lineal regression model comparing field measurements and predictions derived from PPC. Wang et al. [108] used ANOVA and Pearson correlation to relate tree dimensions from a GSV image and information taken from field inventory. Likewise, Aval et al. [97] used data processing and marked point process, which is a stochastic method derived from the Continuous-time Markov chain. These algorithms have shown good performance in small and homogenous study areas under controlled conditions, not representative of the heterogeneity of urban landscapes.
Although pure parametric methods have been relegated to more sophisticated methods (ML algorithms), they have now become a fundamental part of DIP algorithms and ML methods. For example, several authors [7,44,47,78] have used DIP methods with linear regressions, correlations, logistic regressions, and others. This is the case in the study conducted by Alonzo et al. [21] who used a marker-controlled watershed algorithm to segment tree crowns, used t, separate objects in an image, and the i-Tree Eco [113] software application to measure the cumulative canopy cover distributions in the city.
3.3.2. Digital Image Processing
DIP represents the algorithms used and integrated in software such as GIS, spreading to many areas, including remote sensing. These methods are easily replicable since they are embedded in well-designed DIP software and the processing is almost automatic [59]. These methods allow the user to know the information contained in a pixel and have allowed the development of complex methodologies for the processing of satellite data, LiDAR, hyperspectral images, and others [55], enabling more accurate object classifications and segmentations. For instance, clustering based on an unsupervised K-Means classification algorithm, which calculates the mean values of the defined classes and then groups them into the nearest class [114], is widely used in land change detection models or in the generation of digital terrain models [115]. Table 6 summarizes the DIP algorithms used in the reviewed papers.
Moreover, we could observe that typical data processing methods, such as clustering or segmentation algorithms, incorporated in prominent geographic information system (GIS) software or with libraries available in R or Python are still widely used in the identification and characterization of individual urban trees [100,116,117]. For example, with LiDAR data, clustering methods were necessary for the construction of CHM, DSM, and DCM, thus delineating and segmenting trees [76,118,119]. For instance, Azeez et al. [8] used CHM to classify LiDAR point clouds, defining the difference between ground surface and forest.
Nevertheless, these algorithms are not only used for point clouds. For example, Lin et al. [98] used K-means clustering to group tree crown pixels in aerial photography based on color intensity. Another clustering algorithm found in some of the reviewed papers was mean shift segmentation [114,115]. Li et al. [40] developed a model based on an automatic extraction and measurement of the sky view factor from GSV images using a mean shift image segmentation algorithm to section the fisheye photos, achieving more precision when compared to spectral-based rules.
Certain software and processing resources, however, are more developed for some data sources than for others. Although photogrammetry is an old technique, its direct application to the measurement of objects in cities is starting to gain popularity in forestry research recently due to its potential for 3D tree reconstruction and canopy delineation [102,120]. This has motivated the development of some software, such as Agisoft Metashape [121], which was used by Minařík et al. [100] and Pix4D [122], which was used by Birdal et al. [99], enabling the use of photogrammetry in forestry with relatively little technical expertise [120].
Moreover, some R packages, such as LidR [116], designed for LiDAR data modeling, allow for the processing of information from PPC [116]. For instance, Minařík et al. [100] tested four algorithms for modeling UAV-derived PPCs with LidR (Table 4).
While some authors claim that image processing methods have been displaced by more complex algorithms [123], in our research, we found that they are still robust algorithms in force. However, these methods are mainly used as part of data preprocessing since, with the evolution of object-centered analysis, contextual information is required, which image processing methods are not able to capture.
3.3.3. Machine Learning Algorithms
ML is defined as a subset of AI; its use has increase in urban tree research, gradually replacing more traditional parametric methods in the last five years (Section 3.2.1). In the last decade, some ML algorithms, such as SVM and RF, also called ensemble methods [57,124], and DL, have been increasingly used in urban forest research.
Among the 12 studies that used ML algorithms, 3 only used RF for urban forest modeling; 7 used RF in combination with other algorithms, while SVM was used in 5 studies (2 of them also used RF) (Table 7).
RF was used by Baines et al. [74] to quantify urban forest structure through some variables such as canopy cover, canopy height, and tree density. It was also used by Haase et al. [36] to identify urban greenery with an R2 of 0.92 and an accuracy of 96%. Moreover, RF showed high accuracy to identify and classify urban trees, as proved by Katz et al. [11] in their multi-dataset tree characterization study, achieving an overall model accuracy of 74%. In general, RF [125] is characterized by great accuracy for three reasons: it is robust, easy to parameterize, and simple to use [57]. However, the aforementioned studies found that the segmentation of urban trees with RF was inaccurate, given the heterogeneity of the landscape, especially in those cases where canopies were intermixed. Another difficulty reported by the authors who used RF to detect and classify urban trees is related to the training data, since it requires many data to ensure the feasibility of models. In addition, they found that RF models, based on a single datum source, are often not very scalable or generalizable [15,37].
Stubbings et al. [15] reported lower tree segmentation performance with an RF-based approach (67%) compared to a deep neural network (pyramid scene parsing network (PSPNet) which achieved 90% accuracy), but superior performance to the “green pixel threshold” segmentation algorithm (a digital image processing algorithm). The latter consists of choosing pixels by color, assuming that all trees are green in summer.
The second ML algorithm mostly used in five studies was SVM due to its versatility in performing classifications [59]. This algorithm works very well with heterogeneous and complex environments [57] and performs well with limited training samples, which is an advantage because preparing these data is a time-consuming task [59].
Azeez et al. [8] initially used DIP specifically for spectral difference segmentation and textural analysis on aerial images. The authors extracted the most important features for individual tree identification employing an SVM model achieving an accuracy over 90%. Brabant et al. [49] combined SVM with the minimum noise fraction dimension reduction method, achieving an OA of 78.4%.
Louarn et al. [54] and Hartling et al. [37] obtained similar results when comparing RF and SVM. When comparing these two ML algorithms, RF slightly outperformed SVM in tree classification. However, the authors highlight that, despite RF’s higher OA, it produced lower kappa coefficients, measure of model accuracy, due to its inability to adequately classify some species within the model, resulting in a decrease in reliability measures.
3.3.4. Deep Learning Methods
DL is a branch of ML based on the training of deep neural networks [55,123]. Neural networks (NN) can deal with enough complexity to solve problems with high dimensions, several variables, and predictors, and multiple data sources [55,118]. According to Ma et al. [59], until 2014 most DL studies focused on image processing were focused on applications in medicine. Nevertheless, in the last five years, the application in geoscience has increased (Table 8). The trend we found in the articles reviewed is toward using more powerful methods that can be scaled and adjusted quickly, while supporting large amounts of information [118]. We found that CNN are increasingly used within the field of remote sensing and DIP [37,39,76,96].
New data sources, such as LiDAR or GSV images, have motivated the design of novel, more robust, scalable, and replicable algorithms, increasing the use of DL and ML in forestry research [46,104]. A DL model by Wang et al. [73] utilized an optimized version of the PointNet network [127] with the k-nearest neighbor algorithm, achieving a semantic segmentation of LiDAR data for tree detection and recognition with an accuracy of 86%. This is the only study we could find to combine DL with LiDAR data only.
Branson et al. [45] used GSV images to detect and identify tree species with a Siamese CNN, allowing for the comparison of these results with the historical field inventory, achieving an accuracy of over 70% in tree detection and 80% in species recognition. A more complex model was presented by Barbierato et al. [77], who assessed urban ES by quantifying tree cover and its effect on urban ground temperature, through the integration of LiDAR data, aerial multispectral frames, and Google Street View images in Viareggio, Italy. Their segmentation was based on pre-training a CNN, ResNet-18 Network, and clustering algorithms. Moreover, this approach has been used by Sun et al. [76], who compared it with a deeper CNN version, ResNet-50 and DenseNet121, to identify tree species in a tropical wetland in China. They found that ResNet-50 provided the best accuracy in the classification process. Both studies reached around 89% accuracy on tree species classification. However, the highest accuracies were achieved by CNN architectures created by the authors and SegNet [128]. Timilsina et al. [38,39], with a single hidden layer CNN, achieved an accuracy of 96% and 92% in the detection of individual urban trees, respectively. In contrast, Haas et al. [96] tested two CNN architectures, with two hidden layers specialized in urban tree crowns detection, achieving an accuracy of 99% in crown detection and 72% in tree species classification. SegNet [128], used by Ye et al. [107] to evaluate wooded areas in cities, is a deep CNN (DCNN) for pixel multi-classification in images. It achieved an OA higher than 95%.
The DL models used in these studies [15,75,129] were designed for purposes other than tree characterization. PSPNet [129] used by Gong et al. [91] and Stubbings et al. [15], is a NN that uses a specific structure that allows the NN to abstract context information, very useful in the identification of objects in cities. Another architecture capable of extracting context information in pixel segmentation is DCNN, with a high level of accuracy in 2D models. Regarding tree characterization, DCNN was able to work with multiple predictor variables, which significantly improved the classification model over other classifiers [37].
Additionally, the importance of data quality in the performance of models and Artificial Intelligence engines must be considered. Lin et al. [98] used transfer learning from a deep network called You Only Look Once (YOLO) version 3. They achieved only an accuracy of 49%, even though YOLO is a deep, robust, and fast NN [130]. The authors used low-resolution aerial images and trained with low data augmentation for tree classification. This is a clear example that both data and models are important for the optimal application of these engines.
CNNs have shown great potential for tree classification in cities, by means of individual tree detection, with YOLO or Faster R-CNN, for example, or in image segmentation for coverage index extraction, with PSPNet or DCNN, or point-cloud segmentation with PointNet for LiDAR data. However, the use of these engines requires sufficiently large and diverse training data allowing for the NN to learn and be generalized efficiently [11,37]. Obtaining such data is often costly and time-consuming. However, recently, many projects have been working on open-source and available databases for training of this type of architecture [131,132]. LiDAR data have great potential to overcome the lack of training data, as for instance Weinstein et al. [133] have demonstrated the application of LiDAR to label high-resolution imagery for performing canopy segmentation; unsupervised labeling of more than 30 million images served as training in the DL model.
Other branches of ML that could help to overcome the limitations concerning training data are unsupervised methods, such as Reinforcement learning (RL) [134]. Recent research in the field of ML has found in RL an alternative to solve learning problems applied to remote sensing [135]. RL bases its learning on a system of hits and misses given by the data itself, without the need for an additional training dataset [57].
A significant advantage of these NNs is that their architecture is also open source and can be easily used by the scientific community. Finally, it should be noted the computational capacity required is high for the use of this type of model, especially in the training phase. The memory consumption is very large and high computer capabilities may be required [37,55].
4. Challenges and Further Research
The current scientific literature on urban vegetation detection and tree characterization suggests that there is a serious concern, regarding filling the gaps in knowledge on the characteristics of forests around the world.
Other recent research have focused on the comparison of data sources and/or algorithms that allow for better characterization of urban trees, rather than on the development of scalable models. In relation to data sources, the studies exposed the potentialities of new data sources such as DGI. These images are openly and massively available worldwide. As described above, these images allow the assessment of vegetation through different temporal overpasses and can help to estimate/analyze urban tree dynamics and changes in biodiversity and ES at different scales. Another source of data to be used, which has increased in popularity worldwide, comes from UAVs. These devices, increasingly common not only in the framework of environmental management but also in citizen science, can represent important input data for updating urban forest information, significantly reducing the costs of quality data acquisition, with high spatial resolutions suitable for tree characterization. UAV data could provide more information (LiDAR and aerial images) on research activities limited by phenology and seasonality within cities, thus expanding the knowledge of urban forest dynamics and allowing more accurate characterization of the individual urban tree. In addition, through the use of LiDAR-UAV and DL models we can obtain valuable tree recognition and detection data, as stated by Wang et al. [73].
In addition to the potential of new data sources, traditional data sources, such as satellite imagery also require further research in urban forests. The extension of spectral signatures of tree species in cities to assess forest biodiversity and ES should be a central issue in urban forest management. However, only a few of the reviewed studies focused on this important issue. It is worthwhile to investigate and promote open access data, often not accessible to the public, with the aim of building more accurate models and estimates on urban trees and forest ecosystems.
The fusion of several data sources has been investigated in depth in previous research. Many studies used LiDAR data as an auxiliary and complementary source to optical data, such as satellite and aerial imagery, showing the disadvantages of different temporal, spectral, and spatial resolutions among input data sources for the characterization of individual urban trees. However, this amount of information requires more powerful models for processing. For example, traditional parametric methods may perform well, but their tuning and parameterization make them fall short in terms of scalability. Likewise, some ML algorithms, as mentioned by several authors [29,37,59,76], are not able to perform classifications as accurately as some more specialized ones in DIP, and DL.
CNNs are an important tool in the image processing area, and they represent a robust option for data processing in the forestry sector, especially in tasks aiming at the segmentation and identification of trees and urban forest, making it much faster and scalable. However, much more recent branches such as RL could contribute to the automation of urban forest inventory. However, the need for open training data, which facilitates the training of ML and DL models, should be emphasized, as it is one of the most time-consuming tasks when using these models.
In summary, our analysis of the state-of-the-art has found that although the increasing trend in the automation of urban trees and urban forest characterization, further research is needed especially in order to take advantage of all data sources available. The real challenge for the scientific community is undoubtedly the creation of generalizable, replicable, and powerful models that allow the use of multiple data sources for urban forest inventory automation [5,136], taking advantage of the most salient features of each, e.g., LiDAR for crown identification, aerial and satellite imagery for species identification and ground-level photography, and TLS for structural characterization of trees [45]. In addition, it is crucial to solve the problems of accessibility and spatial and temporal resolution of the different data sources [59]. It is equally important to improve these models, to take advantage of the knowledge in areas with limited information, and allow governments to have accurate reports on urban forest systems and their services in their territories.
5. Conclusions
Natural ecosystems that surround cities across the world are becoming more vulnerable due to the rate of migration to urban areas; the sustainability of forests and the well-being of growing populations are impacted as a result [14]. These dynamics, more consolidated in developed countries, have made research on urban ES a relevant and important topic today [67]. This review presents state-of-the-art urban tree characterization based on remote sensing techniques. First, we note that most of the studies conducted in the last five years have been carried out in the Northern Hemisphere. A gap exists related to urban tree characterization in tropical and low-income countries. There is a need to increase research in these areas and to create scalable models that allow information on urban trees worldwide to be obtained quickly, easily, and affordably.
Second, considering the data sources used in the analyzed studies, we found that the tendency and recommendations from previous research were toward combining multiple data sources and, thus, overcoming the inherent disadvantages of individual sensors. Some of the problems pointed out included the limited spatial and spectral resolution of open source and free satellite images or the associated excessive costs of satellite images from private companies. The main limitations associated with aerial imagery are temporality, free access to data, and the associated costs of quality data. LiDAR data, which are used as complementary information, in most cases, for the description, positioning, and segmentation of urban trees, are difficult to handle, especially in areas such as cities, where the elements adjacent to the trees generate noise in the detections. However, we found that by using optimized DL techniques, it is possible to use these data directly from the source with good segmentation results. Finally, we find that ground-level data, such as photographs and videos, which provide vertical perspectives that could only be alternatively obtained from field visits or with TLS (which has a high associated cost and a reduced geographic scale), have very high computational costs in their treatments. Those studies where two or more data sources were combined had high accuracies and generally represented geographic scales larger than local.
In addition to the data, the complexities of cities make it difficult to detect and extract objects from the images, which leads to the third challenge: the need for enough computational and processing power. In the studies analyzed, the use of multiple traditional and even conventional ML methods was not sufficient for the characterization of urban trees. Although statistical models proved useful for describing specific tree characteristics, we observed that they did not prove to be scalable and generalizable models. On the other hand, in studies comparing conventional ML and DL algorithms, we found that DL was more accurate for urban vegetation segmentation, achieving higher accuracy, but was highly demanding computationally. Techniques, such as segmentation, object detection, and classification with CNN based on DL proved to be helpful in urban forest studies on a larger scale, as they are scalable models. In particular, they have encouraged venturing into the use of other data sources, such as ground-level imagery for the characterization of individual trees.
Author Contributions
Conceptualization, L.V.-C., G.A. and S.d.-M.; methodology, L.V.-C., A.C. and S.d.-M.; validation, L.V.-C.; formal analysis, L.V.-C.; writing—original draft preparation, L.V.-C.; writing—review and editing, L.V.-C., A.C., M.M., M.E., G.A., S.d.-M.; supervision S.d.-M.; project administration, S.d.-M., G.A. All authors have read and agreed to the published version of the manuscript.
Funding
This work was financially supported by the Catalan Government through the funding grant ACCIÓ-Eurecat.
Institutional Review Board Statement
Not applicable.
Informed Consent Statement
Not applicable.
Data Availability Statement
Data sharing not applicable.
Acknowledgments
L.V.-C. is a fellow of Eurecat’s “Vicente López” PhD grant program.
Conflicts of Interest
The authors declare no conflict of interest.
References
- Li, X.; Zhang, C.; Li, W.; Ricard, R.; Meng, Q.; Zhang, W. Assessing street-level urban greenery using Google Street View and a modified green view index. Urban For. Urban Green. 2015, 14, 675–685. [Google Scholar] [CrossRef]
- Wilkes, P.; Disney, M.; Vicari, M.B.; Calders, K.; Burt, A. Estimating urban above ground biomass with multi-scale LiDAR. Carbon Balance Manag. 2018, 13, 10. [Google Scholar] [CrossRef]
- Chaparro, L.; Terrasdas, J. Ecological Services of Urban Forest in Barcelona. Shengtai Xuebao Acta Ecol. Sin. 2009, 29, 103. [Google Scholar] [CrossRef]
- Ciesielski, M.; Stereńczak, K. Accuracy of determining specific parameters of the urban forest using remote sensing. Iforest-Biogeosci. For. 2019, 12, 498–510. [Google Scholar] [CrossRef] [Green Version]
- Lin, J.; Kroll, C.N.; Nowak, D.J.; Greenfield, E.J. A review of urban forest modeling: Implications for management and future research. Urban For. Urban Green. 2019, 43, 126366. [Google Scholar] [CrossRef]
- Norton, B.A.; Coutts, A.M.; Livesley, S.J.; Harris, R.J.; Hunter, A.M.; Williams, N.S.G. Planning for cooler cities: A framework to prioritise green infrastructure to mitigate high temperatures in urban landscapes. Landsc. Urban Plan. 2015, 134, 127–138. [Google Scholar] [CrossRef]
- Ozkan, U.Y.; Demirel, T.; Ozdemir, I.; Arekhi, M. Estimation of Structural Diversity in Urban Forests Based on Spectral and Textural Properties Derived from Digital Aerial Images. J. Indian Soc. Remote Sens. 2019, 47, 2061–2071. [Google Scholar] [CrossRef]
- Azeez, O.S.; Pradhan, B.; Jena, R. Urban tree classification using discrete-return LiDAR and an object-level local binary pattern algorithm. Geocarto Int. 2021, 36, 1785–1803. [Google Scholar] [CrossRef]
- Davies, H.J.; Doick, K.J.; Hudson, M.D.; Schaafsma, M.; Schreckenberg, K.; Valatin, G. Business attitudes towards funding ecosystem services provided by urban forests. Ecosyst. Serv. 2018, 32, 159–169. [Google Scholar] [CrossRef]
- Wang, K.; Wang, T.; Liu, X. A Review: Individual Tree Species Classification Using Integrated Airborne LiDAR and Optical Imagery with a Focus on the Urban Environment. Forests 2019, 10, 1. [Google Scholar] [CrossRef] [Green Version]
- Katz, D.S.W.; Batterman, S.A.; Brines, S.J. Improved Classification of Urban Trees Using a Widespread Multi-Temporal Aerial Image Dataset. Remote Sens. 2020, 12, 2475. [Google Scholar] [CrossRef]
- Gong, J.Y.; Liu, C.; Huang, X. Advances in urban information extraction from high-resolution remote sensing imagery. Sci. China Earth Sci. 2019, 63, 463–475. [Google Scholar] [CrossRef]
- Mitchell, M.G.; Johansen, K.; Maron, M.; McAlpine, C.A.; Wu, D.; Rhodes, J.R. Identification of fine scale and landscape scale drivers of urban aboveground carbon stocks using high-resolution modeling and mapping. Sci. Total Environ. 2018, 622, 57–70. [Google Scholar] [CrossRef] [PubMed]
- Lutz, W.; Sanderson, W.; Scherbov, S. The end of world population growth. Nat. Cell Biol. 2001, 412, 543–545. [Google Scholar] [CrossRef] [PubMed] [Green Version]
- Stubbings, P.; Peskett, J.; Rowe, F.; Arribas-Bel, D. A Hierarchical Urban Forest Index Using Street-Level Imagery and Deep Learning. Remote Sens. 2019, 11, 1395. [Google Scholar] [CrossRef] [Green Version]
- Zhu, Z.; Zhou, Y.; Seto, K.C.; Stokes, E.C.; Deng, C.; Pickett, S.T.; Taubenböck, H. Understanding an urbanizing planet: Strategic directions for remote sensing. Remote Sens. Environ. 2019, 228, 164–182. [Google Scholar] [CrossRef]
- Livesley, S.; McPherson, E.G.; Calfapietra, C. The Urban Forest and Ecosystem Services: Impacts on Urban Water, Heat, and Pollution Cycles at the Tree, Street, and City Scale. J. Environ. Qual. 2016, 45, 119–124. [Google Scholar] [CrossRef] [PubMed]
- Myint, S.W.; Wentz, E.A.; Brazel, A.J.; Quattrochi, D.A. The impact of distinct anthropogenic and vegetation features on urban warming. Landsc. Ecol. 2013, 28, 959–978. [Google Scholar] [CrossRef] [Green Version]
- Voogt, J.A.; Oke, T.R. Thermal remote sensing of urban climates. Remote Sens. Environ. 2003, 86, 370–384. [Google Scholar] [CrossRef]
- Helletsgruber, C.; Gillner, S.; Gulyás, Á.; Junker, R.R.; Tanács, E.; Hof, A. Identifying Tree Traits for Cooling Urban Heat Islands—A Cross-City Empirical Analysis. Forests 2020, 11, 1064. [Google Scholar] [CrossRef]
- Alonzo, M.; McFadden, J.P.; Nowak, D.J.; Roberts, D.A. Mapping urban forest structure and function using hyperspectral imagery and lidar data. Urban For. Urban Green. 2016, 17, 135–147. [Google Scholar] [CrossRef] [Green Version]
- Liu, W.; Chen, W.; Peng, C. Assessing the effectiveness of green infrastructures on urban flooding reduction: A community scale study. Ecol. Model. 2014, 291, 6–14. [Google Scholar] [CrossRef]
- Atasoy, M. Characterizing spatial structure of urban tree cover (UTC) and impervious surface cover (ISC) density using remotely sensed data in Osmaniye, Turkey. SN Appl. Sci. 2020, 2, 387. [Google Scholar] [CrossRef] [Green Version]
- Nitoslawski, S.A.; Galle, N.J.; Van Den Bosch, C.K.; Steenberg, J.W. Smarter ecosystems for smarter cities? A review of trends, technologies, and turning points for smart urban forestry. Sustain. Cities Soc. 2019, 51, 101770. [Google Scholar] [CrossRef]
- Öztürk, M. The Role of Urban Forests in Adaptation to Climate Change. In Proceedings of the International Forestry Symposium; Kastamonu, Turkey, 7–10 December 2016. [Google Scholar]
- Hoornweg, D.; Sugar, L.; Gómez, C.L.T. Cities and greenhouse gas emissions: Moving forward. Environ. Urban. 2011, 23, 207–227. [Google Scholar] [CrossRef]
- Livesley, S.J.; Ossola, A.; Threlfall, C.; Hahs, A.K.; Williams, N. Soil Carbon and Carbon/Nitrogen Ratio Change under Tree Canopy, Tall Grass, and Turf Grass Areas of Urban Green Space. J. Environ. Qual. 2016, 45, 215–223. [Google Scholar] [CrossRef]
- Nowak, D.J.; Greenfield, E.J.; Hoehn, R.E.; Lapoint, E. Carbon storage and sequestration by trees in urban and community areas of the United States. Environ. Pollut. 2013, 178, 229–236. [Google Scholar] [CrossRef] [Green Version]
- Tigges, J.; Lakes, T. High resolution remote sensing for reducing uncertainties in urban forest carbon offset life cycle assessments. Carbon Balance Manag. 2017, 12, 17. [Google Scholar] [CrossRef] [Green Version]
- Braat, L.C.; de Groot, R. The ecosystem services agenda:bridging the worlds of natural science and economics, conservation and development, and public and private policy. Ecosyst. Serv. 2012, 1, 4–15. [Google Scholar] [CrossRef] [Green Version]
- Geneletti, D.; Cortinovis, C.; Zardo, L.; Adem Esmail, B. Planning for Ecosystem Services in Cities; Springer Briefs in Environmental Science; Springer: Cham, Switzerland, 2020; ISBN 978-3-030-20024-4. [Google Scholar]
- Grandgirard, J.; Poinsot, D.; Krespi, L.; Nenon, J.-P.; Cortesero, A.-M. Costs of secondary parasitism in the facultative hyperparasitoid Pachycrepoideus dubius: Does host size matter? Èntomol. Exp. Appl. 2002, 103, 239–248. [Google Scholar] [CrossRef] [Green Version]
- Oosterbroek, B.; de Kraker, J.; Huynen, M.M.; Martens, P. Assessing ecosystem impacts on health: A tool review. Ecosyst. Serv. 2016, 17, 237–254. [Google Scholar] [CrossRef]
- Vogt, J.; Hauer, R.; Fischer, B. The Costs of Maintaining and Not Maintaining the Urban Forest: A Review of the Urban Forestry and Arboriculture Literature. Arboric. Urban For. 2015, 41, 293–323. [Google Scholar] [CrossRef]
- Maxwell, A.E.; Warner, T.A.; Fang, F. Implementation of machine-learning classification in remote sensing: An applied review. Int. J. Remote Sens. 2018, 39, 2784–2817. [Google Scholar] [CrossRef] [Green Version]
- Haase, D.; Jänicke, C.; Wellmann, T. Front and back yard green analysis with subpixel vegetation fractions from earth observation data in a city. Landsc. Urban Plan. 2019, 182, 44–54. [Google Scholar] [CrossRef]
- Hartling, S.; Sagan, V.; Sidike, P.; Maimaitijiang, M.; Carron, J. Urban Tree Species Classification Using a WorldView-2/3 and LiDAR Data Fusion Approach and Deep Learning. Sensors 2019, 19, 1284. [Google Scholar] [CrossRef] [Green Version]
- Timilsina, S.; Aryal, J.; Kirkpatrick, J. Mapping Urban Tree Cover Changes Using Object-Based Convolution Neural Network (OB-CNN). Remote Sens. 2020, 12, 3017. [Google Scholar] [CrossRef]
- Timilsina, S.; Sharma, S.K.; Aryal, J. Mapping Urban Trees within Cadastral Parcels Using an Object-Based Convolutional Neural Network. ISPRS Ann. Photogramm. Remote Sens. Spat. Inf. Sci. 2019, 4, 111–117. [Google Scholar] [CrossRef] [Green Version]
- Li, X.; Ratti, C.; Seiferling, I. Quantifying the shade provision of street trees in urban landscape: A case study in Boston, USA, using Google Street View. Landsc. Urban Plan. 2018, 169, 81–91. [Google Scholar] [CrossRef]
- Bayat, F.; Arefi, H.; Alidoost, F. Individual Tree Detection and Determination of Tree Parameters Using Uav-Based Lidar Data. ISPRS-Int. Arch. Photogramm. Remote Sens. Spat. Inf. Sci. 2019, 42, 179–182. [Google Scholar] [CrossRef] [Green Version]
- Grafius, D.R.; Corstanje, R.; Warren, P.H.; Evans, K.L.; Norton, B.; Siriwardena, G.M.; Pescott, O.L.; Plummer, K.E.; Mears, M.; Zawadzka, J.; et al. Using GIS-linked Bayesian Belief Networks as a tool for modelling urban biodiversity. Landsc. Urban Plan. 2019, 189, 382–395. [Google Scholar] [CrossRef]
- Marrs, J.; Ni-Meister, W. Machine Learning Techniques for Tree Species Classification Using Co-Registered LiDAR and Hyperspectral Data. Remote Sens. 2019, 11, 819. [Google Scholar] [CrossRef] [Green Version]
- Ozkan, U.Y.; Ozdemir, I.; Saglam, S.; Yesil, A.; Demirel, T. Evaluating the Woody Species Diversity by Means of Remotely Sensed Spectral and Texture Measures in the Urban Forests. J. Indian Soc. Remote Sens. 2016, 44, 687–697. [Google Scholar] [CrossRef]
- Wegner, J.D.; Branson, S.; Hall, D.; Schindler, K.; Perona, P. Cataloging Public Objects Using Aerial and Street-Level Images—Urban Trees. In Proceedings of the 2016 IEEE Conference on Computer Vision and Pattern Recognition (CVPR), IEEE, Las Vegas, NV, USA, 27–30 June 2016; pp. 6014–6023. [Google Scholar]
- Jiang, B.; Deal, B.; Pan, H.; Larsen, L.; Hsieh, C.-H.; Chang, C.-Y.; Sullivan, W. Remotely-sensed imagery vs. eye-level photography: Evaluating associations among measurements of tree cover density. Landsc. Urban Plan. 2017, 157, 270–281. [Google Scholar] [CrossRef] [Green Version]
- Seiferling, I.; Naik, N.; Ratti, C.; Proulx, R. Green streets−Quantifying and mapping urban trees with street-level imagery and computer vision. Landsc. Urban Plan. 2017, 165, 93–101. [Google Scholar] [CrossRef]
- Srivastava, S.; Muñoz, J.E.V.; Lobry, S.; Tuia, D. Fine-grained landuse characterization using ground-based pictures: A deep learning solution based on globally available data. Int. J. Geogr. Inf. Sci. 2020, 34, 1117–1136. [Google Scholar] [CrossRef]
- Brabant, C.; Alvarez-Vanhard, E.; Laribi, A.; Morin, G.; Nguyen, K.T.; Thomas, A.; Houet, T. Comparison of Hyperspectral Techniques for Urban Tree Diversity Classification. Remote Sens. 2019, 11, 1269. [Google Scholar] [CrossRef] [Green Version]
- World View Legion. Available online: https://www.maxar.com/splash/it-takes-a-legion (accessed on 4 November 2021).
- Planet Labs Inc. Planet. Available online: https://www.planet.com/ (accessed on 1 March 2021).
- Google Maps Platform. Available online: https://developers.google.com/ (accessed on 11 November 2021).
- Tencent. Available online: https://www.tencent.com/en-us (accessed on 11 November 2021).
- Louarn, M.; Clergeau, P.; Briche, E.; Deschamps-Cottin, M. “Kill Two Birds with One Stone”: Urban Tree Species Classification Using Bi-Temporal Pléiades Images to Study Nesting Preferences of an Invasive Bird. Remote Sens. 2017, 9, 916. [Google Scholar] [CrossRef] [Green Version]
- LeCun, Y.; Bengio, Y.; Hinton, G. Deep learning. Nature 2015, 521, 436–444. [Google Scholar] [CrossRef] [PubMed]
- Feng, X.; Fu, B.; Yang, X.; Lü, Y. Remote sensing of ecosystem services: An opportunity for spatially explicit assessment. Chin. Geogr. Sci. 2010, 20, 522–535. [Google Scholar] [CrossRef] [Green Version]
- Géron, A. Hands-On Machine Learning with Scikit-Learn, Keras and TensorFlow: Concepts, Tools, and Techniques to Build Intelligent Systems, 2nd ed.; O’Reilly Media: Sebastopol, CA, USA, 2017; ISBN 978-1-4919-6229-9. [Google Scholar]
- Pibre, L.; Chaumon, M.; Subsol, G.; Lenco, D.; Derras, M. How to deal with multi-source data for tree detection based on deep learning. In Proceedings of the 2017 IEEE Global Conference on Signal and Information Processing (GlobalSIP), Montreal, QC, Canada, 14–16 November 2017; pp. 1150–1154. [Google Scholar]
- Ma, L.; Liu, Y.; Zhang, X.; Ye, Y.; Yin, G.; Johnson, B.A. Deep learning in remote sensing applications: A meta-analysis and review. ISPRS J. Photogramm. Remote Sens. 2019, 152, 166–177. [Google Scholar] [CrossRef]
- Cimburova, Z.; Barton, D.N. The potential of geospatial analysis and Bayesian networks to enable i-Tree Eco assessment of existing tree inventories. Urban For. Urban Green. 2020, 55, 126801. [Google Scholar] [CrossRef]
- Moura, M.; de Oliveira, L.; Sanquetta, C.; Bastos, A.; Mohan, M.; Corte, A. Towards Amazon Forest Restoration: Automatic Detection of Species from UAV Imagery. Remote Sens. 2021, 13, 2627. [Google Scholar] [CrossRef]
- Hamdi, Z.M.; Brandmeier, M.; Straub, C. Forest Damage Assessment Using Deep Learning on High Resolution Remote Sensing Data. Remote Sens. 2019, 11, 1976. [Google Scholar] [CrossRef] [Green Version]
- Thiebes, S.; Lins, S.; Sunyaev, A. Trustworthy artificial intelligence. Electron. Mark. 2021, 31, 447–464. [Google Scholar] [CrossRef]
- Pullin, A.S.; Stewart, G.B. Guidelines for Systematic Review in Conservation and Environmental Management. Conserv. Biol. 2006, 20, 1647–1656. [Google Scholar] [CrossRef]
- Long, Y.; Liu, L. How green are the streets? An analysis for central areas of Chinese cities using Tencent Street View. PLoS ONE 2017, 12, e0171110. [Google Scholar] [CrossRef] [PubMed] [Green Version]
- Li, X.; Ratti, C. Mapping the spatial distribution of shade provision of street trees in Boston using Google Street View panoramas. Urban For. Urban Green. 2018, 31, 109–119. [Google Scholar] [CrossRef]
- Pan, T.; Kuang, W.; Hamdi, R.; Zhang, C.; Zhang, S.; Li, Z.; Chen, X. City-Level Comparison of Urban Land-Cover Configurations from 2000–2015 across 65 Countries within the Global Belt and Road. Remote Sens. 2019, 11, 1515. [Google Scholar] [CrossRef] [Green Version]
- Shojanoori, R.; Shafri, H. Review on the Use of Remote Sensing for Urban Forest Monitoring. Arboric. Urban For. 2016, 42. [Google Scholar] [CrossRef]
- Giannico, V.; Lafortezza, R.; John, R.; Sanesi, G.; Pesola, L.; Chen, J. Estimating Stand Volume and Above-Ground Biomass of Urban Forests Using LiDAR. Remote Sens. 2016, 8, 339. [Google Scholar] [CrossRef] [Green Version]
- Chi, D.; Degerickx, J.; Yu, K.; Somers, B. Urban Tree Health Classification Across Tree Species by Combining Airborne Laser Scanning and Imaging Spectroscopy. Remote Sens. 2020, 12, 2435. [Google Scholar] [CrossRef]
- Cardil, A.; Otsu, K.; Pla, M.; Silva, C.A.; Brotons, L. Quantifying pine processionary moth defoliation in a pine-oak mixed forest using unmanned aerial systems and multispectral imagery. PLoS ONE 2019, 14, e0213027. [Google Scholar] [CrossRef]
- Gage, E.A.; Cooper, D.J. Urban forest structure and land cover composition effects on land surface temperature in a semi-arid suburban area. Urban For. Urban Green. 2017, 28, 28–35. [Google Scholar] [CrossRef]
- Wang, Y.; Jiang, T.; Liu, J.; Li, X.; Liang, C. Hierarchical Instance Recognition of Individual Roadside Trees in Environmentally Complex Urban Areas from UAV Laser Scanning Point Clouds. ISPRS Int. J. Geo-Inf. 2020, 9, 595. [Google Scholar] [CrossRef]
- Baines, O.; Wilkes, P.; Disney, M. Quantifying urban forest structure with open-access remote sensing data sets. Urban For. Urban Green. 2020, 50, 126653. [Google Scholar] [CrossRef]
- Matasci, G.; Coops, N.C.; Williams, D.A.R.; Page, N. Mapping tree canopies in urban environments using airborne laser scanning (ALS): A Vancouver case study. For. Ecosyst. 2018, 5, 31. [Google Scholar] [CrossRef] [Green Version]
- Sun, Y.; Xin, Q.; Huang, J.; Huang, B.; Zhang, H. Characterizing Tree Species of a Tropical Wetland in Southern China at the Individual Tree Level Based on Convolutional Neural Network. IEEE J. Sel. Top. Appl. Earth Obs. Remote Sens. 2019, 12, 4415–4425. [Google Scholar] [CrossRef]
- Barbierato, E.; Bernetti, I.; Capecchi, I.; Saragosa, C. Integrating Remote Sensing and Street View Images to Quantify Urban Forest Ecosystem Services. Remote Sens. 2020, 12, 329. [Google Scholar] [CrossRef] [Green Version]
- Wu, J.; Yao, W.; Polewski, P. Mapping Individual Tree Species and Vitality along Urban Road Corridors with LiDAR and Imaging Sensors: Point Density versus View Perspective. Remote Sens. 2018, 10, 1403. [Google Scholar] [CrossRef] [Green Version]
- Calders, K.; Adams, J.; Armston, J.; Bartholomeus, H.; Bauwens, S.; Bentley, L.P.; Chave, J.; Danson, F.M.; Demol, M.; Disney, M.; et al. Terrestrial laser scanning in forest ecology: Expanding the horizon. Remote Sens. Environ. 2020, 251, 112102. [Google Scholar] [CrossRef]
- Dubayah, R.; Blair, J.B.; Goetz, S.; Fatoyinbo, L.; Hansen, M.; Healey, S.; Hofton, M.; Hurtt, G.; Kellner, J.; Luthcke, S.; et al. The Global Ecosystem Dynamics Investigation: High-resolution laser ranging of the Earth’s forests and topography. Sci. Remote Sens. 2020, 1, 100002. [Google Scholar] [CrossRef]
- Fassnacht, F.; Latifi, H.; Stereńczak, K.; Modzelewska, A.; Lefsky, M.; Waser, L.; Straub, C.; Ghosh, A. Review of studies on tree species classification from remotely sensed data. Remote Sens. Environ. 2016, 186, 64–87. [Google Scholar] [CrossRef]
- Li, X.; Chen, W.Y.; Sanesi, G.; Lafortezza, R. Remote Sensing in Urban Forestry: Recent Applications and Future Directions. Remote Sens. 2019, 11, 1144. [Google Scholar] [CrossRef] [Green Version]
- Degerickx, J.; Hermy, M.; Somers, B. Mapping Functional Urban Green Types Using High Resolution Remote Sensing Data. Sustainability 2020, 12, 2144. [Google Scholar] [CrossRef] [Green Version]
- Rogers, S.; Manning, I.; Livingstone, W. Comparing the Spatial Accuracy of Digital Surface Models from Four Unoccupied Aerial Systems: Photogrammetry Versus LiDAR. Remote Sens. 2020, 12, 2806. [Google Scholar] [CrossRef]
- Myint, S.W.; Gober, P.; Brazel, A.; Grossman-Clarke, S.; Weng, Q. Per-pixel vs. object-based classification of urban land cover extraction using high spatial resolution imagery. Remote Sens. Environ. 2011, 115, 1145–1161. [Google Scholar] [CrossRef]
- Vahidi, H.; Klinkenberg, B.; Johnson, B.A.; Moskal, L.M.; Yan, W. Mapping the Individual Trees in Urban Orchards by Incorporating Volunteered Geographic Information and Very High Resolution Optical Remotely Sensed Data: A Template Matching-Based Approach. Remote Sens. 2018, 10, 1134. [Google Scholar] [CrossRef] [Green Version]
- He, S.; Du, H.; Zhou, G.; Li, X.; Mao, F.; Zhu, D.; Xu, Y.; Zhang, M.; Huang, Z.; Liu, H.; et al. Intelligent Mapping of Urban Forests from High-Resolution Remotely Sensed Imagery Using Object-Based U-Net-DenseNet-Coupled Network. Remote Sens. 2020, 12, 3928. [Google Scholar] [CrossRef]
- Choudhury, A.M.; Marcheggiani, E.; Despini, F.; Costanzini, S.; Rossi, P.; Galli, A.; Teggi, S. Urban Tree Species Identification and Carbon Stock Mapping for Urban Green Planning and Management. Forests 2020, 11, 1226. [Google Scholar] [CrossRef]
- Cârlan, I.; Mihai, B.-A.; Nistor, C.; Große-Stoltenberg, A. Identifying urban vegetation stress factors based on open access remote sensing imagery and field observations. Ecol. Inform. 2020, 55, 101032. [Google Scholar] [CrossRef]
- Maxar QuickBird. Available online: https://resources.maxar.com/data-sheets/quickbird (accessed on 4 November 2021).
- Gong, F.-Y.; Zeng, Z.-C.; Zhang, F.; Li, X.; Ng, E.; Norford, L.K. Mapping sky, tree, and building view factors of street canyons in a high-density urban environment. Build. Environ. 2018, 134, 155–167. [Google Scholar] [CrossRef]
- ESA Pleiades-HR (High-Resolution Optical Imaging Constellation of CNES). Available online: https://earth.esa.int/web/eoportal/satellite-missions/p/pleiades (accessed on 4 November 2021).
- Lin, Y.; Herold, M. Tree species classification based on explicit tree structure feature parameters derived from static terrestrial laser scanning data. Agric. For. Meteorol. 2016, 216, 105–114. [Google Scholar] [CrossRef]
- Dainelli, R.; Toscano, P.; Di Gennaro, S.; Matese, A. Recent Advances in Unmanned Aerial Vehicle Forest Remote Sensing—A Systematic Review. Part I: A General Framework. Forests 2021, 12, 327. [Google Scholar] [CrossRef]
- Tang, L.; Shao, G. Drone remote sensing for forestry research and practices. J. For. Res. 2015, 26, 791–797. [Google Scholar] [CrossRef]
- Haas, A.; Karrasch, P.; Bernard, L. Acquisition of Urban Trees Using Artificial Neural Networks and Remote Sensing Data. gis.Sci. —Die Z. Fur Geoinformatik 2020, 2020, 31–40. [Google Scholar]
- Aval, J.; Demuynck, J.; Zenou, E.; Fabre, S.; Sheeren, D.; Fauvel, M.; Adeline, K.; Briottet, X. Detection of individual trees in urban alignment from airborne data and contextual information: A marked point process approach. ISPRS J. Photogramm. Remote Sens. 2018, 146, 197–210. [Google Scholar] [CrossRef] [Green Version]
- Lin, C.H.; Yu, C.C.; Wang, T.Y.; Chen, T.Y. Classification of the tree for aerial image using a deep convolution neural network and visual feature clustering. J. Supercomput. 2019, 76, 2503–2517. [Google Scholar] [CrossRef]
- Birdal, A.C.; Avdan, U.; Türk, T. Estimating tree heights with images from an unmanned aerial vehicle. Geomat. Nat. Hazards Risk 2017, 8, 1144–1156. [Google Scholar] [CrossRef] [Green Version]
- Minařík, R.; Langhammer, J.; Lendzioch, T. Automatic Tree Crown Extraction from UAS Multispectral Imagery for the Detection of Bark Beetle Disturbance in Mixed Forests. Remote Sens. 2020, 12, 4081. [Google Scholar] [CrossRef]
- Lindgren, N.; Wästlund, A.; Bohlin, I.; Nyström, K.; Nilsson, M.; Olsson, H. Updating of forest stand data by using recent digital photogrammetry in combination with older airborne laser scanning data. Scand. J. For. Res. 2021, 36, 401–407. [Google Scholar] [CrossRef]
- Roberts, J.; Koeser, A.; Abd-Elrahman, A.; Wilkinson, B.; Hansen, G.; Landry, S.; Perez, A. Mobile Terrestrial Photogrammetry for Street Tree Mapping and Measurements. Forests 2019, 10, 701. [Google Scholar] [CrossRef] [Green Version]
- Choudhury, A.M.; Costanzini, S.; Despini, F.; Rossi, P.; Galli, A.; Marcheggiani, E.; Teggi, S. Photogrammetry and Remote Sensing for the identification and characterization of trees in urban areas. J. Phys. Conf. Ser. 2019, 1249, 012008. [Google Scholar] [CrossRef] [Green Version]
- Richards, D.R.; Edwards, P.J. Quantifying street tree regulating ecosystem services using Google Street View. Ecol. Indic. 2017, 77, 31–40. [Google Scholar] [CrossRef]
- Laumer, D.; Lang, N.; van Doorn, N.; Mac Aodha, O.; Perona, P.; Wegner, J.D. Geocoding of trees from street addresses and street-level images. ISPRS J. Photogramm. Remote Sens. 2020, 162, 125–136. [Google Scholar] [CrossRef] [Green Version]
- Lu, Y. The Association of Urban Greenness and Walking Behavior: Using Google Street View and Deep Learning Techniques to Estimate Residents’ Exposure to Urban Greenness. Int. J. Environ. Res. Public Health 2018, 15, 1576. [Google Scholar] [CrossRef] [Green Version]
- Ye, Y.; Richards, D.; Lu, Y.; Song, X.; Zhuang, Y.; Zeng, W.; Zhong, T. Measuring daily accessed street greenery: A human-scale approach for informing better urban planning practices. Landsc. Urban Plan. 2019, 191, 103434. [Google Scholar] [CrossRef]
- Wang, W.; Xiao, L.; Zhang, J.; Yang, Y.; Tian, P.; Wang, H.; He, X. Potential of Internet street-view images for measuring tree sizes in roadside forests. Urban For. Urban Green. 2018, 35, 211–220. [Google Scholar] [CrossRef]
- Dong, R.; Zhang, Y.; Zhao, J. How Green Are the Streets Within the Sixth Ring Road of Beijing? An Analysis Based on Tencent Street View Pictures and the Green View Index. Int. J. Environ. Res. Public Health 2018, 15, 1367. [Google Scholar] [CrossRef] [PubMed] [Green Version]
- Schiefer, F.; Kattenborn, T.; Frick, A.; Frey, J.; Schall, P.; Koch, B.; Schmidtlein, S. Mapping forest tree species in high resolution UAV-based RGB-imagery by means of convolutional neural networks. ISPRS J. Photogramm. Remote Sens. 2020, 170, 205–215. [Google Scholar] [CrossRef]
- Hong, K.Y.; Tsin, P.K.; Bosch, M.V.D.; Brauer, M.; Henderson, S.B. Urban greenness extracted from pedestrian video and its relationship with surrounding air temperatures. Urban For. Urban Green. 2019, 38, 280–285. [Google Scholar] [CrossRef]
- Cook, B.D.; Corp, L.A.; Nelson, R.F.; Middleton, E.M.; Morton, D.C.; McCorkel, J.T.; Masek, J.G.; Ranson, K.J.; Ly, V.; Montesano, P.M. NASA Goddard’s LiDAR, Hyperspectral and Thermal (G-LiHT) Airborne Imager. Remote Sens. 2013, 5, 4045–4066. [Google Scholar] [CrossRef] [Green Version]
- I-Tree Canopy; i-Tree; USDA. 2016. Available online: https://canopy.itreetools.org/ (accessed on 11 November 2021).
- Comaniciu, D.; Meer, P. Mean shift: A robust approach toward feature space analysis. IEEE Trans. Pattern Anal. Mach. Intell. 2002, 24, 603–619. [Google Scholar] [CrossRef] [Green Version]
- Comaniciu, D.; Meer, P. Mean shift analysis and applications. In Proceedings of the Seventh IEEE International Conference on Computer Vision, Corfu, Greece, 20–25 September 1999; Volume 2, pp. 1197–1203. [Google Scholar]
- Roussel, J.-R.; Auty, D.; Coops, N.C.; Tompalski, P.; Goodbody, T.R.; Meador, A.S.; Bourdon, J.-F.; de Boissieu, F.; Achim, A. lidR: An R package for analysis of Airborne Laser Scanning (ALS) data. Remote Sens. Environ. 2020, 251, 112061. [Google Scholar] [CrossRef]
- Silva, C.A.; Valbuena, R.; Pinagé, E.R.; Mohan, M.; De Almeida, D.R.A.; Broadbent, E.N.; Jaafar, W.S.W.M.; Papa, D.D.A.; Cardil, A.; Klauberg, C. F orest G ap R: An r Package for forest gap analysis from canopy height models. Methods Ecol. Evol. 2019, 10, 1347–1356. [Google Scholar] [CrossRef] [Green Version]
- Kaya, A.; Keceli, A.S.; Catal, C.; Yalic, H.Y.; Temucin, H.; Tekinerdogan, B. Analysis of transfer learning for deep neural network based plant classification models. Comput. Electron. Agric. 2019, 158, 20–29. [Google Scholar] [CrossRef]
- Vetrivel, A.; Gerke, M.; Kerle, N.; Nex, F.; Vosselman, G. Disaster damage detection through synergistic use of deep learning and 3D point cloud features derived from very high resolution oblique aerial images, and multiple-kernel-learning. ISPRS J. Photogramm. Remote Sens. 2018, 140, 45–59. [Google Scholar] [CrossRef]
- Iglhaut, J.; Cabo, C.; Puliti, S.; Piermattei, L.; O’Connor, J.; Rosette, J. Structure from Motion Photogrammetry in Forestry: A Review. Curr. For. Rep. 2019, 5, 155–168. [Google Scholar] [CrossRef] [Green Version]
- AgiSoft PhotoScan Professional. 2016. Available online: https://www.agisoft.com/ (accessed on 30 November 2021).
- Swiss Federal Institute of Technology Lausanne. Pix4D–Drone Mapping Software, Switzerland. 2014. Available online: https://www.pix4d.com/ (accessed on 30 November 2021).
- Lary, D.; Alavi, A.H.; Gandomi, A.; Walker, A.L. Machine learning in geosciences and remote sensing. Geosci. Front. 2016, 7, 3–10. [Google Scholar] [CrossRef] [Green Version]
- Mongus, D.; Vilhar, U.; Skudnik, M.; Žalik, B.; Jesenko, D. Predictive analytics of tree growth based on complex networks of tree competition. For. Ecol. Manag. 2018, 425, 164–176. [Google Scholar] [CrossRef]
- Tin Kam, H. Random Decision Forests. In Proceedings of the 3rd International Conference on Document Analysis and Recognition, Montreal, QC, Canada, 14–16 August 1995; Computer Society Press: Montreal, QC, Canada, 1995; Volume 1, pp. 278–282. [Google Scholar] [CrossRef]
- Torii, A.; Havlena, M.; Pajdla, T. From Google Street View to 3D city models. In Proceedings of the 2009 IEEE 12th International Conference on Computer Vision Workshops, ICCV Workshops, Kyoto, Japan, 27 September–4 October 2009; pp. 2188–2195. [Google Scholar]
- Qi, C.R.; Su, H.; Mo, K.; Guibas, L.J. PointNet: Deep Learning on Point Sets for 3D Classification and Segmentation. arXiv 2017, arXiv:1612.00593v2. [Google Scholar]
- Badrinarayanan, V.; Handa, A.; Cipolla, R. SegNet: A Deep Convolutional Encoder-Decoder Architecture for Robust Semantic Pixel-Wise Labelling. arXiv 2015, arXiv:1505.07293. [Google Scholar]
- Zhao, H.; Shi, J.; Qi, X.; Wang, X.; Jia, J. Pyramid Scene Parsing Network. In Proceedings of the 2017 IEEE Conference on Computer Vision and Pattern Recognition (CVPR), Honolulu, HI, USA, 21–26 July 2017; pp. 6230–6245. [Google Scholar]
- Redmon, J.; Farhadi, A. YOLOv3: An Incremental Improvement. arXiv 2018, arXiv:1804.02767. [Google Scholar]
- Lin, T.-Y.; Maire, M.; Belongie, S.; Bourdev, L.; Girshick, R.; Hays, J.; Perona, P.; Ramanan, D.; Zitnick, C.L.; Dollár, P. Microsoft COCO: Common Objects in Context. In Proceedings of the IEEE Conference on Computer Vision and Pattern Recognition, Boston, MA, USA, 7–12 June 2015. [Google Scholar]
- Cordts, M.; Omran, M.; Ramos, S.; Rehfeld, T.; Enzweiler, M.; Benenson, R.; Franke, U.; Roth, S.; Schiele, B. The Cityscapes Dataset for Semantic Urban Scene Understanding. In Proceedings of the 2016 IEEE Conference on Computer Vision and Pattern Recognition (CVPR), Las Vegas, NV, USA, 27–30 June 2016; pp. 3213–3223. [Google Scholar] [CrossRef] [Green Version]
- Weinstein, B.G.; Marconi, S.; Bohlman, S.; Zare, A.; White, E. Individual Tree-Crown Detection in RGB Imagery Using Semi-Supervised Deep Learning Neural Networks. Remote Sens. 2019, 11, 1309. [Google Scholar] [CrossRef] [Green Version]
- Li, Y.; Fu, K.; Sun, H.; Sun, X. An Aircraft Detection Framework Based on Reinforcement Learning and Convolutional Neural Networks in Remote Sensing Images. Remote Sens. 2018, 10, 243. [Google Scholar] [CrossRef] [Green Version]
- Shen, X.; Liu, B.; Zhou, Y.; Zhao, J. Remote sensing image caption generation via transformer and reinforcement learning. Multimedia Tools Appl. 2020, 79, 26661–26682. [Google Scholar] [CrossRef]
- Vauhkonen, J.; Ørka, H.O.; Holmgren, J.; Dalponte, M.; Heinzel, J.; Koch, B. Tree Species Recognition Based on Airborne Laser Scanning and Complementary Data Sources. In Forestry Applications of Airborne Laser Scanning; Springer: Berlin/Heidelberg, Germany, 2014; Volume 27, pp. 135–156. [Google Scholar] [CrossRef]
Figure 1.
The number of select publications yearly from 2016 to 2020 based on Scopus, WOS, and citation network search.
Figure 1.
The number of select publications yearly from 2016 to 2020 based on Scopus, WOS, and citation network search.

Figure 2.
World map displaying the distribution of the 48 selected studies.

Figure 3.
Data sources used in the 48 papers analyzed. Some studies combined two or more data sources for tree characterization. UAVs: unmanned aerial vehicles; GSV: Google Street View; TLS: terrestrial laser scanning; ALS airborne laser scanning; MLS: mobile laser scanning; PPC: photogrammetry point cloud.


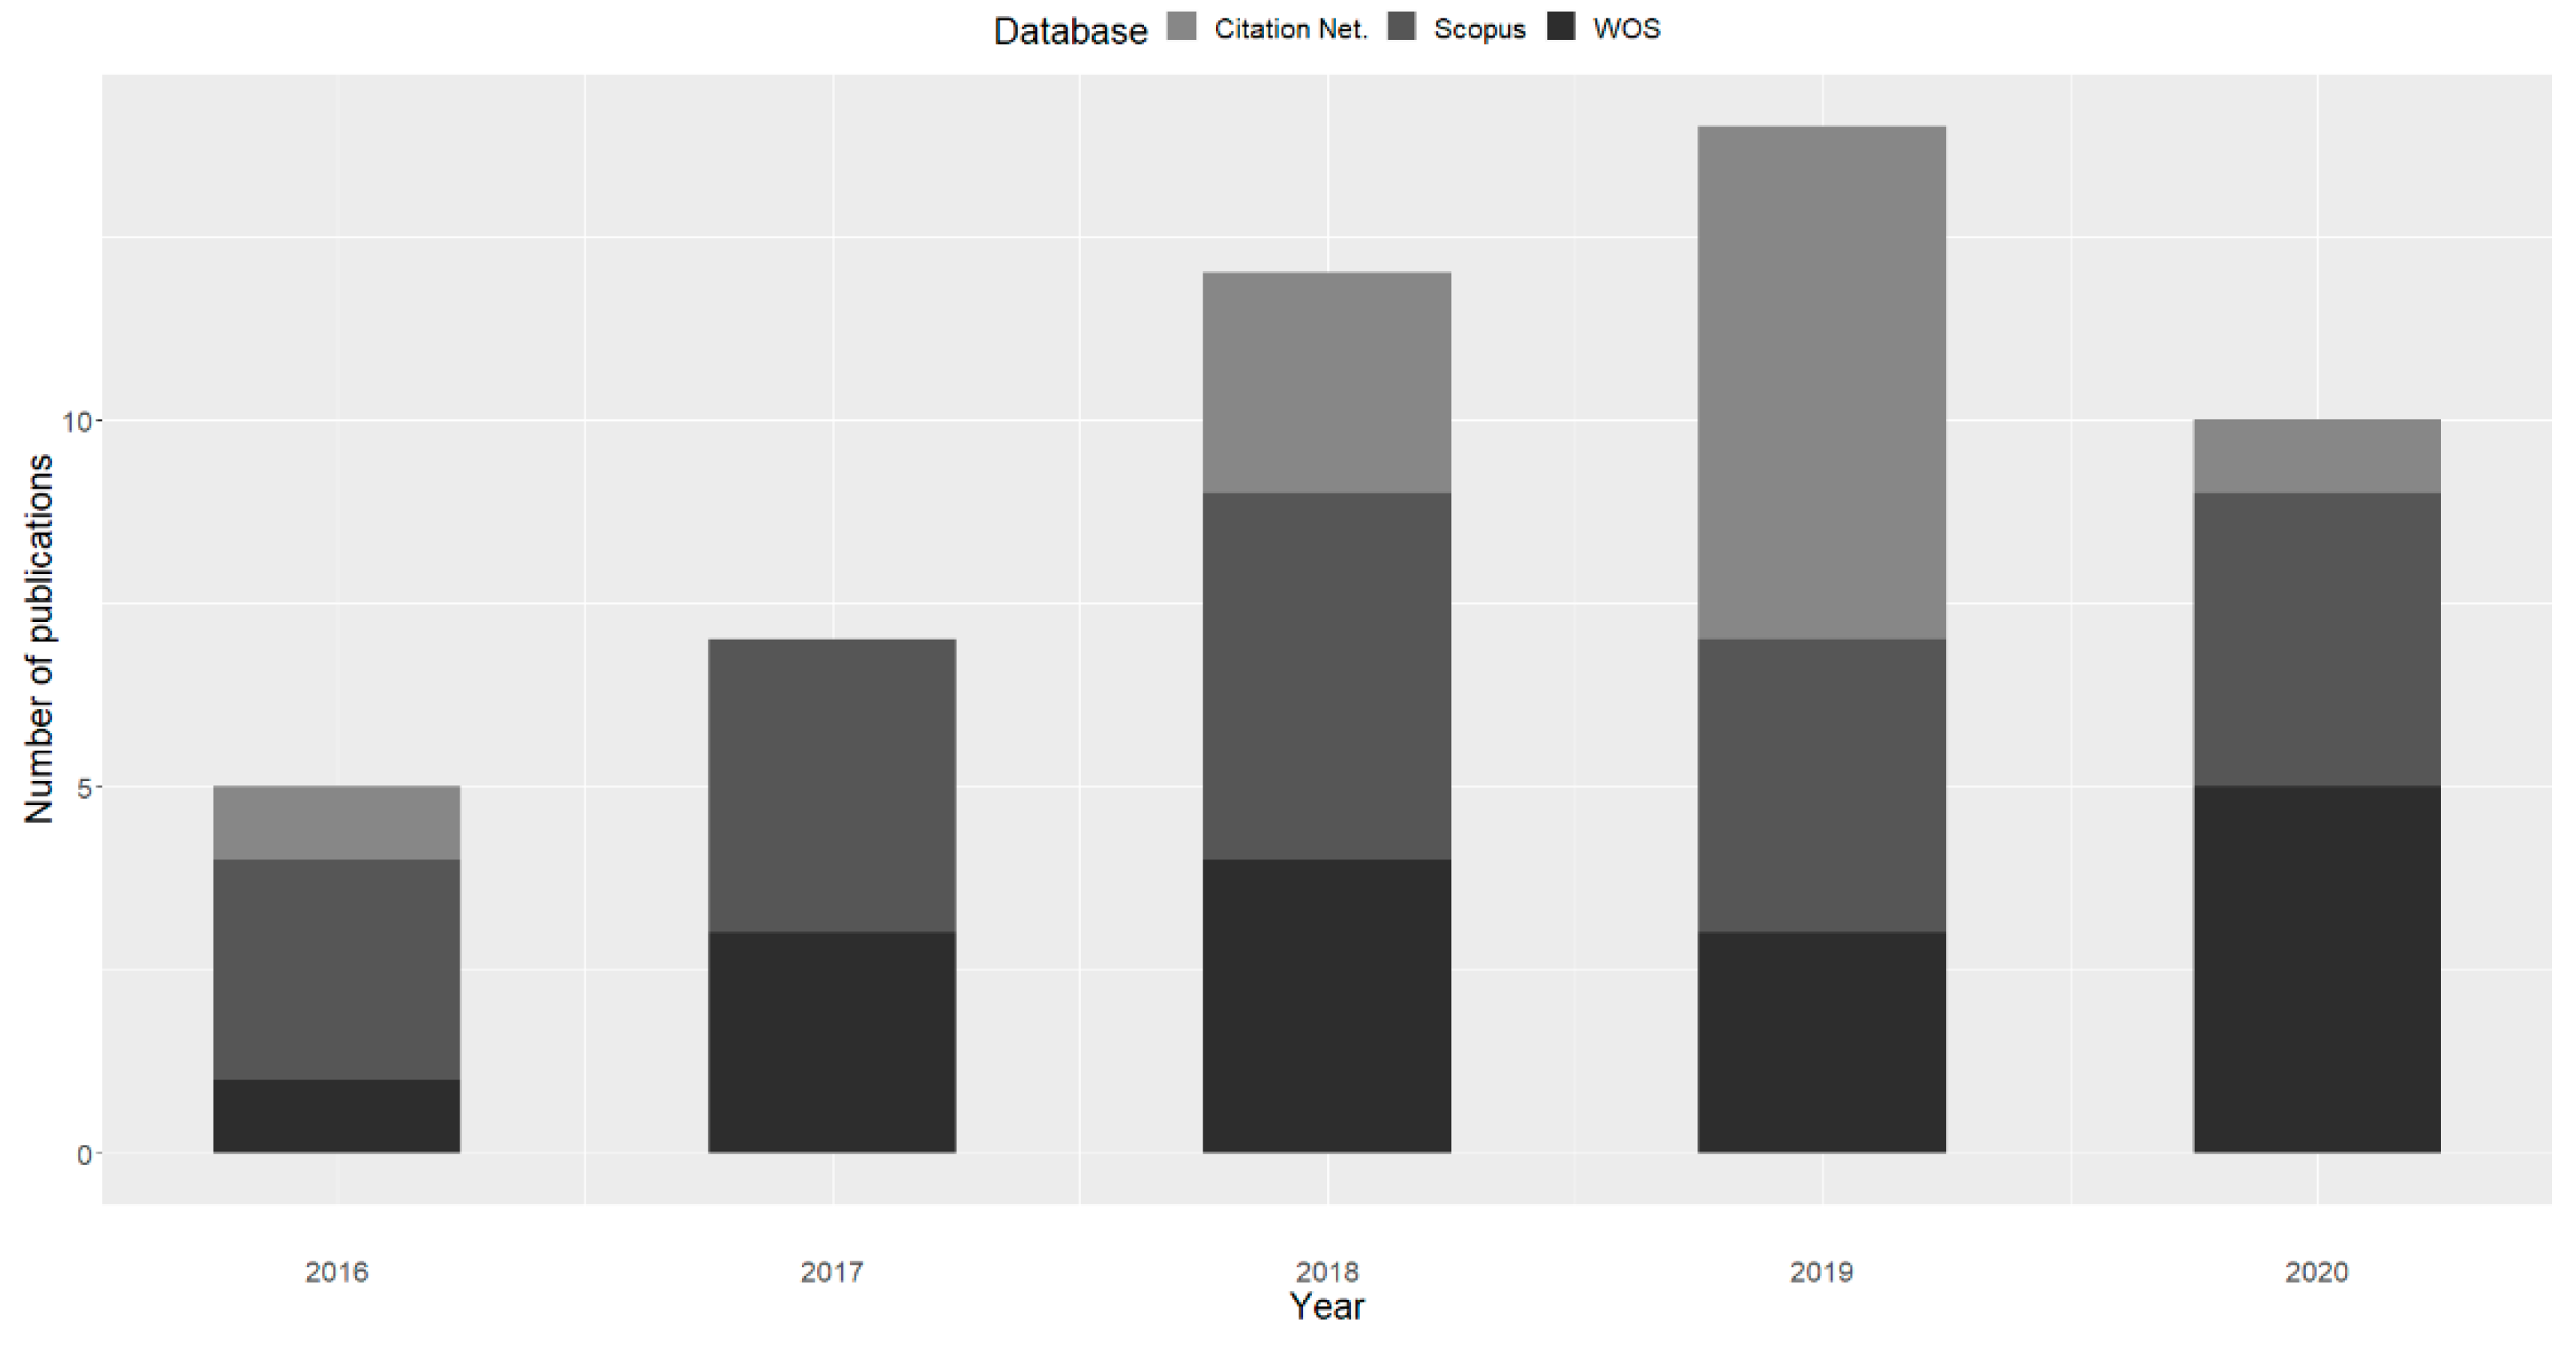
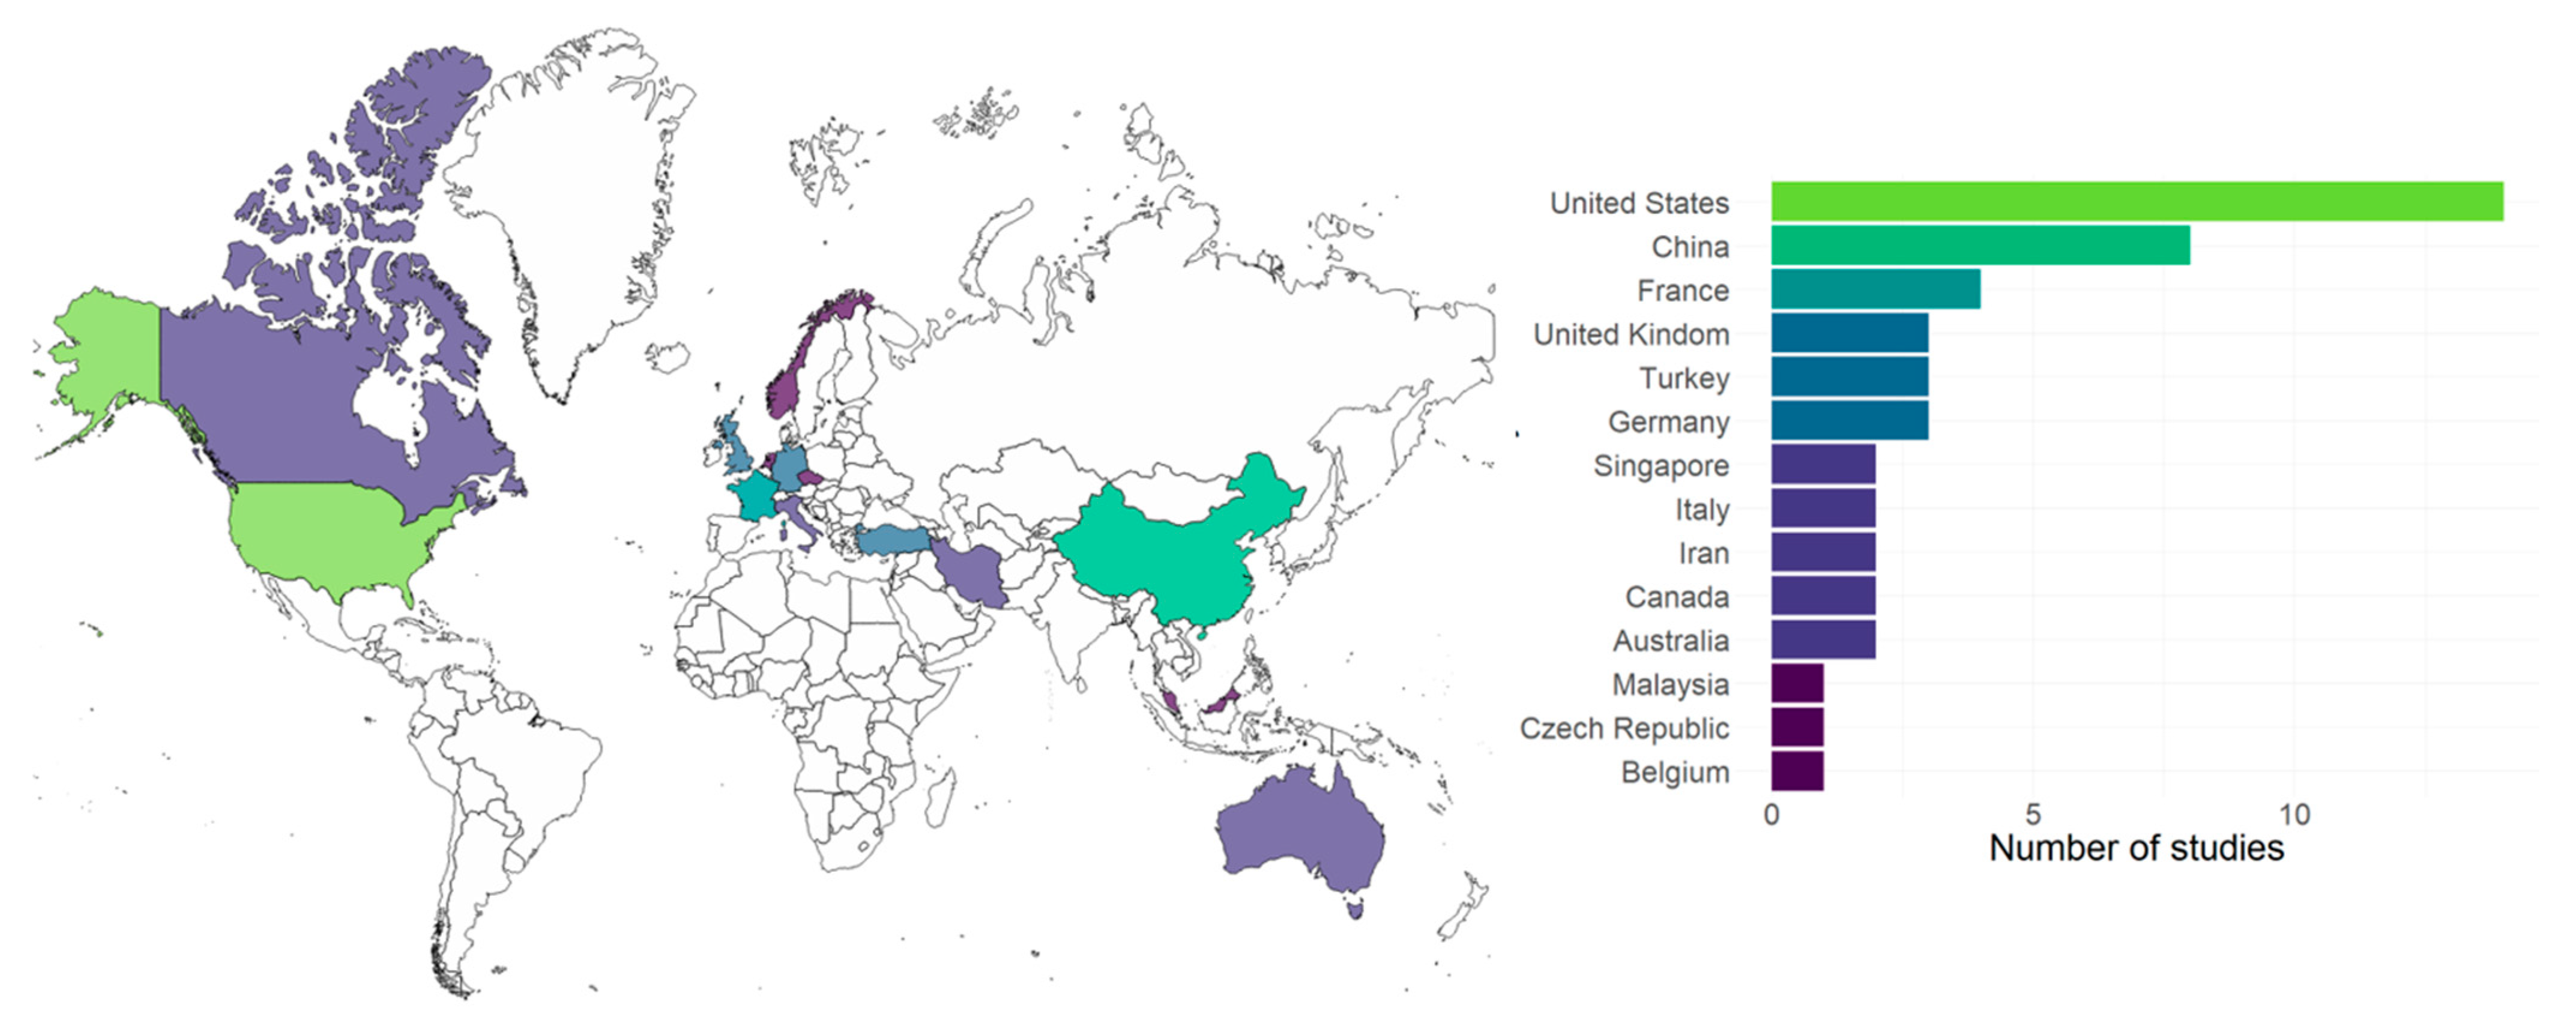
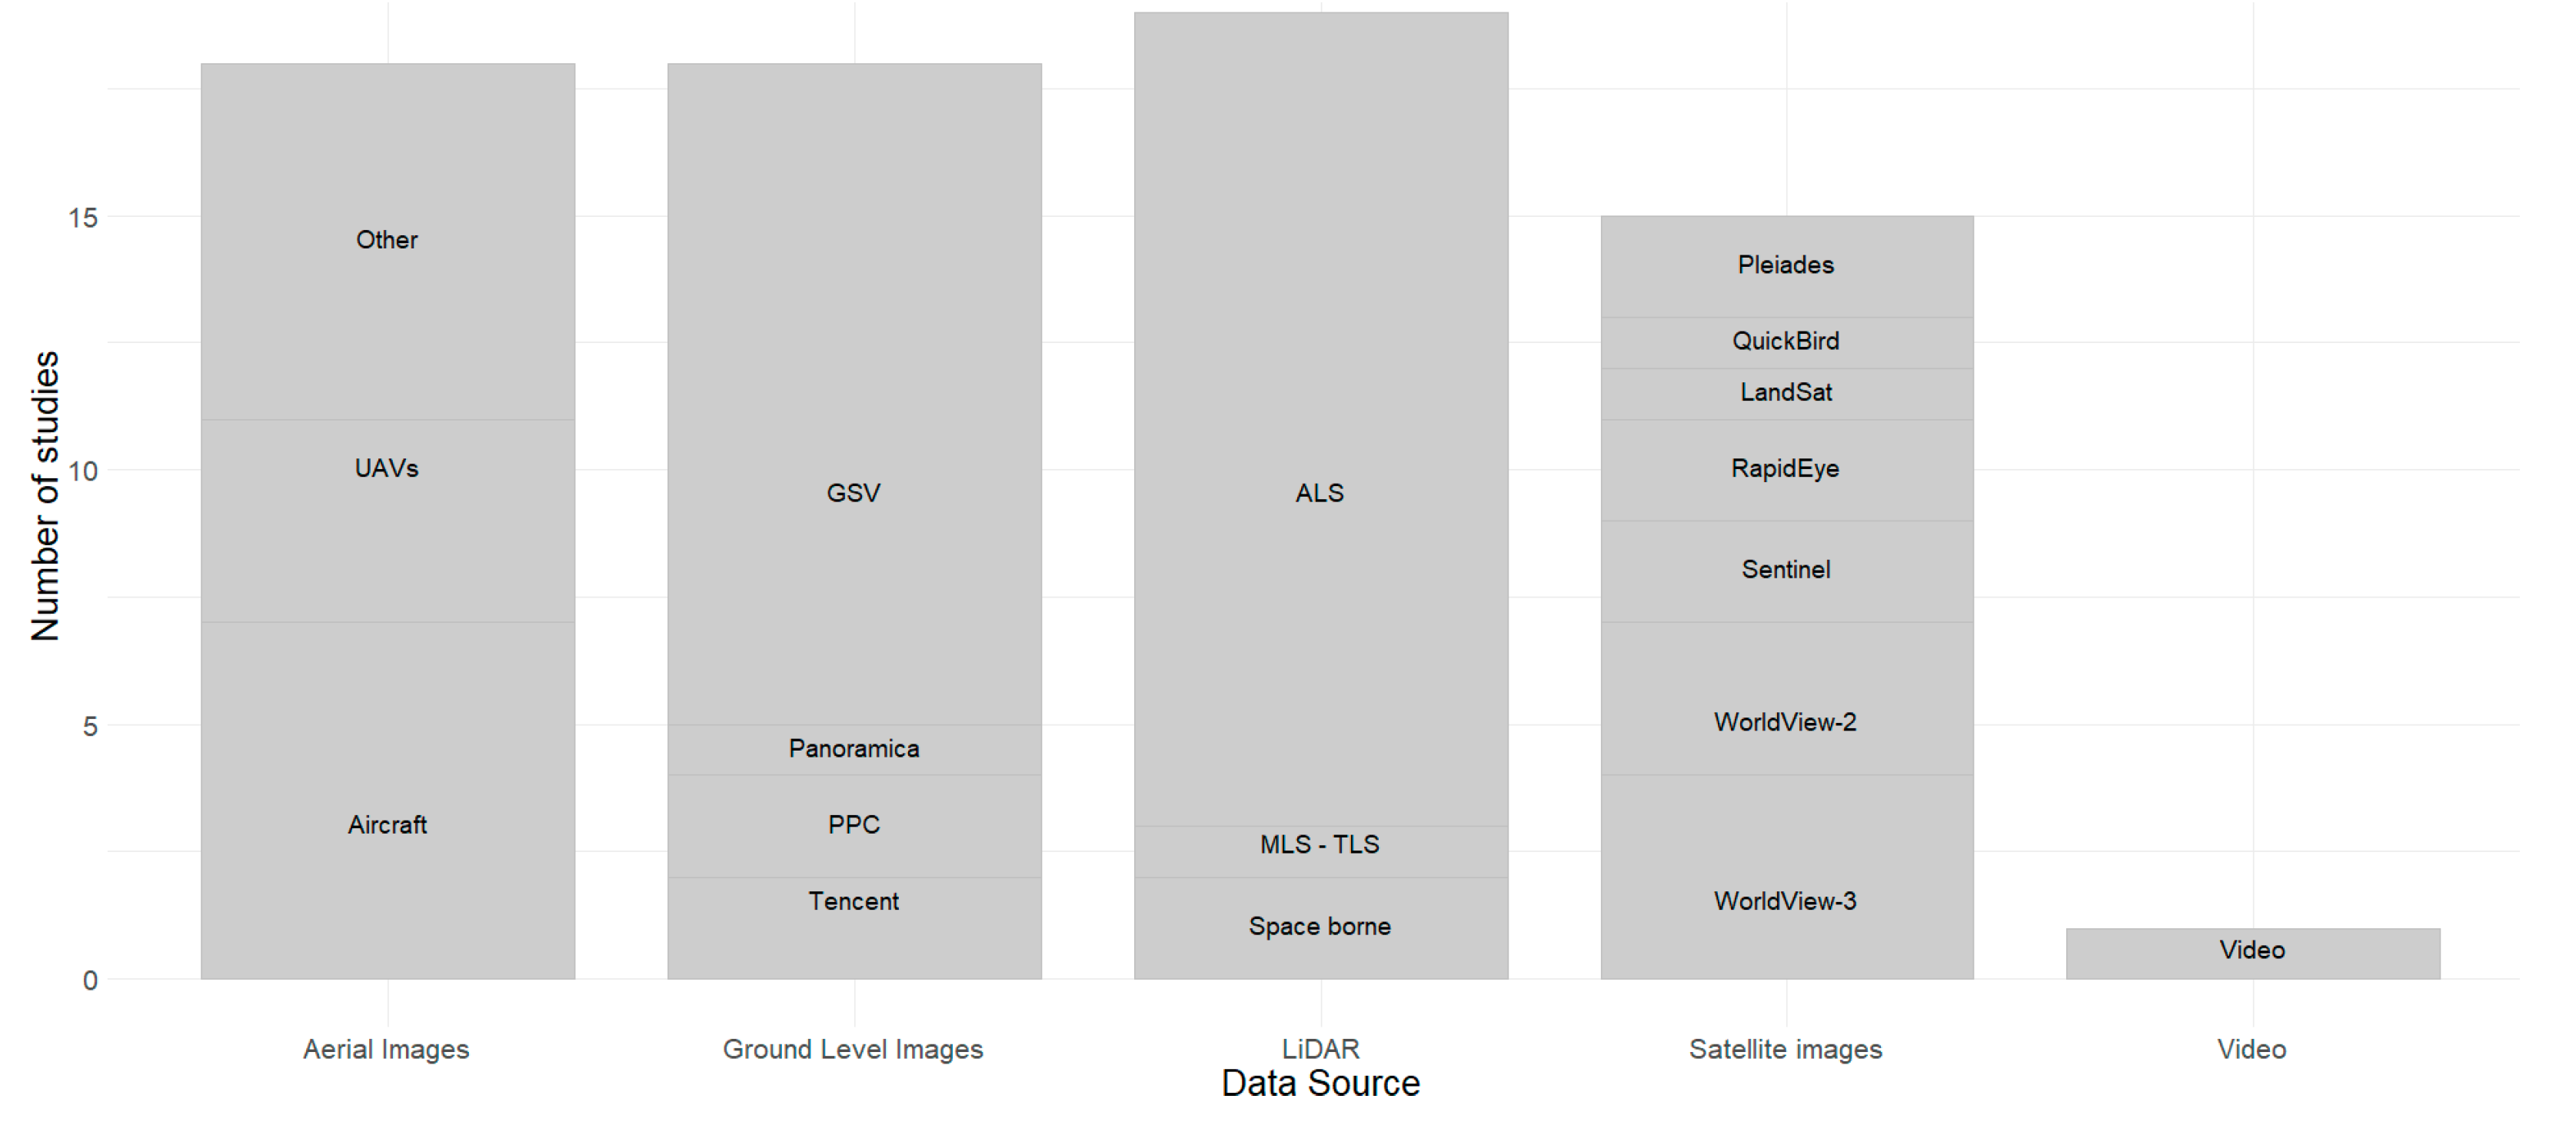
Table 1.
Search terms used to analyze the state-of-the-art on urban tree characterization in the last five years and the number of articles selected.
Table 1.
Search terms used to analyze the state-of-the-art on urban tree characterization in the last five years and the number of articles selected.
| Search Terms | WOS | Scopus |
|---|---|---|
| “Remote sensing” AND (“Urban Forest” OR “Urban tree”) AND “Machine Learning” OR “Artificial intelligence” | 3 | 20 |
| “Ecosystem services” AND (“Urban Forest” OR “Urban tree”) AND “Remote Sensing” | 15 | 35 |
| “Ecosystem services” AND (“Urban Forest” OR “Urban tree”) AND “Remote Sensing” AND “Tree characterization” | 7 | 6 |
| “Street tree” AND “Ecosystem service*” AND Ground-level* | 0 | 1 |
| “Remote sensing” AND (“Urban Forest” OR “Urban tree”) AND “Deep Learning” | 6 | 5 |
| (“Urban Forest” OR “Urban tree”) AND photogrammetry | 4 | 4 |
| (“Urban Forest” OR “Urban tree”) AND “Remote data” AND MaxEnt | 0 | 0 |
| (“Urban Forest” OR “Urban tree”) AND “Remote data” AND SDMtoolbox | 0 | 0 |
| (“Urban Forest” OR “Urban tree”) AND “Remote data” AND “Spatial modeling” | 0 | 0 |
| “Street tree” AND Ground-level* | 1 | 4 |
| Total | 32 | 71 |
Table 2.
Summary characteristics of LiDAR data used in the studies analyzed for the characterization of urban trees. ALS: airborne laser scanning. MLS: mobile laser scanning. TLS: terrestrial laser scanning; DEM: digital elevation model; DSM: digital surface model; sDSM: normalized digital surface model; NVA: non-vegetated vertical accuracy; CHM: canopy height model; G-LiHT: Goddard’s LiDAR, hyperspectral, and thermal; NOAA: National Oceanic and Atmospheric Administration.
| Type | Metrics | Specifications | Pulse Density | Spatial Accuracy | References | |
|---|---|---|---|---|---|---|
| Horizontal | Vertical | |||||
| (m) | (m) | |||||
| ALS | DEM, DSM | - | 1/m2 | 0.15 | 0.3 | Timilsina et al., (2019) [39]. |
| Point cloud density. | GRSS | - | - | - | Wang et al., (2020) [73]. | |
| 7 structural metrics (tree height, width-to-height ratios, crown porosity) | RIEGL Q560 | 22/m2 | - | Alonzo et al., (2016) [21]. | ||
| DEM, tree cloud points | Wang et al., (2020) [73]. | |||||
| 2D and 3D distances between points | - | 12/m2 | 0.01 | 0.02 | Bayat et al., (2019) [41]. | |
| 32 statistical metrics (mean, median, density etc.) | (G-LiHT) | 6/m2 | - | - | Marrs and Ni-Meister (2019) [43]. | |
| DEM, DSM | - | 4/m2 | - | - | Azeez et al., (2019) [8]. | |
| DTM, DSM, intensity | - | 0.74/m2 | - | - | Hartling et al., (2019) [37]. | |
| Canopy Cover, CHM, 27 statistical metrics | UK Environment Agency | - | - | - | Baines et al., (2020) [74]. | |
| CHM | - | 12/m2 | 0.18 | 0.36 | Matasci et al., (2018) [75]. | |
| DEM, DSM, CHM | Trimble Harrier 68i | 8/m2 | - | - | Sun et al., (2019) [76]. | |
| NVA, nDSM, DSM, intensity | Sanborn Mapping Company | 2.2/m2 | - | - | Katz et al., (2020) [11]. | |
| CHM | Climate Future Mission/ Willington Mission | 1.5/m2–1/m2 | 0.25 | 0.15 | Timilsina et al., (2020) [38]. | |
| 140 ALS indices (height indices, intensity indices, point density indices, tree size and shape indices) | AeroData Surveys Nederland BV | 15/m2 | - | - | Chi et al., (2020) [70]. | |
| CHM, nDSM | Italian Ministry of the Environment | - | 0.3 | 0.15 | Barbierato et al., (2019) [77]. | |
| Space-borne | nDSM, CHM | NOAA Digital Coast | 0.15 | 0.5 | 0.15 | Li et al., (2017) [40], |
| DSM | Li and Ratti (2018) [66]. | |||||
| MLS(TLS)—ALS | Point cloud density. | Z + F IMAGER® 5010 /RIEGL LMS-Q680i | 1000/m2–40/m2 | - | - | Wu et al., (2018) [78]. |
Table 3.
Summary of the main characteristics (resolution, bands, and spectrum) of the satellites used for urban tree characterization in the reviewed articles; m: meter; nm: nanometer.
Table 3.
Summary of the main characteristics (resolution, bands, and spectrum) of the satellites used for urban tree characterization in the reviewed articles; m: meter; nm: nanometer.
| Satellite | Spatial Resolution (m) | Bands | Spectrum (nm) | References |
|---|---|---|---|---|
| QuickBird | 0.6 | 4 | 450–800 | Timilsina et al., (2020) [38]. |
| WorldView 2 (WV2) | 0.5–2.5 | 8 | 450–800 | Katz et al., (2020) [11], Hartling et al., (2019) [37], Sun et al., (2019) [76]. |
| WorldView 3 (WV3) | 0.31–2 | 9 | 450–1.040 | Hartling et al., (2019) [37], Vahidi et al., (2018) [86], He et al., (2020) [87], Choudhury et al., (2020) [88]. |
| RapidEye | 5 | 5 | 440–850 | Ozkan et al., (2016) [44]. |
| Pleiades | 0.5–2 | 5 | 470–944 | Louarn et al., (2107) [54]. |
| Landsat | 30 | 11 | 430–1.251 | Ozkan et al., (2016) [44], Gage and Cooper. (2017) [72] |
| Sentinel | 10 | 13 | 430–2.280 | Brabant et al., (2019) [49], Baines et al., (2020) [74]. |
Table 4.
Summary of the characteristics of the aerial images used in the studies analyzed for the characterization of urban trees. UAV: unmanned aerial vehicle; DMC: digital mapping camera; NAIP: the National Agriculture Imagery Program.
Table 4.
Summary of the characteristics of the aerial images used in the studies analyzed for the characterization of urban trees. UAV: unmanned aerial vehicle; DMC: digital mapping camera; NAIP: the National Agriculture Imagery Program.
| Type | Spatial Resolution (m) | Bands | Spectrum (nm) | References |
|---|---|---|---|---|
| Aircraft Intergraph/ZI DMC | 0.09 | 4 | 400–800 | Pibre et al., (2018) [58]. |
| Unspecified Airborne platform | 0.1 | 3 | 400–580 | Azeez et al., (2019) [8]. |
| Aircraft UltraCam Xp | 0.2 | 5 | 410–1000 | Barbierato et al., (2020) [77]. |
| Unspecified | 0.2 | 4 | 400–800 | Haas et al., (2020) [96]. |
| Aircraft UltraCam X | 0.3 | 4 | 410–1000 | Ozkan et al., (2019) [7]. |
| Aircraft G-LiHT | 1 | 114 | 418–918 | Marrs and Ni-Meister (2019) [43]. |
| Aircraft AVIRIS sensor | 3.17 | 224 | 364–2500 | Alonzo et al., (2016) [21]. |
| UAV HySpex HYPXIM | 2 8 | 192 | 410–960 960–2500 | Brabant et al., (2018) [49]. |
| Unspecified Airborne Sensors | - | 4 | 400–800 | Timilsina et al., (2019) [39]. |
| UAV HySpex | 0.4–0.8 | 160 | 400–1000 | Aval et al., (2018) [97]. |
| Aircraft Trimble Harrier 68i | 0.4–0.8 | 3 | 400–580 | Sun et al., (2019) [76]. |
| Nearmap | 0.7 | 3 | 400–580 | Katz et al., (2020) [11]. |
| Aircraft NAIP | 1 | 4 | 400–800 | Gage et al., (2017) [72]. |
| LandMap UK | - | 4 | 400–800 | Grafius et al., (2019) [42]. |
| Google Aerial Image | - | 3 | 400–580 | Wegner et al., (2016) [45]. |
| Unspecified | - | 3 | 400–580 | Lin et al., (2019) [98]. |
| UAV eBee | 0.064 | - | - | Birdal et al. [99]. |
| UAV | Minařík et al., (2020) [100]. | |||
| DJI Matrice 210 RTK | 0.06 | - | - | |
| MicaSense RedEdge-M | 0.1 | 4 | 475–840 |
Table 5.
Summary of distance points in ground-level imagery (GLI) used to characterize urban trees. DSLR: digital single-lens reflex; SLR: single-lens reflex; PPC: photogrammetry point cloud.
Table 5.
Summary of distance points in ground-level imagery (GLI) used to characterize urban trees. DSLR: digital single-lens reflex; SLR: single-lens reflex; PPC: photogrammetry point cloud.
| Source | GLI | Range Distance (m) | References |
|---|---|---|---|
| Google Street-view | Standard images | 10 | Stubbings et al., (2019) [15], Richards and Edwards (2017) [104]. |
| 15 | Wegner et al., (2016) [45], Seiferling et al., (2017) [47], Laumer et al., (2020) [105]. | ||
| 50 | Lu et al., (2018) [106], Ye et al., (2019) [107]. | ||
| Panoramic images | 20 | Li et al., (2018) [66]. | |
| 30 | Gong et al., (2018) [91]. | ||
| 100 | Li et al., (2018) [40]. | ||
| ND | Jiang et al., (2016) [46], Barbierato et al., (2020) [77], Wang et al., (2018) [108], Branson et al., (2018) [45]. | ||
| Tencent Street-view | Standard images | 20 | Dong et al., (2018) [109]. |
| 88 | Long and Lu (2017) [65]. | ||
| DSLR camera | PPC | 30 | Roberts et al. [102]. |
| SLR camera | PPC | static | Choudhury et al. [88]. |
Table 6.
DIP algorithm summary used to characterize urban trees; HSI: hue, saturation, and intensity, TM: template matching; GIS: geographic information system, SfM: structure from motion.
Table 6.
DIP algorithm summary used to characterize urban trees; HSI: hue, saturation, and intensity, TM: template matching; GIS: geographic information system, SfM: structure from motion.
| Digital Image Processing Algorithms | References |
|---|---|
| Neighbor weight | Seiferling et al., (2017) [47]. |
| Mean shift | Li et al., (2017) [40], Li y Ratti (2018) [66], Louarn et al., (2017) [54]. |
| HSI | Dong et al., (2018) [109], Richards and Edwards (2017) [104], Hong et al., (2019) [111], Chi et al., (2020) [70]. |
| Nearest neighbor | Choudhury et al. [88]. |
| K-nearest | Marrs and Ni-Meister (2019) [43], Minařík et al. [100]. |
| Spectral difference segmentation LBP | Azeez et al., (2019) [8]. |
| Compact watershed | Matasci et al., (2018) [75], Minařík et al. [100]. |
| Grey level co-occurrence matrix | Ozkan et al., (2016) [44], Azeez et al., (2019) [8], Choudhury et al. [88]. |
| Dalponte individual tree segmentation | Minařík et al. [100]. |
| Li2012 | Minařík et al. [100]. |
| TM | Vahidi et al., (2018) [86]. |
| 3D graph cuts algorithm | Wu et al., (2018) [78]. |
| Segmentation GIS | Bayat et al., (2019) [41], Jiang et al., (2017) [46], Long and Liu (2017) [65]. |
| SfM | Minařík et al. [100], Roberts et al. [102], Choudhury et al. [88], Birdal et al. [99]. |
Table 7.
Summary of machine learning (ML) algorithms. RF: random forest. SVM: support vector machine; CNN: convolutional neural network; HIS: hue, saturation, and intensity; SDS: spectral difference segmentation.
Table 7.
Summary of machine learning (ML) algorithms. RF: random forest. SVM: support vector machine; CNN: convolutional neural network; HIS: hue, saturation, and intensity; SDS: spectral difference segmentation.
| Algorithm | References | |
|---|---|---|
| RF | Only RF | Baines et al. [74], Haase et al. [36], Katz et al. [11]. |
| CNN | Stubbings et al., (2019) [15], Hartling et al., (2019) [37]. | |
| SVM | Hartling et al., (2019) [37], Brabant et al., (2019) [49], Louarn et al., (2017) [54]. | |
| HSI | Chi et al., (2020) [70]. | |
| Compact Watershed | Matasci et al., (2018) [75]. | |
| SVM | CNN | Ye et al., (2018) [107]. |
| SDS | Azeez et al., (2019) [8]. | |
Table 8.
Summary of the main deep learning architectures used to characterize urban trees. PSPNet: pyramid scene parsing network, ResNet: residual neural network, VGG: visual geometry group, YOLO: You Only Look Once, DCNN: deep convolutional neural network.
Table 8.
Summary of the main deep learning architectures used to characterize urban trees. PSPNet: pyramid scene parsing network, ResNet: residual neural network, VGG: visual geometry group, YOLO: You Only Look Once, DCNN: deep convolutional neural network.
| CNN Architecture | References |
|---|---|
| PSPNet | Stubbings et al., (2019) [15], Gong et al., (2018) [91]. |
| Faster R-CNN | Wegner et al., (2016) [45], Laumer et al., (2020) [105]. |
| ResNet | Sun et al., (2019) [76], Torii et al., (2019) [126]. |
| SegNet | Ye et al., (2019) [107]. |
| VGG16 | Branson et al., (2018) ) [45]. |
| YOLO | Lin et al., (2019) [98]. |
| DCNN | Hartling et al., (2019) [37], He et al., (2020) [87]. |
| PointNet | Wang et al., (2020) [73]. |
| Bayesian Network | Grafius et al., (2019) [42]. |
| Other | Timilsina et al., (2020) [38], Timilsina et al., (2019) [39], Pibre et al., (2018) [58], Haas et al., (2020) [96]. |
Publisher’s Note: MDPI stays neutral with regard to jurisdictional claims in published maps and institutional affiliations. |
© 2021 by the authors. Licensee MDPI, Basel, Switzerland. This article is an open access article distributed under the terms and conditions of the Creative Commons Attribution (CC BY) license (https://creativecommons.org/licenses/by/4.0/).
Share and Cite
MDPI and ACS Style
Velasquez-Camacho, L.; Cardil, A.; Mohan, M.; Etxegarai, M.; Anzaldi, G.; de-Miguel, S. Remotely Sensed Tree Characterization in Urban Areas: A Review. Remote Sens. 2021, 13, 4889. https://doi.org/10.3390/rs13234889
AMA Style
Velasquez-Camacho L, Cardil A, Mohan M, Etxegarai M, Anzaldi G, de-Miguel S. Remotely Sensed Tree Characterization in Urban Areas: A Review. Remote Sensing. 2021; 13(23):4889. https://doi.org/10.3390/rs13234889
Chicago/Turabian StyleVelasquez-Camacho, Luisa, Adrián Cardil, Midhun Mohan, Maddi Etxegarai, Gabriel Anzaldi, and Sergio de-Miguel. 2021. "Remotely Sensed Tree Characterization in Urban Areas: A Review" Remote Sensing 13, no. 23: 4889. https://doi.org/10.3390/rs13234889
Note that from the first issue of 2016, this journal uses article numbers instead of page numbers. See further details here.